Abstract
The stock market index future price forecasting is one of the imperative financial time series problems. Accurately estimated future closing prices can play important role in making trading decisions and investment plannings. This work proposes a new multi-output ensemble framework that integrates the hybrid systems generated through importance score based feature weighted learning models through a continuous multi-colony ant colony optimization technique (MACO-LD) for multi-day ahead index future price forecasting. Importance scores are obtained through four different importance score generation strategies (F-test, Relief, Random Forest, and Grey correlation). Multi-output variants of three baseline learning algorithms are brought in to address multi-day ahead forecasting. This study uses three learning algorithms namely multi-output least square support vector regression (MO-LSSVR), multi-output proximal support vector regression (MO-PSVR) and multi-output -twin support vector regression (MO--TSVR) as the baseline methods for the feature weighted hybrid models. For the purpose of forecasting the future price of an index, a comprehensive collection of technical indicators has been taken into consideration as the input features. The proposed study is tested over eight index futures to explore the forecasting performance of individual hybrid predictors obtained after incorporating importance scores over baseline methods. Finally, multi-colony ant colony optimization algorithm is employed to construct the ensemble results from the feature weighted hybrid models along with baseline algorithms. The experimental results for all the eight index futures established that the proposed ensemble of importance score based feature weighted models exhibits superior performance in index future price forecasting compared to the baseline methods and that of importance score based hybrid methods.
1. Introduction
The stock market is a convoluted sector due to the chaotic and non-linear nature of the stock price. Thus, the precise forecasting of future stock index prices is a stimulating yet demanding task. It is observed that many factors, both economic and non-economic factors, influence the behavior of a stock price [1,2]. Closing prices always appear to be an important measure in stock market decision-making. A better approximation of the closing price beforehand enables investors to make trading decisions. A number of statistical models (AR, ARMA, ARIMA) [3] have been introduced to solve this encounter. However, the evolution of machine learning techniques and their high generalization capabilities have been proven efficient in financial time series forecasting [4]. Artificial Neural Networks (ANNs) and Support Vector Machines (SVMs) have been widely used in financial market price forecasting problems.
Drucker et al. [5] developed Support Vector Machine for regression problem (SVR), which opened the gateway for future research perspectives in time series forecasting using SVM networks. Early research shows the efficient application of SVR in financial time series forecasting. Tay et al. [6] first examined the possibility of using SVR in financial forecasting. The experiments were performed over five future contracts which shows the efficiency of SVR over BPNN (Back Propagation Neural Networks) in financial time series forecasting. Kim [7] uses SVR in index price forecasting and shows SVR as a possible alternative in index price forecasting. Pai et al. [8] developed a hybrid structure that assimilates the linear prediction power of ARIMA with the non-linear forecasting merits of SVR in stock price forecasting. The presented work displayed improvement in the forecasting performance after the use of hybrid techniques.
The evolution of Deep Neural Networks stimulated the research on the application of DNNs in financial time series forecasting [9]. Recent studies have witnessed vast productive developments in the stock market price forecasting using Neural Networks. Tsang et al. [10] implemented a back-propagation neural network version (NN5) for stock market price forecasting. The proposed method experimented on Hong Kong Stock and HSBC holdings, which suggested improvement over earlier works. Yu et al. [11] proposed a meta learning approach to produce a nonlinear meta-learning model based on neural networks for financial time series forecasting. This meta modeling approach first generates different base models over feed forward neural networks for different input sets produced from different initial setups and later integrates these base models to get the final meta model. An integration proposal for combining Genetic fuzzy systems with self organizing ANN was proposed by [12]. The proposed approach uses step-wise regression to select the influencing input features for the stock price. Later, it used self organizing ANN to create clusters from the stock historical data. Furthermore, the clusters used as genetic fuzzy system feeds to generate future stock price. A hybrid stock price forecasting model using deep learning algorithms is presented in [13]. The model uses CEEMD, SE, ICA, PSO, and LSTM to simplify data and boost statistical efficiency. The model is tested on four Chinese stock prices and found it accurate and robust. The proposed work integrate granular computing with decomposition and ensemble to build non-stationary data forecasting models. By integrating BPNN with ensemble empirical mode decomposition (EEMD), a new hybrid model is constructed in [14], improving prediction accuracy and robustness. The new hybrid model outperforms the existing EEMD-LSTM model in international gold price series forecasting. A detailed literature review for financial time series forecasting using Deep NNs is found in [9]. The article explores over a period of 15 years from 2005 to 2019 to investigate the applications of DNNs in Financial time series forecasting. Ray et al. [15] presents a hybrid algorithm for forecasting multiple correlated time-series data using a multivariate Bayesian structural time series approach and an M-TCN. The algorithm accurately predicts stock price movements, COVID-19 pre-lockdown data from Nifty stock sectoral indices, and newspaper and social media sentiment. The hybrid model predicts pandemic stock market trends better than benchmark models.
Traditional methods have limitations toward nonlinear high fluctuations in financial price data. Conventional forecasting models, including Autoregressive Integrated Moving Average (ARIMA) and Support Vector Regression (SVR), are proficient for short-term predictions but frequently encounter difficulties with long-term dependencies and nonlinear patterns. Therefore, Zhipeng et al. [16] use candlestick patterns to implement a noise removal process on financial data. Later, a Cooperative Co-evolution infused SVR was used to predict financial time series. Gupta et al. [17] proposed a Twin-SVR based approach for forecasting financial time series to deal with non-stationary noisy data. Lahmir [18] presented a hybrid approach, VMD-PSO-BPNN, for intraday stock price forecasting. Proposed approach first uses Variational Mode Decomposition to generate different variation modes of the price data for input features and later uses Back Propagation Neural Network as predictive learning system with the Particle Swarm Optimization technique is used for initial initial weights optimization of BPNN.
Traditional approaches are based on the assumption that all the features have equal contributions toward the target variable. Nevertheless, the assumption is not always sufficient in the practical world, and individual features have their own importance toward the output variables. Thus, the performance of a learning technique can be improved by assigning different weights to the input features. For instance, Wang et al. [19] showed that the generalization capability and performance of SVM can be improved by assigning different weights to different input features. Following this study, Zhang et al. [20] used rough set theory based information gain to determine the feature weights of a SVM classifier. Liu et al. [21] investigated the application of Grey correlation based feature weighted SVR model for stock price forecasting. The proposed hybrid feature weighted SVR method and the baseline SVR were tested over the stock data from China and the experiments indicated improvements in forecasting performance after incorporating weighted features with support vector regression. Yu et al. [22] presents an LSSVR ensemble learning framework for predicting crude oil prices, taking into account user-defined parameters as uncertain variables. The methodology employs a grid technique for estimating a low upper bound, generates stochastic parameters, and integrates the outcomes.
A review of the literature suggests that it is not possible to develop an individual standalone model that can be appropriate for every stock market. Earlier research less explores the possibility of multi-day ahead forecasting. An alternative proposal is to use diverse techniques as individual forecasting models. Recent works have focused on hybrid combined ensemble models in time series forecasting. The ensemble models make use of the merits of all individual forecasting results to produce one improved ensemble result [23,24,25]. The motivation behind all ensemble models is to consider all the individual models as independent contributors and to intelligently integrate the responses to produce ensemble forecast results. Traditional ensemble models, such as bagging and boosting, apply static weights to base learners, optimizing for a single-step forecast [26]. These methods often struggle with multi-day forecasting, where error propagation is significant. Ensemble learning frameworks address single-output forecasting, where models predict only the next day’s price. For multi-day forecasts, recursive strategies are used, leading to cumulative error. Recursive forecasting, where single-step predictions are iteratively used to predict multi-day ahead prices, introduces cumulative errors [27]. These errors compound over time, reducing accuracy for multi day ahead forecasting. Multi-output forecasting, which predicts multiple future points simultaneously, remains under-explored in ensemble architectures. Although metaheuristic algorithms like Particle Swarm Optimization (PSO) and Genetic Algorithms (GA) have been utilized for hyperparameter tuning [28], their application in dynamic weight optimization for ensemble learning is still constrained. Although Ant Colony Optimization (ACO) has demonstrated promise in combinatorial optimization and path-finding tasks, it is underutilized in financial forecasting.
Inspired from the previous works, this study proposes a new ensemble framework that integrates the importance scores with learning algorithms through a Multi-colony Ant Colony Optimization techniques. This ensemble approach incorporates different importance score generation strategies to determine the importance of an input feature and later uses it to build new feature weighted input spaces. Afterward, it uses three multi-output improved variants of Support Vector Regression as baseline learning algorithms. The three baseline algorithms incorporated in this work (i.e., MO-LSSVR, MO-PSVR and MO--TSVR) have computational advantages over SVR, and earlier research shows improvement in performance toward price forecasting problems [29,30,31,32]. In the final stage, a multi-colony variant of ACO-LD (MACO-LD) [33] is used to combine the hybrid models generated by integrating importance score based weighted features with baseline methods to construct the final multi-output ensemble model. The proposed framework dynamically adjusts the contributions of base learners for each forecast horizon. This ensures that model weights are optimized based on real-time performance, enhancing adaptability to market conditions. The multi-output framework generates multi-day ahead future values in a single pass, thus minimizes error propagation, a critical issue in recursive forecasting. This increases the accuracy of multi-day ahead predictions without relying heavily on iterative processes. The exploration-exploitation mechanism of ACO dynamically fine-tunes ensemble weights, preventing local optima and ensuring that the ensemble evolves with changing market dynamics. This metaheuristic-driven optimization differentiates the framework from traditional ensemble learning methods that rely on static weight assignments.
The main contributions of this proposed study are summarized as follows:
- This work proposes a new importance score based feature weighted ensemble model for index future price forecasting. The merits of Importance scores, multi-output baseline algorithms, and the intelligent multi colony ACO-LD [33] technique are integrated for index future price forecasting. This method suggests an ensemble alternative for price forecasting problems in an efficient way.
- Four different types of importance score generation methods (F-test, Relief, Random Forest, and Grey Correlation) are incorporated to generate new feature weighted input feature spaces.
- Three baseline algorithms (LSSVR, PSVR and -TSVR) are integrated with the new input spaces to generate twelve hybrid feature weighted models. Multi-output versions of the baseline learning algorithms are introduced to address multi-day ahead index price forecasting problem.
- To construct the ensemble model from the hybrid feature weighted models, a multi colony version of ACO-LD optimization technique is introduced to aggregate the hybrid models.
- To illustrate the performance characteristics, experiments have been performed over eight historical index futures price datasets and the input features for forecasting the future price of an index have been chosen from a vast array of technical indicators.
- A detailed discussion is performed for both, on improvements of baseline algorithms after integrating importance scores and the comparison of individual forecasting results with the ensemble forecasting results.
The remainder of the paper is organized as follows. Section 2 briefly reviews the related studies. Different feature importance score generation strategies are introduced in Section 3.1. The baseline forecasting algorithms are explained in Section 3.2 and the complete architecture of the proposed ensemble technique is described in Section 4. Section 4.1 gives details about the input feature space and Section 4.2 describes hybrid models, and finally, Section 4.4 explains the construction of proposed ensemble model. Section 5 comprises the experiments over the index future and the detailed discussion for both hybrid feature weighted models and the ensemble model. Finally, the conclusions from the empirical findings are presented in Section 6.
2. Related Works
Recent works demonstrate the prodigious application of models based on support vector machines in financial time series forecasting. Ince et al. [34] used heuristic models of principal component analysis (PCA) and non-parametric hybrid models with SVR for stock price prediction [35]. The presented works use factor analysis and kernel principal components to find the most important input features. Lu et al. [36] propose a two-stage approach for financial forecasting. They first use independent component analysis to deal with high noise in a financial time series and then use support vector regression in forecasting future prices. Hsu et al. [37] introduced a two-stage hybrid design by using a self-organizing map to decompose the input space with a similar statistical distribution and then using SVR in the later stage in forecasting index prices. A multi-kernel learning based hybrid approach is introduced in [38] for price forecasting. It uses semi-definite programming to derive kernel parameters and Lagrange multipliers simultaneously. Kazem et al. [39] proposed a different forecasting model incorporating the firefly algorithm with SVR and chaotic mapping to forecast the stock market prices. The proposed three staged algorithm first reconstructs phase space dynamics of input space, then it uses the firefly algorithm to tune SVR hyper-parameters and later it uses the optimal SVR model in the prediction of the stock market price. A hybrid -SVR model is introduced for stock index price forecasting in [40]. The proposed approach uses PCA for input feature selection, and the Brain-Storm Optimization technique is used to select the optimal parameters of -SVR. Pai et al. [30] incorporate LSSVR for stock market price forecasting with different causality scenarios, where historical trading data and social media influences are taken as input features, and correlation is used for feature pruning to obtain independent variables.
Hybrid learning methods incorporating heuristic optimization techniques with Support Vector Machine are being introduced by researchers to increase the performance of price forecasting techniques. Rustam et al. [41] investigated the application of SVR and particle swarm optimization together in forecasting stock prices with several technical indicators as input. PSO is used to select appropriate inputs, and later, SVR is used as the prediction model. Zhang et al. [28] proposed a modified Firefly algorithm to increase the convergence speed. The later stage of the proposed work uses this modified FA with SVR as a hybrid structure for stock price forecasting, where the modified FA is used for the optimal selection of parameters for SVR. Recent works indicate that hybrid combined models are proven to be effective and also improve the forecasting performance of single baseline models. Kumar et al. [31] proposed a hybrid system for market trend forecasting. The proposed method uses different importance scores to build hybrid classification models. The performance comparison implied the superiority of hybrid models over baseline methods. Meng et al. [42] introduced a continuous ACO based ensemble approach with SVR for forecasting the price in cloud manufacturing. The efficacy of the methodology is validated using real-world data in the proposed contribution. Significant generalization performance and dependable outcomes in ensemble learning randomness are achieved by the proposed method, as demonstrated by the experimental outcomes. Chen et al. [13] presents a hybrid model for stock price forecasting using machine learning algorithms, including decomposition and ensemble, independent component analysis, particle swarm optimization, and long short-term memory. The model’s accuracy and robustness were tested on four stock prices from the China stock market. Wang et al. [40] introduces a hybrid v-SVR model for forecasting stock price indexes that incorporates principal component analysis and brain storm optimization. The model, which uses correlation analysis and PCA, accurately approximates the actual CSI300 stock price index. Xu et al. [43] explores stock closing price forecasting using clustering and ensemble learning. K-means clustering and SVR based ensemble model is proposed. The proposed hybrid prediction model obtains the best predicting accuracy of the stock price.
A brief description of supporting studies that built the motivation for the proposed work is summarized in Table 1. These findings validate that ensemble methods, which integrate multiple baseline methods, can produce more precise predictions in comparison to individual methods. The findings indicate that utilizing a diverse ensemble is an appropriate method for forecasting the movement of stock prices in the banking industry of South Africa.

Table 1.
Related works.
3. Methodology
3.1. Feature Importance Score Generation Strategy
A classical regression learning problem assumes that all the input features have equal contribution toward response variables. In practice, this is not always followed in real scenarios. Thus the performance of learning methods can be upgraded by weighting the input features according to their importance toward predicting the target variables. In this section, various importance score generation methods presented in this study for forecasting stock index prices are briefly described.
3.1.1. F-Test
One of the simplest means to decide the importance scores of input features is by observing their statistical significance toward the target variables. This can be performed by ANOVA F-statistics or the F-test, where the F-test investigates the null hypothesis that the target values and corresponding values of an input feature are taken from sample populations having the same mean versus the alternative hypothesis is that the sample population means are different. The p-values of the test statistics represent the importance of the corresponding input feature. That is, a small p-value implies that the corresponding feature has important contributions. Thus, the importance scores for input feature can be calculated as
3.1.2. Relief Algorithm
Robnik-Sikonja et al. [46] proposed an extension of the ReliefF algorithm [47] for regression. The ReliefF algorithm uses a nearest neighbor algorithm to determine important scores of input features in a classification problem based on proximal class for input samples. In regression ReliefF, proximity is considered according to the comparative distance among forecasted values of two input samples. The importance score for input feature is described as
where , and are intermediate weights that define the probability of the prediction values being different. for different predictions y, for different input featured and different targeted y and different input featured respectively. m is the number of iterations. Intermediate weights at j-th iteration are calculated as
where is the difference in target y for two features and and is the distance between and [46].
3.1.3. Random Forest
Random Forest [48] is a widely used learning technique for regression and classification problems. Random Forest constructs decision trees with bootstrapped training-data from a subset of selected input features. The present work uses Random Forest to obtain the importance scores by following the procedure described in [31]. In this work, two-thirds of bootstrapped samples are used for the training of decision trees, and the rest of the samples (called as Out-of-a-Bag(OOB)) then utilized for determining feature importance scores. First, all the decision trees are trained and then tested using respective OOB samples, and the corresponding error rate is obtained. Then, OOB samples are generated through random permutation of features for each decision tree, and the error rates for perturbed OOB samples error rate are recorded for each tree . Then the importance score for input feature is calculated as
3.1.4. Grey Correlation
Grey system theory [49] was first introduced by Julong Deng in 1982. An integral part of Grey system theory is Grey correlation analysis, which describes the information carried by an input feature toward the target variable. In practical applications, an input feature carries partial information that contributes to generating target variables. Grey correlation thus focuses on those partial information and determines the relational degree between the target y and feature through the similarity in their geometric shapes. A higher Grey Correlation Degree indicates the high similarity of the corresponding feature, thus implying more importance of that feature. In this proposed work, the Grey Correlation Degree of an input feature is considered the importance score of the corresponding feature. Let be the input feature space, be target variables and be an input feature. Then, the importance score through Grey correlation for input feature is computed as
where the importance score is actually the Grey correlation degree of . is the relation coefficient that can be calculated as
where and and are the minimal and maximal difference values, respectively.
3.1.5. Importance Scores Based Feature Weights Generation
In this section, the importance scores obtained from Section 3.1 are used to determine the corresponding feature weight matrices. In general, to obtain the weight matrix, first, let , where I is any one from () and is the corresponding feature importance score of feature . Then, we first normalize the importance score set I, . The weight matrix is constructed as a diagonal matrix, where are the corresponding diagonal elements . The feature weighted new input feature is constructed as
3.2. Learning Algorithms
3.2.1. Multi-Output Least Square Support Vector Regression
Suykens et al. [50] proposed Least Squares Support Vector Regression (LSSVR) that uses equality constraint in place of inequality constraints of the Support Vector Regression. Thus, the complexity is reduced by solving a linear system of equations.
MO-LSSVR is an extension of the standard LSSVR designed to handle multiple output variables , by solving a series of optimization problems, one for each output dimension as follows,
subject to the constraints for each training example i and each output dimension j:
Using Karush-Kuhn-Tucker (KKT) condition, training and testing process of MO-LSSVR is made possible by solving the dual in the form of a system of linear equations. The complete process is described in Algorithm 1.
| Algorithm 1 Multi-output Least Square Support Vector Regression (MO-LSSVR) |
|
3.2.2. Multi-Output Proximal Support Vector Regression
Similar to LSSVR, Fung et al. [51] proposed Proximal Support Vector Regression (PSVR). The term in the objective function of LSSVR Section 3.2.1 is later replaced with . This addition of bias makes the above optimization problem a strong convex problem, and PSVR can be interpreted as regularized LSSVR.
PSVR can be extended to Multi-output PSVR to manage multiple target responses . The optimization problem for PSVR can be modified to deal with multi-output case as follows,
Using the Karush-Kuhn-Tucker (KKT) condition in (8), solving the dual problem is also equivalent to finding the solution of the linear systems. The complete process can be realized using Algorithm 2.
| Algorithm 2 Multi-Output Proximal Support Vector Regression (MO-PSVR) |
|
3.2.3. Multi-Output -Twin Support Vector Regression
Different from LSSVR and PSVR, Shao et al. [52] introduced a twin SVM method, i.e., -Twin Support Vector Regression (-TSVR). Unlike LSSVR, -TSVR uses two pair -insensitive decision functions [53].
Multi-Output Epsilon Twin SVR (MO--TSVR) can be achieved from -TSVR through the following modification of the optimization problem,
Algorithm 3 describes the solution process of MO--TSVR by solving dual problem using system of linear equations using matrix operations, emphasizing the kernel methods’ role in simplifying the problem.
| Algorithm 3 Multi-Output Twin Support Vector Regression (MO--TSVR) |
|
3.3. Multi-Colony Ant Colony Optimization
Ant Colony Optimization (ACO) is a well-known metaheuristic that is employed to solve combinatorial optimization problems. It is inspired by the foraging behavior of ants. Traditional ACO is typically employed to address single-objective problems; however, numerous real-world problems involve multiple objectives. In order to resolve this issue, a multi-colony ACO approach is suggested for this work. This approach capitalizes on the strengths of multiple ant colonies, each of which has distinct objectives, and periodically exchanges information to identify high-quality solutions that balance the different objectives. To enhance the interaction scheme among the ants, the ACO-LD algorithm is incorporated, which uses a Laplace distribution-based interaction scheme as described by [33]. In the Multi-colony ACO (MACO-LD), multiple colonies are initialized, where each colony optimizes a different objective function. The overall process can be summarized in Algorithm 4.
| Algorithm 4 Multi-colony ACO with laplace distribution (MACO-LD) |
|
The parameter C determines the number of ant colonies participating in the optimization process. Higher C increases solution diversity by enabling parallel searches across multiple objectives. Number of colonies can increase computational cost but improve multi-objective coverage. is the number of ants operating within each colony during an iteration. Higher allows for more extensive exploration of the solution space, improving solution quality. Pheromone Evaporation Rate () ranges between 0 and 1, that controls the rate at which pheromone trails decay over time. The parameter (influence of pheromone) controls how much the existing pheromone levels influence the path selection process and the parameter (influence of heuristic) controls how much heuristic information affects the path selection. The scaling parameter is scaling factor used in the Laplace distribution-based pheromone update scheme (ACO-LD). b is the diversity parameter of ACO-LD that controls the width of the Laplace distribution in the pheromone update process. Parameters and directly control the balance between exploration and exploitation. The diversity parameter b prevents the ACO-LD in converging to a local optima.
The proposed Multi-colony ACO-LD (MACO-LD) approach offers several advantages over ACO. Each colony operates in parallel, allowing simultaneous exploration of different regions in the solution space. Periodic information exchange between colonies helps in leveraging the strengths of different colonies, improving convergence rates. Each colony focuses on a specific objective, ensuring a balanced approach to multi-objective optimization.
4. Proposed Forecasting Model
In this section, the research design is explained in detail. The overall architecture of the proposed forecasting model is shown in Figure 1. The presented forecasting model can be realized in four stages, which are explained in Section 4.1–Section 4.4.
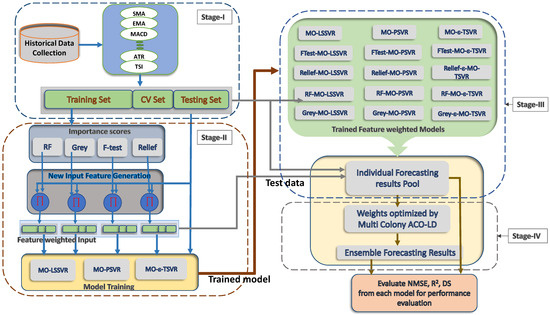
Figure 1.
Overall architecture of the proposed ensemble strategy.
4.1. Stage-I: Data Preprocessing and Input Features
The first important step, in developing the forecasting model, is to determine the input features. Historical closing prices of index futures along with technical indicators and oscillators are traditionally considered by researchers in index future closing price forecasting [54,55]. Basic descriptive statistics for all the dataset are presented in Table 2. A large collection of technical indicators and oscillators are introduced as input features. Along with OLHC (Open, Low, High, Close) historical prices, other technical indicators and oscillators considered in this work are listed in Table 3. A detailed explanation and formulation of the indicators and oscillators used in this work may be found in [7,54,56].
Table 2.
Basic descriptive statistics of datasets.
Table 3.
Indicators used as input features.
4.2. Stage-II: Construction of Feature Weighted Hybrid Models
In this work, the importance scores () obtained from Section 3.1 are used to determine the corresponding feature weight matrices, i.e., and . The corresponding feature weighted input feature sets are generated as and , respectively following Section 3.1.5. Thus, the importance score based feature weighted input sets are combined with the baseline forecasting methods Section 3.2 to construct hybrid models. Tweleve hybrid models are obtained and denoted by Ftest-MO-LSSVR, Relief-MO-LSSVR, RF-MO-LSSVR, Grey-MO-LSSVR, Ftest-MO-PSVR, Relief-MO-PSVR, RF-MO-PSVR, Grey-MO-PSVR, Ftest-MO--TSVR, Relief-MO--TSVR, RF-MO--TSVR and Grey-MO--TSVR.
4.3. Stage-III: Training and Individual Forecasting
The proposed system uses walk forward (sliding window) methodology [56,57] for the training and forecasting of hybrid models along with baseline algorithms. The input data set is first split into ten overlapping groups of training-testing set pairs. For importance score based feature weights generation and forecasting purposes, the first 1500 consecutive days are used as the training set, and the next 50 days of data are taken as the testing set. The next overlapping training set-testing set pair is obtained by sliding the data window to 50 days forward, and the initial 50 data points are discarded to maintain the training set-testing set size as same as the previous window. A similar structure is followed to obtain the corresponding 10 overlapping pairs. The trade-off between forecasting accuracy and generalization ability are taken into consideration to find the optimal regularization parameter .
4.4. Stage-IV: Ensemble Forecasting
The proposed study incorporates importance score generation strategies to generate different weighted input feature spaces. The new weighted feature is then integrated with baseline algorithms to make hybrid models. The proposed strategy then combines individual results to reach the required ensemble prediction results, which aims to use full advantage of the merits of the individual models to improve the ensemble predictive performance. At certain trading day , consider p individual forecast results of day t, as , then the ensemble forecast result can be generated by
where is the weight for the ith individual model. In general, the integration of individual forecasting results with equal weights is not suitable to obtain the desired output. Thus this paper employs a continuous Multi-colony Ant Colony Optimization algorithm (MACO-LD) to obtain the optimal allocated weights to combine the individual forecast outcomes. The procedure to predict the ensemble results from the individual forecasting results for each colony is described in Figure 2. The procedure integrates baseline and hybrid learners through Ant Colony Optimization (ACO-LD), which determines the optimal combination of model outputs by assigning dynamic weights to each learner. The iterative process described in in Figure 2 and in Algorithm 4 of MACO-LD ensures that the ensemble adapts over time, minimizing error and improving predictive performance. In this study, ACO-LD in Figure 2 uses the normalized mean square error () as the fitness function for the continuous series of actual and predicted closing prices, and it uses a probabilistic tour construction approach based on the Laplace distribution. Ants are deployed in a search space where each dimension corresponds to a model’s weight and initial weight configurations are randomly distributed. New ant tour selection and shifting is processed according to weight configurations with higher fitness and to avoid local optima, small percentage of ants explore new set of weights through Laplace Distribution. Iterative weight adjustments continue until convergence or the maximum iteration limit is reached. The ensemble prediction uses Equation (11) to forecast the final ensemble results. A detailed explanation of the ACO-LD approach is found in [33].
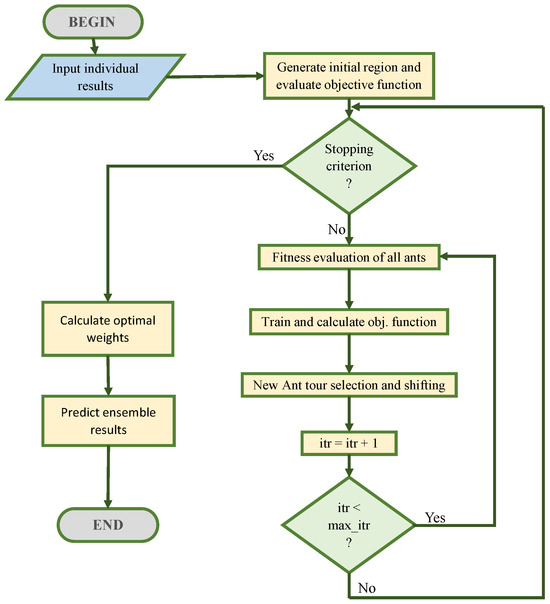
Figure 2.
Flowchart to get ensemble results from individual results for each colony.
5. Experiment & Discussion
To facilitate the comparative analysis of the proposed importance score based feature weighted hybrid ensemble model, three baseline algorithms (i.e., LSSVR, PSVR, -TSVR), and their hybrid models (see Section 4.2), are taken into consideration along with the proposed ensemble model. The inclusion of feature weighted hybrid methods is primarily to observe the effectiveness of importance scores based feature weighted models over baseline methods.
5.1. Data-Set Description
To demonstrate the effectiveness of the proposed ensemble model, eight index future historical price data have been considered for the experiment (viz: DJI, NASDAQ, NIFTY 50, SP500, Hangseng-HSI, RUSSELL-Chicago, TSEC-Taiwan, KOSPI). Daily price data for every index future (Open, Low, High, Close) have been imported over a time period of 10 years (January 2010 to December 2020) from yahoo-finance (https://finance.yahoo.com, accessed on 1 January 2021). To cover all possible market scenarios (Up Trend, Down Trend, and Sideways) and to observe the effectiveness of the proposed strategy in recent pandemic situations, the data sets have been imported carefully following the current timeline. Overall 2700 trading days of each index future data have been taken for the experiments. The missing values are replaced using mean imputation technique, where the mean of the four closest data points of the corresponding missing value is used for the imputation. The Augmented Dickey-Fuller (ADF) test [58] is used to determine whether a time series is stationary or not stationary. ADF p values in Table 2 explains the non-stationary nature of financial time series data. The Partial Autocorrelation (PACF) and first-order differenced closing price are presented in Figure 3. Where PACF represent the direct correlation between the series and its lag values, after removing the effects of other lags and the differenced closing price represents the day-to-day change in the closing price. That demonstrates long-term trends and volatility of financial time series data. The Input feature set Section 4.1 first constructed for each data-set then following the walk forward procedure described in Section 4.3 corresponding training-testing set pairs have been obtained from the imported data.
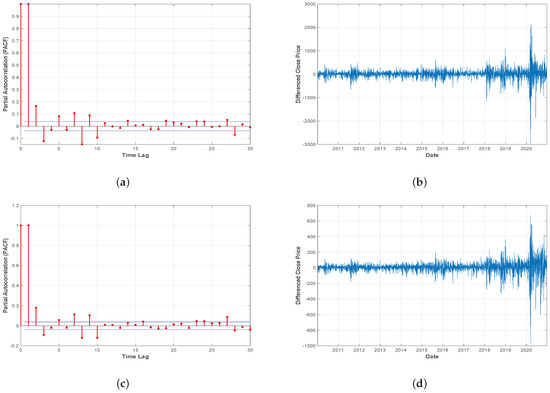
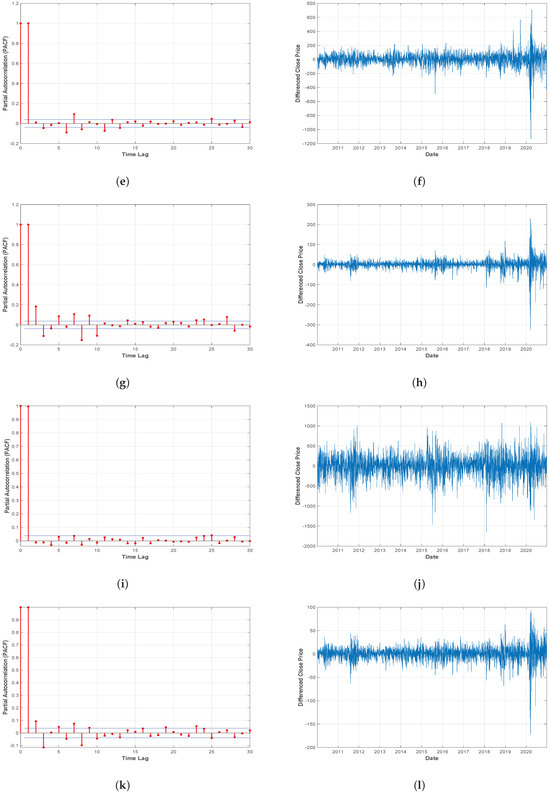
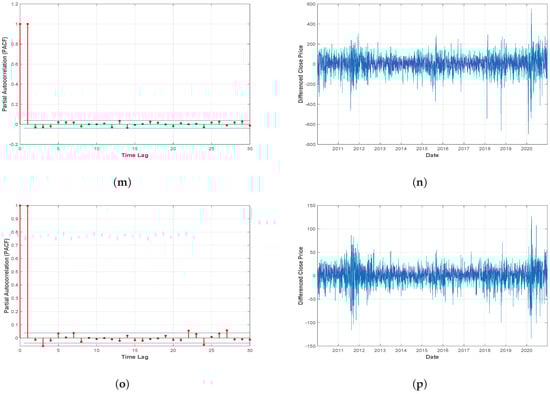
Figure 3.
(a). PACF and (b). Differenced closing price for Dow Jones Index. (c). PACF and (d). Differenced closing price for NASDAQ. (e). PACF and (f). Differenced closing price for NIFTY 50. (g). PACF and (h). Differenced closing price for SP500. (i). PACF and (j). Differenced closing price for HSI. (k). PACF and (l). Differenced closing price for RUSSELL. (m). PACF and (n). Differenced closing price for TSEC. (o). PACF and (p). Differenced closing price for KOSPI.
A multi-day ahead forecasting method is carried out to validate the performance of the proposed approach over multi-day ahead forecasting performance. In this work, a direct strategy [27] has been implemented for multi-day ahead forecasting. In this strategy, the target is to predict the next h day closing prices for the h-day ahead model with input of w days historical price and indicators. Where it assumes that the h-day ahead response solely depends on current input features. Thus, the learning algorithm treats each day as an independent model and training is performed accordingly for each target, i.e., the proposed approach builds h independent model for h day ahead forecasting but takes the same input feature set. The forecasting problem can be formulated as follows:
where are technical indicators at day t, and is the closing price of day i and is the independent model to be learnt for by the forecasting method in the training phase.
5.2. Performance Metrics
A number of statistical measures are considered to estimate the performance of the forecasting methods. In this study, three performance metrics are utilized to evaluate the performance as follows:
Normalized Mean Square Error (NMSE) measures the deviation between the predicted response and the actual response. A small NMSE value indicates the closeness of the predicted response with the actual value. It can be computed from true responses () and forecasted responses () as:
Coefficient of multiple determinations (), which determines the degree of variation of predicted response from the actual response. It measures the goodness of fit of the proposed model. An value near to 1 represents a better fit of the model to the response data. is defined as:
Directional Symmetry (DS), which describes the trend predicting capacity of the proposed model. That is, correctly predicted directions of the closing price in terms of percentage. Thus, it can be considered as accuracy of prediction and it is formulated as:
where for and 0 otherwise.
5.3. Discussion
As described earlier, the proposed ensemble technique first uses importance scores to determine weighted input features and later uses these input feature sets to generate hybrid models. Thereafter, it combines the individual forecasting responses to obtain the ensemble response. Figure 4 shows the assigned weight values for different input features concerning different importance scores obtained from the F-test, Relief, RF, and Grey correlation respectively. The significant difference in weight values in Figure 4 implies the diverse computational structures of the methods (i.e., F-test, Relief, RF, and Grey) to determine importance scores. The forecasting performance of all the baseline algorithms (i.e., MO-LSSVR, MO-PSVR, MO--TSVR) along with their hybrid feature weighted models and the final ensemble model in terms of the three performance metrics (i.e., , , and ) are presented in Table 4, Table 5 and Table 6. Thus, the proposed study is assessed through two different set-ups. First, we considered the performance of the hybrid models obtained from baseline algorithms after incorporating importance scores with the baseline algorithms. In the second scenario, we investigate the superiority of the ensemble model over parent models. The proposed work also investigates the same set-up for multi-day ahead forecasting. Where all the experiments has been performed for 1-day, 3-day and 5-day ahead forecasting. The performance metrics results are produced in Table 4, Table 5 and Table 6, and the corresponding and changes can be verified from Figure 5. The multi-day ahead foresting of the closing price with actual price are presented in Figure 6, Figure 7, Figure 8, Figure 9, Figure 10, Figure 11, Figure 12 and Figure 13.
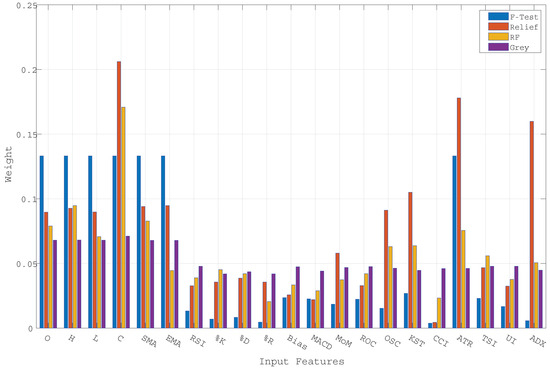
Figure 4.
Weights assigned to distinct input features, listed in Table 3, according to different importance scores obtained from the F-test, Relief, RF, and Grey correlation. The difference in weight values implies the distinct computational approach of the methods (i.e., F-test, Relief, RF, and Grey) to determine importance scores.
Table 4.
Performance metrics for 1-day ahead forecasting.
Table 5.
Performance metrics for 3-day ahead forecasting.
Table 6.
Performance metrics for 5-day ahead forecasting.
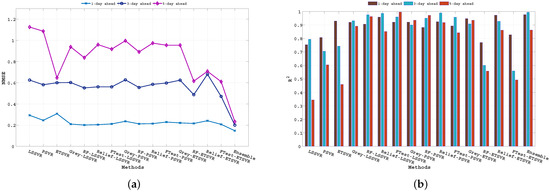
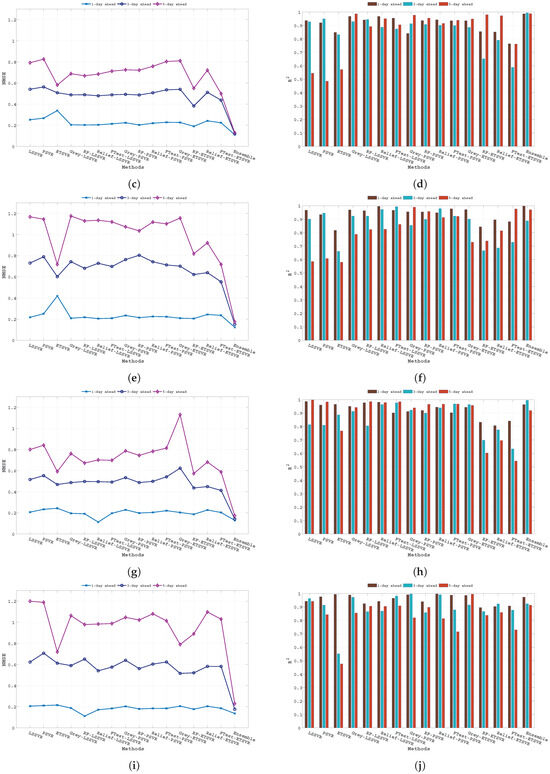
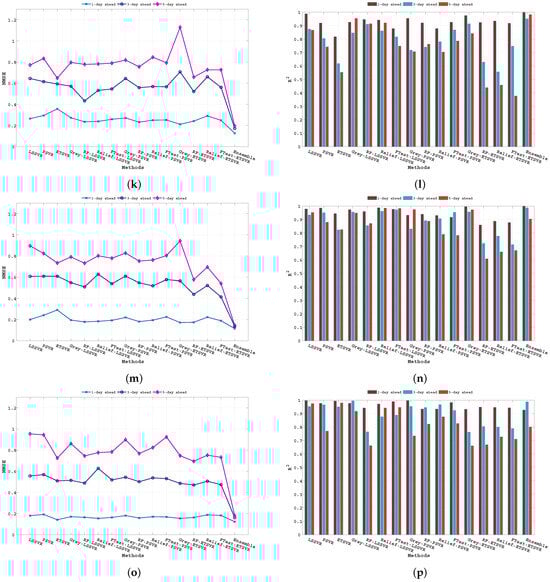
Figure 5.
(a). NMSE and (b). comparison of different baseline models along with hybrid models and the proposed ensemble model for DJI. (c). NMSE and (d). comparison of different baseline models along with hybrid models and the proposed ensemble model for NASDAQ. (e). NMSE and (f). comparison of different baseline models along with hybrid models and the proposed ensemble model for NIFTY 50. (g). NMSE and (h). comparison of different baseline models along with hybrid models and the proposed ensemble model for S&P 500. (i). NMSE and (j). comparison of different baseline models along with hybrid models and the proposed ensemble model for HSI. (k). NMSE and (l). comparison of different baseline models along with hybrid models and the proposed ensemble model for RUSSELL. (m). NMSE and (n). comparison of different baseline models along with hybrid models and the proposed ensemble model for TSEC. (o). NMSE and (p). comparison of different baseline models along with hybrid models and the proposed ensemble model for KOSPI.
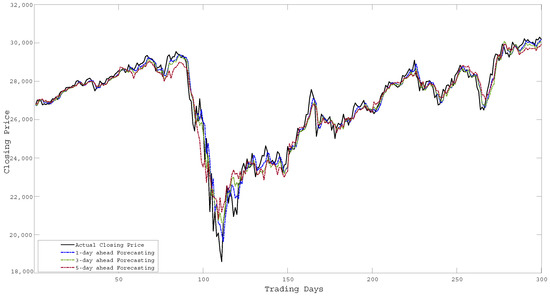
Figure 6.
Forecasting of Closing Price over 300 days for DJI.
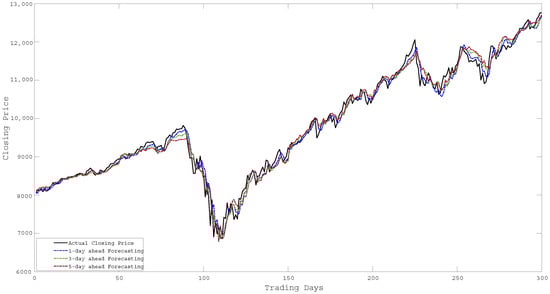
Figure 7.
Forecasting of Closing Price over 300 days for NASDAQ.
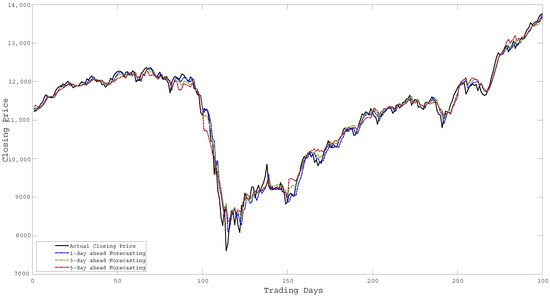
Figure 8.
Forecasting of Closing Price over 300 days for NIFTY 50.
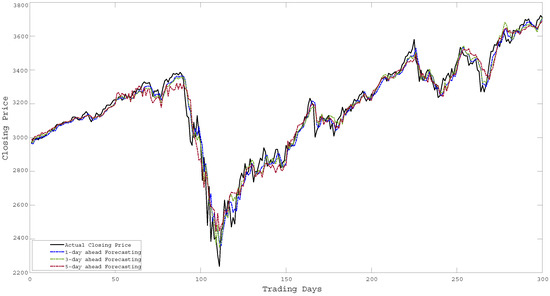
Figure 9.
Forecasting of Closing Price over 300 days for SP500.
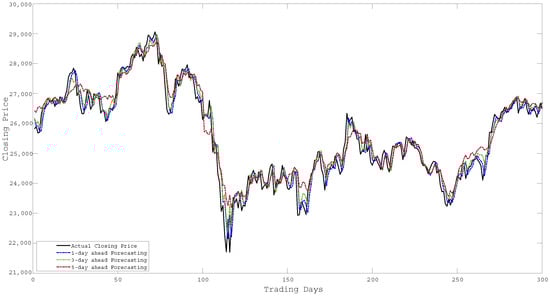
Figure 10.
Forecasting of Closing Price over 300 days for HSI.
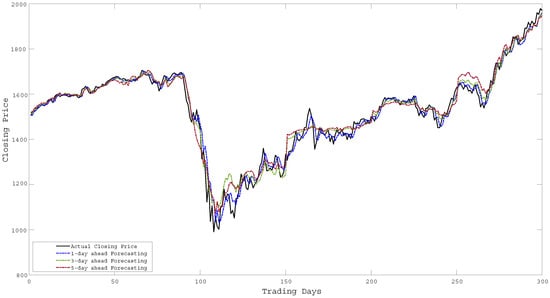
Figure 11.
Forecasting of Closing Price over 300 days for RUSSELL.
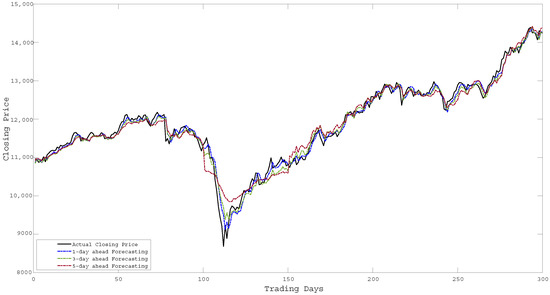
Figure 12.
Forecasting of Closing Price over 300 days for TSEC.
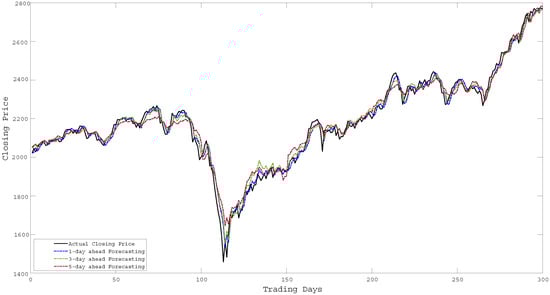
Figure 13.
Forecasting of Closing Price over 300 days for KOSPI.
Following the result metrics presented in Table 4, Table 5 and Table 6, it is suggested that the proposed ensemble model outperforms all the hybrid models along with baseline models in all performance metrics for all index futures. The results imply that the proposed importance score based feature weighted models ensemble through the MACO-LD strategy can enhance the forecasting accuracy. Further, the detailed discussion can proceed through two different criteria. Firstly, to verify the significance of importance score based hybrid methods over baseline methods and secondly, to observe the efficiency of ensemble forecasting results obtained by combining the individual forecasting results through ACO-LD.
5.3.1. Comparison of Individual Forecasting Results
The result metrics presented in Table 4, Table 5 and Table 6 demonstrate that the incorporation of importance scores based feature weighted models improves the forecasting accuracy of the baseline methods. For 1-day ahead forecasting of closing price (Table 4), it is observed that RF-MO--TSVR has better NMSE values for NASDAQ, NIFTY 50, and TSEC-TAIWAN, where RF-MO-LSSVR has lower NMSE for DJI and HSI. Furthermore, for S&P 500 and RUSSEL, the NMSE values are comparatively lower for Relief-MO-LSSVR and Grey-MO--TSVR, respectively. The 3-day ahead and 5-day ahead forecasting of closing price (Table 5 and Table 6) demonstrate that RF-MO--TSVR and Ftest-MO--TSVR have lower deviation between the actual closing price and forecasted price in terms of NMSE for most of the index futures, except HSI and RUSSEL where Grey-MO--TSVR and -TSVR have lower NMSE values respectively. The values presented in Table 4, Table 5 and Table 6 explain the goodness of fit of the forecast values of all the individual learning methods with actual values. The values imply that the importance scores based hybrid models have better than the baseline methods for most of the index futures. The hybrid model may be overfitting to the training data, capturing noise rather than the underlying trend in multi-day ahead forecasting. thus, the baseline algorithms are performing better in those data set. The results suggest that the Grey correlation based feature weighted hybrid models have better in most of the index futures in multi-day ahead foresting. Where Relief based feature weighted models show better values second after Grey correlation based method. Although there are few improvements observed in terms of DS after incorporating importance scores (i.e., NASDAQ, NIFTY 50, HSI, RUSSEL, KOSPI), still the improvements are not much higher, and in some cases, baseline algorithms are able to produce better DS percentages (i.e., DJI, SP500, and TSEC-Taiwan). In multi-day ahead forecasting, the DS results show that in most of the index futures, hybrid models perform better in terms of following the same direction as actual price movements. Table 4, Table 5 and Table 6 shows that there are improvements observed after incorporating feature weights obtained from proposed importance score determination strategies. Table 4, Table 5 and Table 6 imply that the importance scores contributed to better the forecasting performance of baseline algorithms. Importance score-based feature-weighted hybrid models outperform baseline algorithms by leveraging the strengths of dynamically assigning greater influence to features that contribute more significantly to prediction accuracy.
5.3.2. Comparison of Proposed Ensemble Forecasting with Individual Forecasting
This study proposes a hybrid ensemble model based on importance score based hybrid models. The proposed strategy has been successfully developed based on the framework described in Figure 1. First, consideration has been given to a vast assortment of technical indicators as input characteristics in the preprocessing module. Later, the present work introduced four different importance score generation strategies that use the input feature sets to determine the importance score of each feature. These scores are further used to produce feature weighted hybrid models. Section 5.3.1 demonstrates the effectiveness of hybrid models and shows that the results failed to choose a single hybrid model that can be applied globally for index future price prediction. Thus, to employ the full advantage of the individual hybrid models, the presented technique makes use of the hybrid models along with baseline methods aggregated by ACO-LD to produce the ensemble results. The results presented in Table 4, Table 5 and Table 6 established that the proposed approach improves the performance effectively in index future price forecasting.
In a broad perspective, the proposed ensemble model is an intelligent fusion of forecasting models. Associated with individual models, the importance score based ensemble model receipts the benefits of the data preprocessing module i.e., Technical indicators and Oscillators, Importance scores based hybrid learning models, and intelligent optimization algorithm, i.e., ACO-LD, all together to produce the ensemble output. The framework improves overall accuracy by dynamically adjusting weights for every forecast horizon, which lowers bias-variance trade-offs. This yields more dependable predictions, essential for portfolio managers, algorithmic traders, and risk analysts. By reducing error propagation in long-term forecasting, the framework can be utilized for multi-day trading strategies. Financial markets are characterized by fluctuating patterns and sudden shifts. The ACO-LD driven weight adjustment mechanism allows the ensemble to adapt changing market conditions, outperforming static models that often fail during periods of high volatility. The improvements and experimental benefits have already been analyzed and discussed, however, in terms of disadvantage, the proposed approach faces the computational complexity problem due to the fusion of hybrid methods. The iterative nature of the algorithm introduces computational overhead, particularly with large datasets or extensive model ensembles. This can make real-time forecasting challenging, limiting the scalability in high-frequency trading environments. Moreover, the detailed procedure of experiment in fabricating the final ensemble model is accomplished to produce a better forecasting accuracy over baseline models for index future price forecasting. Different adaption and experimentation of the proposed approach can be done in future research. Testing the framework across diverse markets, including forex, commodities, and emerging financial instruments, will provide insights into its generalization and robustness. Future iterations could integrate external macroeconomic indicators, geopolitical risk factors, and sentiment analysis from news and social media.
6. Conclusions
In this work, a new ensemble approach is proposed for multi-day ahead index future price forecasting problem. The proposed approach uses different importance score generation methods to obtain feature-weighted hybrid learning models. multi-out support vector regression approaches are developed for multi-day ahead forecasting. Finally, the individual feature weighted hybrid forecast models are combined through a continuous multi colony ant colony optimization model (MACO-LD) to construct the ensemble model.
Eight index futures price data are considered to evaluate the performance. A comprehensive array of technical indicators and oscillators have been utilized as the input features in this study. The data sets are trained and tested through a walk forward sliding window approach. First, the experimental findings are investigated to compare importance score based hybrid models with the baseline models, and then the ensemble forecasting model is compared with the parent models. The numerical results, achieved based on different performance metrics, show the superiority of the proposed ensemble model over baseline algorithms and the hybrid feature weighted models. The empirical findings establish that the proposed ensemble model is a promising price forecasting tool and should be applied for the index future price forecasting problem.
The proposed framework signifies a substantial improvement in financial forecasting, overcoming critical shortcomings of conventional ensemble learning via dynamic weight optimization and hybrid model integration. Despite the limitations in computational complexity and hyperparameter sensitivity, future research may refine and augment the model, thereby improving its robustness and applicability across various financial markets. This study establishes a basis for more flexible, interpretable, and precise multi-day forecasting models, enhancing the development of financial time series analysis.
Author Contributions
Conceptualization, K.S. and M.T.; methodology, K.S.; software, K.S.; validation, K.S.; formal analysis, K.S.; investigation, K.S.; resources, M.T.; data curation, K.S.; writing—original draft preparation, K.S.; writing—review and editing, K.S. and M.T.; visualization, K.S.; supervision, M.T.; project administration, M.T. All authors have read and agreed to the published version of the manuscript.
Funding
This research received no external funding.
Data Availability Statement
The original data presented in the study are openly available in yahoo-finance https://finance.yahoo.com (accessed on 1 January 2021).
Conflicts of Interest
The authors declare no conflicts of interest.
References
- Mishra, R.K.; Sehgal, S.; Bhanumurthy, N. A search for long-range dependence and chaotic structure in Indian stock market. Rev. Financ. Econ. 2011, 20, 96–104. [Google Scholar] [CrossRef]
- Bâra, A.; Oprea, S.V. Predicting day-ahead electricity market prices through the integration of macroeconomic factors and machine learning techniques. Int. J. Comput. Intell. Syst. 2024, 17, 10. [Google Scholar] [CrossRef]
- Ballini, R.; Luna, I.; Lima, L.D.; da Silveira, R.L.F. A comparative analysis of neurofuzzy, ANN and ARIMA models for Brazilian stock index forecasting. In Proceedings of the 16th SCE International Conference on Computing in Economics and Finance, City University London, London, UK, 15–18 July 2010; pp. 1–17. [Google Scholar]
- Bustos, O.; Pomares-Quimbaya, A. Stock market movement forecast: A Systematic review. Expert Syst. Appl. 2020, 156, 113464. [Google Scholar] [CrossRef]
- Drucker, H.; Burges, C.J.; Kaufman, L.; Smola, A.; Vapnik, V. Support vector regression machines. Adv. Neural Inf. Process. Syst. 1997, 9, 155–161. [Google Scholar]
- Tay, F.E.; Cao, L. Application of support vector machines in financial time series forecasting. Omega 2001, 29, 309–317. [Google Scholar] [CrossRef]
- Kim, K.J. Financial time series forecasting using support vector machines. Neurocomputing 2003, 55, 307–319. [Google Scholar] [CrossRef]
- Pai, P.F.; Lin, C.S. A hybrid ARIMA and support vector machines model in stock price forecasting. Omega 2005, 33, 497–505. [Google Scholar] [CrossRef]
- Sezer, O.B.; Gudelek, M.U.; Ozbayoglu, A.M. Financial time series forecasting with deep learning: A systematic literature review: 2005–2019. Appl. Soft Comput. 2020, 90, 106181. [Google Scholar] [CrossRef]
- Tsang, P.M.; Kwok, P.; Choy, S.O.; Kwan, R.; Ng, S.C.; Mak, J.; Tsang, J.; Koong, K.; Wong, T.L. Design and implementation of NN5 for Hong Kong stock price forecasting. Eng. Appl. Artif. Intell. 2007, 20, 453–461. [Google Scholar] [CrossRef]
- Yu, L.; Wang, S.; Lai, K.K. A neural-network-based nonlinear metamodeling approach to financial time series forecasting. Appl. Soft Comput. 2009, 9, 563–574. [Google Scholar] [CrossRef]
- Hadavandi, E.; Shavandi, H.; Ghanbari, A. Integration of genetic fuzzy systems and artificial neural networks for stock price forecasting. Knowl.-Based Syst. 2010, 23, 800–808. [Google Scholar] [CrossRef]
- Chen, Y.; Zhao, P.; Zhang, Z.; Bai, J.; Guo, Y. A stock price forecasting model integrating complementary ensemble empirical mode decomposition and independent component analysis. Int. J. Comput. Intell. Syst. 2022, 15, 75. [Google Scholar] [CrossRef]
- Li, H.; Wang, Q.; Wei, D. A Novel Hybrid Model Combining BPNN Neural Network and Ensemble Empirical Mode Decomposition. Int. J. Comput. Intell. Syst. 2024, 17, 77. [Google Scholar] [CrossRef]
- Ray, P.; Ganguli, B.; Chakrabarti, A. Multivariate Bayesian Time-Series Model with Multi-temporal Convolution Network for Forecasting Stock Market During COVID-19 Pandemic. Int. J. Comput. Intell. Syst. 2024, 17, 170. [Google Scholar] [CrossRef]
- Zhipeng, J. Financial Time Series Forecasting Based on Characterized Candlestick and the Support Vector Classification with Cooperative Coevolution. J. Comput. 2019, 14, 195–209. [Google Scholar] [CrossRef]
- Gupta, D.; Pratama, M.; Ma, Z.; Li, J.; Prasad, M. Financial time series forecasting using twin support vector regression. PLoS ONE 2019, 14, e0211402. [Google Scholar] [CrossRef] [PubMed]
- Lahmiri, S. Intraday stock price forecasting based on variational mode decomposition. J. Comput. Sci. 2016, 12, 23–27. [Google Scholar] [CrossRef]
- Wang, X.; He, Q. Enhancing generalization capability of SVM classifiers with feature weight adjustment. In Proceedings of the International Conference on Knowledge-Based and Intelligent Information and Engineering Systems, Wellington, New Zealand, 20–25 September 2004; Springer: Berlin/Heidelberg, Germany; pp. 1037–1043. [Google Scholar]
- Zhang, Q.; Liu, D.; Fan, Z.; Lee, Y.; Li, Z. Feature and sample weighted support vector machine. In Knowledge Engineering and Management; Springer: Berlin/Heidelberg, Germany, 2011; pp. 365–371. [Google Scholar]
- Liu, J.N.; Hu, Y. Application of feature-weighted Support Vector regression using grey correlation degree to stock price forecasting. Neural Comput. Appl. 2013, 22, 143–152. [Google Scholar] [CrossRef]
- Yu, L.; Xu, H.; Tang, L. LSSVR ensemble learning with uncertain parameters for crude oil price forecasting. Appl. Soft Comput. 2017, 56, 692–701. [Google Scholar] [CrossRef]
- Li, S.; Wang, P.; Goel, L. A novel wavelet-based ensemble method for short-term load forecasting with hybrid neural networks and feature selection. IEEE Trans. Power Syst. 2015, 31, 1788–1798. [Google Scholar] [CrossRef]
- Li, S.; Goel, L.; Wang, P. An ensemble approach for short-term load forecasting by extreme learning machine. Appl. Energy 2016, 170, 22–29. [Google Scholar] [CrossRef]
- Saeed, W. Frequency-based ensemble forecasting model for time series forecasting. Comput. Appl. Math. 2022, 41, 66. [Google Scholar] [CrossRef]
- Ribeiro, M.H.D.M.; dos Santos Coelho, L. Ensemble approach based on bagging, boosting and stacking for short-term prediction in agribusiness time series. Appl. Soft Comput. 2020, 86, 105837. [Google Scholar] [CrossRef]
- Sahoo, D.; Sood, N.; Rani, U.; Abraham, G.; Dutt, V.; Dileep, A. Comparative analysis of multi-step time-series forecasting for network load dataset. In Proceedings of the 2020 11th International Conference on Computing, Communication and Networking Technologies (ICCCNT), Kharagpur, India, 1–3 July 2020; pp. 1–7. [Google Scholar]
- Zhang, J.; Teng, Y.F.; Chen, W. Support vector regression with modified firefly algorithm for stock price forecasting. Appl. Intell. 2019, 49, 1658–1674. [Google Scholar] [CrossRef]
- Yuan, F.C.; Lee, C.H.; Chiu, C. Using market sentiment analysis and genetic algorithm-based least squares support vector regression to predict gold prices. Int. J. Comput. Intell. Syst. 2020, 13, 234–246. [Google Scholar] [CrossRef]
- Pai, P.F.; Hong, L.C.; Lin, K.P. Using Internet Search Trends and Historical Trading Data for Predicting Stock Markets by the Least Squares Support Vector Regression Model. Comput. Intell. Neurosci. 2018, 2018, 6305246. [Google Scholar] [CrossRef] [PubMed]
- Kumar, D.; Meghwani, S.S.; Thakur, M. Proximal support vector machine based hybrid prediction models for trend forecasting in financial markets. J. Comput. Sci. 2016, 17, 1–13. [Google Scholar] [CrossRef]
- Hao, P.Y.; Kung, C.F.; Chang, C.Y.; Ou, J.B. Predicting stock price trends based on financial news articles and using a novel twin support vector machine with fuzzy hyperplane. Appl. Soft Comput. 2021, 98, 106806. [Google Scholar] [CrossRef]
- Kumar, A.; Thakur, M.; Mittal, G. A new ants interaction scheme for continuous optimization problems. Int. J. Syst. Assur. Eng. Manag. 2018, 9, 784–801. [Google Scholar] [CrossRef]
- Ince, H.; Trafalis, T.B. Kernel principal component analysis and support vector machines for stock price prediction. IIE Trans. Institute Ind. Eng. 2007, 39, 629–637. [Google Scholar] [CrossRef]
- Ince, H.; Trafalis, T.B. Short term forecasting with support vector machines and application to stock price prediction. Int. J. Gen. Syst. 2008, 37, 677–687. [Google Scholar] [CrossRef]
- Lu, C.J.; Lee, T.S.; Chiu, C.C. Financial time series forecasting using independent component analysis and support vector regression. Decis. Support Syst. 2009, 47, 115–125. [Google Scholar] [CrossRef]
- Hsu, S.H.; Hsieh, J.P.A.; Chih, T.C.; Hsu, K.C. A two-stage architecture for stock price forecasting by integrating self-organizing map and support vector regression. Expert Syst. Appl. 2009, 36, 7947–7951. [Google Scholar] [CrossRef]
- Yeh, C.Y.; Huang, C.W.; Lee, S.J. A multiple-kernel support vector regression approach for stock market price forecasting. Expert Syst. Appl. 2011, 38, 2177–2186. [Google Scholar] [CrossRef]
- Kazem, A.; Sharifi, E.; Hussain, F.K.; Saberi, M.; Hussain, O.K. Support vector regression with chaos-based firefly algorithm for stock market price forecasting. Appl. Soft Comput. J. 2013, 13, 947–958. [Google Scholar] [CrossRef]
- Wang, J.; Hou, R.; Wang, C.; Shen, L. Improved v -Support vector regression model based on variable selection and brain storm optimization for stock price forecasting. Appl. Soft Comput. J. 2016, 49, 164–178. [Google Scholar] [CrossRef]
- Rustam, Z.; Kintandani, P. Application of Support Vector Regression in Indonesian Stock Price Prediction with Feature Selection Using Particle Swarm Optimisation. Model. Simul. Eng. 2019, 2019, 8962717. [Google Scholar] [CrossRef]
- Meng, Q.; Xu, X. Price forecasting using an ACO-based support vector regression ensemble in cloud manufacturing. Comput. Ind. Eng. 2018, 125, 171–177. [Google Scholar] [CrossRef]
- Xu, Y.; Yang, C.; Peng, S.; Nojima, Y. A hybrid two-stage financial stock forecasting algorithm based on clustering and ensemble learning. Appl. Intell. 2020, 50, 3852–3867. [Google Scholar] [CrossRef]
- Sedighi, M.; Jahangirnia, H.; Gharakhani, M.; Fard, S.F. A novel hybrid model for stock price forecasting based on metaheuristics and support vector machine. Data 2019, 4, 75. [Google Scholar] [CrossRef]
- Parvini, N.; Ahmadian, D.; Ballestra, L.V. Forecasting Cryptocurrency Prices Using Support Vector Regression Enhanced by Particle Swarm Optimization. Comput. Econ. 2024, 1–30. [Google Scholar] [CrossRef]
- Robnik-Šikonja, M.; Kononenko, I. An adaptation of Relief for attribute estimation in regression. In Proceedings of the Machine Learning: Proceedings of the Fourteenth International Conference (ICML’97), Nashville, TN, USA, 8–12 July 1997; Volume 5, pp. 296–304. [Google Scholar]
- Kira, K.; Rendell, L.A. The feature selection problem: Traditional methods and a new algorithm. In Proceedings of the AAAI, San Jose, CA, USA, 12–16 July 1992; Volume 2, pp. 129–134. [Google Scholar]
- Breiman, L. Random forests. Mach. Learn. 2001, 45, 5–32. [Google Scholar] [CrossRef]
- Ju-Long, D. Control problems of grey systems. Syst. Control Lett. 1982, 1, 288–294. [Google Scholar] [CrossRef]
- Suykens, J.A.; Vandewalle, J. Least squares support vector machine classifiers. Neural Process. Lett. 1999, 9, 293–300. [Google Scholar] [CrossRef]
- Fung, G.; Mangasarian, O.L. Proximal support vector machine classifiers. In Proceedings of the Seventh ACM SIGKDD International Conference on Knowledge Discovery and Data Mining, San Francisco, CA, USA, 26–29 August 2001; pp. 77–86. [Google Scholar] [CrossRef]
- Shao, Y.H.; Zhang, C.H.; Yang, Z.M.; Jing, L.; Deng, N.Y. An ε-twin support vector machine for regression. Neural Comput. Appl. 2013, 23, 175–185. [Google Scholar] [CrossRef]
- Khemchandani, R.; Chandra, S. Twin support vector machines for pattern classification. IEEE Trans. Pattern Anal. Mach. Intell. 2007, 29, 905–910. [Google Scholar]
- Murphy, J.J. Technical Analysis of the Financial Markets: A Comprehensive Guide to Trading Methods and Applications; Penguin: New York, NY, USA, 1999. [Google Scholar]
- Pring, M.J. Technical Analysis Explained: The Successful Investor’s Guide to Spotting Investment Trends and Turning Points; McGraw-Hill Professional: New York, NY, USA, 2002. [Google Scholar]
- Thakur, M.; Kumar, D. A hybrid financial trading support system using multi-category classifiers and random forest. Appl. Soft Comput. 2018, 67, 337–349. [Google Scholar] [CrossRef]
- Wen, Q.; Yang, Z.; Song, Y.; Jia, P. Automatic stock decision support system based on box theory and SVM algorithm. Expert Syst. Appl. 2010, 37, 1015–1022. [Google Scholar] [CrossRef]
- Cheung, Y.W.; Lai, K.S. Lag order and critical values of the augmented Dickey–Fuller test. J. Bus. Econ. Stat. 1995, 13, 277–280. [Google Scholar]
Disclaimer/Publisher’s Note: The statements, opinions and data contained in all publications are solely those of the individual author(s) and contributor(s) and not of MDPI and/or the editor(s). MDPI and/or the editor(s) disclaim responsibility for any injury to people or property resulting from any ideas, methods, instructions or products referred to in the content. |
© 2025 by the authors. Licensee MDPI, Basel, Switzerland. This article is an open access article distributed under the terms and conditions of the Creative Commons Attribution (CC BY) license (https://creativecommons.org/licenses/by/4.0/).