Article

Decoding Plant-Based Beverages: An Integrated Study Combining ATR-FTIR Spectroscopy and Microscopic Image Analysis with Chemometrics

by
Paris Christodoulou
1,
Stratoniki Athanasopoulou
1,
Georgia Ladika
1,
Spyros J. Konteles
1,
Dionisis Cavouras
2,
Vassilia J. Sinanoglou
1,* and
Eftichia Kritsi
1,*
1
Laboratory of Chemistry, Analysis & Design of Food Processes, Department of Food Science and Technology, University of West Attica, Agiou Spyridonos, 12243 Egaleo, Greece
2
Department of Biomedical Engineering, University of West Attica, Agiou Spyridonos, 12243 Egaleo, Greece
*
Authors to whom correspondence should be addressed.
AppliedChem 2025, 5(3), 16; https://doi.org/10.3390/appliedchem5030016
Submission received: 10 June 2025 / Revised: 8 July 2025 / Accepted: 10 July 2025 / Published: 16 July 2025

Abstract

As demand for plant-based beverages grows, analytical tools are needed to classify and understand their structural and compositional diversity. This study applied a multi-analytical approach to characterize 41 commercial almond-, oat-, rice- and soy-based beverages, evaluating attenuated total reflectance Fourier transform infrared (ATR-FTIR) spectroscopy, protein secondary structure proportions, colorimetry, and microscopic image texture analysis. A total of 26 variables, derived from ATR-FTIR and protein secondary structure assessment, were employed in multivariate models, using partial least squares discriminant analysis (PLS-DA) and orthogonal PLS-DA (OPLS-DA) to evaluate classification performance. The results indicated clear group separation, with soy and rice beverages forming distinct clusters while almond and oat samples showing partial overlap. Variable importance in projection (VIP) scores revealed that β-turn and α-helix protein structures, along with carbohydrate-associated spectral bands, were the key features for beverages’ classification. Textural features derived from microscopy images correlated with sugar and carbohydrate content and color parameters were also employed to describe beverages’ differences related to sugar content and visual appearance in terms of homogeneity. These findings demonstrate that combining ATR-FTIR spectral data with protein secondary structure data enables the effective classification of plant-based beverages, while microscopic image textural and color parameters offer additional extended product characterization.

1. Introduction

Interest among consumers in plant-based beverages has increased substantially in recent years, driven predominantly by ethical, environmental, and health concerns. The production of dairy products has been reported to hold a large environmental impact, primarily owing to its high land and water demands, and significant greenhouse gas emissions [1]. These challenges have encouraged the food industries to invest in developing more sustainable options like plant-based beverages [2].
Plant-based beverages, derived from legumes, grains, nuts, or seeds, are well directed not only to consumers with lactose intolerance or allergies to dairy-proteins, but also to consumers adopting environmentally friendly choices [3]. Their composition varies depending on the source; for example, peanut-based drinks constitute a characteristic category that are valued for their essential fatty acids [4], while oat-based beverages offer dietary fibers, such as β-glucans, which are recognized for their hypocholesterolemic effects [5,6]. These compositional differences influence their structural and nutritional properties, making them suitable candidates for analytical classification. Concurrently, improvements in production techniques, including emulsification, have enhanced the stability and texture in these beverages, thereby increasing their market value and consumer appeal [7,8].
However, the nutritional profiles of plant-based beverages vary significantly depending on both the source material and the processing methods used [9,10,11]. Soy-based beverages are typically high in protein concentrations with a well-balanced amino acid profile [12,13], while almond-based beverages tend to be lower in calories and rich in unsaturated fats and vitamins [14,15]. Despite these benefits, plant-based beverages face formulation challenges, such as phase separation, undesirable flavors, and limited nutrient bioavailability [7]. Addressing these issues often involves several different techniques such as pasteurization, ultra-high-temperature (UHT) sterilization, and high- or ultra-high-pressure homogenization [16]. Techniques such as wet-milling methods followed by filtration or centrifuge is also used to improve particle size distribution and product stability [9]. In addition, the nutritional fortification of these products with the supplementation of proteins, minerals, and vitamins, has been employed to match or even overtake the nutritional value of traditional dairy products [17,18]. Considering their environmental advantages and continued progress through processing and nutritional fortification [19], plant-based beverages represent a growing and adaptive sector of the food industry. To support both scientific analysis and industrial quality control, there is a growing need for rapid, reliable, and non-destructive analytical methods to evaluate their chemical composition, and visual attributes.
The present study aims to develop and validate an integrated, non-destructive analytical framework to characterize and differentiate plant-based beverages. This work is among the first to integrate ATR-FTIR-derived protein secondary structure data with microscopy-based texture analysis and chemometric modeling to characterize and differentiate commercial plant-based beverages. Specifically, a total of 41 samples—comprising almond, oat, rice, and soy-based beverages—were analyzed using attenuated total reflectance Fourier transform infrared (ATR-FTIR) spectroscopy to capture their molecular fingerprints and evaluate protein secondary structures. In parallel, microscopic image analysis and colorimetry were employed to evaluate microstructural uniformity and visual characteristics. Moreover, FTIR data, as well as the protein secondary structure proportions of each sample, were subjected to multivariate statistical analyses, including PLS-DA and OPLS-DA, to classify beverage types and identify key discriminating features. This multidisciplinary approach demonstrates the effectiveness of combining ATR-FTIR spectroscopy, microscopic imaging, and chemometric analysis to achieve a detailed, non-destructive characterization of plant-based beverages, offering a practical tool for product classification and supporting efforts in quality monitoring and compositional consistency across different formulations.

2. Materials and Methods

2.1. Sampling and Lyophilization of the Plant-Based Beverages

Forty-one (41) plant-based beverages’ samples from four plant raw materials (soy, rice and brown rice, oat, and almond) from different commercial brands were purchased from supermarkets and transported to the laboratory for analysis. Representative quantities of plant-based beverages’ samples were stored at −80 °C for three days and then were freeze-dried to remove the water content using the Gellert, CryoDryer 20 lyophilizer (Langweid a. Lech, Germany). The vacuum was set to 0.80 mbar pressure and the freeze-drying process was started for the samples once the thermocouples were used, and a temperature of −25 °C was recorded; this process continued until they were completely dehydrated. Freeze-drying was used to remove the water content and to ensure a consistent, dry matrix suitable for FTIR and image analysis. The process preserves the macronutrient structure which is essential to the spectral and structural characterization methods used in this study [20]. Table S1 (see Supplementary Material) presents the plant-based beverages, organized by plant raw material type, along with their sample codes (each code corresponds to an individual commercial brand), compositional and ingredient information. Three replicates were used for each commercial brand.

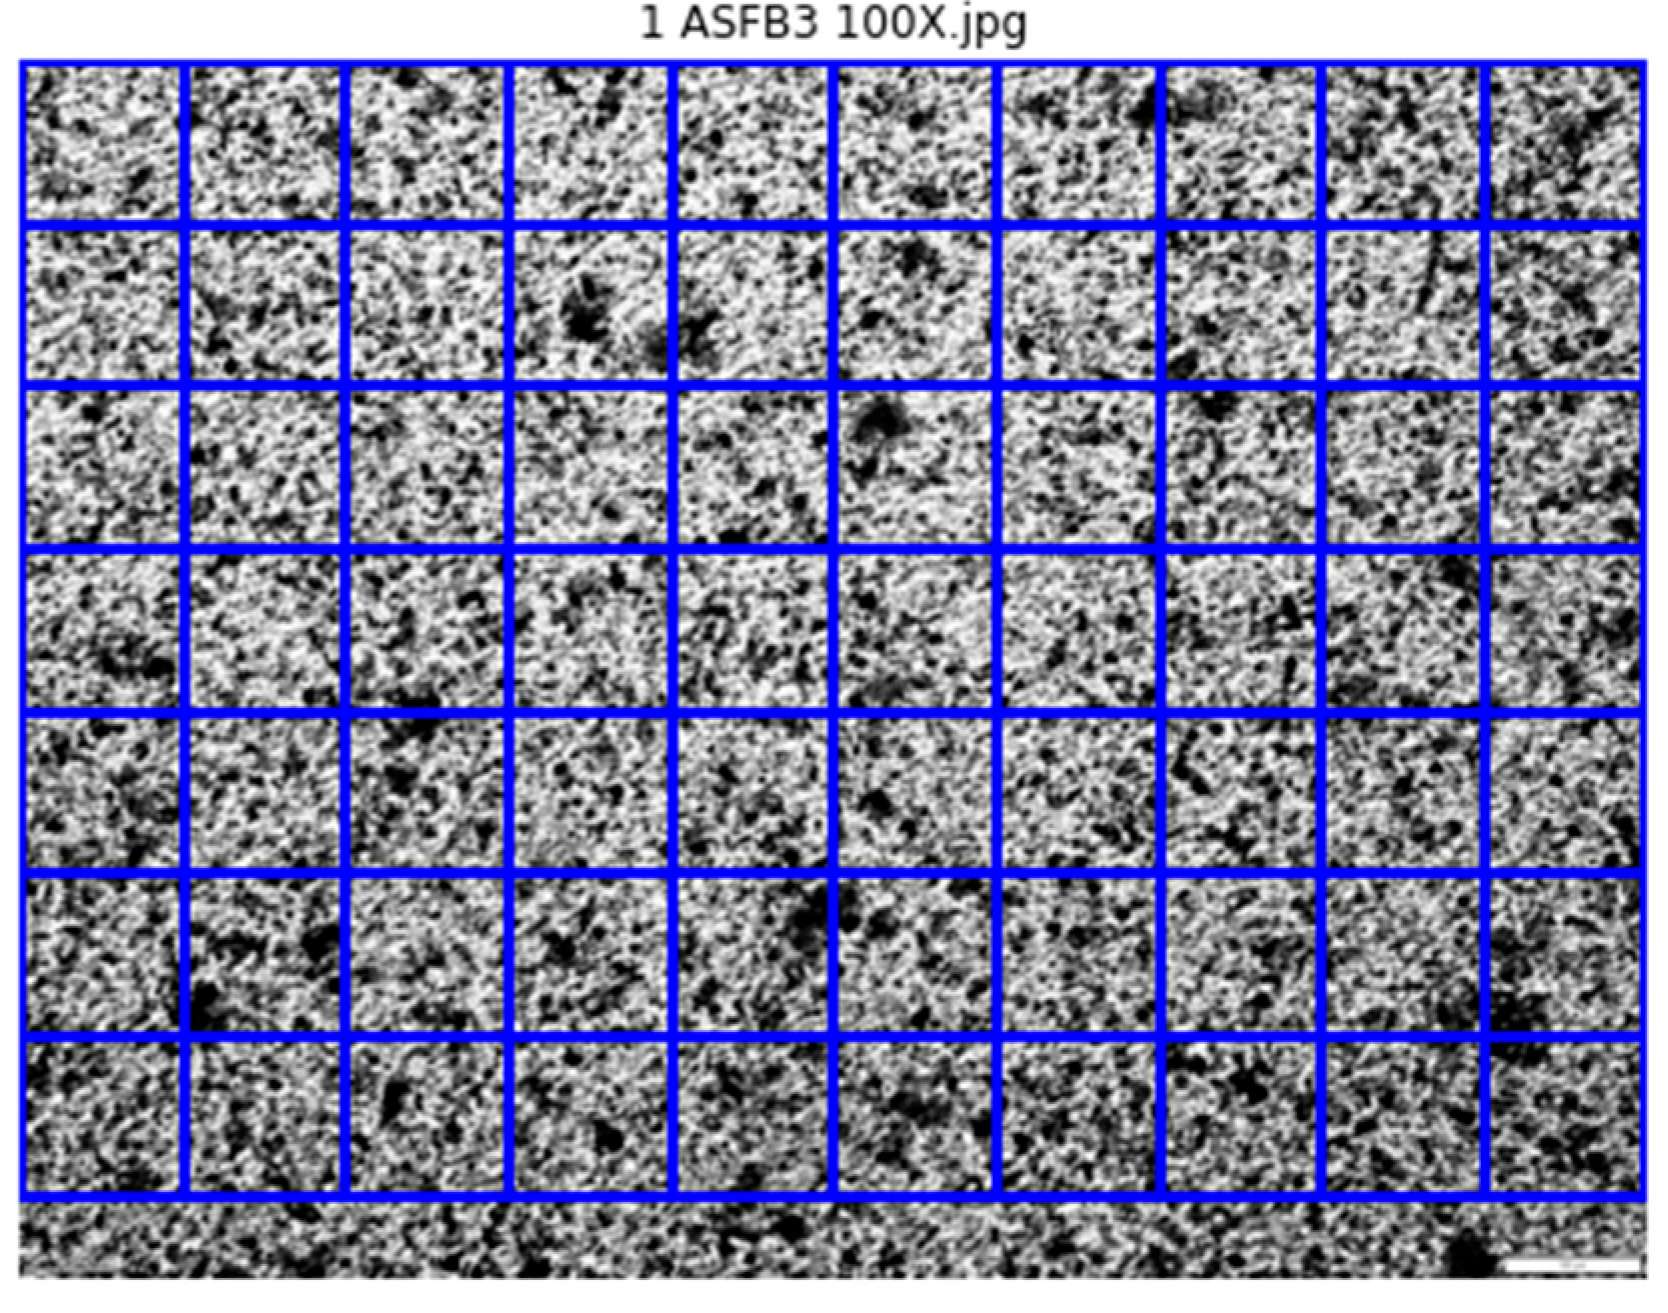
2.2. Color Measurement, Microscopy and Image Analysis Evaluation

Color parameters L* (Lightness), a* (red-green), b* (yellow-blue), and h (hue angle in degrees), of plant-based beverages’ samples were measured using a tristimulus chromatometer (CR-400, Minolta, Tokyo, Japan) according to Christodoulou et al. [21].
A 2 μL aliquot of each sample was placed on glass slides and covered with a coverslip. Optical microscopy was performed using a bright-field microscope (Olympus CX23, Olympus Corporation, Tokyo, Japan) equipped with a digital camera (Olympus EP50). Images were acquired at 10× magnifications using the EPview software (version 2.9.17) provided by the manufacturer.
Fifteen (15) textural features were extracted from the grayscale versions of the microscopy images to analyze the textural differentiations of plant-based beverages’ samples. Each microscopy image was divided into 70 square regions of interest (ROIs, 10 along the horizontal ×7 along the vertical directions) (Figure 1), in order to extract the appropriate textural features.
Microscopy images were analyzed for texture using a total of 15 statistical textural features derived from first-order statistics and the gray-level co-occurrence matrix (GLCM)-based descriptors. These included standard deviation, skewness, kurtosis, energy, contrast, homogeneity, dissimilarity, correlation, angular second moment (ASM), gray level non-uniformity (GLN), run length non-uniformity (RLN), short run emphasis (SRE), long run emphasis (LRE), and others. The above chosen features are commonly used in image texture analysis. These features were selected for their ability to describe pixel intensity variation, structural uniformity, and spatial organization, which are relevant to the visual and physical characteristics of plant-based beverages [21,22,23]. The statistical evaluation of the above features was performed among brands, for each plant-based beverage category, using the non-parametric Mann–Whitney–Wilcoxon test for two classes. This analysis was conducted using the Python scipy.stats library 1.14.1 (https://docs.scipy.org/doc/scipy/tutorial/stats.html, accessed on 2 May 2025).

2.3. Attenuated Total Reflectance Fourier Transform Infrared Spectroscopy (ATR-FTIR) of the Lyophilized Plant-Based Beverages

Attenuated total reflectance Fourier transform infrared (ATR-FTIR) spectroscopy was used for the analyses, and an IRAffinity-1S FTIR spectrometer from Shimadzu (Kyoto, Japan) was used. The measurement process was made by a diamond internal reflection element (IRE). To obtain their spectra, the lyophilized plant-based beverage samples were put on the ATR surface. The ATR reference was set at 3284.77 cm−1, and the spectra of the background and the plant-based beverage samples were recorded between 4000 and 499 cm−1, with an average of 20 scans made at a resolution of 4 cm−1. The LabSolutions IR software (version 2.21) was then used to perform ATR correction, baseline correction, normalizing, smoothing, spectra deconvolution for overlapping phenomenon and peak picking on the FTIR spectra of the plant-based beverage samples. In addition, a second derivative transformation and Gaussian curves were used to analyze the amide I region (1600–1700 cm−1) in order to ascertain the proteins’ secondary structure. Peak area values derived from the Gaussian fits were used to quantify the contributions of each secondary structure. For the rest of the selected FTIR regions used in the multivariate analysis, peak intensities were extracted to represent the relative signal magnitude. The methods outlined by Kritsi et al. [24] were followed when using LabSolutions IR software (version 2.21).

2.4. Univariate Statistical Analysis

Quantitative results from the chemical composition, colorimetric parameters (L*, a*, b*, hue angle), ATR-FTIR spectral band intensities and the proportions of the secondary protein structure were statistically evaluated using one-way analysis of variance (ANOVA) followed by Tukey’s post hoc test to determine pairwise differences among means. This analysis was performed using IBM SPSS Statistics (Version 29.0, IBM Corp., Chicago, IL, USA). Additionally, Pearson’s correlation coefficients (r) were computed to explore the relationships between the macronutrient content (as declared on the product label) and the corresponding FTIR band intensities.

2.5. Chemometrics and Multivariate Statistical Analysis

The FTIR spectral datasets (wavenumber range: 4000–499 cm−1) were log-transformed and auto-scaled (mean-centered and divided by the standard deviation) to normalize the data prior to multivariate analysis. Analyses were conducted using the MetaboAnalyst 6.0 platform (www.metaboanalyst.ca, accessed on 23 February 2025). Two-dimensional principal component analysis (PCA) was initially used to visualize general clustering trends and detect outliers. Subsequently, Partial Least Squares Discriminant Analysis (PLS-DA) as well as orthogonal partial least squares discriminant analysis (OPLS-DA) were employed to classify the samples based on beverage type. The input variables included 22 FTIR spectral intensities corresponding to predefined characteristic bands and 4 protein secondary structure elements (β-sheet, α-helix, β-turn, random coil) derived from Gaussian curve fitting of the Amide I region. The performance of both PLS-DA and OPLS-DA models was evaluated via 1000-fold permutation testing to assess overfitting and model robustness. Variable importance in projection (VIP) scores were calculated to identify the most discriminative features contributing to beverage-type separation.

3. Results and Discussion

3.1. Chemical Composition and Color Parameters of Plant-Based Beverages

Table 1 shows the chemical composition of total fat, carbohydrate, protein, and salt per 100 g of product for each category of plant-based beverages as reported on their label.
According to the results of Table 1, it was observed that soy-based beverages contained significantly (p < 0.05) higher percentage of protein compared to the others, which is confirmed by the increased protein content in soy [12,13,25]. From a nutritional standpoint, soy, followed by oats and almonds, provides a greater contribution to protein intake than rice. A higher percentage of fat was also observed in soy, oats, and almond-based beverages. Rice and brown rice-based beverages contain a significantly (p < 0.05) higher percentage of carbohydrates, due to their high starch content, followed by oat-based beverages [26]. Interestingly, brown rice-based beverages have a low glycemic index, which has been linked to a reduced likelihood of developing type 2 diabetes, and have been considered for the treatment of beri-beri disease [27,28]. In accordance to the above results, Hidalgo-Fuentes et al. [29] reported that legume-based beverages, such as soy, are distinguished by a high protein content comparable to that of cow’s milk (3–4%), whereas cereal-based beverages, such as oat and rice, are characterized by elevated carbohydrate (sugars, starch and fibers) contents. Additionally, nut-based beverages like almond are distinguished by their elevated lipid (2–5%) and protein (0.8–1.3%) concentrations.
As the color of foods is an important factor in their acceptance by consumers, it was considered necessary to measure the color parameters of plant-based beverages (Table 2).
Soy-based beverages have a higher (p < 0.05) L* and b* value and a lower a* value, resulting in a more yellowish appearance compared to the other beverages. The yellowish appearance in plant-based beverages is probably undesirable for consumers, as there is a tendency to find plant-based beverages with the same organoleptic characteristics as milk [30]. Moreover, brown rice-based beverages presented the higher (p < 0.05) a* value compared to the other beverages. The hue angle values of all the plant-based beverages studied were found to be in the green-yellow spectrum. Conversely, the yellow hue may be due to the presence of bioactive ingredients, such as carotenoids and phenolic compounds, in the plant-based beverage, which significantly boost its nutritional value [31]. The color of plant-based beverages is predominantly affected by the raw plant materials used, the manufacturing process, and the storage conditions [32].

3.2. Evaluation of Plant-Based Beverages’ Samples Based on Image Texture Analysis of the Microscopy Pictures

The uniformity of the emulsion is an essential physicochemical characteristic of milk and plant-based beverages, enhancing their stability, appearance and sensory appeal [17]. Plant-based beverages are colloidal systems produced by mixing the ground-up products of plant origin with water, edible plant oil (mainly sunflower oil), an acidity regulator, carbohydrates, sugars, proteins, dietary fibers, and salt [33,34]. The microscopy of the plant-based beverages was employed to obtain a comparative assessment of the homogeneity of the beverage emulsions. The microscope images were analyzed using the technique of image texture analysis and the relative textural features were calculated. This study is one of the first to report the textural analysis of optical microscopy images of plant-based beverages in the literature.
Surprisingly, it was found that the plant-based beverages’ samples with a higher carbohydrate and/or sugar content, as reported on their label (Table S1), gave significantly (p < 0.05) higher values for the textural features that, according to Christodoulou et al. [21], define the uniformity of pixel values in an image such as mean, kurtosis, energy, homogeneity, correlation, angular second moment, gray level non-uniformity, and long run emphasis. They also gave significantly (p < 0.05) lower values for the textural features describing the variations in pixel values in an image such as standard deviation, skewness, contrast, dissimilarity, short run emphasis, and run length non-uniformity (Figures S1–S5). These findings indicate that the increased carbohydrate and/or sugar content of the plant-based beverages increases the homogeneity of the image texture, resulting in a more homogeneous product. Therefore, it appears that the stability of the plant-based beverages’ emulsions is enhanced by increasing the carbohydrate and sugar content. For example, the soy-based beverages with the highest sugar content (SGFB3 and SB5) (Table S1) exhibited a significantly (p < 0.05) higher uniformity of pixel values in their microscope images (e.g., mean, kurtosis, energy, homogeneity, correlation, angular second moment, gray level non-uniformity, and long run emphasis) than the other samples (Figure S1). Furthermore, the rice-based beverages with the highest sugar content (RB3 and RB4) (Table S1) showed significantly (p < 0.05) higher energy, homogeneity, angular second moment, gray level non-uniformity, and a longer run emphasis than the other samples (Figure S2). Consequently, the beverages prepared with a higher carbohydrate and sugar content showed similar microscopy results, regardless of the ground-up plant product used. Regarding the aforementioned findings, Maskan and Göǧüş [35] indicated that the incorporation of sugar enhanced the stability of sunflower oil and water emulsions. Another factor that might have affected the homogeneity of the image texture was the addition of gums, specifically gellan gum, to the beverages. Gellan gum is a water-soluble anionic polysaccharide synthesized by the bacterium Sphingomonas elodea. It is an emulsion-stabilizing, thickening, gelling agent [36] that functions as a food additive to improve the stability of plant-based beverages. Furthermore, the homogeneity of the image texture could be affected by proteins in plant-based beverages that have surface-active properties and can act as surfactants [37]. Through rearrangement, the proteins orient their hydrophilic groups towards the aqueous phase and their hydrophobic groups towards the oily phase. In this sense, the almond-based beverage with added protein and gellan gum (OPB12) (Table S1) exhibited considerably (p < 0.05) greater energy, homogeneity, and correlation compared to the other samples (Figure S5). From all of the above findings, it seems that the extracted features from plant-based beverage microscopy images may be related to the sugar, protein, and gum content, and that, as these contents increased, so did beverage homogeneity.

3.3. ATR-FTIR Spectra Interpretation of Plant-Based Beverages

In order to interpret the ATR-FTIR spectra of plant-based beverages in the spectral range of 4000 to 499 cm−1, Table 3 has been constructed based on the expected absorptions of characteristic groups or moieties of molecular compounds, as reported in the literature.
Table 3. Characteristic ATR-FTIR absorptions.
Frequency (cm–1)Bond and Vibration TypeExpected CompoundsReferences
3300–3270N-H stretching vibration (Amide I)Amides and proteins[38]
3010cis- or trans-C(sp2)-H stretching vibrations in vinyl groupsUnsaturated compounds (lipids, fatty acids)
2922Asymmetric stretching vibrations of C(sp3)-H in methylene groupsTriglycerides, carboxylic and fatty acids, carbohydrates, amino acids, waxes[23,39]
2854Symmetric stretching vibrations of C(sp3)-H in methylene groups
1743Stretching vibrations of carbonyl group (C=O)Triglycerides, cholesterol esters, polysaccharides[40,41,42]
1649–1631Stretching vibrations of carbonyl group (C=O): Amide I absorption bandAmides and proteins[24]
1545–1535combined C-N stretching and N-H bending vibrations: Amide II absorption bandAmides and proteins
1460–1440 and
1421–1396
C(sp3)-H bending vibration in -CH3 and
-CH2
Lipids, amides, proteins, polysaccharides[43]
1314Combined C-N stretching and O=C-N and N-H bending vibrations: Amide III absorption bandAmides and proteins[44,45]
1240 and 1157Asymmetric and symmetric C-O stretching vibrationsPolysaccharides, amides and proteins[44,46,47]
1107–1100C-O stretching vibrationsSecondary alcohols[38]
1075–1045Polysaccharides[48]
1020–1010Lipids, primary alcohols, and pyranose structure of the carbohydrates[44,49]
999–979Sucrose[50]
932–920β-configuration of carbohydrate anomerscarbohydrates[46,47]
870–835 and 819–817α-configuration, of carbohydrate anomers
770–750pyran ring
721–718cis-C(sp2)-H out-of-plane bending vibrations
or O–H out of plane bending vibrations
Carotenoids, unsaturated fatty acids
Amylose and amylopectin
[22,38,51,52]
667–630C-C-O deformation within the glycosidic linkageCarbohydrates[51]
575–532 and 526–516C–O–C in plane bending vibrations of the glycosidic linkageAmylose and amylopectin[22,51]
A representative overlay of the ATR-FTIR spectra for each beverage category is provided in the Supplementary Material (Figure S6). The evaluation of the ATR-FTIR spectra of plant-based beverages’ categories was conducted through a comparative study of the relative intensities of FTIR spectral bands, enumerated in Table 4 and the most interesting results are mentioned below. Soy- and almond-based beverages, and to a lesser extent oat-based beverages, showed significantly (p < 0.05) higher intensities for the spectral peaks at 2922, 2854, 1460–1440 and 1421–1396 cm−1. More specifically, soy- and almond-based beverages exhibited significantly (p < 0.05) higher intensities at 2922 and 2854 cm−1, confirming their higher lipid content, in agreement with Table 1. Furthermore, the significant higher intensities of the bands at 1649–1631 and 1545–1535 cm−1, regarding amide I and amide II, of soy, oat and almond-based beverages confirming their higher protein content than rice and brown rice-based beverages, as can be seen in the Table 1. Interestingly, rice, brown rice and oat-based beverages exhibited significantly (p < 0.05) higher intensities at 1022–1010 cm−1, due to their higher sugars content. The intensities of infrared absorption bands can be utilized to ascertain the existence and quantity of diverse plant constituents, including proteins, lipids, and carbohydrates [53]. To a further step, high positive Pearson correlations were found between the intensities at 2922 cm−1 and the total fat content (R2 = 0.7363, p < 0.05), and the intensities at 2854 cm−1, and the total fat content (R2 = 0.8197, p < 0.05), for all the beverage samples. As these peaks are associated with the presence of lipids, the above results verify the higher fat content of soy and almond-based beverages (Table 1). Furthermore, soy-based beverages exhibited higher (p < 0.05) peak intensities at 1649–1631 and 1545–1535 cm−1, followed by almond and oat-based beverages. This is due to their higher protein content (see Table 1), resulting in a high positive correlation between the peak intensities and protein content (R2 0.7168 and 0.7644, respectively p < 0.05). The intensities of plant-based beverages at 1157 cm−1 seem to have a very strong positive correlation (R2 = 0.9908, p < 0.05) with carbohydrate content, whereas their intensities at 1022–1010 cm−1 seem to have a high positive correlation (R2 = 0.8505, p < 0.05) with sugar content.
In food science, the secondary structure of proteins is crucial as it affects the nutritional value and texture of foods by strengthening their thermal stability and influencing their digestibility, functional characteristics and the bioavailability of amino acids [54]. Consequently, the amide I region of the ATR-FTIR spectra of the plant-based beverage samples was examined to clarify the secondary structures of the proteins and assess their differences. Table 5 presents the proportions of the secondary structures of the proteins found in the plant-based beverages, such as β-parallel sheet, random coil, α-helix and β-turn.
Significant findings emerged in the comparison of different plant-based beverages and protein structures. Interestingly, irrespective of the plant raw material used, all beverages had the highest (p < 0.05) proportion of their proteins in a β-parallel sheet structure and the lowest (p < 0.05) proportion in a β-turn structure. Soy-based beverages showed the highest (p < 0.05) percentage of proteins with a β-parallel sheet structure, while rice-based beverages showed the highest percentage of proteins with a random coil structure. Also, oat-based beverages showed the highest (p < 0.05) percentage of proteins with an α-helix structure while almond-based beverages had the highest percentage of proteins with a β-turn structure. The percentages of the secondary protein structures in the plant-based beverages under study seem to be related to the plant raw material, but this could also be the result of the manufacturing process. Supporting this hypothesis, ultrasound or thermosonication treatment can be used to sterilize and homogenize plant-based beverages during production, ensuring their suspension and microbial stability during storage [55,56,57]. Vanga et al. [58] reported that the secondary structure of proteins in plant-based beverages was affected by high-intensity pulsed ultrasound treatment. In particular, the percentage of random coil structure increased and the percentage of α-helix and β-turn decreased as the power and the time of ultrasound exposure increased [57]. Furthermore, a decrease in the α-helix content and an increase in the β-sheet content were observed in the soybean and almond proteins in soy- and almond-based beverages when they were treated with ultrasonication [58,59]. Moreover, the heat treatment of plant-based beverages during production may result in the partial destruction of the hydrogen bonds that stabilize the secondary structure of proteins. This leads to a reduction in the proportion of stable α-helix, β-sheet and β-turn structures, and an increase in the proportion of random coil structures [60]. According to the literature data, a high proportion of β-sheets to α-helices in the proteins can reduce their digestibility because they obstruct the action of digestive enzymes [61,62]. In this sense, oat-based beverages have the lowest proportion of β-sheets to α-helices and are therefore the most easily digested, maintaining their amino acid availability and overall nutritional quality. Furthermore, the quality of proteins is significantly influenced by β-turn structure proportion, which play a crucial role in their stability, and ability to interact with other molecules [63]. Therefore, almond-based beverages with the highest β-turns proportion have a more functional profile than the other beverages.

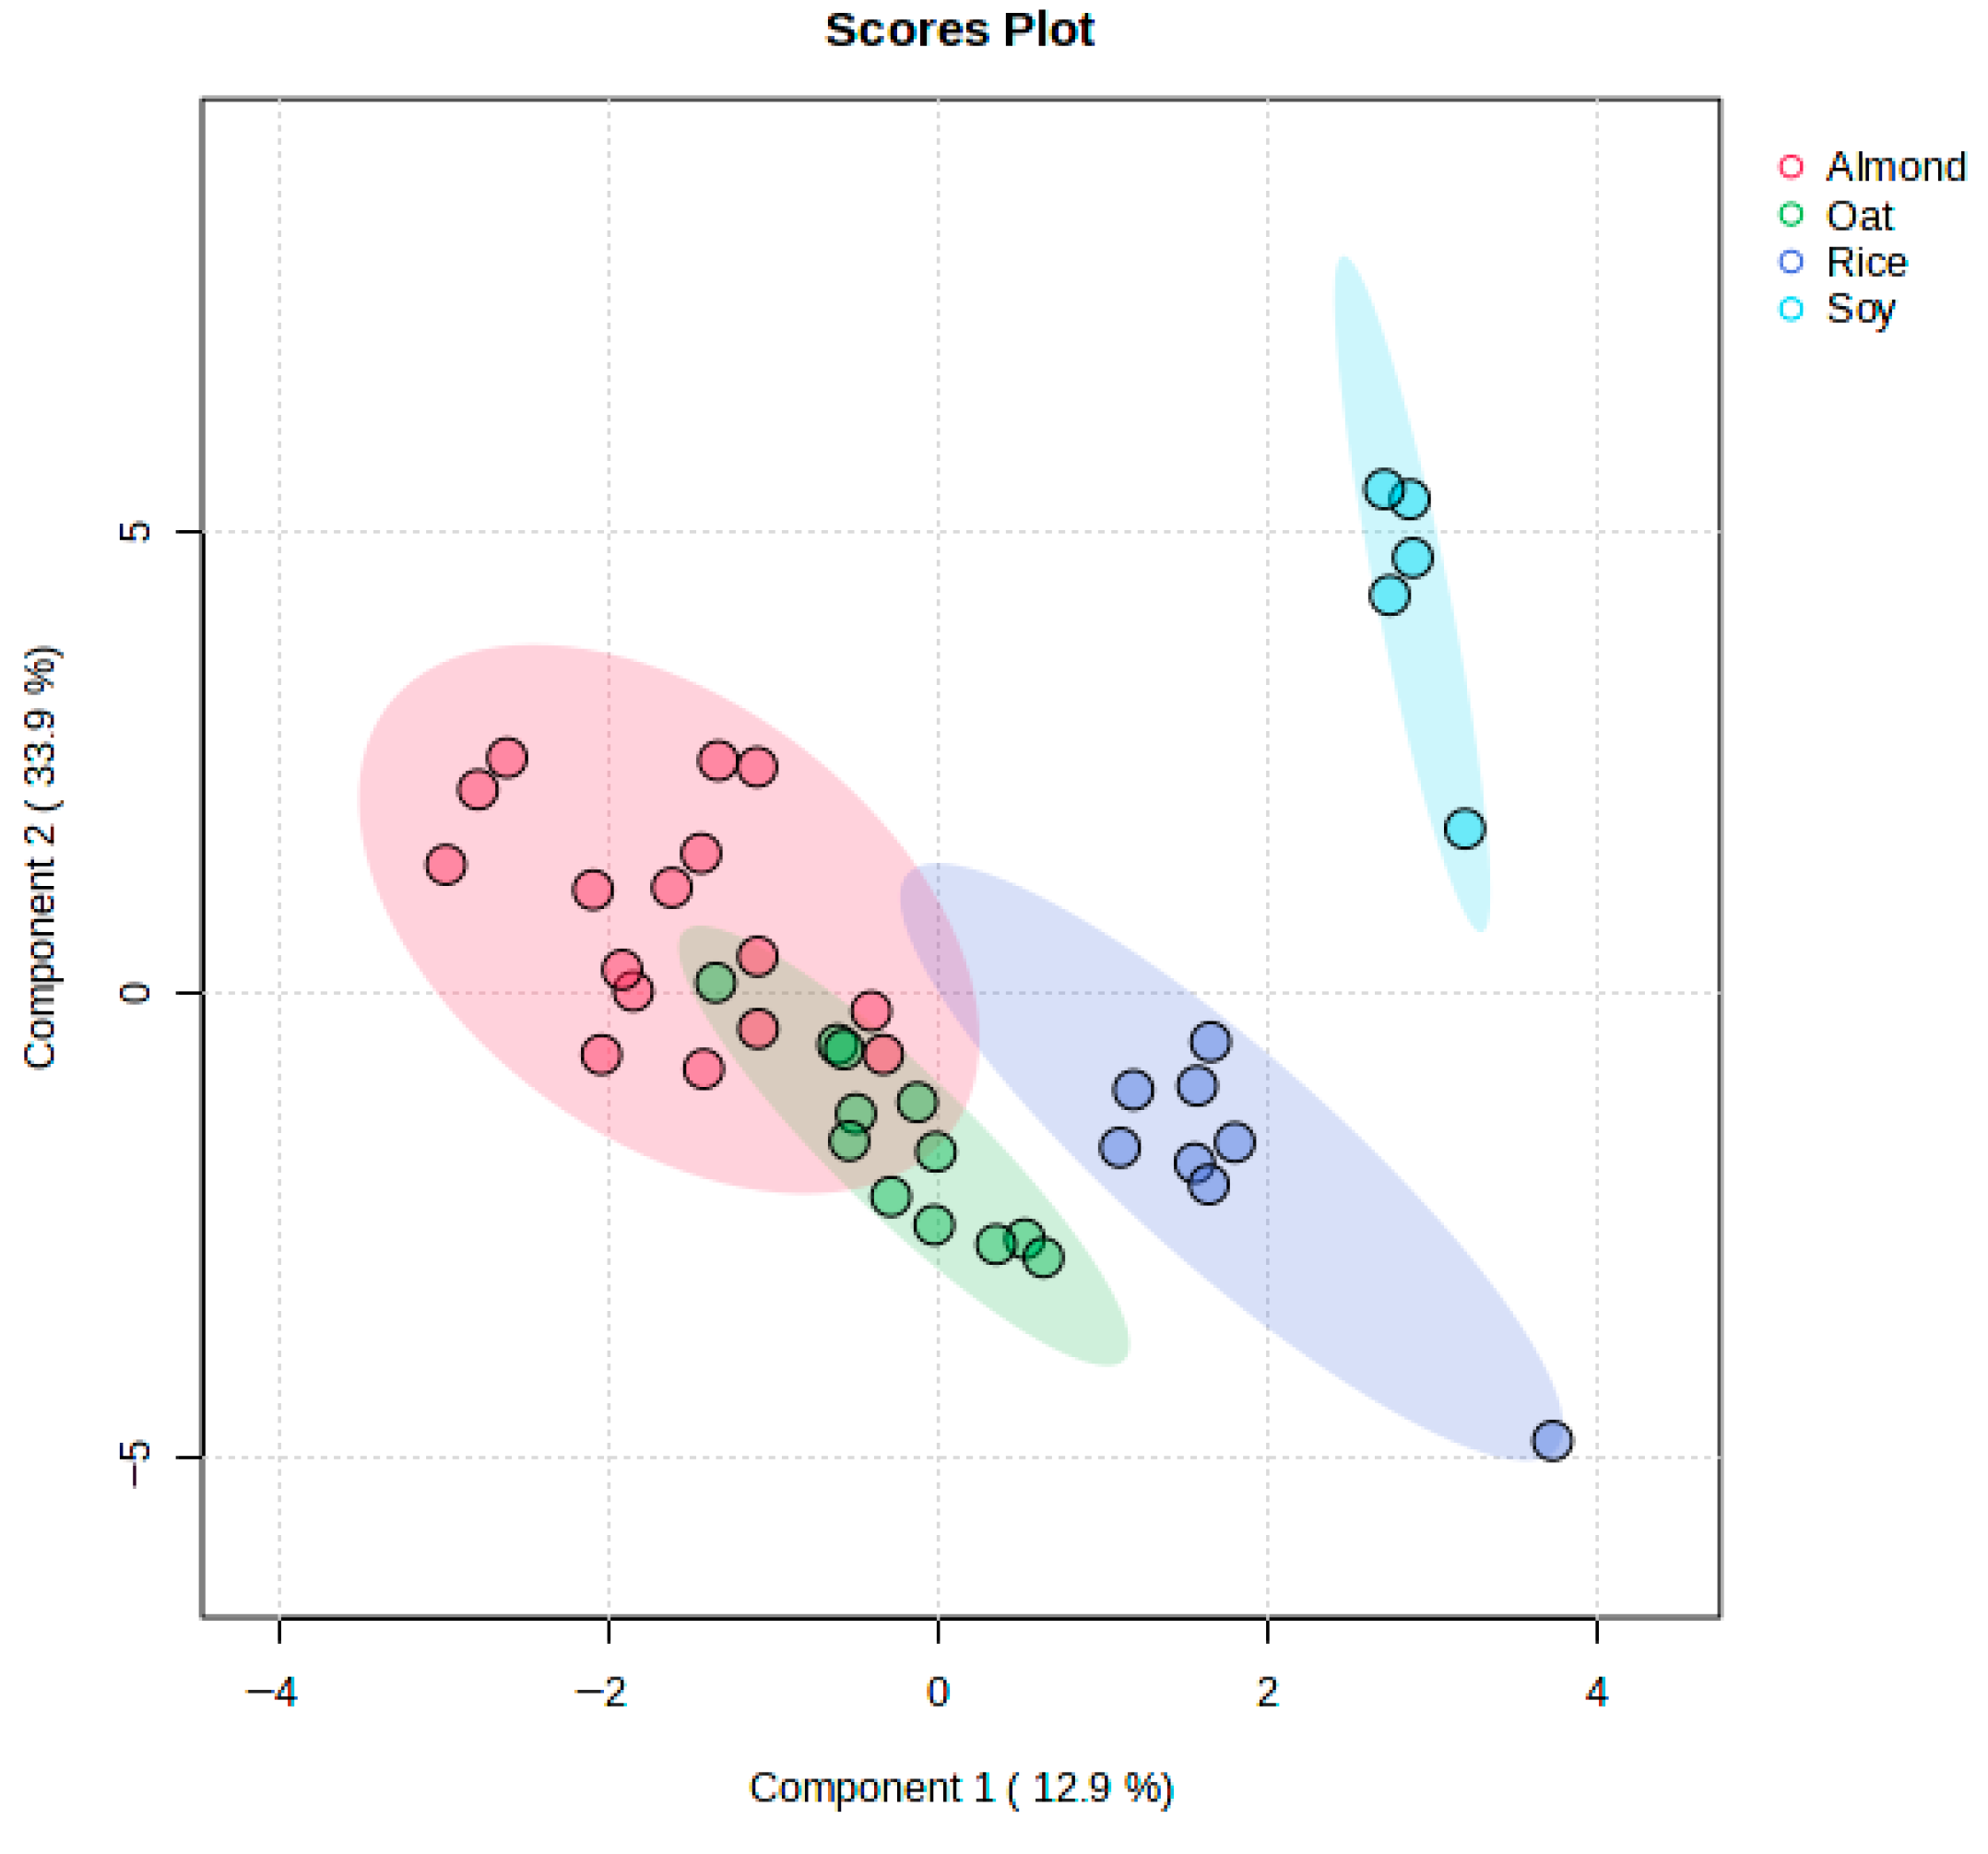
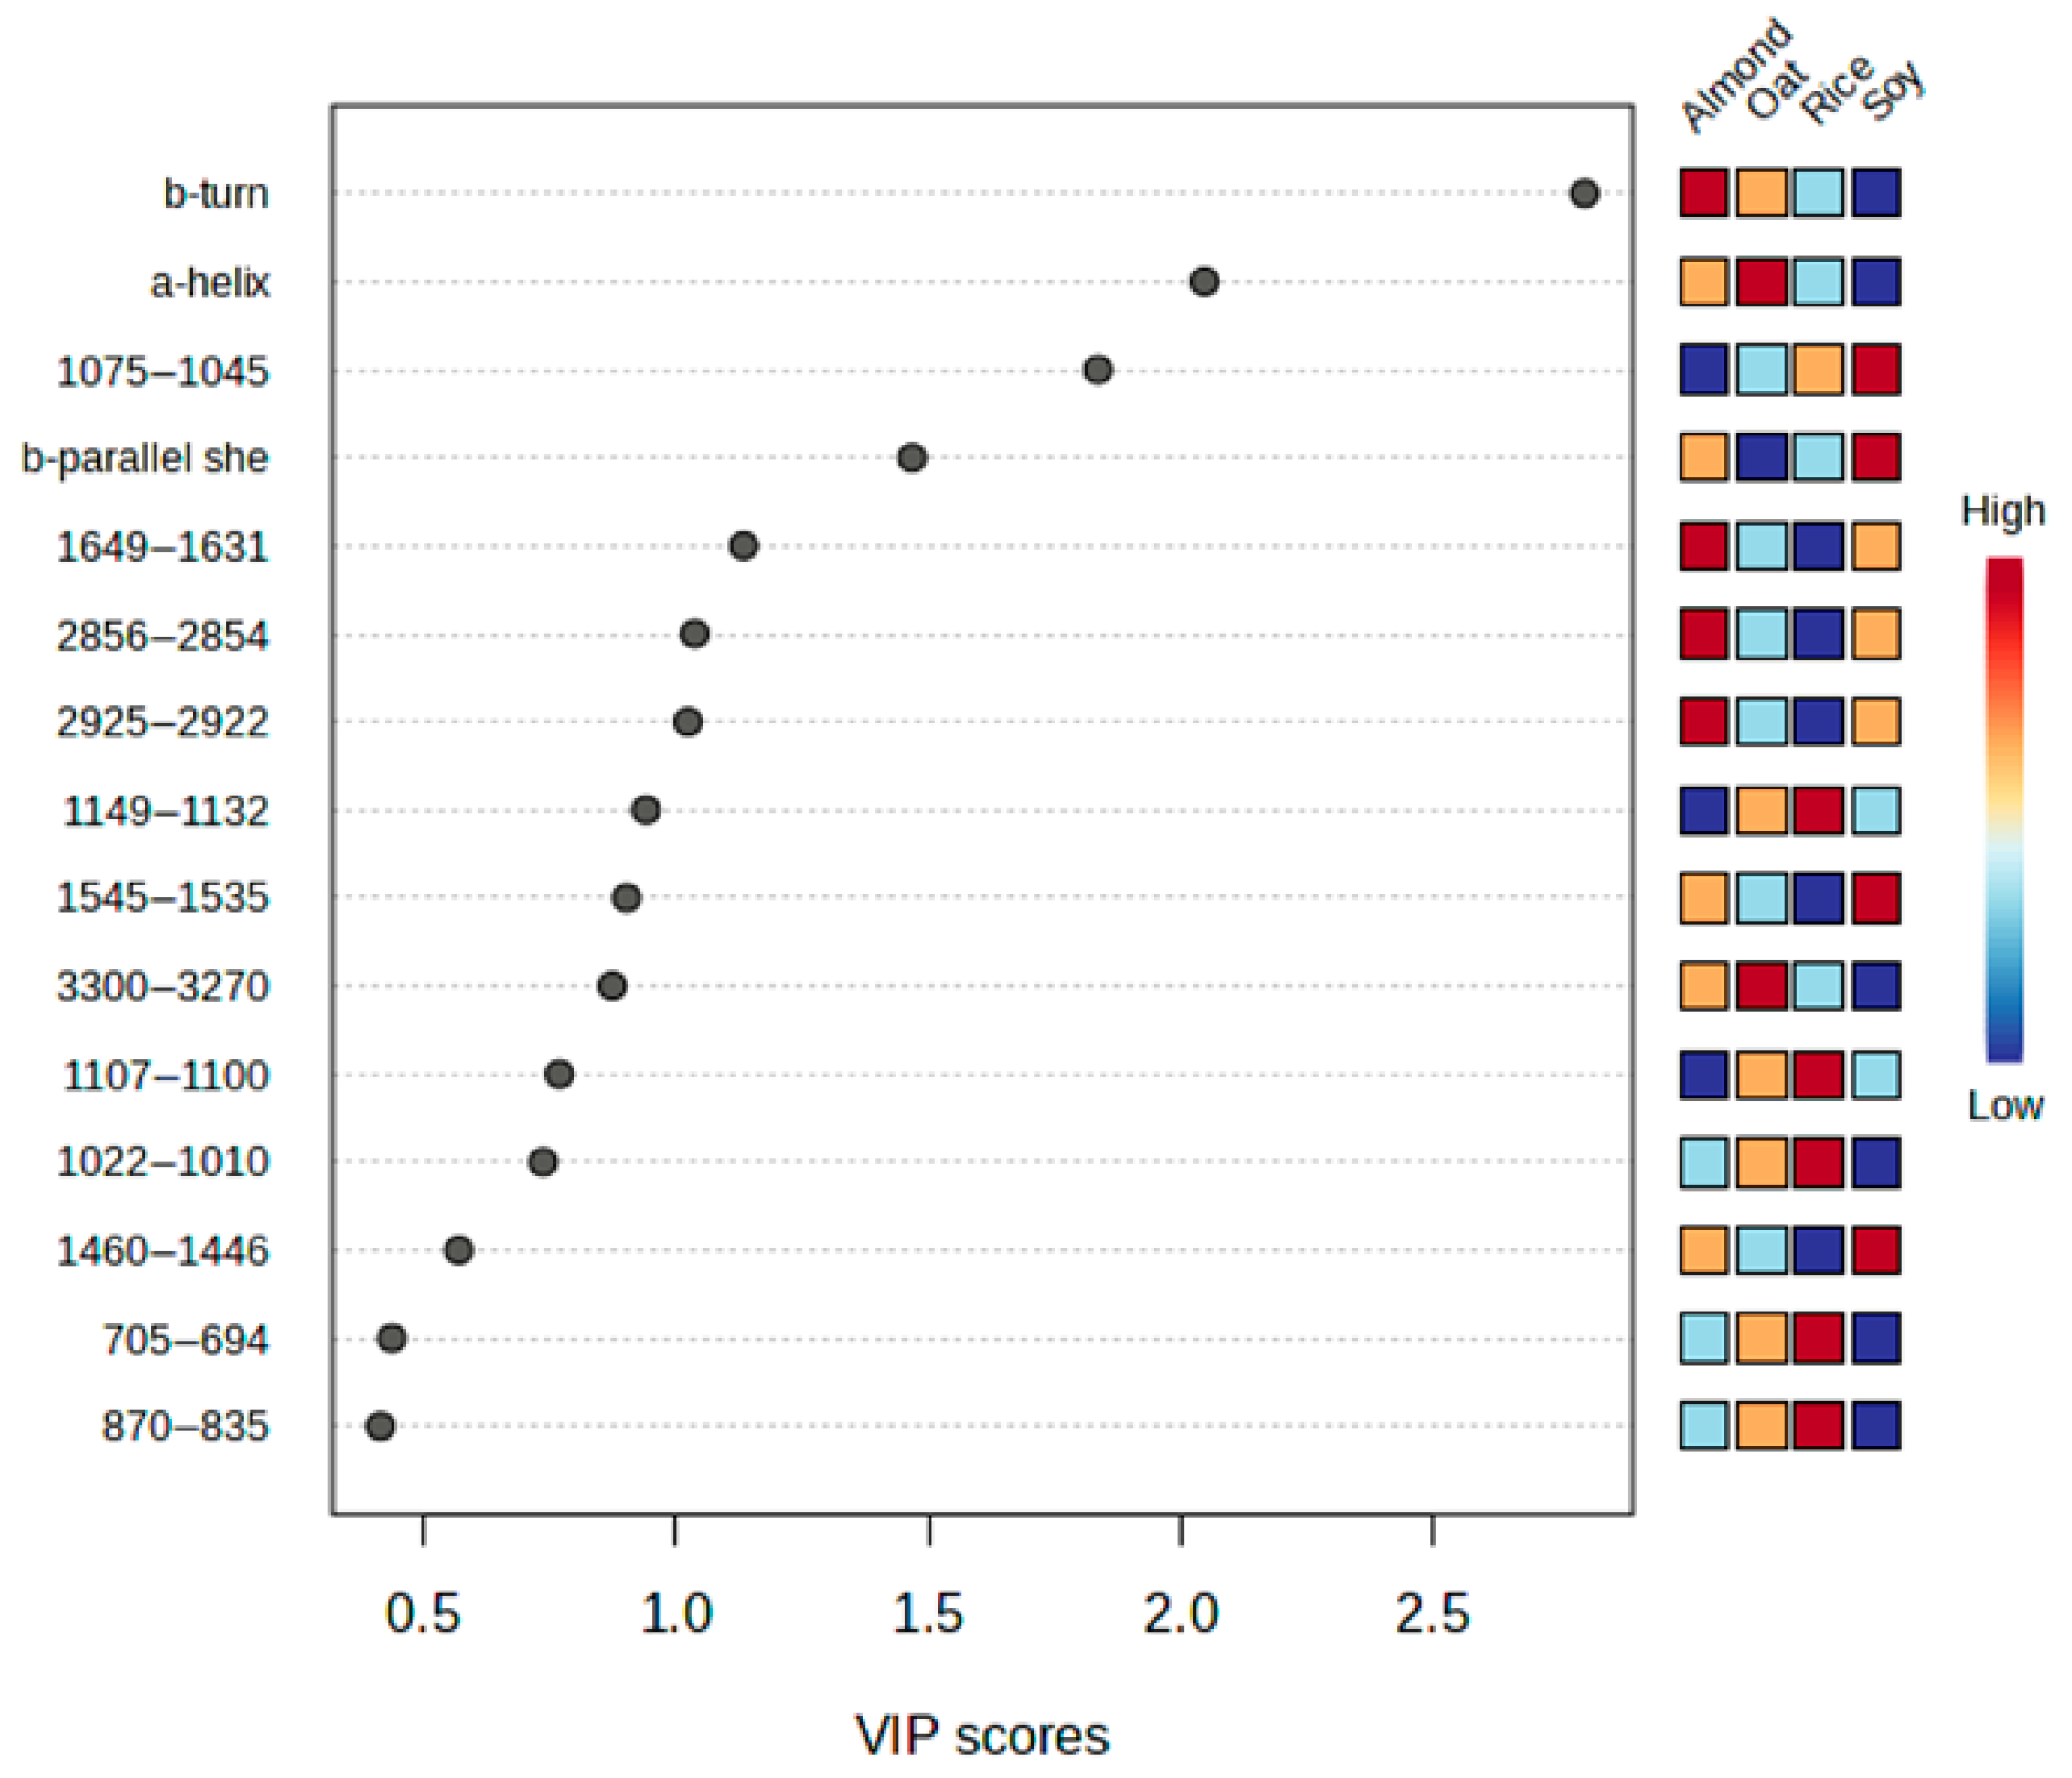
3.4. Discrimination of Plant-Based Beverages Samples Using PLS-DA

To explore the discriminatory potential of ATR-FTIR analysis across different plant-based beverages categories, partial least squares discriminant analysis (PLS-DA) was employed. The analysis included 41 samples, classified into four groups: almond (n = 16), oat (n = 12), rice (n = 8, among them white rice n = 5 and brown rice n = 3), and soy (n = 5) beverages. A total of 26 variables were used as input features—22 spectral intensities corresponding to defined wavenumber regions, and 4 protein secondary structure components (β-parallel sheet, α-helix, random coil, and β-turn). All variables were normalized using log transformation followed by auto-scaling to standardize the data.
The resulting PLS-DA score plot is presented in Figure 2, with Component 1 accounting for 12.9% and Component 2 for 33.9% of the total variance. Notably, the soy and rice samples formed distinct, non-overlapping clusters, indicating well-differentiated spectral and structural profiles. In contrast, the almond and oat beverage samples exhibited partial overlap, suggesting a higher degree of compositional similarity between these two plant-based beverages.
Variable importance in projection (VIP) score plots indicates that the β-turn secondary structure was identified as the most significant contributor to discrimination among beverages types. This was followed by α-helix secondary structure, and the spectral band at 1075–1045 cm−1 and the β-parallel sheet content (Figure 3). Model validation was carried out using 1000-fold permutation testing and cross-validation. Based on the data depicted in Figure 3, almond-based beverages exhibit prominent β-turn structures, whereas oat-based beverages display moderate contributions from α-helix structures. In contrast, soy- and rice-based beverages are characterized by notably weaker signals in both β-turn and α-helix structural elements. Yet, as presented in Figure S7, the model achieved statistically significant separation (p < 0.001) and demonstrated high classification accuracy, confirming the robustness and reliability of the PLS-DA approach for distinguishing plant-based beverages.

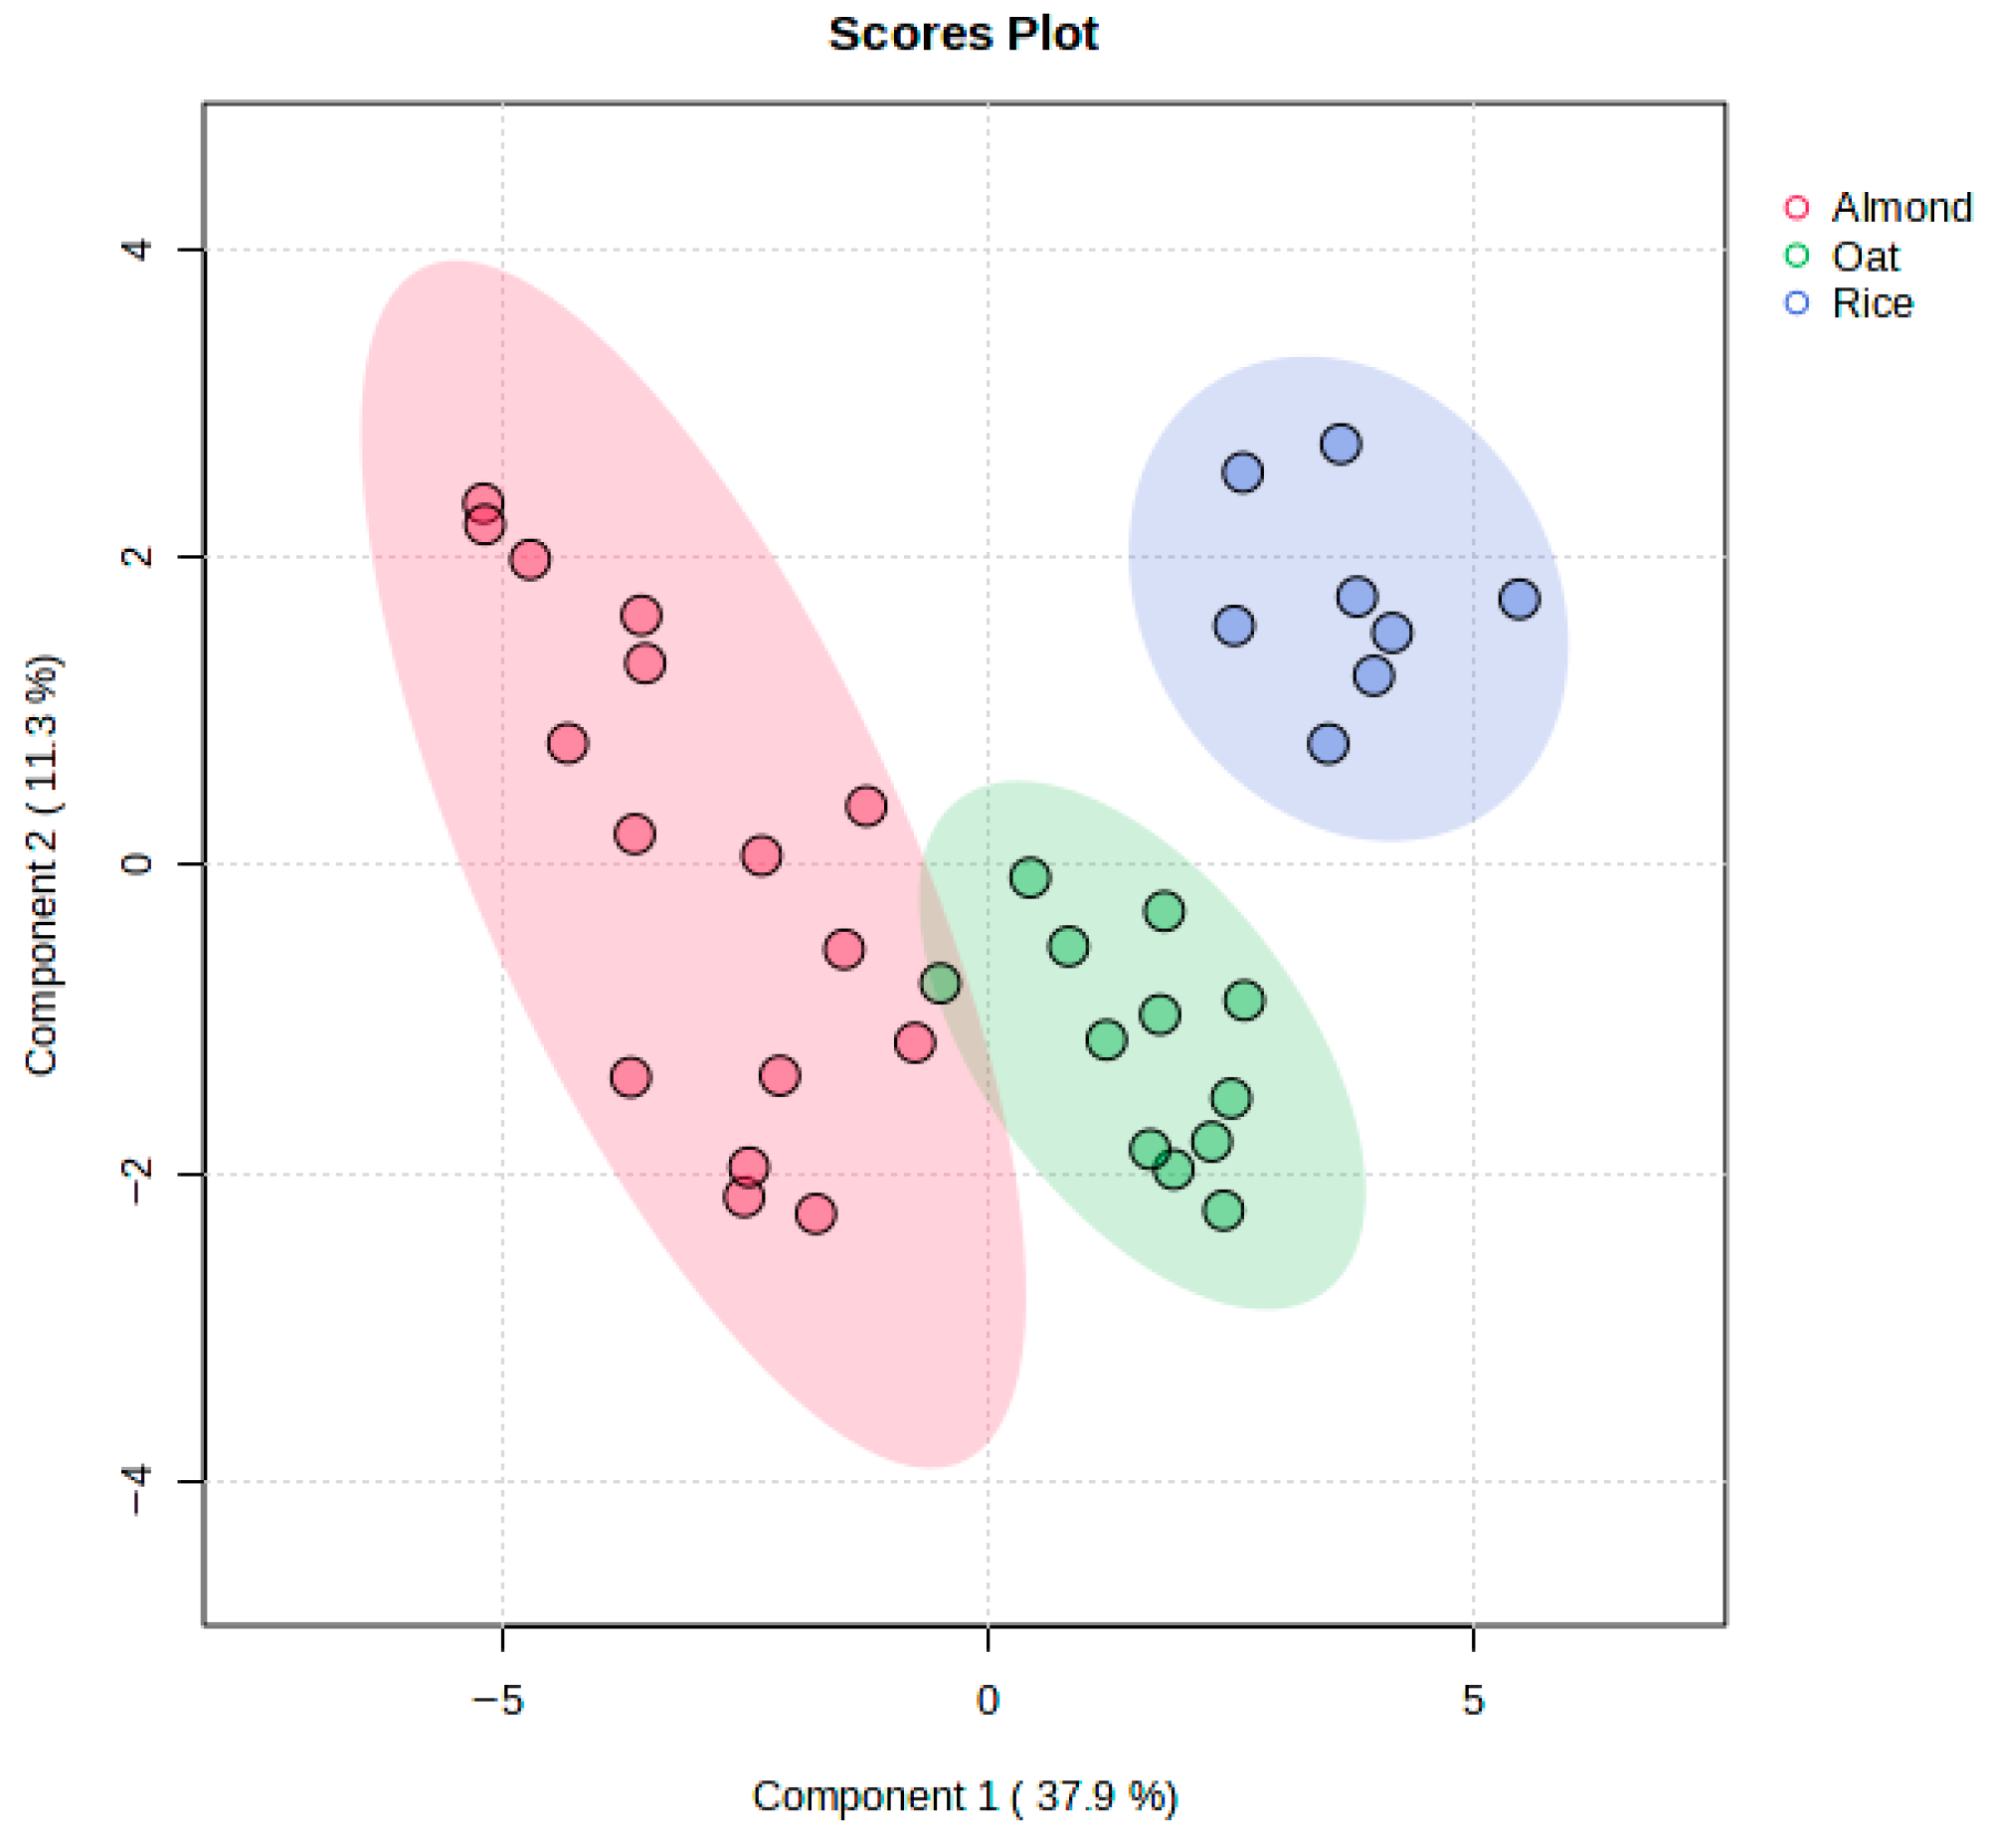
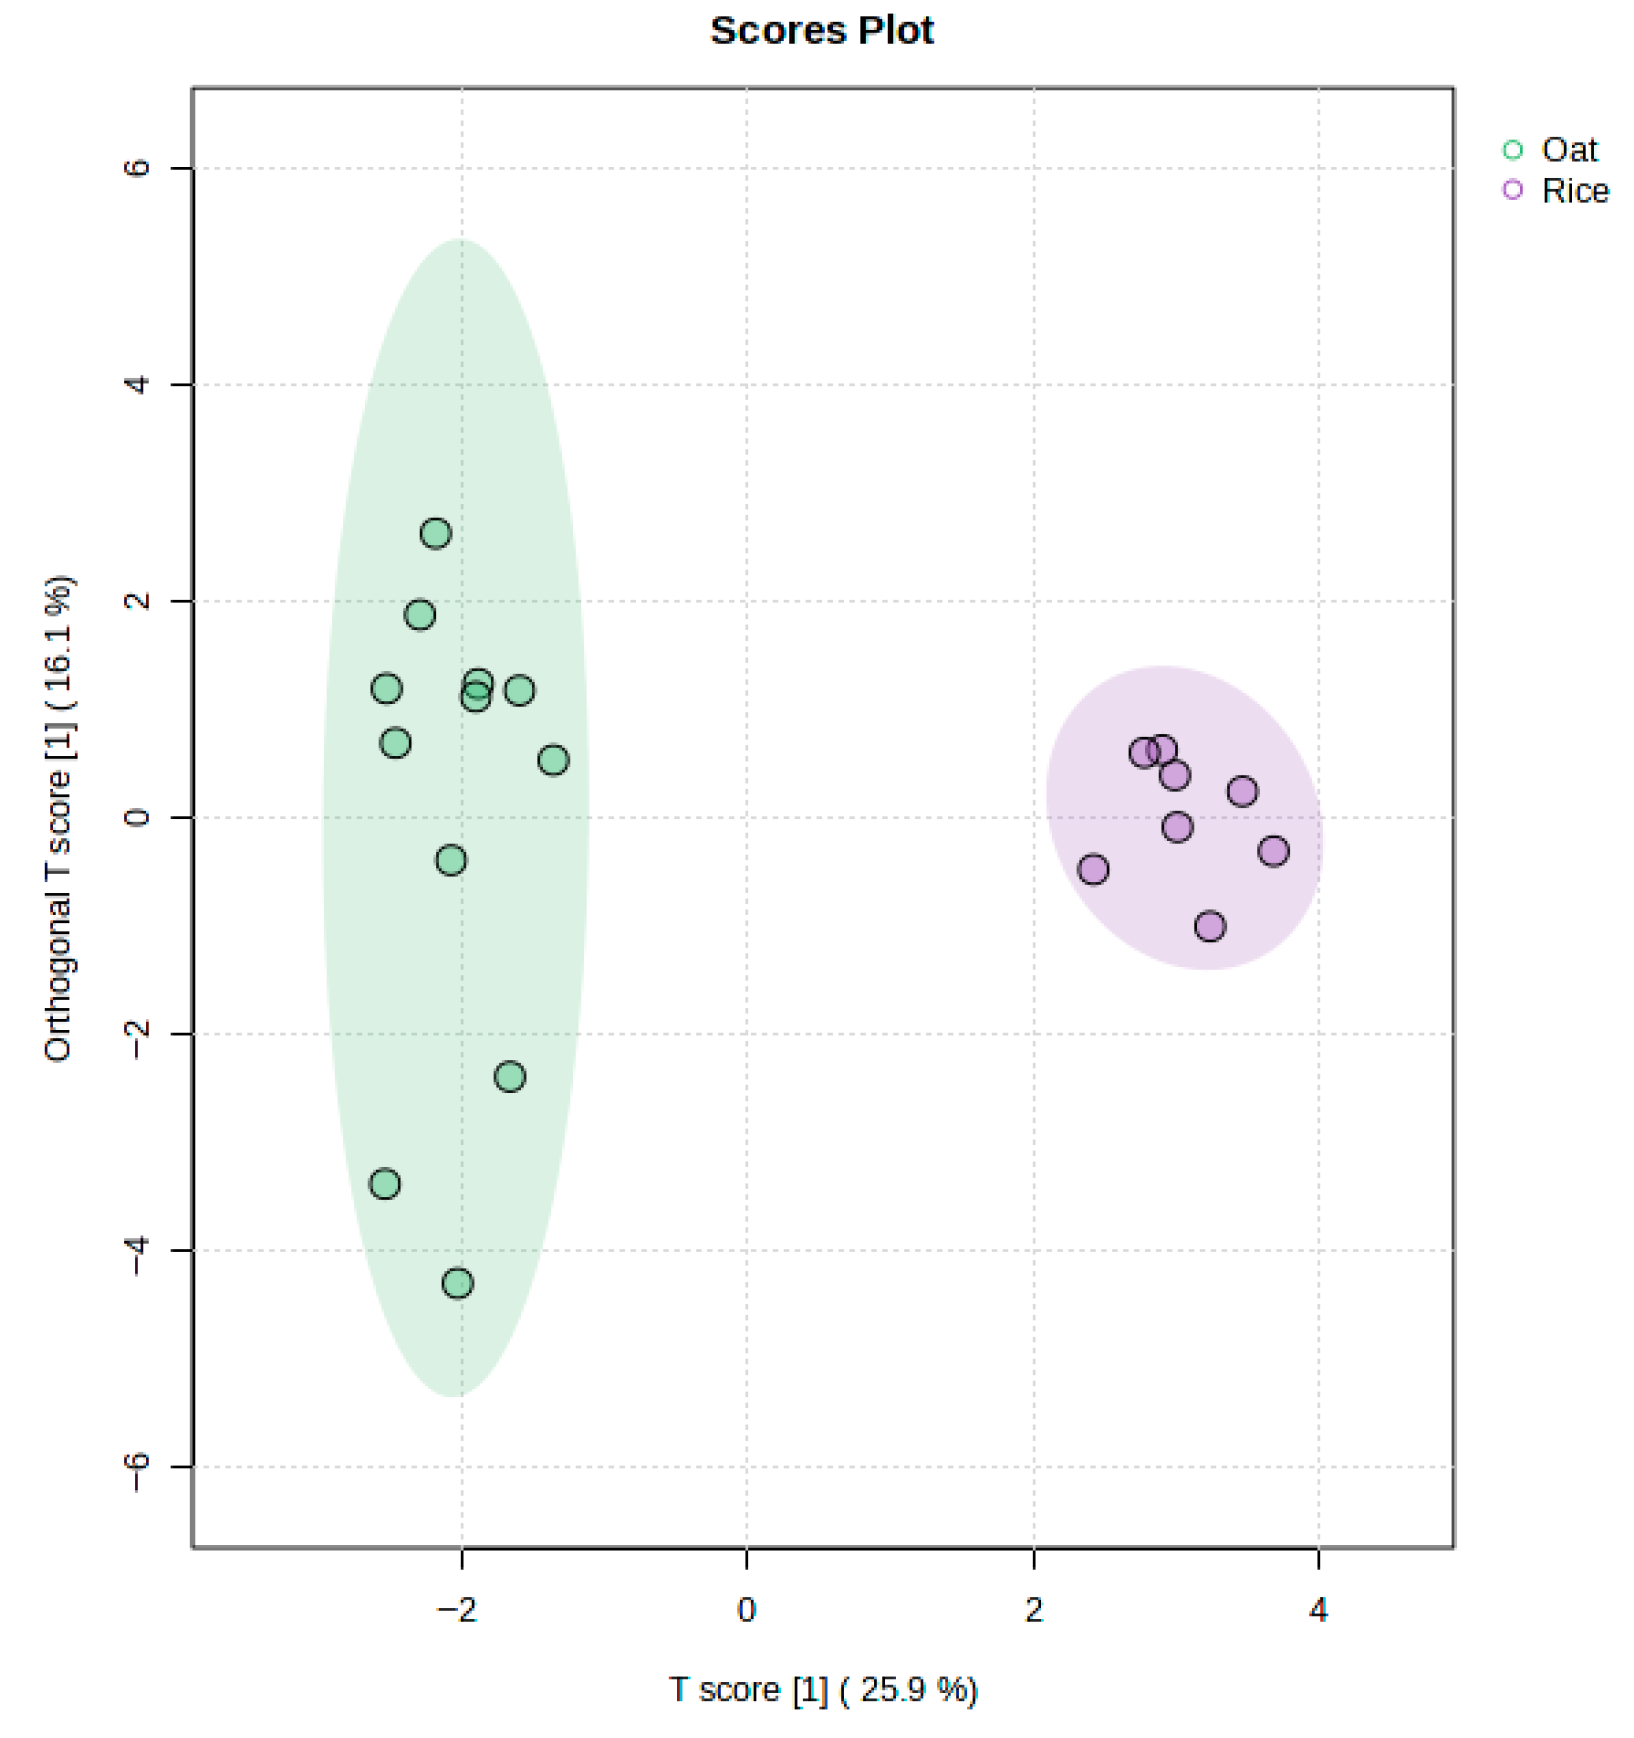
3.5. Discrimination Between Almond, Rice, and Oat Beverage Samples

While the initial PLS-DA analysis successfully differentiated between the four types of plant-based beverages, the class imbalance of the soy group raised concerns regarding potential bias or overfitting, as models can be disproportionately influenced by underrepresented groups. In this study, the soy beverage group included only five samples, which may affect both the stability of the classification model and the reliability of variable importance rankings in the first analysis. To address this limitation and evaluate the classification performance more robustly, a second PLS-DA was conducted after excluding the soy beverage samples.
The resulting score plot is presented in Figure 4. The first two components explained 37.9% and 11.3% of the total variance, respectively. The updated model showed clear and well-defined clustering for all three beverage types. In this model, almond samples were clearly positioned on the left side of the plot, while oat and rice samples clustered on the right, forming distinct but closer groups. This spatial pattern suggests that the most significant compositional differences exist between almond and the other two types, while oat and rice may share more biochemical similarities. The VIP score plot identifies the most influential discriminating features. Full model validation metrics are provided in the Supplementary Materials (Figure S8).
As presented in Figure 5, the random coil protein structure emerged as the top discriminating feature. Other significant variables included the spectral regions 1649–1631 cm−1, β-turn structure, 1365–1313 cm−1, 1545–1535 cm−1, and 2856–2854 cm−1.
Another observation resulting from Figure 4 is that a clear separation between oat and rice groups emerged along Component 2. This separation indicated that the most relevant discriminatory variance between oat and rice beverages may be captured by orthogonal component.
To better explore and isolate the specific features responsible for this separation, an orthogonal partial least squares discriminant analysis (OPLS-DA) was conducted, comparing oat (n = 12) and rice (n = 8) samples. OPLS-DA allows for the separation of variation that is predictive of class from variation that is orthogonal (unrelated), making it particularly suitable for datasets where the most meaningful discrimination lies in a secondary component. The resulting OPLS-DA model successfully differentiated the oat and rice beverage samples. This supports the interpretation that the most significant discriminating features between these two beverage types are captured orthogonally to the main component of variation (Figure 6).
To identify the key features responsible for class separation, the VIP scores were calculated. As illustrated in Figure 7, the most influential features included variables related to protein secondary structure—particularly the α-helix and β-parallel sheet protein structures, followed by the random coil, and key spectral regions such as 1649–1631 cm−1 and 667–630 cm−1.
Model performance metrics confirmed the robustness and predictive strength of the OPLS-DA model. As shown in Figure S9 (Supplementary Material), permutation testing yielded high R2Y (0.979) and Q2 (0.91) values, both statistically significant (p < 0.001). These results indicate excellent model fit and predictive reliability.
The application of ATR-FTIR spectroscopy demonstrated strong potential for the classification of plant-based beverages based on their chemical profile and protein secondary structures. Using PLS-DA, clear discrimination between almond, oat, rice, and soy beverage samples was achieved. In particular, soy and rice beverages formed distinct, non-overlapping clusters, while almond and oat samples showed partial overlap, indicating compositional similarities. These findings are in line with previous work by Brito et al. [64], who also used ATR-FTIR spectroscopy to classify almond, oat, rice, and soy drinks. Their study, based on PCA and hierarchical clustering, showed the effective clustering of oat, rice, and soy beverages, while almond drinks exhibited greater compositional variability. Our study confirms this trend, with almond samples displaying wider spread in the PLS-DA space—likely due to variability in the formulations across commercial products.
However, the present study differs by incorporating protein secondary structure data as discriminating variables alongside FTIR spectral intensities. This approach allowed us to not only classify samples based on the conventional spectral regions associated with the main nutritional components of the beverages, such as carbohydrates and lipids, but also gain insights into structural protein differences among beverages, a novel contribution to FTIR-based food products profiling.
Further refinement of the model by excluding the underrepresented soy group led to improved class separation among almond, oat, and rice beverages. Notably, almond samples were positioned on the opposite side of the primary component from oat and rice samples, highlighting a major compositional axis of separation. Additionally, an OPLS-DA focused on oat vs. rice beverages revealed that the most relevant discrimination occurred along Component 2. This vertical separation suggested that the compositional differences between these two cereal-based beverages were not dominant but orthogonal to the main axis. The OPLS-DA model achieved strong classification accuracy (R2Y = 0.979, Q2 = 0.91, p < 0.001) and revealed protein structures—especially α-helix, β-parallel sheet, and random coil content—as key variables, alongside carbohydrate-sensitive spectral regions (e.g., 1649–1631 cm−1, 667–630 cm−1).
Several previous studies have demonstrated that ATR-FTIR spectroscopy, particularly when combined with chemometric techniques, is effective for product classification and authenticity assessment in similar food matrices. For example, the physicochemical stability of oat-based beverages was successfully assessed using spectroscopic methods such as FTIR and NIR combined with multivariate data analysis [44]. Moreover, Greulich et al. [50] reported that FTIR spectroscopy successfully monitored carbohydrate and protein fluctuations during the fermentation of oat- and pea-based yogurt with multivariate modeling techniques. Additionally, Giang et al. [43] utilized ATR-FTIR spectroscopy alongside chemometrics to classify 42 commercial rice samples from seven different varieties. Furthermore, Tsapou et al. [65] successfully applied ATR-FTIR to classify Greek grape marc spirits based on geographical origin and production method. Similarly, ATR-FTIR has been used to differentiate maize flours derived from distinct landraces in Brazil [66]. In addition, Balan et al. [67,68] applied ATR-FTIR spectroscopy combined with chemometrics to detect formalin and sucrose adulteration in cow milk. These examples illustrate the broad applicability of FTIR-based spectral fingerprinting for food discrimination.
In the present study, both spectral intensities and protein secondary structure were included as variables in the classification models. This combination of chemical profile and protein structural information may support more detailed classification and could be applied in future work related to product verification, quality control, or formulation comparison.

4. Conclusions

This study employed a comprehensive analytical strategy integrating ATR-FTIR spectroscopy, image texture analysis, and chemometrics to characterize and classify plant-based beverages available in the Greek market. Through the analysis of 41 samples representing almond, oat, brown rice, and soy-based beverages, significant differences in chemical composition, structural properties, and spectral fingerprints were revealed. The intensities of the ATR-FTIR spectral bands associated with the lipids (2922, 2854 cm−1), proteins (1649–1631, 1545–1535 cm−1), and carbohydrates (1157, 1022–1010 cm−1), present in the beverages, were highly correlated with the declared macronutrient levels on the product labels. This confirms the ability of FTIR to reflect compositional variation. Multivariate analysis via PLS-DA successfully discriminated beverage types, with protein secondary structure components—particularly β-turn, α-helix, and random coil—emerging as major contributors to class separation. Beyond simple statistical grouping, chemometric tools such as PLS-DA and OPLS-DA provided a broader interpretative framework by revealing underlying formulation logic, processing influences, and potential quality markers. While univariate methods highlight isolated compositional traits, these multivariate techniques uncover hidden relationships between spectral and structural data, offering a more integrated understanding of the product matrix. Notably, the ranking of specific protein secondary structures and vibrational bands as top discriminators reinforces the practical value of molecular-level profiling for beverage categorization. Excluding the underrepresented soy category enhanced the robustness of the model and shifted the discriminant features, highlighting the importance of balanced sample representation in chemometric modeling. In parallel, image analysis based on microscopy provided insight into emulsion homogeneity, showing that samples with a higher sugar content had more uniform microstructures. These results were consistent with the spectral data, highlighting the importance of combining physical and chemical descriptors to evaluate products comprehensively. Overall, this study confirms the usefulness of FTIR spectroscopy supported by multivariate statistics and image analysis as a rapid, non-destructive and effective tool for classifying and assessing the quality of plant-based beverages. While further validation on larger and more diverse sample sets is warranted, this methodology may be valuable for supporting quality control and formulation consistency in the plant-based beverage sector. However, its practical application in industrial settings may require the consideration of certain challenges, including equipment cost, the need for skilled personnel for spectral interpretation, and standardization across product lines. Despite these limitations, the approach presents a promising analytical framework for non-destructive evaluation in food innovation and monitoring.

Supplementary Materials

The following supporting information can be downloaded at https://www.mdpi.com/article/10.3390/appliedchem5030016/s1, Figure S1: Box plots showing the variation in the textural features of soy beverages’ images: (a) mean, (b) standard deviation, (c) skewness, (d) kurtosis, (e) contrast, (f) dissimilarity, (g) energy, (h) homogeneity, (i) correlation, (j) angular second moment, (k) short run emphasis, (l) long run emphasis, (m) gray level non-uniformity, (n) run length non-uniformity, and (o) run percentage; Figure S2: Box plots showing the variation in the textural features of rice beverages’ images: (a) mean, (b) standard deviation, (c) skewness, (d) kurtosis, (e) contrast, (f) dissimilarity, (g) energy, (h) homogeneity, (i) correlation, (j) angular second moment, (k) short run emphasis, (l) long run emphasis, (m) gray level non-uniformity, (n) run length non-uniformity, and (o) run percentage; Figure S3: Box plots showing the variation in the textural features of brown rice beverages’ images: (a) mean, (b) standard deviation, (c) skewness, (d) kurtosis, (e) contrast, (f) dissimilarity, (g) energy, (h) homogeneity, (i) correlation, (j) angular second moment, (k) short run emphasis, (l) long run emphasis, (m) gray level non-uniformity, (n) run length non-uniformity, and (o) run percentage; Figure S4: Box plots showing the variation in the textural features of oat beverages’ images: (a) mean, (b) standard deviation, (c) skewness, (d) kurtosis, (e) contrast, (f) dissimilarity, (g) energy, (h) homogeneity, (i) correlation, (j) angular second moment, (k) short run emphasis, (l) long run emphasis, (m) gray level non-uniformity, (n) run length non-uniformity, and (o) run percentage; Figure S5: Box plots showing the variation in the textural features of almond beverages’ images: (a) mean, (b) standard deviation, (c) skewness, (d) kurtosis, (e) contrast, (f) dissimilarity, (g) energy, (h) homogeneity, (i) correlation, (j) angular second moment, (k) short run emphasis, (l) long run emphasis, (m) gray level non-uniformity, (n) run length non-uniformity, and (o) run percentage; Figure S6: Representative overlay of ATR-FTIR spectra for soy, almond, oat, rice, and brown rice-based beverages; Figure S7: Permutation test results validating the PLS-DA model, including classification accuracy and statistical significance; Figure S8: Permutation test and cross-validation results validating the revised PLS-DA model (excluding soy group); Figure S9: Permutation test results for the OPLS-DA model comparing oat and rice beverages; Table S1: Labeling information of plant-based beverage samples.

Author Contributions

Conceptualization, V.J.S.; methodology, P.C., S.A., G.L., S.J.K., D.C., V.J.S. and E.K.; software, P.C., G.L. and D.C.; validation, P.C., S.J.K., D.C., V.J.S. and E.K.; formal analysis, P.C., S.A. and G.L.; investigation, P.C., S.A., G.L., S.J.K., D.C., V.J.S. and E.K.; data curation, P.C., S.A., G.L., D.C. and V.J.S.; writing—original draft preparation, P.C., G.L., S.J.K., D.C., V.J.S. and E.K.; writing—review and editing, P.C., G.L., S.J.K., D.C., V.J.S. and E.K.; visualization, P.C., S.J.K. and D.C.; supervision, S.J.K., V.J.S. and E.K.; project administration, V.J.S. All authors have read and agreed to the published version of the manuscript.

Funding

This research received no external funding.

Institutional Review Board Statement

Not applicable.

Informed Consent Statement

Not applicable.

Data Availability Statement

All the data presented in this study are available within the manuscript and the Supplementary Materials.

Acknowledgments

We gratefully acknowledge Andriana Lazou and Natalia A. Stavropoulou, University of West Attica, for their kind assistance with the freeze-drying process.

Conflicts of Interest

The authors declare no conflicts of interest.

References

  1. Milani, F.X.; Nutter, D.; Thoma, G. Invited Review: Environmental Impacts of Dairy Processing and Products: A Review. J. Dairy Sci. 2011, 94, 4243–4254. [Google Scholar] [CrossRef] [PubMed]
  2. Warren, V.; Bell, R.; Bruning-Mescher, S. Plant-Based Milk Alternatives: Consumer Needs and Marketing Strategies. In Plant-Based Food Consumption; Elsevier: Amsterdam, The Netherlands, 2024; pp. 153–177. ISBN 978-0-323-98828-5. [Google Scholar]
  3. Velangi, M.; Savla, M. Role of Plant Based Milk Alternatives as a Functional Beverage: A Review. Int. J. Health Sci. Res. 2022, 12, 273–281. [Google Scholar] [CrossRef]
  4. Ismail, M.M. Chemical Composition, Sensory Evaluation and Starter Activity in Cow, Soy, Peanut and Rice Milk. J. Nutr. Health Food Eng. 2016, 5, 00175. [Google Scholar] [CrossRef]
  5. Martínez-Villaluenga, C.; Peñas, E. Health Benefits of Oat: Current Evidence and Molecular Mechanisms. Curr. Opin. Food Sci. 2017, 14, 26–31. [Google Scholar] [CrossRef]
  6. Singh, R.; De, S.; Belkheir, A. Avena sativa (Oat), A Potential Neutraceutical and Therapeutic Agent: An Overview. Crit. Rev. Food Sci. Nutr. 2013, 53, 126–144. [Google Scholar] [CrossRef] [PubMed]
  7. Bocker, R.; Silva, E.K. Innovative Technologies for Manufacturing Plant-Based Non-Dairy Alternative Milk and Their Impact on Nutritional, Sensory and Safety Aspects. Future Foods 2022, 5, 100098. [Google Scholar] [CrossRef]
  8. Romulo, A. Food Processing Technologies Aspects on Plant-Based Milk Manufacturing: Review. IOP Conf. Ser. Earth Environ. Sci. 2022, 1059, 012064. [Google Scholar] [CrossRef]
  9. Mishra, S.; Singh, R.; Upadhyay, A.; Mishra, S.; Shukla, S. Emerging Trends in Processing for Cereal and Legume-Based Beverages: A Review. Future Foods 2023, 8, 100257. [Google Scholar] [CrossRef]
  10. Curl, S.; Rivero-Mendoza, D.; Dahl, W.J. Plant-Based Milks: Hemp. EDIS 2020, 2020, 5. [Google Scholar] [CrossRef]
  11. Boukid, F. Oat Proteins as Emerging Ingredients for Food Formulation: Where We Stand? Eur. Food Res. Technol. 2021, 247, 535–544. [Google Scholar] [CrossRef]
  12. Chalupa-Krebzdak, S.; Long, C.J.; Bohrer, B.M. Nutrient Density and Nutritional Value of Milk and Plant-Based Milk Alternatives. Int. Dairy J. 2018, 87, 84–92. [Google Scholar] [CrossRef]
  13. Medic, J.; Atkinson, C.; Hurburgh, C.R. Current Knowledge in Soybean Composition. J. Am. Oil Chem. Soc. 2014, 91, 363–384. [Google Scholar] [CrossRef]
  14. Al Tamimi, J.Z. Effects of Almond Milk on Body Measurements and Blood Pressure. Food Nutr. Sci. 2016, 7, 466–471. [Google Scholar] [CrossRef]
  15. Tomishima, H.; Luo, K.; Mitchell, A.E. The Almond (Prunus dulcis): Chemical Properties, Utilization, and Valorization of Coproducts. Annu. Rev. Food Sci. Technol. 2022, 13, 145–166. [Google Scholar] [CrossRef] [PubMed]
  16. Gul, O.; Saricaoglu, F.T.; Mortas, M.; Atalar, I.; Yazici, F. Effect of High Pressure Homogenization (HPH) on Microstructure and Rheological Properties of Hazelnut Milk. Innov. Food Sci. Emerg. Technol. 2017, 41, 411–420. [Google Scholar] [CrossRef]
  17. McClements, D.J.; Newman, E.; McClements, I.F. Plant-based Milks: A Review of the Science Underpinning Their Design, Fabrication, and Performance. Comp. Rev. Food Sci. Food Safe 2019, 18, 2047–2067. [Google Scholar] [CrossRef] [PubMed]
  18. Rocha, J.D.C.G.; Mendonça, A.C.; Viana, K.W.C.; Maia, M.D.P.; Carvalho, A.F.D.; Minim, V.P.R.; Stringheta, P.C. Beverages Formulated with Whey Protein and Added Lutein. Cienc. Rural 2017, 47, e20151606. [Google Scholar] [CrossRef]
  19. Abe-Inge, V.; Aidoo, R.; Moncada De La Fuente, M.; Kwofie, E.M. Plant-Based Dietary Shift: Current Trends, Barriers, and Carriers. Trends Food Sci. Technol. 2024, 143, 104292. [Google Scholar] [CrossRef]
  20. Coşkun, N.; Sarıtaş, S.; Jaouhari, Y.; Bordiga, M.; Karav, S. The Impact of Freeze Drying on Bioactivity and Physical Properties of Food Products. Appl. Sci. 2024, 14, 9183. [Google Scholar] [CrossRef]
  21. Christodoulou, P.; Ladika, G.; Tsiantas, K.; Kritsi, E.; Tsiaka, T.; Cavouras, D.; Zoumpoulakis, P.; Sinanoglou, V.J. Quality Assessment of Greenhouse-Cultivated Cucumbers (Cucumis sativus) during Storage Using Instrumental and Image Analyses. Appl. Sci. 2024, 14, 8676. [Google Scholar] [CrossRef]
  22. Sinanoglou, V.J.; Tsiaka, T.; Aouant, K.; Mouka, E.; Ladika, G.; Kritsi, E.; Konteles, S.J.; Ioannou, A.-G.; Zoumpoulakis, P.; Strati, I.F.; et al. Quality Assessment of Banana Ripening Stages by Combining Analytical Methods and Image Analysis. Appl. Sci. 2023, 13, 3533. [Google Scholar] [CrossRef]
  23. Ladika, G.; Strati, I.F.; Tsiaka, T.; Cavouras, D.; Sinanoglou, V.J. On the Assessment of Strawberries’ Shelf-Life and Quality, Based on Image Analysis, Physicochemical Methods, and Chemometrics. Foods 2024, 13, 234. [Google Scholar] [CrossRef] [PubMed]
  24. Kritsi, E.; Ladika, G.; Stavropoulou, N.A.; Oikonomakou, M.; Ioannou, A.-G.; Christodoulou, P.; Konteles, S.J.; Cavouras, D.; Sinanoglou, V.J. Evaluation of the Quality Changes in Three Commercial Pastourma Samples during Refrigerated Storage Using Physicochemical, Microbiological, and Image Analyses Combined with Chemometrics. Foods 2024, 13, 1017. [Google Scholar] [CrossRef] [PubMed]
  25. Cichońska, P.; Ziarno, M. Legumes and Legume-Based Beverages Fermented with Lactic Acid Bacteria as a Potential Carrier of Probiotics and Prebiotics. Microorganisms 2021, 10, 91. [Google Scholar] [CrossRef] [PubMed]
  26. Saleh, A.S.M.; Wang, P.; Wang, N.; Yang, L.; Xiao, Z. Brown Rice Versus White Rice: Nutritional Quality, Potential Health Benefits, Development of Food Products, and Preservation Technologies. Comp. Rev. Food Sci. Food Safe 2019, 18, 1070–1096. [Google Scholar] [CrossRef] [PubMed]
  27. Ravichanthiran, K.; Ma, Z.F.; Zhang, H.; Cao, Y.; Wang, C.W.; Muhammad, S.; Aglago, E.K.; Zhang, Y.; Jin, Y.; Pan, B. Phytochemical Profile of Brown Rice and Its Nutrigenomic Implications. Antioxidants 2018, 7, 71. [Google Scholar] [CrossRef] [PubMed]
  28. Latifah, R.N.; Setiawan, C. Increase of Shelf Life Stability and Kinetics Study of Type 1 Brown Rice Milk through Addition of Alginate Extract from Sargassum Binderi. Food Sci. J. 2019, 1, 83. [Google Scholar] [CrossRef]
  29. Hidalgo-Fuentes, B.; de Jesús-José, E.; Cabrera-Hidalgo, A.d.J.; Sandoval-Castilla, O.; Espinosa-Solares, T.; González-Reza, R.M.; Zambrano-Zaragoza, M.L.; Liceaga, A.M.; Aguilar-Toalá, J.E. Plant-Based Fermented Beverages: Nutritional Composition, Sensory Properties, and Health Benefits. Foods 2024, 13, 844. [Google Scholar] [CrossRef] [PubMed]
  30. Munekata, P.E.S.; Domínguez, R.; Budaraju, S.; Roselló-Soto, E.; Barba, F.J.; Mallikarjunan, K.; Roohinejad, S.; Lorenzo, J.M. Effect of Innovative Food Processing Technologies on the Physicochemical and Nutritional Properties and Quality of Non-Dairy Plant-Based Beverages. Foods 2020, 9, 288. [Google Scholar] [CrossRef] [PubMed]
  31. Fernandes, F.A.; Roriz, C.; Calhelha, R.C.; Rodrigues, P.; Pires, T.C.S.P.; Prieto, M.A.; Ferreira, I.C.F.R.; Barros, L.; Heleno, S.A. Valorization of Natural Resources—Development of a Functional Plant-Based Beverage. Food Chem. 2025, 472, 142813. [Google Scholar] [CrossRef] [PubMed]
  32. Tobolková, B.; Durec, J. Colour Descriptors for Plant-Based Milk Alternatives Discrimination. J. Food Sci. Technol. 2023, 60, 2497–2501. [Google Scholar] [CrossRef] [PubMed]
  33. Patra, T.; Rinnan, Å.; Olsen, K. The Physical Stability of Plant-Based Drinks and the Analysis Methods Thereof. Food Hydrocoll. 2021, 118, 106770. [Google Scholar] [CrossRef]
  34. Kayeye, T.N. Particle Size and Stability of Plant-Based Milks—Insights from Various Analytical Techniques. Master’s Thesis, Macquarie University, Sydney, NSW, Australia, 2023. [Google Scholar]
  35. Maskan, M.; Göǧüş, F. Effect of Sugar on the Rheological Properties of Sunflower Oil–Water Emulsions. J. Food Eng. 2000, 43, 173–177. [Google Scholar] [CrossRef]
  36. Pirsa, S.; Hafezi, K. Hydrocolloids: Structure, Preparation Method, and Application in Food Industry. Food Chem. 2023, 399, 133967. [Google Scholar] [CrossRef] [PubMed]
  37. Zhang, X.; Wang, Q.; Liu, Z.; Zhi, L.; Jiao, B.; Hu, H.; Ma, X.; Agyei, D.; Shi, A. Plant Protein-Based Emulsifiers: Mechanisms, Techniques for Emulsification Enhancement and Applications. Food Hydrocoll. 2023, 144, 109008. [Google Scholar] [CrossRef]
  38. Nandiyanto, A.B.D.; Oktiani, R.; Ragadhita, R. How to Read and Interpret FTIR Spectroscope of Organic Material. Indones. J. Sci. Technol. 2019, 4, 97. [Google Scholar] [CrossRef]
  39. Kozłowicz, K.; Różyło, R.; Gładyszewska, B.; Matwijczuk, A.; Gładyszewski, G.; Chocyk, D.; Samborska, K.; Piekut, J.; Smolewska, M. Identification of Sugars and Phenolic Compounds in Honey Powders with the Use of GC–MS, FTIR Spectroscopy, and X-Ray Diffraction. Sci. Rep. 2020, 10, 16269. [Google Scholar] [CrossRef] [PubMed]
  40. Vladimír, M.; Matwijczuk, A.P.; Niemczynowicz, A.; Kycia, R.A.; Karcz, D.; Gładyszewska, B.; Ślusarczyk, L.; Burg, P. Chemometric Approach to Characterization of the Selected Grape Seed Oils Based on Their Fatty Acids Composition and FTIR Spectroscopy. Sci. Rep. 2021, 11, 19256. [Google Scholar] [CrossRef] [PubMed]
  41. De Souza, T.R.P.; Olenka, L.; Peternella, W.S. A Study of Degradation in Vegetable Oils by Exposure to Sunlight Using Fourier Transform Infrared Spectroscopy. Mater. Sci. Appl. 2020, 11, 678–691. [Google Scholar] [CrossRef]
  42. Strati, I.F.; Tsiantas, K.; Psouni, A.; Ladika, G.; Cavouras, D.; Sinanoglou, V.J. Quality Assessment of Edible Plant-Based Fixed Oils Using Different Analytical Techniques and Machine Learning Approaches. Appl. Sci. 2024, 14, 10305. [Google Scholar] [CrossRef]
  43. Giang, L.T.; Thien, T.L.T.; Yen, D.H. Rapid Classification of Rice in Northern Vietnam by Using FTIR Spectroscopy Combined with Chemometrics Methods. Vietnam J. Chem. 2020, 58, 372–379. [Google Scholar] [CrossRef]
  44. Patra, T.; Olsen, K.; Rinnan, Å. A Multivariate Perspective on the Stability of Oat-Based Drinks Assessed by Spectroscopy. Food Hydrocoll. 2022, 131, 107831. [Google Scholar] [CrossRef]
  45. Movasaghi, Z.; Rehman, S.; Ur Rehman, I. Fourier Transform Infrared (FTIR) Spectroscopy of Biological Tissues. Appl. Spectrosc. Rev. 2008, 43, 134–179. [Google Scholar] [CrossRef]
  46. Ioannou, A.G.; Kritsi, E.; Sinanoglou, V.J.; Cavouras, D.; Tsiaka, T.; Houhoula, D.; Zoumpoulakis, P.; Strati, I.F. Highlighting the Potential of Attenuated Total Reflectance—Fourier Transform Infrared (ATR-FTIR) Spectroscopy to Characterize Honey Samples with Principal Component Analysis (PCA). Anal. Lett. 2023, 56, 789–806. [Google Scholar] [CrossRef]
  47. Hong, T.; Yin, J.-Y.; Nie, S.-P.; Xie, M.-Y. Applications of Infrared Spectroscopy in Polysaccharide Structural Analysis: Progress, Challenge and Perspective. Food Chem. X 2021, 12, 100168. [Google Scholar] [CrossRef] [PubMed]
  48. Lee, B.-J.; Zhou, Y.; Lee, J.S.; Shin, B.K.; Seo, J.-A.; Lee, D.; Kim, Y.-S.; Choi, H.-K. Discrimination and Prediction of the Origin of Chinese and Korean Soybeans Using Fourier Transform Infrared Spectrometry (FT-IR) with Multivariate Statistical Analysis. PLoS ONE 2018, 13, e0196315. [Google Scholar] [CrossRef] [PubMed]
  49. Ying, D.; Hlaing, M.M.; Lerisson, J.; Pitts, K.; Cheng, L.; Sanguansri, L.; Augustin, M.A. Physical Properties and FTIR Analysis of Rice-Oat Flour and Maize-Oat Flour Based Extruded Food Products Containing Olive Pomace. Food Res. Int. 2017, 100, 665–673. [Google Scholar] [CrossRef] [PubMed]
  50. Greulich, O.; Duedahl-Olesen, L.; Mikkelsen, M.S.; Smedsgaard, J.; Bang-Berthelsen, C.H. Fourier Transform Infrared Spectroscopy Tracking of Fermentation of Oat and Pea Bases for Yoghurt-Type Products. Fermentation 2024, 10, 189. [Google Scholar] [CrossRef]
  51. Wiercigroch, E.; Szafraniec, E.; Czamara, K.; Pacia, M.Z.; Majzner, K.; Kochan, K.; Kaczor, A.; Baranska, M.; Malek, K. Raman and Infrared Spectroscopy of Carbohydrates: A Review. Spectrochim. Acta Part A Mol. Biomol. Spectrosc. 2017, 185, 317–335. [Google Scholar] [CrossRef] [PubMed]
  52. Mukhametov, A.; Mamayeva, L.; Kazhymurat, A.; Akhlan, T.; Yerbulekova, M. Study of Vegetable Oils and Their Blends Using Infrared Reflectance Spectroscopy and Refractometry. Food Chem. X 2023, 17, 100386. [Google Scholar] [CrossRef] [PubMed]
  53. Bureau, S.; Cozzolino, D.; Clark, C.J. Contributions of Fourier-Transform Mid Infrared (FT-MIR) Spectroscopy to the Study of Fruit and Vegetables: A Review. Postharvest Biol. Technol. 2019, 148, 1–14. [Google Scholar] [CrossRef]
  54. Yang, H.; Li, Y.; Zhao, J.; Chen, Z.; Huang, X.; Fan, G. Regulating the Composition and Secondary Structure of Wheat Protein through Canopy Shading to Improve Dough Performance and Nutritional Index. Food Res. Int. 2023, 173, 113399. [Google Scholar] [CrossRef] [PubMed]
  55. Roland, I.S.; Aguilera-Toro, M.; Nielsen, S.D.-H.; Poulsen, N.A.; Larsen, L.B. Processing-Induced Markers in Proteins of Commercial Plant-Based Drinks in Relation to Compositional Aspects. Foods 2023, 12, 3282. [Google Scholar] [CrossRef] [PubMed]
  56. Sotelo-Lara, D.M.; Amador-Espejo, G.G.; Álvarez-Araiza, D.F.; Cordero-Rivera, A.K.; Millán-Quintero, K.G.; Campos-Vega, R.; Velázquez-Estrada, R.M. Ultrasound and Thermosonication as Promising Technologies for Processing Plant-Based Beverages: A Review. Food Technol. Biotechnol. 2024, 62, 538–552. [Google Scholar] [CrossRef] [PubMed]
  57. Tian, L.; You, X.; Zhang, S.; Zhu, Z.; Yi, J.; Jin, G. Enhancing Functional Properties and Protein Structure of Almond Protein Isolate Using High-Power Ultrasound Treatment. Molecules 2024, 29, 3590. [Google Scholar] [CrossRef] [PubMed]
  58. Vanga, S.K.; Wang, J.; Orsat, V.; Raghavan, V. Effect of Pulsed Ultrasound, a Green Food Processing Technique, on the Secondary Structure and in-Vitro Digestibility of Almond Milk Protein. Food Res. Int. 2020, 137, 109523. [Google Scholar] [CrossRef] [PubMed]
  59. Hu, H.; Wu, J.; Li-Chan, E.C.Y.; Zhu, L.; Zhang, F.; Xu, X.; Fan, G.; Wang, L.; Huang, X.; Pan, S. Effects of Ultrasound on Structural and Physical Properties of Soy Protein Isolate (SPI) Dispersions. Food Hydrocoll. 2013, 30, 647–655. [Google Scholar] [CrossRef]
  60. Li, W.; Chen, H.; Xu, B.; Wang, Y.; Zhang, C.; Cao, Y.; Xing, X. Research Progress on Classification, Sources and Functions of Dietary Polyphenols for Prevention and Treatment of Chronic Diseases. J. Future Foods 2023, 3, 289–305. [Google Scholar] [CrossRef]
  61. Bai, M.; Qin, G.; Sun, Z.; Long, G. Relationship between Molecular Structure Characteristics of Feed Proteins and Protein In Vitro Digestibility and Solubility. Asian Australas. J. Anim. Sci. 2015, 29, 1159–1165. [Google Scholar] [CrossRef] [PubMed]
  62. Rodriguez-Espinosa, M.E.; Guevara-Oquendo, V.H.; He, J.; Zhang, W.; Yu, P. Research Updates and Progress on Nutritional Significance of the Amides I and II, Alpha-Helix and Beta-Sheet Ratios, Microbial Protein Synthesis, and Steam Pressure Toasting Condition with Globar and Synchrotron Molecular Microspectroscopic Techniques with Chemometrics. Crit. Rev. Food Sci. Nutr. 2025, 65, 367–381. [Google Scholar] [CrossRef] [PubMed]
  63. Fu, H.; Grimsley, G.R.; Razvi, A.; Scholtz, J.M.; Pace, C.N. Increasing Protein Stability by Improving Beta-turns. Proteins 2009, 77, 491–498. [Google Scholar] [CrossRef] [PubMed]
  64. Brito, A.L.B.; Duarte, C.; Fausto, R. Analysis of Plant-Based Commercial Milk Substitutes Using ATR-FTIR Spectroscopy. J. Food Compos. Anal. 2025, 145, 107786. [Google Scholar] [CrossRef]
  65. Tsapou, E.A.; Sinanoglou, V.J.; Ntourtoglou, G.; Koussissi, E. Emphasizing the Potential of Attenuated Total Reflectance–Fourier Transform Infrared (ATR-FTIR) Spectroscopy Combined with Chemometrics, for Classification of Greek Grape Marc Spirits. Beverages 2024, 10, 42. [Google Scholar] [CrossRef]
  66. Kuhnen, S.; Ogliari, J.B.; Dias, P.F.; Boffo, E.F.; Correia, I.; Ferreira, A.G.; Delgadillo, I.; Maraschin, M. ATR-FTIR Spectroscopy and Chemometric Analysis Applied to Discrimination of Landrace Maize Flours Produced in Southern Brazil. Int. J. Food Sci. Technol. 2010, 45, 1673–1681. [Google Scholar] [CrossRef]
  67. Balan, B.; Dhaulaniya, A.S.; Jamwal, R.; Yadav, A.; Kelly, S.; Cannavan, A.; Singh, D.K. Rapid Detection and Quantification of Sucrose Adulteration in Cow Milk Using Attenuated Total Reflectance-Fourier Transform Infrared Spectroscopy Coupled with Multivariate Analysis. Spectrochim. Acta Part A Mol. Biomol. Spectrosc. 2020, 240, 118628. [Google Scholar] [CrossRef] [PubMed]
  68. Balan, B.; Dhaulaniya, A.S.; Jamwal, R.; Amit; Sodhi, K.K.; Kelly, S.; Cannavan, A.; Singh, D.K. Application of Attenuated Total Reflectance-Fourier Transform Infrared (ATR-FTIR) Spectroscopy Coupled with Chemometrics for Detection and Quantification of Formalin in Cow Milk. Vib. Spectrosc. 2020, 107, 103033. [Google Scholar] [CrossRef]
Figure 1. Extraction of ROIs from the microscopy image of a plant-based beverage sample, indicated by the blue boxes, for textural feature calculation.
Appliedchem 05 00016 g001
Figure 2. PLS-DA score plot showing the classification of plant-based beverages samples (almond, oat, rice, soy) based on FTIR spectral intensities and secondary structure components.
Appliedchem 05 00016 g002
Figure 3. Variable importance in projection (VIP) scores identifying the top features contributing to all beverage-type discrimination (oat vs rice groups).
Appliedchem 05 00016 g003
Figure 4. PLS-DA score plot of almond, oat, and rice beverage samples following the exclusion of the soy group, showing improved separation.
Appliedchem 05 00016 g004
Figure 5. Variable importance in projection (VIP) scores identifying the top features contributing to beverage-type discrimination (excluding soy group).
Appliedchem 05 00016 g005
Figure 6. OPLS-DA score plot showing a distinct clustering of oat and rice beverage samples. Discrimination is primarily captured along the predictive component derived from orthogonal variance.
Appliedchem 05 00016 g006
Figure 7. Variable importance in projection (VIP) scores identifying the top features contributing to beverage-type discrimination (oat vs rice groups).
Appliedchem 05 00016 g007
Table 1. Chemical composition of plant-based beverages’ categories.
Composition (g/100 g)Soy-Based BeveragesRice-Based BeveragesOat-Based BeveragesBrown Rice-Based BeveragesAlmond-Based Beverages
Total fat2.1 ± 0.4 a1.2 ± 0.2 b1.4 ± 0.3 ab1.1 ± 0.2 b1.7 ± 0.7 ab
Saturated fat0.3 ± 0.1 a0.2 ± 0.1 a0.2 ± 0.1 a0.2 ± 0.1 a0.2 ± 0.2 a
Carbohydrates2.2 ± 0.8 a11.6 ± 0.9 b7.2 ± 1.9 c11.7 ± 1.5 b2.3 ± 2.0 a
Sugars1.8 ± 1.0 a6.2 ± 1.4 b4.2 ± 1.1 b5.1 ± 0.4 b1.8 ± 1.1 a
Protein3.7 ± 0.8 a0.3 ± 0.2 b0.9 ± 0.8 b0.5 ± 0.0 b1.1 ± 0.9 b
Salt0.1 ± 0.0 a0.1 ± 0.0 a0.1 ± 0.0 a0.1 ± 0.0 a0.1 ± 0.0 a
Fibers0.3 ± 0.4 a-0.6 ± 0.7 a0.5 ± 0.1 a0.5 ± 0.6 a
Statistically different values (p < 0.05) are indicated by different letters in the same row.
Table 2. Color parameters of plant-based beverages’ categories.
Color
Parameters
Soy-Based BeveragesRice-Based BeveragesOats-Based BeveragesBrown Rice-Based BeveragesAlmond-Based Beverages
L*62.30 ± 4.54 a59.65 ± 5.42 ab56.89 ± 3.04 ab54.15 ± 1.11 b60.01 ± 5.50 ab
a*−1.09 ± 0.32 a−0.42 ± 0.15 bd−0.65 ± 0.21 b−0.08 ± 0.06 c−0.26 ± 0.08 d
b*8.77 ± 2.22 a3.42 ± 1.43 b6.16 ± 1.68 ab4.29 ± 1.11 b5.94 ± 1.59 ab
h96.67 ± 3.86 a100.02 ± 6.68 a96.56 ± 4.37 a95.37 ± 3.24 a92.89 ± 2.98 a
Statistically different values (p < 0.05) are indicated by different letters in the same row.
Table 4. Relative intensities % of ATR-FTIR spectra bands of plant-based beverages’ categories.
Relative Intensities %Soy-Based BeveragesRice-Based BeveragesOat-Based BeveragesBrown Rice-Based BeveragesAlmond-Based Beverages
3300–32700.518 ± 0.026 a0.649 ± 0.044 b0.781 ± 0.052 c0.808 ± 0.021 c0.732 ± 0.065 cb
30100.028 ± 0.002 a0.003 ± 0.001 b0.007 ± 0.001 c0.001 ± 0.000 d0.013 ± 0.002 e
29220.409 ± 0.021 a0.204 ± 0.016 b0.265 ± 0.055 b0.240 ± 0.027 b0.449 ± 0.043 a
28540.128 ± 0.007 a0.023 ± 0.007 b0.041 ± 0.005 c0.023 ± 0.009 b0.136 ± 0.023 a
17430.192 ± 0.010 a0.129 ± 0.021 b0.121 ± 0.024 b0.175 ± 0.021 c0.170 ± 0.018 c
1649–16310.407 ± 0.021 a0.049 ± 0.005 b0.120 ± 0.013 c0.045 ± 0.003 b0.373 ± 0.018 a
1545–15350.224 ± 0.013 a0.001 ± 0.000 b0.025 ± 0.005 c0.005 ± 0.001 d0.157 ± 0.012 e
1460–14400.053 ± 0.003 a-0.007 ± 0.003 b-0.049 ± 0.006 a
1421–13960.066 ± 0.004 a0.038 ± 0.001 b0.032 ± 0.004 c0.039 ± 0.003 b0.054 ± 0.006 d
13140.071 ± 0.007 a0.003 ± 0.000 b0.046 ± 0.004 c0.013 ± 0.002 d0.091 ± 0.006 e
12400.060 ± 0.003 a0.033 ± 0.004 b0.034 ± 0.003 b0.050 ± 0.011 ac0.043 ± 0.003 c
11570.043 ± 0.003 a0.117 ± 0.008 b0.088 ± 0.011 c0.113 ± 0.005 b0.045 ± 0.011 a
1107–11000.006 ± 0.001 a0.022 ± 0.002 b0.010 ± 0.001 c0.021 ± 0.002 b0.010 ± 0.001 c
1075–10450.021 ± 0.002 a0.051 ± 0.003 b0.036 ± 0.005 c0.055 ± 0.002 b0.047 ± 0.008 bc
1022–10100.161 ± 0.020 a0.615 ± 0.021 b0.568 ± 0.050 b0.635 ± 0.038 b0.314 ± 0.043 c
999–9790.110 ± 0.013 a---0.092 ± 0.014 a
932–9200.032 ± 0.004 a0.052 ± 0.004 b0.042 ± 0.005 c0.052 ± 0.002 b0.047 ± 0.003 c
870–8350.018 ± 0.002 a0.039 ± 0.003 b0.024 ± 0.004 a0.038 ± 0.003 b0.020 ± 0.002 a
819–817----0.009 ± 0.002
770–750-0.035 ± 0.004 ab0.028 ± 0.005 a0.037 ± 0.002 b0.034 ± 0.003 ab
721–7180.007 ± 0.001 a0.023 ± 0.002 b0.020 ± 0.003 b0.023 ± 0.002 b0.015 ± 0.002 c
667–6300.004 ± 0.001 a-0.007 ± 0.001 b-0.001 ± 0.000 c
575–5320.015 ± 0.002 a0.029 ± 0.004 b0.026 ± 0.008 bc0.020 ± 0.001 c0.031 ± 0.002 b
526–516-0.016 ± 0.004 a0.016 ± 0.004 a0.017 ± 0.002 a0.008 ± 0.001 b
Statistically different values (p < 0.05) are indicated by different letters in the same row.
Table 5. Proportion (%) of proteins’ secondary structure in plant-based beverages’ categories.
Secondary Structure of Proteins (%)Soy-Based BeveragesRice-Based BeveragesOats-Based BeveragesBrown Rice-Based BeveragesAlmond-Based Beverages
β-parallel sheet
(1610–1642 cm−1)
68.07 ± 3.37 aA38.77 ± 1.11 bA34.75 ± 2.47 cA42.05 ± 1.05 dA42.70 ± 2.34 dA
random coil
(1642–1650 cm−1)
12.18 ± 1.58 aB32.68 ± 1.40 bB25.47 ± 1.50 cB26.16 ± 1.57 cB19.28 ± 1.80 dB
α-helix
(1650–1660 cm−1)
12.20 ± 1.71 aB17.01 ± 0.26 bC24.58 ± 1.51 cB16.81 ± 0.61 bC20.26 ± 1.42 dB
β-turn
(1660–1680 cm−1)
7.55 ± 0.87 aC11.54 ± 0.52 bD15.20 ± 1.08 cC14.98 ± 1.37 cC17.75 ± 0.82 dC
Statistically different values (p < 0.05) are indicated by different letters in the same row. Statistically different values (p < 0.05) are indicated by different capital letters in the same column.
Disclaimer/Publisher’s Note: The statements, opinions and data contained in all publications are solely those of the individual author(s) and contributor(s) and not of MDPI and/or the editor(s). MDPI and/or the editor(s) disclaim responsibility for any injury to people or property resulting from any ideas, methods, instructions or products referred to in the content.

