Article

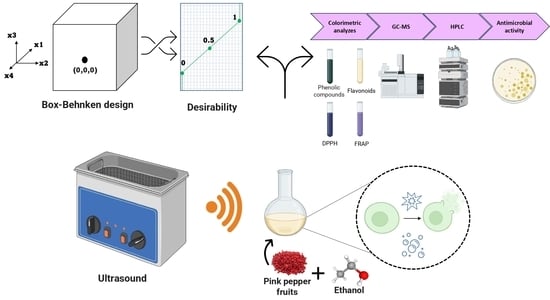
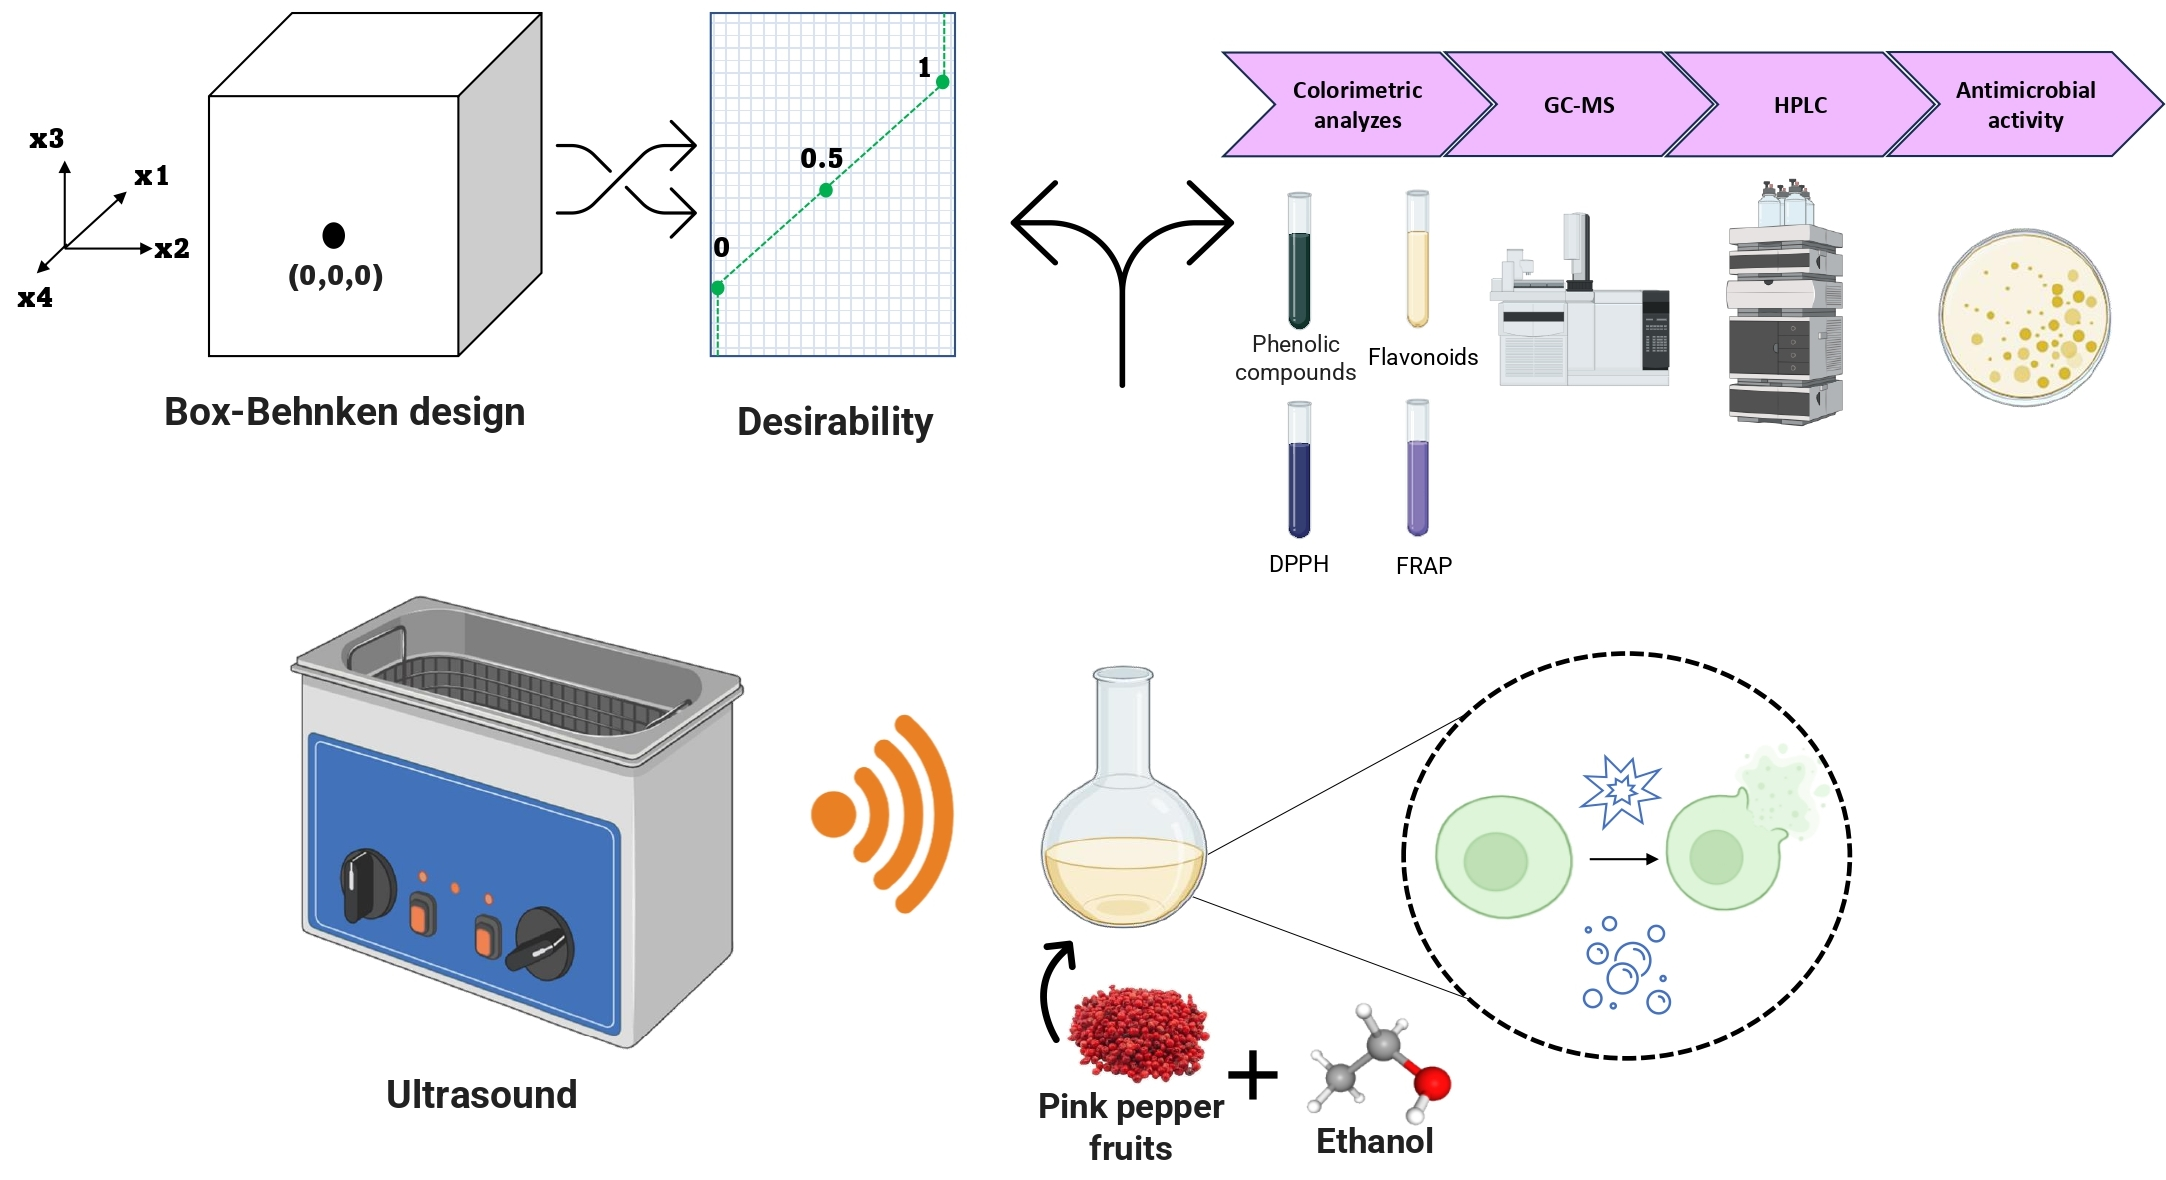
Green Extraction of Oleoresin from Pink Pepper Fruits: Effect of Experimental Conditions and Characterization

by
Ana Flávia A. de Mello
1,
Jaqueline Hoscheid
2,
Djéssica T. Raspe
3,
Natália Stevanato
3 and
Camila da Silva
1,3,*
1
Department of Technology, State University of Maringa, Umuarama 87506-370, PR, Brazil
2
Postgraduate Program in Biotechnology Applied to Agriculture, Paranaense University, Umuarama 87502-210, PR, Brazil
3
Postgraduate Program in Chemical Engineering, State University of Maringa, Maringa 87020-900, PR, Brazil
*
Author to whom correspondence should be addressed.
AppliedChem 2024, 4(1), 56-69; https://doi.org/10.3390/appliedchem4010005
Submission received: 21 December 2023 / Revised: 6 February 2024 / Accepted: 23 February 2024 / Published: 28 February 2024

Abstract

:
This work evaluated the green extraction of oleoresin from pink pepper fruits (ORPPF) using ultrasound-assisted extraction (UAE) and ethanol as a solvent. The effects of temperature, ultrasound power intensity, sample to solvent ratio and time on the global extraction yield (YGE) and phenolic compounds yield (YPC) were evaluated. The oleoresin samples were characterized and its antimicrobial activity determined, and the obtained results were compared to conventional extraction in Soxhlet. From the results it was found that the application of the highest levels of the independent variables favored the extraction process. The maximum values of YGE and YPC were 28.60 wt% and 6.37 mg GAE per g fruit, respectively, obtained at 60 °C, 100% of ultrasound power (165 W), 1:20 g mL−1 (sample:solvent) and 45 min. Under maximized conditions, the ORPPF obtained by UAE showed a content of phenolic compounds and antioxidant activity inferior to soxhlet–ethanol extraction. However, the time and solvent consumption were reduced. Oleic and linoleic acids predominated in the fatty acid composition of ORPPF, in addition to sesquiterpenes and gallic and syringic acids. The ORPPF presented weak antibacterial activity, with minimum inhibitory concentration ranging from 31.25 to 125 mg mL−1.

Graphical Abstract

1. Introduction

Schinus terebinthifolius Raddi (pink pepper or red pepper) is a natural source of phenolic compounds, flavonoids, tannins, anthocyanins, carotenoids and alkaloids [1], which gives the fruits pharmacological properties, such as anti-inflammatory, vasodilator, antimicrobial and antioxidant action [2,3]. Oliveira et al. [4] proved that extracts from fruits of pink pepper have bioactive compounds that contain the ability to absorb UV radiation. Furthermore, Oliveira et al. [3] performed in vivo analysis that demonstrated the ability of pink pepper extracts to reduce damage caused by oxidative stress promoted by H2O2 in Saccharomyces cerevisiae cells, thus proving their antioxidant capacity. The volatile fraction of S. terebinthifolius Raddi fruit extract is mainly composed of monoterpenes and sesquiterpenes [5,6].
The extraction of compounds from the fruits of pink pepper can provide the obtaining of a variety of products that can replace synthetic antioxidants and used in the production of functional foods [7]. For this, in the recovery of compounds, it is recommended to use methodologies that do not require high temperatures or long extraction times, in order to preserve the compounds of interest and increase the extraction selectivity. The ultrasound-assisted extraction (UAE) is a method considered novel in removing compounds, obtaining high extraction yields, with the preservation of the biological activity of the extracts in shorter times and with lower consumption of the solvent [8,9], different from conventional extraction techniques [10]. In this technique, the propagation of ultrasonic waves, which have a frequency greater than 20 kHz and are responsible for the formation of cavitation bubbles. These bubbles develop and collapse, inducing a series of phenomena such as fragmentation, localized ruptures, pore formation and shear force, which results in the high efficiency of the process [11].
Ethanol can be used as a solvent because it is safe, non-toxic and renewable [12]. It has a polar-protic character, which allows the extraction of low molecular weight compounds, such as phenolic compounds [13,14], and the hydroxyl group present in its structure enables the formation of hydrogen bonds with the solute, promoting high affinity with antioxidant compounds, as well as with lipids from plant matrices [12]. Considering that pink pepper fruits have around 12 wt% of lipids in their composition [3,15], the use of ethanol will provide the obtainment of an oleoresin, composed of fatty acids and other compounds [16].
The extraction of compounds from pink pepper fruits using UAE and ethanol as solvent was presented by Andrade et al. [17], however, the authors conducted the extraction under fixed conditions (fruit to solvent ratio of 1:30 g mL−1, room temperature and 45 min). Thus, considering the potential use of extracts from these fruits as an antioxidant and antimicrobial agent, this work aims to indicate the experimental conditions to obtain oleoresin from pink pepper fruits (ORPPF) from the use of ethanol as solvent. For this, the UAE was carried out to obtain the maximum values of global extraction yield (YGE) and phenolic compounds yield (YPC). ORPPF obtained from the UAE and Soxhlet extraction technique were characterized and the antibacterial activity of these oleoresins determined. The development of this study fits into the global objectives for sustainable development (good health and well-being, and responsible consumption and production), since products with beneficial properties for health will be obtained using a green and recyclable solvent in the extraction process.

2. Materials and Methods

2.1. Materials

Fruits of Schinus terebinthifolius Raddi were purchased from the local market in Maringa-PR with moisture of 8.89 ± 0.63 wt%. Ethanol (Anidrol, Diadema, Brazil, purity ≥ 95%) and n-hexane (ÊxodoCientífica, Sumare, Brazil) were the solvents used for extraction.
The reagents used for analysis were: Folin–Ciocalteau reagent (Dinâmica®, Indaiatuba, Brazil), sodium carbonate (Anidrol, Diadema, Brazil), methanol (Panreac, Barcelona, Spain), n-hexane (Anidrol, Diadema, Brazil), ethanol (Honeywell™, Charlotte, NC, USA, purity ≥ 99.9%), gallic acid (Sigma-Aldrich, St. Louis, MO, USA), distilled water (TE-4007–20, Tecnal, Piracicaba, Brazil), aluminum chloride (Synth, Diadema, Brazil), sodium acetate (Dinâmica®, Indaiatuba, Brazil), 2,2-diphenyl-1-picrylhydrazyl (DPPH) (Sigma-Aldrich, St. Louis, MO, USA), 6-hydroxy-2,5,7,8-tetramethylchroman-2-carboxylic acid (Trolox) (Sigma-Aldrich, St. Louis, MO, USA), 2,4,6-Tris(2-pyridyl)-s-triazine (TPTZ) (Sigma-Aldrich, St. Louis, MO, USA), hydrochloric acid (HCl) (Anidrol, Diadema, Brazil), glacial acetic acid (Química Moderna, Barueri, Brazil), ferric chloride (Dinâmica®, Indaiatuba, Brazil) and N,O-Bis(trimethylsilyl)trifluoroacetamide with 1% trimethylchlorosilane (BSTFA-TMCS) (Sigma-Aldrich, St. Louis, MO, USA).
For phenolic compounds quantification, methanol (HPLC grade, Panreac, Barcelona, Spain), ultrapure water (PURELAB® Flex, Lane End, UK) and formic acid (Sigma-Aldrich, St. Louis, MO, USA) were used to prepare the mobile phase. As chromatographic standards, purchased from Sigma-Aldrich (St. Louis, MO, USA), were used gallic acid, 4-hydroxybenzoic acid, vanillic acid, trans-caffeic acid, syringic acid, p-coumaric acid, trans-ferrulic acid, sinapic acid, salicylic acid, chlorogenic acid and quercetin.
In the antibacterial assays, the following were used: Brain Heart Infusion (BHI) broth (Kasvi, São Jose dos Pinhais, Brazil), Tween 80 (Sigma-Aldrich, USA), Amoxicillin (Sigma-Aldrich, St. Louis, MO, USA, purity ≥ 97%), 2,3,5-triphenyl-tetrazolium chloride (Sigma-Aldrich, St. Louis, MO, USA) and strains of Staphylococcus aureus (ATCC 12026), Bacillus subtilis subsp. spizizenii (CCCD B005), Pseudomonas aeruginosa (ATCC 9027), Escherichia coli (ATCC 25922) and Salmonella enterica subsp. enterica (CCCD S016).

2.2. Sample Preparation

The peel of the fruit was separated using a stainless steel sieve and the fruits were ground using a pestle and mortar to reduce the particle size. The samples for extraction consisted of a mixture of fruits and peels in a ratio of 7:1 (w/w).

2.3. Extractions Assays

ORPPF extraction was performed in an ultrasound bath (Eco-Sonics, Ultronique, Indaiatuba, Brazil), as reported by Raspe et al. [18]. In each test, the sample (4 g) and the solvent (ethanol) were placed in an Erlenmeyer flask close-fitting the center of the ultrasonic bath. The global extraction yield (YGE) was determined considering the mass of ORPPF obtained and the mass of the sample used in the extraction.
Phenolic Compounds (PC) from the sample were extracted according to Haiyan et al. [19] and the analysis of the hydromethanolic extract was conducted as described by Singleton et al. [20]. Oleoresin (1.5 mg mL) was mixed with 2 mL of Folin–Ciocalteu reagent and 2.5 mL of NaCO3 (7.5%), which was subsequently incubated at 50 °C for 5 min in a dark environment. The phenolic compounds yield (YPC) was obtained considering the YGE and the PC content in the sample.
The Box–Behnken experimental design was used, in order to obtain the maximum value for the dependent variables: global extraction yield (YGE) and phenolic compounds yield (YPC). The effect of four variables was investigated at three levels (Table 1). The levels X1 and X3 were selected based on previous studies conducted by the research group correlated to the extraction of oil from oleaginous matrices [21,22]. The levels of the X2 were selected to identify the effect of ultrasonic irradiation on the extraction medium and considered the limitations of the equipment, and for X4, the maximum level was established based on the study by Andrade et al. [17].
The experimental data of the dependent variables were adjusted to the second-order polynomial equation [23]. The maximum conditions for the response variables, in the investigated experimental range, were determined by applying the Derringer desirability function method, and verification experiments were performed, in quadruplicate, under these conditions.
For comparative purposes, ORPPF of the plant matrix was obtained by Soxhlet extraction, in triplicate, using ethanol and n-hexane with continuous solvent reflux for 8 h [22].

2.4. Oleoresin Characterization

The TPC content was determined as indicated in Item 2.3. To determine the total flavonoid content, the aluminum chloride method was used [24]. Briefly, oleoresin (10 mg mL) was added to 1.5 mL of methanol and 0.1 mL of 10% aluminum chloride and subsequently incubated for 30 min. The antioxidant activity of the samples (1.5 mg mL−1) was evaluated by the methods indicated by Brand-Williams et al. [25] and Benzie and Strain [26] to evaluate DPPH radical scavenging and iron reducing (FRAP) activities, respectively. For these analyses, the absorbance reading was carried out in a UV-VIS spectrophotometer (Shimadzu, UV-1900, Tokyo, Japan) and Trolox (2–250 μmol L−1 and 50–900 mmol L−1 for DPPH• and FRAP assays, respectively) was used as a standard for the construction of the calibration curve (R2 ≥ 0.99).
The fatty acid and chemical profile of the sample were determined using a gas chromatograph equipped with a mass spectrometer (GC-MS) (Shimadzu, model CGMS-QP2010 SE, Tokyo, Japan). The chromatographic conditions described by Mello et al. [27] were used to identify the fatty acids present in the samples, after methylation following the methodology proposed by Santos Júnior et al. [28], based on comparison with a FAME (fatty acid methyl esters) mixture (Supelco®, Bellefonte, PA, USA). For chemical profile, samples (40 mg) were derivatized with 40 µL BSTFA/TMCS, heated to 60 °C for 60 min, diluted in ethanol (40 mg mL−1) and injected into the GC-MS equipped with SH-Rtx-5MS™ capillary column (Shimadzu, 30 m × 0.25 mm × 0.25 µm, Tokyo, Japan) in split mode (1:30) at 250 °C for 1 min. The oven temperature was programmed to start at 50 °C, then increased to 300 °C at a rate of 6 °C min−1, maintaining this temperature for 12 min. For identification, the mass spectra of the compounds detected were compared with those of the NIST 14 library, the Pubchem database established by the National Library of Medicine and the NIST standard reference database number 69 (NIST Chemistry WebBook). The percentage of each compound was determined using the area normalization method, defined as the ratio between the area of the individual compound by the total area of the peaks obtained in the chromatogram.
Phenolic compounds were quantified by high performance liquid chromatography (HPLC, Shimadzu Scientific Instruments, Tokyo, Japan) with diode array detector (Nexera X2 model), using a wavelength range of 190–800 nm. Chromatographic separation, identification and quantification of the compounds were conducted as reported by Costa et al. [29].

2.5. Antimicrobial Activity

To determine the Minimum Inhibitory Concentration (MIC), in triplicate, serial microdilution method [30] was adopted and the test was carried out using methodology applied by Pinc et al. [31]. For the positive control, the first column (broth + microorganisms + amoxicillin) was used, and for the negative control, the twelfth column (broth + microorganisms) was used.

2.6. Data Analysis

The results were submitted to analysis of variance (ANOVA) and Tukey’s test for comparison of means (p ≤ 0.05) in the software Statistica®, version 8.0 (StatSoft, Inc., Tulsa, OK, USA).

3. Results and Discussion

3.1. Ultrasound Assisted Extraction

Table 2 presents the matrix with real and coded values for each variable and responses obtained for ultrasound-assisted extraction of oleoresin from pink pepper fruits (ORPPF).
The relevance of each factor and its interactions was verified by the p-value, while the degree of influence was evaluated by the F-value, in this way, the effects with p-value ≤ 0.05 (Table 3) were considered significant and remained in the regression models.
The response variables, YGE and YPC, were adjusted to Equations (1) and (2), respectively:
YGE (wt%) = 17.59 + 4.26X1 + 0.98X12 + 1.89X2 + 0.63X3 + 0.72X32 + 2.76X4 − 1.19X1X2 + 2.20X1X4 + 0.40X2X4
YPC (mg GAE g−1 of fruit) = 2.53 + 1.22X1 + 0.35X12 + 0.40X2 + 0.38X22 − 0.06X3 + 0.42X32 + 0.56X4 + 0.12X42 − 0.13X1X3 + 0.26X1X4 + 0.18X2X3
From the Fisher test, it was possible to verify that the models were able to represent the experimental data in the range of the variables investigated at a level of 5%, since Fcal > Ftab for YGE (39.31 > 2.48) and YPC (12.94 > 2.64). Diagnostic charts were used to assess the adequacy of predicted models (Figures S1 and S2), in which a high correlation between the results obtained in the experiments and the prediction was observed, as well as that the errors were normally distributed and established models were accurate.
According to Table 3, all linear terms affected the responses and in general, quadratic terms had less impact than linear terms, except for X3. The interactive effects affected responses in different ways, as described in the following topics. Figure 1 presents the main effects of the investigated variables on the response variables, in which each of the factors was shifted from its lowest level (−1) to its highest level (1). It is possible to verify that the temperature presented a greater linear relationship (slope) with YGE and YPC in comparison with the other variables, indicating that higher values of the responses are obtained as the variable increases. On the other hand, the sample to solvent ratio had less effect on the investigated variables, since the line for this parameter was close to the horizontal.

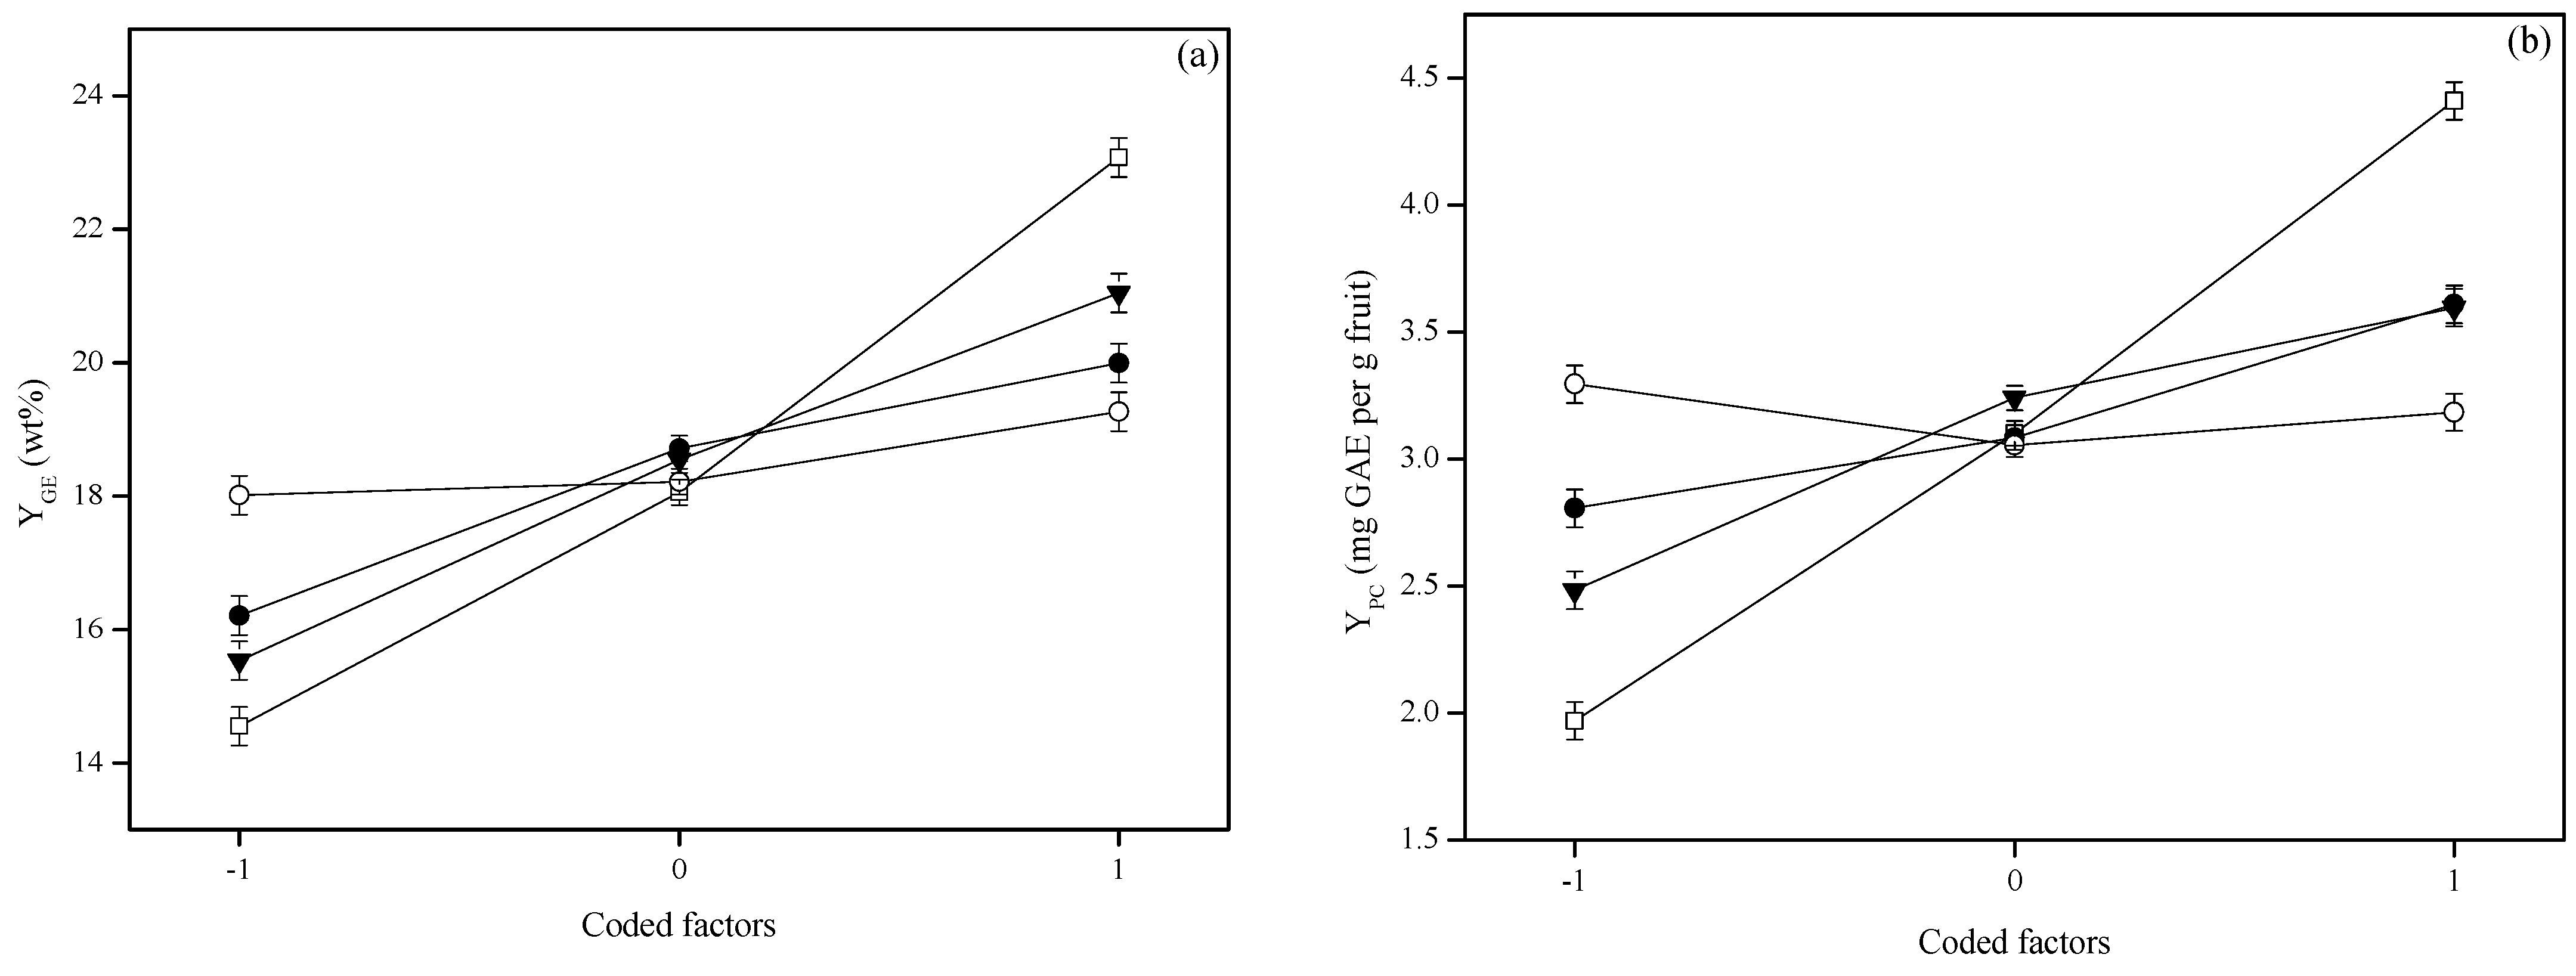
3.1.1. Effect of Temperature

The increase in the number and size of ruptures in plant tissue [32] can explain the effect of temperature on the extraction process. The increase in responses evaluated with temperature can also be attributed to the reduction in viscosity and surface tension of the solvent, improving its penetration into the matrix and the diffusion rate [33] and favoring the extraction efficiency [34]. Thus, the linear and quadratic term of this variable influenced the greater removal of ORPPF and phenolic compounds. Sharmar and Dash [35] reported that increasing temperature (30 to 70 °C) resulted in higher values of effective diffusion coefficient and mass transfer coefficient in the UAE of phenolic compounds from black jamun pulp, which was also evidenced by Raj and Dash [36] with the change of extraction temperature from 30 to 60 °C. The extraction of compounds becomes more spontaneous and viable with increasing temperature, which was evidenced by Rohilla et al. [37] in obtaining Gibbs Free Energy values.
The effect of the interaction between temperature and extraction time was synergistic, showing that the effects of temperature prevailed over the investigated time range (15 to 45 min). It was found that the interaction between temperature and ultrasonic power intensity had an antagonistic effect for YGE, which occurs due to the weakened cavitation effect with the simultaneous increase of both variables. The cavitation power is increased at high temperature, however, the cavitation bubbles implode less intensely, due to the smaller pressure gradient between the inside and outside of the bubbles [11].

3.1.2. Effect of Ultrasound Power Intensity

The highest values of the response variables were obtained at a ultrasound power intensity of 100% (165 W), whose effect can be attributed to the improvement of cavitation, as well as disruption of the plant matrix, responsible for the release of constituents to the solvent [38]. Applying a low power creates fewer cavitation bubbles, with limited mass transfer. However, as the power increases, the greater the formation of cavitation bubbles that implode with greater intensity [39]. In addition, the hydrodynamic force tends to increase, which improves the extraction efficiency, and mass transfer is promoted by the greater number of cavitation and energy bubbles in the system [40].
Raspe et al. [18] obtained an increase in UAE yield of Stevia leaf compounds by ~15% when varying power from 0 to 165 W. Chen et al. [41] determined that, in the investigated power range (60 to 100 W), the condition to obtain the maximum contents of phenolic compounds was 100 W. A similar trend of this variable (0 to 100 W) was reported by Boudries et al. [42].
The interaction between power intensity and time had no effect on the PC extraction, however, it is possible to obtain higher YGE values at high levels of these variables.

3.1.3. Effect of Sample to Solvent Ratio

The linear and quadratic term of the sample to solvent ratio provided the obtainment of higher mass yields of oleoresin, since greater amounts of solvent favor mass transfer, in addition, they reduce the viscosity of the extraction medium, facilitating the phenomenon of cavitation [43]. The use of a larger volume of solvent increases the concentration gradient and the diffusion rate, favoring mass transfer [44]. Silva et al. [45] indicated higher values for the effective diffusion coefficient with the increase in the amount of solvent in the extraction medium. Shewale et al. [46] reported that increasing the sample to ethanol ratio from 1:10 to 1:20 favors the extraction of phenolic compounds, which was evidenced by the extraction kinetics and calculation of the process parameters (rate constant and capacity constant).
Regarding the YPC, the increase in the sample to solvent ratio variable limited the response of this variable, which may be related to the reach of saturation of the extraction of these compounds in low ratios, with this, there was no increase in the solubility and diffusivity of the phenolic compounds with the application of larger volumes of solvent [47]. This becomes more evident when evaluating the negative effect of the interaction of this variable with temperature.
On the other hand, the interaction with potency (X2X3) contributes to increase the PC extraction. This fact can be associated with the disruption of the matrix surface caused by the collapse of cavitation bubbles, thus the exposed area of the material increases and the compounds tend to be released into the solvent [48].

3.1.4. Effect of Time

Ultrasound treatment was evaluated at 15, 30 and 45 min, and it can be seen that the longer extraction time resulted in a greater removal of ORPPF and PC. This behavior can be attributed to the thermal effects of the cavitation phenomenon over time, which causes the degradation of plant tissue and favors the extraction process [49]. The cavitation effect of ultrasound tends to increase with sonification time, intensifying the hydration, pore formation, fragmentation, and swelling of the plant matrix, which leads to the better release of compounds into the solvent [11].
However, it should be noted that the highest percentage of material can be removed in just 15 min of extraction (depending on the values of other variables) which corresponds to 65% and 52% of the values obtained in 45 min by YGE and YPC, respectively. Meullemiestre et al. [50] indicate that the extraction rate showed the highest value (0.1270 min−1) in the initial minutes of the UAE (0 to 15 min) than the remainder of the process (15 to 60 min) which resulted in 0.0687 min−1.

3.1.5. Maximization

The experimental conditions that maximize UAE were defined, based on the highest desirability factor (1.00), as: 60 °C, 165 W, 1:20 g mL−1 and 45 min, resulting in YGE and YPC of 30.24 wt% and 6.23 mg GAE per g fruit, respectively. Verification experiments, conducted under these conditions, resulted in YGE of 28.60 ± 0.80 wt% and YPC of 6.37 ± 0.17 mg GAE per g sample, and the comparison of these values with the predicted values did not indicate a significant difference (Student’s test, p > 0.05). Experiments were conducted at times of 60 and 90 min, maintaining other maximum point conditions, and no differences were observed in relation to the time of 45 min.
Extraction with pressurized ethanol (10 MPa, 60 °C, 5 g of sample and 4 mL min−1 of solvent for 30 min) reported by Rebelatto et al. [15], provided 26.74 wt% yield. Andrade et al. [17] obtained 21.2 wt% yield in the UAE conducted at room temperature, 45 min and adopting fruit to solvent ratio of 1:30 g mL−1. Thus, it is possible to verify that in the present study, a greater yield was obtained with the use of a smaller volume of solvent, which reduces expenses with inputs in the process and makes it possible to obtain less diluted extracts.

3.2. UAE and Soxhlet Extraction Comparison

Table 4 presents data on global extraction yield (YGE), phenolic compounds content (PC), flavonoid content (FC) antioxidant activity and fatty acid composition from ORPPF obtained under maximum conditions for response variables investigated in UAE and by Soxhlet.
Soxhlet-ethanol extraction showed higher YGE when compared to UAE. In the Soxhlet extractor, the sample is placed in contact with fresh solvent repeatedly, helping to shift the mass transfer equilibrium, in addition to the technique applying high temperature for a long time [51]. However, UAE used 33.33% less solvent and the extraction time used was reduced by 90.62% compared to Soxhlet, reaching 80.35% of the extraction efficiency of the aforementioned technique. Comparatively, UAE stands out in relation to traditional methods, due to the intensification of the process promoted by technology, since ultrasound generates significant shear forces and mechanical energy, which results in surface flaking, erosion and fragmentation of particles [52] increasing the accessibility of the substrate to the solvent, accelerating chemical interactions, which provides better quality of the analyte removed in reduced operational time.
Ethanol showed higher YGE than n-hexane, which indicates the high amount of polar compounds present in the pink pepper fruit, since ethanol has a polar characteristic and the ability to solubilize other compounds present in the matrix, such as sugars, phospholipids and proteins, as indicated by Stevanato et al. [53]. Andrade et al. [17] obtained higher yields of pink pepper extracts by Soxhlet–ethanol (44%) compared to UAE (21%), in addition, the application of n-hexane resulted in lower values for both extraction methods. Gomes et al. [54] indicated the achievement of higher mass yields in the extraction of compounds from residues of S. terebinthifolia Raddi (composed mostly of leaves and minority of unusable fruits) when polar solvents were applied.
The results obtained in terms of ORPPF composition suggested that the PC and FC are partially responsible for the antioxidative activity. Soxhlet-ethanol extraction resulted in higher values of PC content, FC content and antioxidant activity in ORPPF, followed by UAE. The values obtained for PC content were higher than those obtained by Andrade et al. [17] and Oliveira et al. [3] who reported 14.2 and 13.66 mg of GAE per g extract.
Five fatty acids were identified in the ORPPF, with linoleic acid being predominant (~46%), whose nutritional value is important for human health due to its ability to reduce blood cholesterol levels and the risk of cardiovascular diseases [55]. The same representative fatty acids were reported by Oliveira et al. [3]. The UAE resulted in samples with a lower proportion of saturated fatty acids (SFA) and a higher proportion of polyunsaturated fatty acid (PUFA) compared to that obtained by Soxhlet-ethanol, with PUFA:SFA ratio of 2.17 and 1.49, respectively. These values are higher than those indicated (0.45) by the Department of Health and Social Security [56].
Table 5 shows the results of the ORPPF analyzes conducted by HPLC-DAD and GC-MS. Gallic acid was the predominant compound among the phenolic compounds, followed by syringic acid. Vieira et al. [57] reported, based on an extensive review of specialized literature, that gallic acid is the main one found in pink pepper. This secondary metabolite can be used as a dietary ingredient and natural preservative, especially against autooxidation and self-deterioration [58]. An anti-inflammatory and anticarcinogenic effect has also been reported in the work presented in [59,60], which may be associated with antibacterial and antioxidant capacity [58].
Syringic acid, corresponds to one of the phenolic compounds that exhibits antioxidant, antimicrobial, anti-inflammatory, anticancer, antidiabetic and antiendotoxic properties [61], and is reported to be prominent in suppressing inflammatory markers with anti-asthmatic activity [62].
Regarding the compounds identified by GC-MS, four sesquiterpenes were detected. The α-eudesmol compound has anti-Alzheimer’s properties [63], while β-eudesmol has potential antitumor and antiangiogenic activity [64]. Mevy et al. [65] identified the compound elemol in volatile oil from Lippia chevalieri (12–20%) and attributed the antimalarial effect of the plant to this compound.
The ORPPF samples presented 5-hydroxymethylfurfural in their composition, which is the product of sugar conversion that was extracted, due to ethanol’s ability to extract polar compounds [66].
The in vitro antibacterial activity of the ORPPF showed weak inhibition. Table 6 pre-sents the results obtained for minimum inhibitory concentration (MIC) of ORPPF obtained by UAE and Soxhlet-ethanol, in which it is possible to verify that S. aureus and S. enterica were the most susceptible micro-organisms among the bacteria tested and P. aeruginosa showed greater resistance. In general, for amoxicillin (positive control) weaker activity was observed against Gram-negative ones (E. coli, P. aeruginosa and S. enterica).
The obtained MIC values were higher than those reported in the literature, for example, Silva et al. [6] and Dannenberg et al. [5] reported that S. terebinthifolius essential oil presented antimicrobial activity against S. aureus with MIC of 1.024 mg mL−1 and 0.68 mg mL−1, respectively. However, the products obtained in this study contain a lipid fraction, which would affect the antimicrobial potential against bacterial isolates. In general, essential oils had stronger antimicrobial activity, while other non-polar extracts and subfractions showed moderate activity and polar extracts had lower antimicrobial potential [67], consistent with our findings. Furthermore, with the use of ethanol as an extracting solvent, several compounds are simultaneously extracted that can affect the antimicrobial efficiency of the ORPPF.
Based on the results of chemical composition of the ORPPF, can conclude that the antibacterial nature is apparently related to its high phenolic contents, particularly gallic acid and syringic acid. This finding agrees with previous reports [58,61]. Moreover, the presence of monoterpenes and sesquiterpenes especially the major constituents (Elemol, β-Eudesmol and α-Eudesmol), and fatty acids, such as linoleic and oleic acids, may be one of the reasons for this activity. These components have been reported active against bacteria [68,69,70,71]. Compounds with high lipophilic structure (terpenes and fatty acids), can disrupt cell membrane integrity, leading to the loss of chemiosmotic control, and cell lysis [69].

4. Conclusions

This work investigated UAE from ORPPF, using ethanol as a solvent. Among the investigated variables, temperature was the variable that had the greatest influence on yield in terms of mass and phenolic compounds. The maximum values of YGE (28.60 wt%) and YPC (6.37 ± 0.17 mg GAE per g sample) were obtained with the following combination of independent variables: temperature of 60 °C, potency intensity of 100%, sample to solvent ratio of 1:20 g mL−1 and time of 45 min. This study showed that it is possible to obtain active compounds and high extraction yields from UAE with advantages such as shorter times, milder temperatures and lower solvent consumption when compared to Soxhlet. In addition, ethanol proved to be the most suitable solvent for obtaining the ORPPF, resulting in better values for the analyzed variables. ORPPF presented weak antibacterial activity against tested bacteria, with MIC ranging from 31.25 to 125 mg mL−1, which may be associated with the presence of monoterpenes and sesquiterpenes in the samples. Considering the results of this work, improving the understanding that underpins the biological effects and other effects associated with/related to the applicability of this oleoresin is a challenge for future work.

Supplementary Materials

The following supporting information can be downloaded at: https://www.mdpi.com/article/10.3390/appliedchem4010005/s1, Figure S1: Diagnosis charts for adequacy of the global extraction yield (YGE) model. (a) Predicted versus observed value; (b) Residual normal probability plot; Figure S2: Diagnosis charts for adequacy of the phenolic compounds yield (YPC) model. (a) Predicted versus observed value; (b) Residual normal probability plot.

Author Contributions

A.F.A.d.M.: conceptualization, methodology, formal analysis, investigation and writing—original draft preparation; J.H.: methodology and validation; D.T.R.: conceptualization, investigation and writing—original draft preparation; N.S.: methodology, formal analysis, software, resources, writing—review and editing and supervision; C.d.S.: resources, writing—review and editing and supervision. All authors have read and agreed to the published version of the manuscript.

Funding

This research received no external funding.

Institutional Review Board Statement

Not applicable.

Informed Consent Statement

Not applicable.

Data Availability Statement

Data are contained within the article and the Supplementary Material.

Acknowledgments

Universidade Estadual de Maringá–Umuarama and Universidade Paranaense–Umuarama.

Conflicts of Interest

The authors declare no conflicts of interest.

References

  1. Fagundes, M.B.; Ballus, C.A.; Perceval Soares, V.; de Freitas Ferreira, D.; Sena Vaz Leães, Y.; Sasso Robalo, S.; Guidetti Vendruscolo, R.; Bastianello Campagnol, P.C.; Smanioto Barin, J.; Cichoski, A.J.; et al. Characterization of olive oil flavored with Brazilian pink pepper (Schinus terebinthifolius Raddi) in different maceration processes. Food Res. Int. 2020, 137, 109593. [Google Scholar] [CrossRef]
  2. Masyita, A.; Mustika Sari, R.; Dwi Astuti, A.; Yasir, B.; Rahma Rumata, N.; Emran, T.B.; Nainu, F.; Simal-Gandara, J. Terpenes and terpenoids as main bioactive compounds of essential oils, their roles in human health and potential application as natural food preservatives. Food Chem. X 2022, 13, 100217. [Google Scholar] [CrossRef]
  3. Oliveira, V.S.; Augusta, I.M.; da Braz, M.V.C.; Riger, C.J.; Prudêncio, E.R.; Sawaya, A.C.H.F.; Sampaio, G.R.; da Silva Torres, E.A.F.; Saldanha, T. Aroeira fruit (Schinus terebinthifolius Raddi) as a natural antioxidant: Chemical constituents, bioactive compounds and in vitro and in vivo antioxidant capacity. Food Chem. 2020, 315, 126274. [Google Scholar] [CrossRef]
  4. Oliveira, M.B.S.; Valentim, I.B.; Rocha, T.S.; Santos, J.C.; Pires, K.S.N.; Tanabe, E.L.L.; Borbely, K.S.C.; Borbely, A.U.; Goulart, M.O.F. Schinus terebenthifolius Raddi extracts: From sunscreen activity toward protection of the placenta to Zika virus infection, new uses for a well-known medicinal plant. Ind. Crops Prod. 2020, 152, 112503. [Google Scholar] [CrossRef]
  5. Dannenberg, G.S.; Funck, G.D.; da Silva, W.P.; Fiorentini, Â.M. Essential oil from pink pepper (Schinus terebinthifolius Raddi): Chemical composition, antibacterial activity and mechanism of action. Food Control 2019, 95, 115–120. [Google Scholar] [CrossRef]
  6. Silva, M.M.C.; Bezerra de Araújo Neto, J.; Lucas dos Santos, A.T.; Morais Oliveira-Tintino, C.D.; Araújo, A.C.J.; Freitas, P.R.; Silva, L.E.; Amaral, W.; Deschamps, C.; Azevedo, F.R.; et al. Antibiotic-potentiating activity of the Schinus terebinthifolius Raddi essential oil against MDR bacterial strains. Plants 2023, 12, 1587. [Google Scholar] [CrossRef] [PubMed]
  7. Dias, R.; Oliveira, H.; Fernandes, I.; Simal-Gandara, J.; Perez-Gregorio, R. Recent advances in extracting phenolic compounds from food and their use in disease prevention and as cosmetics. Crit. Rev. Food Sci. Nutr. 2020, 61, 1130–1151. [Google Scholar] [CrossRef] [PubMed]
  8. Deng, Y.; Wang, W.; Zhao, S.; Yang, X.; Xu, W.; Guo, M.; Xu, E.; Ding, T.; Ye, X.; Liu, D. Ultrasound-assisted extraction of lipids as food components: Mechanism, solvent, feedstock, quality evaluation and coupled technologies—A review. Trends Food Sci. Technol. 2022, 122, 83–96. [Google Scholar] [CrossRef]
  9. Dzah, C.S.; Duan, Y.; Zhang, H.; Wen, C.; Zhang, J.; Chen, G.; Ma, H. The effects of ultrasound assisted extraction on yield, antioxidant, anticancer and antimicrobial activity of polyphenol extracts: A review. Food Biosci. 2020, 35, 100547. [Google Scholar] [CrossRef]
  10. Chakraborty, S.; Uppaluri, R.; Das, C. Optimization of ultrasound-assisted extraction (UAE) process for the recovery of bioactive compounds from bitter gourd using response surface methodology (RSM). Food Bioprod. Process 2020, 120, 114–122. [Google Scholar] [CrossRef]
  11. Kumar, K.; Srivastav, S.; Sharanagat, V.S. Ultrasound assisted extraction (UAE) of bioactive compounds from fruit and vegetable processing by-products: A review. Ultrason. Sonochem. 2021, 70, 105325. [Google Scholar] [CrossRef] [PubMed]
  12. Daud, N.M.; Putra, N.R.; Jamaludin, R.; Md Norodin, N.S.; Sarkawi, N.S.; Hamzah, M.H.S.; Mohd Nasir, H.; Abang Zaidel, D.N.; Che Yunus, M.A.; Md Salleh, L. Valorisation of plant seed as natural bioactive compounds by various extraction methods: A review. Trends Food Sci. Technol. 2022, 119, 201–214. [Google Scholar] [CrossRef]
  13. Pagano, I.; del Pilar Sánchez-Camargo, A.; Mendiola, J.A.; Campone, L.; Cifuentes, A.; Rastrelli, L.; Ibañez, E. Selective extraction of high-value phenolic compounds from distillation wastewater of basil (Ocimum basilicum L.) by pressurized liquid extraction. Electrophoresis 2018, 39, 1884–1891. [Google Scholar] [CrossRef] [PubMed]
  14. Yusoff, I.M.; Mat Taher, Z.; Rahmat, Z.; Chua, L.S. A review of ultrasound-assisted extraction for plant bioactive compounds: Phenolics, flavonoids, thymols, saponins and proteins. Food Res. Int. 2022, 157, 111268. [Google Scholar] [CrossRef] [PubMed]
  15. Rebelatto, E.A.; Rodrigues, L.G.G.; Rudke, A.R.; Andrade, K.S.; Ferreira, S.R.S. Sequential green-based extraction processes applied to recover antioxidant extracts from pink pepper fruits. J. Supercrit. Fluids 2020, 166, 105034. [Google Scholar] [CrossRef]
  16. Uquiche, E.; Del Valle, J.M.; Ortiz, J. Supercritical carbon dioxide extraction of red pepper (Capsicum annuum L.) oleoresin. J. Food Eng. 2004, 65, 55–66. [Google Scholar] [CrossRef]
  17. Andrade, K.S.; Poncelet, D.; Ferreira, S.R.S. Sustainable extraction and encapsulation of pink pepper oil. J. Food Eng. 2017, 204, 38–45. [Google Scholar] [CrossRef]
  18. Raspe, D.T.; Ciotta, S.R.; Zorzenon, M.R.T.; Dacome, A.S.; da Silva, C.; Milani, P.G.; da Costa, S.C. Ultrasound-assisted extraction of compounds from Stevia leaf pretreated with ethanol. Ind. Crops Prod. 2021, 172, 114035. [Google Scholar] [CrossRef]
  19. Haiyan, Z.; Bedgood, D.R.; Bishop, A.G.; Prenzler, P.D.; Robards, K. Endogenous biophenol, fatty acid and volatile profiles of selected oils. Food Chem. 2007, 100, 1544–1551. [Google Scholar] [CrossRef]
  20. Singleton, V.L.; Orthofer, R.; Lamuela-Raventós, R.M. Analysis of total phenols and other oxidation substrates and antioxidants by means of Folin-Ciocalteu reagent. Methods Enzymol. 1999, 299, 152–178. [Google Scholar] [CrossRef]
  21. Santos, K.A.; Klein, E.J.; Silva, C.; Silva, E.A.; Cardozo-Filho, L. Extraction of vetiver (Chrysopogon zizanioides) root oil by supercritical CO2, pressurized-liquid, and ultrasound-assisted methods and modeling of supercritical extraction kinetics. J. Supercrit. Fluids 2019, 150, 30–39. [Google Scholar] [CrossRef]
  22. Stevanato, N.; Silva, C. Radish seed oil: Ultrasound-assisted extraction using ethanol as solvent and assessment of its potential for ester production. Ind. Crops Prod. 2019, 132, 283–291. [Google Scholar] [CrossRef]
  23. Yin, G.; Dang, Y. Optimization of extraction technology of the Lycium barbarum polysaccharides by Box–Behnken statistical design. Carbohydr. Polym. 2008, 74, 603–610. [Google Scholar] [CrossRef]
  24. Zaidan, U.H.; Zen, N.I.M.; Amran, N.A.; Shamsi, S.; Gani, S.S.A. Biochemical evaluation of phenolic compounds and steviol glycoside from Stevia rebaudiana extracts associated with in vitro antidiabetic potential. Biocatal. Agric. Biotechnol. 2019, 18, 101049. [Google Scholar] [CrossRef]
  25. Brand-Williams, W.; Cuvelier, M.E.; Berset, C. Use of a free radical method to evaluate antioxidant activity. LWT Food Sci. Technol. 1995, 28, 25–30. [Google Scholar] [CrossRef]
  26. Benzie, I.F.F.; Strain, J.J. The ferric reducing ability of plasma (FRAP) as a measure of “antioxidant power”: The FRAP assay. Anal. Biochem. 1996, 239, 70–76. [Google Scholar] [CrossRef]
  27. Mello, B.T.F.; Stevanato, N.; Cardozo Filho, L.; Silva, C. Pressurized liquid extraction of radish seed oil using ethanol as solvent: Effect of pretreatment on seeds and process variables. J. Supercrit. Fluids 2021, 176, 105307. [Google Scholar] [CrossRef]
  28. Santos Júnior, O.O.; Montanher, P.F.; Bonafé, E.G.; do Prado, I.N.; Maruyama, S.A.; Matsushita, M.; Visentainer, J.V. A Simple, Fast and Efficient Method for Transesterification of Fatty Acids in Foods Assisted by Ultrasound Energy. J. Braz. Chem. Soc. 2014, 25, 1712–1719. [Google Scholar] [CrossRef]
  29. Costa, A.J.N.; Stevanato, N.; Raspe, D.T.; Cardozo-Filho, L.; Silva, C. Valorization of coffee bean husk via pressurized liquid extraction for production of physicochemical extract. J. Chem. Technol. Biotechnol. 2023, 1–9. [Google Scholar] [CrossRef]
  30. CLSI M07-A8; Methods for Dilution Antimicrobial Susceptibility Tests for Bacteria That Grow Aerobically, 8th ed. Clinical and Laboratory Standards Institute: Wayne, PA, USA, 2009.
  31. Pinc, M.M.; Dalmagro, M.; Cruz, E.A.P.; Donadel, G.; Thomaz, R.T.; da Silva, C.; Macruz, P.D.; Jacomassi, E.; Gasparotto Junior, A.; Hoscheid, J.; et al. Extraction Methods, Chemical Characterization, and In Vitro Biological Activities of Plinia cauliflora (Mart.) Kausel Peels. Pharmaceuticals 2023, 16, 1173. [Google Scholar] [CrossRef] [PubMed]
  32. Reche, C.; Rosselló, C.; Dalmau, E.; Eim, V.; Simal, S. Quantification of microstructural changes in artichoke by-products by image analysis after high-power ultrasound-assisted extraction of bioactive compounds. LWT 2022, 171, 114127. [Google Scholar] [CrossRef]
  33. Chemat, F.; Rombaut, N.; Sicaire, A.G.; Meullemiestre, A.; Fabiano-Tixier, A.S.; Abert-Vian, M. Ultrasound assisted extraction of food and natural products. Mechanisms, techniques, combinations, protocols and applications. A review. Ultrason. Sonochem. 2017, 34, 540–560. [Google Scholar] [CrossRef]
  34. Prakash Maran, J.; Manikandan, S.; Vigna Nivetha, C.; Dinesh, R. Ultrasound assisted extraction of bioactive compounds from Nephelium lappaceum L. fruit peel using central composite face centered response surface design. Arab. J. Chem. 2017, 10, S1145–S1157. [Google Scholar] [CrossRef]
  35. Sharma, M.; Dash, K.K. Microwave and ultrasound assisted extraction of phytocompounds from black jamun pulp: Kinetic and thermodynamics characteristics. Innov. Food Sci. Emerg. Technol. 2022, 75, 102913. [Google Scholar] [CrossRef]
  36. Raj, G.V.S.B.; Dash, K.K. Ultrasound-assisted extraction of phytocompounds from dragon fruit peel: Optimization, kinetics and thermodynamic studies. Ultrason. Sonochem. 2020, 68, 105180. [Google Scholar] [CrossRef]
  37. Rohilla, S.; Chutia, H.; Marboh, V.; Mahanta, C.L. Ultrasound and supercritical fluid extraction of phytochemicals from purple tamarillo: Optimization, comparison, kinetics, and thermodynamics studies. Appl. Food Res. 2022, 2, 100210. [Google Scholar] [CrossRef]
  38. Belhachat, D.; Mekimene, L.; Belhachat, M.; Ferradji, A.; Aid, F. Application of response surface methodology to optimize the extraction of essential oil from ripe berries of Pistacia lentiscus using ultrasonic pretreatment. J. Appl. Res. Med. Aromat. Plants 2018, 9, 132–140. [Google Scholar] [CrossRef]
  39. Imtiaz, F.; Ahmed, D.; Abdullah, R.H.; Ihsan, S. Green extraction of bioactive compounds from Thuja orientalis leaves using microwave- and ultrasound-assisted extraction and optimization by response surface methodology. Sustain. Chem. Pharm. 2023, 35, 101212. [Google Scholar] [CrossRef]
  40. Rouhani, M. Modeling and optimization of ultrasound-assisted green extraction and rapid HPTLC analysis of stevioside from Stevia rebaudiana. Ind. Crops Prod. 2019, 132, 226–235. [Google Scholar] [CrossRef]
  41. Chen, S.; Zeng, Z.; Hu, N.; Bai, B.; Wang, H.; Suo, Y. Simultaneous optimization of the ultrasound-assisted extraction for phenolic compounds content and antioxidant activity of Lycium ruthenicum Murr. fruit using response surface methodology. Food Chem. 2018, 242, 1–8. [Google Scholar] [CrossRef]
  42. Boudries, H.; Nabet, N.; Chougui, N.; Souagui, S.; Loupassaki, S.; Madani, K.; Dimitrov, K. Optimization of ultrasound-assisted extraction of antioxidant phenolics from Capparis spinosa flower buds and LC–MS analysis. J. Food Meas. Charact. 2019, 13, 2241–2252. [Google Scholar] [CrossRef]
  43. Santos, K.A.; Silva, E.A.; Silva, C. Ultrasound-assisted extraction of favela (Cnidoscolus quercifolius) seed oil using ethanol as a solvent. J. Food Process Preserv. 2021, 45, e15497. [Google Scholar] [CrossRef]
  44. Liao, J.; Guo, Z.; Yu, G. Process intensification and kinetic studies of ultrasound-assisted extraction of flavonoids from peanut shells. Ultrason. Sonochem. 2021, 76, 105661. [Google Scholar] [CrossRef] [PubMed]
  45. Silva, J.P.P.; Bolanho, B.C.; Stevanato, N.; Massa, T.B.; Silva, C. Ultrasound-assisted extraction of red beet pigments (Beta vulgaris L.): Influence of operational parameters and kinetic modeling. J. Food Process Preserv. 2020, 44, e14762. [Google Scholar] [CrossRef]
  46. Shewale, S.P.; Kapadia, M.; Rathod, V.K. Intensification of total phenolic compounds extraction from Azadirachta indica (Neem) leaves by ultrasound. Chem. Eng. Process 2022, 181, 109099. [Google Scholar] [CrossRef]
  47. Weremfo, A.; Adulley, F.; Dabie, K.; Abassah-Oppong, S.; Peprah-Yamoah, E. Optimization of ultrasound-assisted extraction of phenolic antioxidants from turkey berry (Solanum torvum Sw) fruits using response surface methodology. J. Appl. Res. Med. Aromat. Plants 2022, 30, 100387. [Google Scholar] [CrossRef]
  48. Tao, Y.; Sun, D.W. Enhancement of food processes by ultrasound: A review. Crit. Rev. Food Sci. Nutr. 2015, 55, 570–594. [Google Scholar] [CrossRef]
  49. More, P.R.; Arya, S.S. Intensification of bio-actives extraction from pomegranate peel using pulsed ultrasound: Effect of factors, correlation, optimization and antioxidant bioactivities. Ultrason. Sonochem. 2021, 72, 105423. [Google Scholar] [CrossRef]
  50. Meullemiestre, A.; Petitcolas, E.; Maache-Rezzoug, Z.; Chemat, F.; Rezzoug, S.A. Impact of ultrasound on solid-liquid extraction of phenolic compounds from maritime pine sawdust waste. Kinetics, optimization and large scale experiments. Ultrason. Sonochem. 2016, 28, 230–239. [Google Scholar] [CrossRef]
  51. López-Bascón-Bascon, M.A.; Luque de Castro, M.D. Soxhlet Extraction. In Liquid-Phase Extraction; Poole, C.F., Ed.; Elsevier: Amsterdam, The Netherlands, 2020; pp. 327–354. [Google Scholar] [CrossRef]
  52. Nipornram, S.; Tochampa, W.; Rattanatraiwong, P.; Singanusong, R. Optimization of low power ultrasound-assisted extraction of phenolic compounds from mandarin (Citrus reticulata Blanco cv. Sainampueng) peel. Food Chem. 2018, 241, 338–345. [Google Scholar] [CrossRef]
  53. Stevanato, N.; Mello, B.T.F.; Saldaña, M.D.A.; Cardozo-Filho, L.; Silva, C. Production of ethyl esters from forage radish seed: An integrated sequential route using pressurized ethanol and ethyl acetate. Fuel 2023, 332, 126075. [Google Scholar] [CrossRef]
  54. de Araujo Gomes, R.B.; de Souza, E.S.; Gerhardt Barraqui, N.S.; Tosta, C.L.; Nunes, A.P.F.; Schuenck, R.P.; Ruas, F.G.; Ventura, J.A.; Filgueiras, P.R.; Kuster, R.M. Residues from the Brazilian pepper tree (Schinus terebinthifolia Raddi) processing industry: Chemical profile and antimicrobial activity of extracts against hospital bacteria. Ind. Crops Prod. 2020, 143, 111430. [Google Scholar] [CrossRef]
  55. Marangoni, F.; Agostoni, C.; Borghi, C.; Catapano, A.L.; Cena, H.; Ghiselli, A.; La Vecchia, C.; Lercker, G.; Manzato, E.; Pirillo, A.; et al. Dietary linoleic acid and human health: Focus on cardiovascular and cardiometabolic effects. Atherosclerosis 2020, 292, 90–98. [Google Scholar] [CrossRef] [PubMed]
  56. Department of Health and Social Security. Report on Health and Social Subjects: Diet and Cardiovascular Disease; Committee on Medical Aspects of Food Policy. Report of the Panel on Diet in Relation to Cardiovascular Disease; Her Majesty’s Stationery Office: London, UK, 1984. [Google Scholar]
  57. Vieira, J.S.; Oliveira, V.S.; Carneiro, M.J.; Silva, T.L.; Augusta, I.M.; Carvalho, M.G.; Sawaya, A.C.H.F.; Saldanha, T. Phenolic composition and insights into the use of pink pepper (Schinus terebentifolius Raddi) fruit against lipid oxidation in food systems. Food Biosci. 2023, 53, 102556. [Google Scholar] [CrossRef]
  58. Bhuia, M.S.; Rahaman, M.M.; Islam, T.; Bappi, M.H.; Sikder, M.I.; Hossain, K.N.; Akter, F.; Prottay, A.A.S.; Rokonuzzman, M.; Gürer, E.S.; et al. Neurobiological effects of gallic acid: Current perspectives. Chin. Med. 2023, 18, 27. [Google Scholar] [CrossRef] [PubMed]
  59. Wen, L.; Qu, T.-B.; Zhai, K.; Ding, J.; Hai, Y.; Zhou, J.-L. Gallic acid can play a chondroprotective role against AGE-induced osteoarthritis progression. J. Orthop. Sci. 2015, 20, 734–741. [Google Scholar] [CrossRef] [PubMed]
  60. Yoshioka, K.; Kataoka, T.; Hayashi, T.; Hasegawa, M.; Ishi, Y.; Hibasami, H. Induction of apoptosis by gallic acid in human stomach cancer KATO III and colon adenocarcinoma COLO 205 cell lines. Oncol. Rep. 2000, 7, 1221–1224. [Google Scholar] [CrossRef] [PubMed]
  61. Cheemanapalli, S.; Mopuri, R.; Golla, R.; Anuradha, C.M.; Chitta, S.K. Syringic acid (SA)—A Review of Its Occurrence, Biosynthesis, Pharmacological and Industrial Importance. Biomed. Pharmacother. 2018, 108, 547–557. [Google Scholar] [CrossRef]
  62. Li, Y.; Zhang, L.; Wang, X.; Wu, W.; Qin, R. Effect of Syringic acid on antioxidant biomarkers and associated inflammatory markers in mice model of asthma. Drug Dev. Res. 2018, 80, 253–261. [Google Scholar] [CrossRef] [PubMed]
  63. Aoyama, Y.; Araki, Y.; Konoike, T. Stereoselective Total Synthesis of (-)-α-Eudesmol, a P/Q-Type Calcium Channel Blocker. Org. Lett. 2001, 2001, 1452–1454. [Google Scholar] [CrossRef]
  64. Acharya, B.; Chaijaroenkul, W.; Na-Bangchang, K. Therapeutic potential and pharmacological activities of β-eudesmol. Chem. Biol. Drug Des. 2021, 97, 984–996. [Google Scholar] [CrossRef] [PubMed]
  65. Mevy, J.P.; Bessiere, J.M.; Dherbomez, M.; Millogo, J.; Viano, J. Chemical composition and some biological activities of the volatile oils of a chemotype of Lippia chevalieri Moldenke. Food Chem. 2007, 101, 682–685. [Google Scholar] [CrossRef]
  66. Vladić, J.; Janković, T.; Živković, J.; Tomić, M.; Zdunić, G.; Šavikin, K.; Vidović, S. Comparative Study of Subcritical Water and Microwave-Assisted Extraction Techniques Impact on the Phenolic Compounds and 5-Hydroxymethylfurfural Content in Pomegranate Peel. Plant Foods Hum. Nutr. 2020, 75, 553–560. [Google Scholar] [CrossRef] [PubMed]
  67. Guo, L.; Sun, Y.; Ping, X.; Liu, J.; Wang, X.; Qin, N. Chemical composition and antibacterial activity of ethyl acetate extract of Astragalus membranaceus aerial parts. J. Food Saf. 2021, 42, e12947. [Google Scholar] [CrossRef]
  68. Lafraxo, S.; Zouirech, O.; El Barnossi, A.; Chelouati, T.; Chebaibi, M.; Chebbac, K.; Nafidi, H.-A.; Salamatullah, A.M.; Bourhia, M.; Aboul-Soud, M.A.M.; et al. Promising antioxidant and antimicrobial effects of essential oils extracted from fruits of Juniperus thurifera: In vitro and in silico investigations. Open Chem. 2023, 21, 20220332. [Google Scholar] [CrossRef]
  69. Kart, N.N.B.; Günal, B.; Mutlu, D.; Doğan, N.M.; Arslan, Ş.; Semiz, G. Evaluating Antibiofilm, Cytotoxic and Apoptotic Activities of Scutellaria brevibracteata subsp. brevibracteata Essential Oil. Chem. Biodivers. 2023, 20, e202300878. [Google Scholar] [CrossRef]
  70. Benkhaira, N.; Zouine, N.; Fadil, M.; Koraichi, S.I.; El Hachlafi, N.; Jeddi, M.; Lachkar, M.; Fikri-Benbrahim, K. Application of mixture design for the optimum antibacterial action of chemically-analyzed essential oils and investigation of the antiadhesion ability of their optimal mixtures on 3D printing material. Bioprinting 2023, 34, e00299. [Google Scholar] [CrossRef]
  71. Prakash, V.; Kaur, H.; Bala, R. Chemical Constituents, Antimicrobial and Anti-Inflammatory Activities of Anaphalis Triplinervis Essential Oil. Nat. Vol. Essent. Oil 2023, 10, 72–83. [Google Scholar] [CrossRef]
Figure 1. Main effects plot for oleoresin for global extraction yield (a) and phenolic compounds yield (b) from pink pepper fruits (□: temperature; ●: ultrasonic power intensity; ▼: time; ○: sample to solvent ratio).
Appliedchem 04 00005 g001
Table 1. Variables and levels used in the experimental design.
Independent VariableCoded VariableLevels
−101
Temperature (°C)X1304560
Ultrasonic power intensity (%)X2050100
Sample to solvent ratio (g mL−1)X31:101:151:20
Time (min)X4153045
Table 2. Experimental design and observed responses for global extraction yield (YGE) and phenolic compound yield (YPC) of ultrasound-assisted extraction of oleoresin from pink pepper fruits (ORPPF).
RunTemperature (°C)Ultrasonic Power Intensity (%)Sample to Solvent Ratio (g mL−1)Time (min)YGE (wt%)YPC
(mg GAE * per g Fruit)
130 (−1)0 (−1)1:15 (0)30 (0)11.471.59 ± 0.03
260 (1)0 (−1)1:15 (0)30 (0)21.733.85 ± <0.01
330 (−1)100 (1)1:15 (0)30 (0)17.942.64 ± 0.02
460 (1)100 (1)1:15 (0)30 (0)23.445.07 ± <0.01
545 (0)50 (0)1:10 (−1)15 (−1)13.982.06 ± 0.02
645 (0)50 (0)1:20 (1)15 (−1)16.022.38 ± <0.01
745 (0)50 (0)1:10 (−1)45 (1)21.323.84 ± <0.01
845 (0)50 (0)1:20 (1)45 (1)23.344.15 ± 0.01
945 (0)50 (0)1:15 (0)30 (0)17.642.58 ± 0.01
1030 (−1)50 (0)1:15 (0)15 (−1)14.031.71 ± <0.01
1160 (1)50 (0)1:15 (0)15 (−1)17.073.34 ± <0.01
1230 (−1)50 (0)1:15 (0)45 (1)14.652.17 ± 0.01
1360 (1)50 (0)1:15 (0)45 (1)26.504.84 ± 0.01
1445 (0)0 (−1)1:10 (−1)30 (0)15.843.13 ± 0.01
1545 (0)100 (1)1:10 (−1)30 (0)18.283.75 ± <0.01
1645 (0)0 (−1)1:20 (1)30 (0)16.432.57 ± <0.01
1745 (0)100 (1)1:20 (1)30 (0)19.543.91 ± 0.03
1845 (0)50 (0)1:15 (0)30 (0)17.402.51 ± 0.01
1930 (−1)50 (0)1:10 (−1)30 (0)14.021.95 ± 0.02
2060 (1)50 (0)1:10 (−1)30 (0)24.635.03 ± <0.01
2130 (−1)50 (0)1:20 (1)30 (0)15.201.77 ± 0.02
2260 (1)50 (0)1:20 (1)30 (0)25.094.33 ± 0.02
2345 (0)0 (−1)1:15 (0)15 (−1)14.202.52 ± 0.01
2445 (0)100 (1)1:15 (0)15 (−1)17.892.89 ± 0.04
2545 (0)0 (−1)1:15 (0)45 (1)17.603.18 ± 0.01
2645 (0)100 (1)1:15 (0)45 (1)22.863.39 ± 0.01
2745 (0)50 (0)1:15 (0)30 (0)17.322.51 ± 0.01
* GAE: gallic acid equivalent.
Table 3. Analysis of variance (ANOVA) of the quadratic model for ultrasound-assisted extraction of oleoresin from pink pepper fruits.
SourceGlobal Extraction Yield (YGE)Phenolic Compounds Yield (YPC)
Sum of SquaresDegrees of FreedomMean SquareFp-Value *Sum of SquaresDegrees of FreedomMean SquareFp-Value *
X1 (L)218.161218.168034.680.000117.87117.8710,136.200.0001
X1 (Q)5.6815.68209.040.00480.6510.65366.550.0027
X2 (L)42.91142.911580.370.00101.9311.931096.950.0009
X2 (Q)0.0110.010.260.65960.7510.75425.460.0023
X3 (L)4.7314.73174.260.00570.0410.0420.800.0449
X3 (Q)3.1813.18117.130.00840.9510.95540.520.0018
X4 (L)91.20191.203358.750.00033.7113.712105.670.0005
X4 (Q)0.3210.3211.730.07570.0810.0845.540.0213
X1X25.6515.65207.930.00480.0110.014.140.1790
X1X30.1310.134.840.15890.0710.0737.970.0253
X1X419.41119.41715.060.00140.2710.27153.970.0064
X2X30.1110.114.140.17880.1310.1375.330.0130
X2X40.6310.6323.050.04070.0110.013.810.1902
X3X4<0.0011<0.0010.010.9371<0.00011<0.00010.010.9493
Lack of fit18.07101.8166.550.01491.69100.1795.730.0104
Pure Error0.0520.03 <0.012<0.01
Total409.4226 27.2326
R20.95 0.93
R2Adj0.90 0.86
X1: temperature; X2: ultrasonic power intensity; X3: Sample to solvent ratio; X4: time. L: linear effect and Q: quadratic effect. * Statistical significance p < 0.05.
Table 4. Global extraction yield (YGE) and characterization in terms of phenolic compounds content (PC), flavonoid content (FC), antioxidant activity and fatty acid composition of oleoresin from pink pepper fruits (ORPPF) obtained under maximum conditions for response variables investigated in ultrasound-assisted extraction (UAE) and by Soxhlet extraction.
PropertyUAE 1Soxhlet
EthanolEthanoln-Hexane
YGE (wt%)28.60 ± 0.80 b35.59 ± 0.11 a8.57 ± 0.51 c
PC (mg GAE g−1 ORPPF)22.29 ± 1.40 b30.21 ± <0.01 a0.76 ± 0.02 c
FC (mg QE g−1 ORPPF)3.93 ± 0.08 b5.66 ± 0.15 and
Antioxidant activity
(µmol TE g−1 ORPPF)
DPPH•103.43 ± 4.89 b147.80 ± 6.24 a6.61 ± <0.01 c
FRAP177.37 ± 10.22 b217.34 ± 2.98 a110.43 ± 0.77 c
Fatty acid (%) 2Myristic0.48 ± <0.01 b1.09 ± 0.07 b1.49 ± 0.24 a
Palmitic16.40 ± 0.24 b19.55 ± 0.85 a18.59 ± 0.39 a
Stearic6.37 ± 0.04 b8.75 ± 0.22 a8.05 ± 0.21 a
Oleic27.19 ± 0.13 b28.76 ± 0.10 a27.92 ± 0.33 b
Linoleic49.55 ± 0.06 a42.42 ± 0.43 b43.95 ± 0.75 b
1 conducted at 60 °C, 100% ultrasound power intensity, 1:20 (sample to solvent ratio) and 45 min. 2 percentage in the lipid fraction. GAE: gallic acid equivalent; QE: quercetin equivalent. TE: Trolox equivalent. nd: not detected. The means followed by the same letters (in the same row) do not differ statistically (p > 0.05).
Table 5. Phenolic composition by HPLC–DAD and chemical profile by CG-MS of oleoresin from pink pepper fruits obtained by ultrasound-assisted extraction (UAE) and Soxhlet extraction.
PropertyUAE 1Soxhlet-Ethanol
Phenolic compound (mg g−1 ORPPF)Gallic acid7.06 ± 0.096.96 ± 0.09
Trans-Caffeic acid0.008 ± <0.0010.009 ± <0.001
Chlorogenic acidndnd
p-Coumaric acid0.01 ± <0.0010.01 ± <0.001
Vanillic acidndnd
4-Hydroxybenzoic acid0.04 ± 0.0010.04 ± 0.001
Salicylic acidndnd
Synaptic acidndnd
Syringic acid0.08 ± <0.0010.15 ± 0.005
Trans-Ferrulic acid0.02 ± 0.0010.01 ± 0.001
Quercetin0.03 ± 0.0010.08 ± 0.001
Compound
(% normative area)
Elemol9.1213.53
γ-Eudesmol5.018.04
β-Eudesmol11.3311.84
α-Eudesmol9.8710.22
5-Hydroxymethylfurfural11.3610.76
1 conducted at 60 °C, 100% ultrasound power intensity, 1:20 (sample to solvent ratio) and 45 min. nd: not detected.
Table 6. Minimum inhibitory concentration (mg mL−1) against strains of Gram-positive and Gram-negative bacteria.
BacteriaUAE 1Soxhlet-EthanolAmoxicillin
Escherichia coli62.50 125.00 3.15 × 10⁻²
Staphylococcus aureus31.25 31.25 6.30 × 10⁻²
Pseudomonas aeruginosa125.00 125.00 1.57 × 10⁻²
Bacillus subtilis125.00 62.50 6.30 × 10⁻²
Salmonella enterica31.2531.25 3.15 × 10⁻²
1 conducted at 60 °C, 100% ultrasound power intensity, 1:20 (sample to solvent ratio) and 45 min.
Disclaimer/Publisher’s Note: The statements, opinions and data contained in all publications are solely those of the individual author(s) and contributor(s) and not of MDPI and/or the editor(s). MDPI and/or the editor(s) disclaim responsibility for any injury to people or property resulting from any ideas, methods, instructions or products referred to in the content.

