Abstract
Background: Regular exercise was previously shown to reduce glucocorticoid and cardiac-autonomic responses to psychosocial stressors. Specifically, laboratory-based stress induction procedures are recognized as valid experimental manipulations of the physiological stress response. Nevertheless, comparative research between different types of stressors is limited. This study was designed to examine the multi-system psychophysiological response to two stress-induction procedures—psychosocial (Trier Social Stress Test; TSST) and psychophysical (Maastricht Acute Stress Test; MAST)—in male and female athletes. Methods: In a crossover pilot study, 12 athletes (6 female) underwent a TSST and a MAST, one month apart. Saliva hormones and cardiac-autonomic response (heart rate and HRV) were analyzed, besides an untargeted proteomics analysis. Results: The MAST revealed a lower elevation of heart rate (SMD = −1.47 [−2.51, −0.43]) and reduction in RMSSD (SMD = 0.98 [0.01, 1.95]) compared to the TSST. No statistically significant differences were found for hormones or subjective stress (all p < 0.05). Sex comparisons of the area under the curve exposed overall lower responses in women for aldosterone (SMD = −1.50, [−2.45, −0.51]), cortisol (SMD = −1.35, [−2.28, −0.39]), cortisone (SMD = −1.43, [−2.38, −0.46]), overall glucocorticoids (SMD = −1.44, [−2.38, −0.46]), and stronger reduction in testosterone-to-cortisone (SMD = 1.41, [0.44, 2.35]). Interestingly, sex differences were more evident in response to the TSST. Discussion: Found sex differences underscore the importance of sex sensitive research in stress and exercise science. Our data support the presented methodological approach and encourage properly powered research on stressor comparison in relation to sports and physical fitness.
1. Introduction
The physiological stress response is essential for development, learning, and survival [1]. Predictions of and reactions to threat are met by acute, systemic regulations involving the autonomic nervous system (ANS) and the hypothalamic–pituitary–adrenal (HPA) axis, which support coping strategies across psychological, behavioral, and metabolic domains [2,3,4]. However, scientific research dating back to the 20th century has also established the detrimental effects of excessive or prolonged (i.e., chronic) stress on human health [5]. Chronic stress, along with episodes of acute extreme stress, has been linked to the development of immunological [6], cardiovascular [7,8,9], metabolic [10,11,12], neurological, and psychological disorders [13], highlighting its systemic impact and clinical relevance.
While the long-term health consequences of stress are well established, a growing body of research has investigated factors that may buffer or mitigate these effects. Among these, physical activity and exercise are widely recognized for their potential psychological benefits, including improved mood [14], reduced anxiety [15], and enhanced regulation of the physiological stress response [16]. Yet, the underlying mechanisms remain incompletely understood [17,18]. Multiple pathways have been proposed by which physical exercise might interact with stress, including providing personal resources, compensating for the negative health consequences of stress, and promoting physiological adaptations in the systems mediating the stress response (i.e., ANS and HPA) [19].
In fact, exercise itself can act as a potential physical stressor, activating many of the same physiological pathways as psychological stress. Herein, a clear non-linear dose–response relationship can be described, with exercise at higher intensities and longer durations leading to a more pronounced glucocorticoid and catecholamine response along with vagal withdrawal and sympathetic activation [20,21]. The mentioned biomarkers also serve as standard variables for operationalizing psychosocial stress. Individual differences in the glucocorticoid response to the same absolute volume-load of physical activity are primarily explained by physical fitness [22]. The relationship between external demands and the physiological response is more complex in the context of psychosocial stressors [23]. In addition, psychosocial stressors are less scalable than exercise stressors. So dose–response patterns are harder to study in the earlier case.
One possible explanation for the psychological benefits of regular physical activity is provided by the cross-stressor adaptation hypothesis [24,25]. According to this hypothesis, repeated exposure to exercise-induced stress responses may foster resilience to other stressors, especially psychosocial. This is particularly relevant given that humans exhibit pronounced stress responses to social and psychological threats [26,27]. To date, only a limited number of studies have directly tested the cross-stressor adaptation hypothesis under controlled experimental conditions [28,29,30]. While these studies are methodologically sound and well-designed, overall, they found limited evidence for the effect of exercise training on the physiological stress response. However, several methodological challenges remain unsolved: the populations currently studied are heterogeneous, with an overall high percentage of men. In addition, there is no consensus on a surrogate metric for stress. While cortisol is the most frequently used biomarker representing HPA activity, it has been argued that other glucocorticoids, although lower in concentration, exhibit higher sensitivity to stress [31,32]. Additionally, the stress response is characterized by a vast array of interdependent hormonal adaptations, including the gonadal axis and sex hormones [33,34]. At the same time, the autonomic response is a significant component of stress, but robust measures are underrepresented in the current literature. Finally, a key issue concerns the selection and standardization of stress-induction protocols. It is currently unclear whether different acute stressors elicit distinct response patterns, particularly in athletic populations.
Laboratory-based paradigms are frequently used to elicit a measurable stress response, with the Trier Social Stress Test (TSST) representing one of the most widely established methods. During the TSST, participants are required to deliver a mock job interview and perform mental arithmetic tasks in front of an evaluative committee, under the impression that they are being recorded and assessed [35]. This procedure reliably elicits robust physiological and psychological stress responses [36] through a combination of social evaluation and uncontrollability, paired with elements of novelty, unpredictability [37]. The Maastricht Acute Stress Test (MAST) was later developed as a complementary paradigm that combines elements of the TSST with the Cold Pressor Test [38]. In this protocol, the dominant hand is immersed in ice water to provoke autonomic and cardiovascular activation, while participants engage in cognitive tasks. So far, only one study directly compared the MAST and the TSST in terms of autonomic, endocrine, and subjective response [38]. While this comparison is a valuable initial step, it was conducted with male participants and a narrow set of examined biological markers, restricting a more comprehensive evaluation of the stress response.
Importantly, no study to date has directly compared the response to these two paradigms in habitual exercisers or athletes. A more differentiated understanding of stress reactivity in this population is essential to facilitate further research on the stress-buffering effect of exercise. If true cross-stressor adaptation occurs, no difference in overall response patterns between the TSST and MAST may be expected in athletes and regular exercisers. Conversely, if stress adaptation is domain-specific, regular exercisers may show reduced reactivity primarily to the MAST, which places greater emphasis on physiological stress. Such differential reactivity would have important theoretical and practical implications for future research on exercise-based stress resilience.
In addition to exploring the role of different stress paradigms, the present study also addresses a persistent sex gap in the literature. Despite well-established differences between men and women, endocrinological research in exercise science remains heavily male-dominated, and sex differences in stress reactivity among athletes and habitual exercisers remain poorly understood [39,40].
Finally, an important limitation of previous research is the narrow scope of biological markers typically assessed in response to acute stress. Cortisol is the principal glucocorticoid in humans and is widely used as a central indicator of stress-related endocrine reactivity. However, other glucocorticoids display slightly different time kinetics, activation patterns, and may show greater sensitivity to stressors [32]. Further, sex hormones are of particular interest in exercise science, and their role in acute and chronic adaptations is well studied [41,42]. Observational studies indicate that sex hormones are influenced not only by the physical, but also the psychological components of sports and competition [43,44]. But the role of experimentally induced psychosocial stress on sex hormones in athletes is currently not established.
Against this background, the objective of this study was to compare two established laboratory stress test protocols—the TSST and the MAST—using a crossover design in a mixed-sex sample of self-identified athletes. To enable a comprehensive evaluation of the stress responses, multiple indicators, including glucocorticoids, heart rate variability, subjective stress, and the saliva proteome, were assessed. Thus, the present study addresses three central limitations of prior research: the lack of stressor comparison in trained populations, the underrepresentation of mixed-sex studies, and the narrow focus on a few biological markers. With this broad approach, we aimed to explore novel candidate biomarkers, providing a basis for further research on stress reactivity and resilience.
We hypothesized (i) that the MAST would elicit a lower glucocorticoid response than the TSST, as physically active individuals may be more accustomed to physical rather than psychosocial stressors; (ii) differences in cardiac autonomic response between MAST and TSST, due to the cold-pressor effects of the MAST [45]; and (iii) that while women would report higher subjective stress, they would show overall lower cortisol responses, reflected in a higher cortisone-to-cortisol-ratio (Cn:C) due to sex-specific hormonal regulation, e.g., via 11 -Hydroxysteroid Dehydrogenases type 2 (11-βHSD2; [33,46]).
2. Results
All 12 recruited participants (6 female, 6 male) were deemed eligible and completed both experimental sessions. Due to technical issues during salivary analysis, complete biological data are reported for 10 (5 female) participants. These were considered to be missing at random. Full datasets of all other outcome measures were retained for all participants. Baseline characteristics are shown in Table 1.

Table 1.
Participants’ characteristics.
None of the participants fell below the predefined cut-off levels for the DASS-21 subscales. They reported a training age of 2 to 20 years, consistently conducted 3–6 sessions per week for at least the last 3 months, and were competitively active in their sports. Five participants were enrolled in university-level education, and ten reported holding regular employment. None were shift workers or reported irregular working schedules.
2.1. Psychobiological Measures
2.1.1. Quantified Hormones
Figure 1 provides an overview of the time course of salivary endocrine markers during the MAST and TSST for male and female participants. Descriptively, cortisol concentrations peaked 15 to 20 min after stress cessation, with cortisone peaking 5 min later.
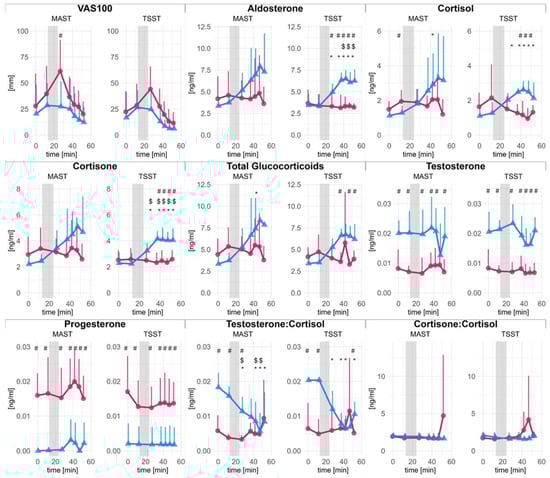
Figure 1.
Saliva hormone concentrations and subjective stress over time. Error bars represent 95% confidence intervals (CI) Females (red dots) and males (blue triangles) are shown separately. The x-axis (abscissa) indicates the time in minutes, where the grey area corresponds to the stress-induction procedure. Statistically significant differences in post hoc comparisons are denoted with symbols: $ significant difference to baseline; # significant difference between male and female; * significant difference to baseline in men.
A complete statistical analysis and results for time kinetics are disclosed in the supplements. Figure 1 presents changes in saliva hormone levels and VAS100 scores for men and women, separated by stress-induction protocol. Briefly, changes over time were found in men but not in women for aldosterone, cortisol, cortisone, total glucocorticoids, and testosterone-to-cortisol-ratio (T:C). Statistically significant differences between men and women were found for glucocorticoids and aldosterone, particularly during TSST. Overall, changes were more pronounced and robust during TSST than during MAST. Unsurprisingly, for testosterone and progesterone, significant main effects of sex were found. Absolute levels of testosterone at baseline were 20.33 × 10⁻³ ± 0.33 × 10⁻³ ng/mL in men and 8.24 × 10⁻³ ± 0.08 × 10⁻³ ng/mL in female participants. Progesterone concentrations in women (16.49 × 10⁻³ ± 0.75 × 10⁻³ ng/mL) were within the physiological range and borderline detectable in men.
AUCi comparisons for each quantified hormone are depicted in Figure 2. The mixed ANOVA revealed significant main effects of sex in case of aldosterone (F(1, 8) = 12.9, p = 0.007), cortisol (F(1, 8) = 8.63, p = 0.019), cortisone (F(1, 8) = 10.32, p = 0.012, overall glucocorticoids (F(1, 8) = 10.09, p = 0.013) and testosterone-to-cortisol ratio (F(1, 8) = 5.64, p = 0.045). No other effects reached statistical significance. The direct comparison indicated lower response in women for aldosterone (SMD = −1.50, [−2.45, −0.51]), cortisol (SMD = −1.35, [−2.28, −0.39]), cortisone (SMD = −1.43, [−2.38, −0.46]), overall glucocorticoids (SMD = −1.44, [−2.38, −0.46]), and a more pronounced reduction in testosterone-to-cortisone (SMD = 1.41, [0.44, 2.35]).
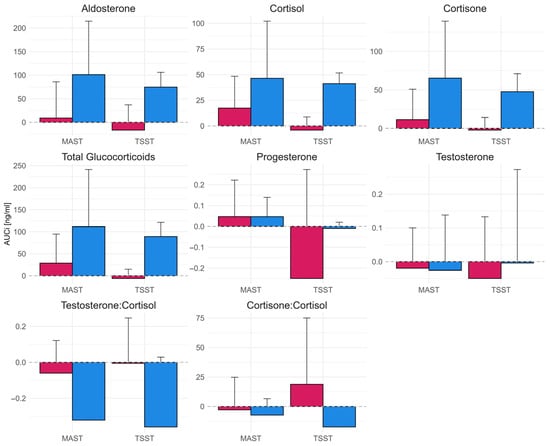
Figure 2.
Area under the curve with respect to the baseline (AUCi) of saliva hormone concentrations during TSST and MAST for male (blue bars; right) and female (red bars; left) participants. Error bars represent 95% confidence intervals.
Direct comparison between the TSST and MAST revealed no statistically significant effects. However, the sex differences were pronounced during the TSST, with substantially lower responses in women for aldosterone (SMD = −2.33, 95%CI [−3.89, −0.71]), cortisol (SMD = −4.35, 95%CI [−6.69, −1.95]), cortisone (SMD = −2.77, 95%CI [−4.47, −0.99]), and overall glucocorticoids (SMD = −3.91, 95%CI [−6.07, −1.69]). In contrast, the corresponding differences during the MAST were smaller and not statistically significant (aldosterone: SMD = −1.07, 95%CI [−2.27, 0.19]; cortisol: SMD = −0.72, 95%CI [−1.87, 0.47]; cortisone: SMD = −1.02, 95%CI [−2.21, 0.23]; overall glucocorticoids: SMD = −0.90, 95%CI [−2.08, 0.32]).
2.1.2. Autonomic Response
Figure 3 presents the autonomic response during the TSST and MAST for male and female participants. The results of the time-kinetic analysis are available in the supplements.
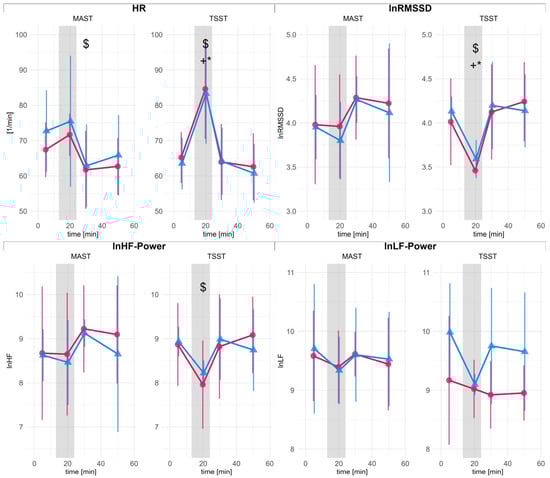
Figure 3.
Heart rate (HR) and heart rate variability (HRV) metrics for male (blue triangles) and female (red dots) participants. Error bars represent 95% confidence intervals (CI). The abscissa indicates time in minutes, with the gray area indicating the stress-induction procedure. HR: mean heart rate; RMSSD: root mean square of successive differences (ln-scaled); LF: low frequency power (ln-scaled), HF: high frequency power (ln-scaled). Statistically significant differences in post hoc comparisons are denoted with symbols: $ significant difference to baseline; * significant difference to baseline in men; + significant difference to baseline in women.
The quality of the raw heart period data was rated as good. Excluded datapoints were less than 5%, and most outliers occurred outside the periods of analysis.
The mixed-ANOVA on the differences between baseline and during stress test indicated a significant main effect of test condition for HR (F(1, 10) = 16.07, p = 0.002), with lower HR during MAST compared to TSST (SMD = −1.47 [−2.51, −0.43]). Similarly, a significant test condition effect was found for RMSSD (F(1, 10) = 5.57, p = 0.040). The TSST led to a stronger reduction in RMSSD (SMD = 0.98 [0.01, 1.95]).
2.1.3. Proteomics
The untargeted approach identified 1416 different proteins, of which 422 were eligible for further analysis. The mixed ANOVA (time × sex) and estimated marginal means contrasts revealed 38 statistically significant effects for TSST, all corresponding to the main effect of sex. During the MAST condition, 28 significant effects were identified, of which 21 corresponded to sex differences, three to time, and four to time effects within female sex only. Nevertheless, the already liberal limit of 20% false discovery rate (FDR) identified none of those significant effects as interesting (i.e., p ≤ critical value). All significant changes are listed in the supplements.
Comparison of the maximal fold change between male and female participants for each stress test (see Figure 4) revealed that during MAST, three proteins showed a stronger change for males compared to females (Nicotinamide phosphoribosyltransferase, Thioredoxin domain-containing protein 17 and Rho GDP-dissociation inhibitor 1) and two showed a more pronounced change for females (Mucin-7 and Calumenin), which were all statistically significant. During TSST, three proteins showed stronger responses in men (Actin-related protein 2/3 complex subunit 5, Neutrophil cytosol factor 4, and Lysosome-associated membrane glycoprotein 2), whereas no significantly higher responses were found for females. There was no overlap in the sex dependent effect on the protein between MAST and TSST. This is evident in Figure 4, which shows proteins with significant sex differences during the MAST as black triangles in the depiction of the TSST and vice versa. None of the effects passed the accepted, predefined FDR threshold.
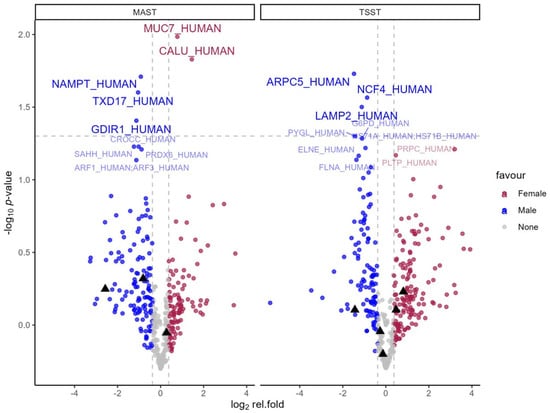
Figure 4.
Volcano plots of relative fold change comparing men and women during each stress test. Blue dots represent >30% higher fold change in men. Red dots represent >30% higher fold change in females. The gray horizontal line represents 5% alpha level. Significant effects (p < 0.05) over 30% are labeled with UniProtKB entry names for brevity. For additional information, proteins that showed a significant difference in one stress test condition are highlighted with a black triangle in the other condition.
2.2. Self-Reported Measures
2.2.1. STAI-10
The subjective anxiety levels were 30.7 ± 8.1 points at baseline and 31.3 ± 9.2 during the follow-up. The (condition × sex) ANOVA on the STAI-10 change score revealed no statistically significant main or interaction effects. Following this, no changes in STAI-10 were found in either condition.
2.2.2. VAS100
Descriptively, women displayed an increase in reported stress from baseline to directly after the stressor of ∆VAS100 = 33.7 mm (95%CI [−0.1, 67.5]) during MAST and ∆VAS100 = 21.8 mm (95%CI [−6.3, 49.9]) during TSST. The change in men was estimated as ∆VAS100 = 7.0 mm (95%CI [−26.8, 40.8]) and ∆VAS100 = 7.8 mm (95%CI [−20.3, 35.9]), respectively (Figure 2). The ANOVA (time × sex) for the separate analysis of each stress condition revealed a statistically significant main effect of time for the MAST (F(1, 10) = 4.79, padj = 0.032) and the TSST (F(1, 10) = 6.65, padj = 0.005), while the main effect for sex and interaction did not reach statistical significance (padj > 0.05). Estimated means establish no change from baseline to directly after the stressor (MAST: ∆VAS = 20.3 mm, 95%CI [−3.6, 44.2]; TSST: ∆VAS = 14.8 mm, 95%CI [−5.06, 34.7]). Nevertheless, a significant decrease in VAS100 from the maximal displacement following the stressor was found for all later time points. VAS100 continuously dropped by −28.3 mm (95%CI [−41.6, −14.9]) during MAST and −25.6 mm (95%CI [−37.1, −14.1]) during the TSST till the last follow-up 25 min after the stress cessation. However, the ANOVA model for the maximal change scores (condition × sex) could not identify any statistically significant main effects or interactions, which was confirmed by hypothesis-derived contrasts (all p > 0.05).
3. Discussion
This study examined the acute stress response to two established laboratory stress-induction protocols—the TSST and the MAST—in a mixed-sex sample of self-identified athletes. Both protocols elicited measurable stress responses, while systematic differences were observed only in autonomic regulation. However, distinct patterns for each sex emerged in several hormonal parameters, particularly during the TSST.
3.1. Comparison of TSST and MAST
We hypothesized that regular exercisers and athletes would show a reduced response to the MAST, which incorporates a strong physical component. Contrary to this hypothesis, we found no significant differences between the MAST and the TSST in hormonal response or subjective stress. While the absence of statistical differences should not be interpreted as evidence of equivalence, the largely similar endocrine responses suggest that both protocols are appropriate tools to study the stress response in athletes. Notably, descriptive data indicate greater inter-individual variability in hormonal responses during the MAST (see Figure 1 and Figure 2). Even under standardized conditions, individual responsiveness to psychological stress [47] as well as exercise stressors [48] shows substantial variability. In athletes, this variability may be further amplified by differences in training status [49] or altered pain tolerance [50]. In contrast to the hormonal findings, autonomic responses differed between the two stress tests. HR was higher and RMSSD lower during the TSST, indicating stronger vagal withdrawal. The cold stimulus during MAST typically provokes vasoconstriction in the exposed limb, accompanied by sympathetic activation. The baroreflex then counteracts excessive elevation of blood pressure and ANS activity [45]. Our data suggest that regular exercisers may exhibit altered autonomic responses to cold stress, potentially mediated by an increased baroreflex sensitivity. However, this hypothesis is not supported by earlier studies (e.g., [51]).
Research on the cold pressor test highlights considerable individual variability in autonomic reactivity, with some individuals classified as hyperreactors [52]. Such heightened responses are observed in both trained and untrained individuals [53], but the difference in prevalence appears to be unclear. Although we did not formally assess pain perception, participants’ informal feedback indicated varying levels of physical discomfort. Since pain tolerance is believed to be linked to sympathetic nervous system activity [54,55], this variability likely contributed to the broader spread in endocrine and autonomic responses. Furthermore, while cold tolerance is typically not closely linked to fitness, the specifics of training environments (i.e., regular training in the cold) may partially account for individual differences [56].
Taken together, these findings suggest that although overall HPA activation was similar between the stressor paradigms, the autonomic response was more pronounced during the TSST. This pattern is only partly consistent with the assumption of stressor-specific adaptation in physically active individuals. The stronger autonomic activation during the psychosocially loaded TSST suggests that cross-stressor adaptation may be limited or more complex than previously assumed. During exercise, the cardiac autonomic response is a direct function of exercise intensity. Depending on the metric, the response can be described as linear or even exponential [21]. On the other hand, the activation of the HPA axis depends on surpassing a threshold of intensity or volume. Systemic glucocorticoid release is only observed during more strenuous exercise bouts lasting approximately 90 min or more [20,22]. Furthermore, the endocrine response to exercise appears to be influenced by motivational and situational factors, as evident in the comparison of endocrine levels after competition and training [44]. This may suggest that exercisers are more frequently exposed to adaptive regulatory functions of the ANS, while the HPA axis and gonadal regulations are less pronounced and therefore less trained. We further want to highlight that the relationship between stress, as a broader construct, and the different measured metrics is complex. This is evident by the limited evidence for a correlation between subjective stress and cortisol [57,58]. Furthermore, original work on the cross-stressor adaptation hypothesis focused on the presumed lower reactivity of HPA or ANS-related metrics in physically fitter individuals [25]. Later work, however, also investigated a faster recovery from stress [30,59,60]. However, while reactivity and recovery of the stress response relate to distinct physiological processes [61], their role in health-related outcomes is currently not fully understood [62].
3.2. Sex Specific Responses
Our findings are consistent with reported sex differences [36,63], as women exhibited significantly lower glucocorticoid responses following stress exposure. This partially supports our hypothesis that increased enzymatic conversion of cortisol to cortisone via 11β-HSD2 [33,46] may blunt active cortisol levels in women. However, we observed no significant sex difference in the cortisone-to-cortisol ratio, and 11β-HSD2 could not be reliably quantified in our proteomic data. The follow-up time of 25 min after stress cessation may have been too short to reveal differences, as the cortisone-to-cortisol ratio showed slight deviations in the female sample during the final measurement time points (see Figure 1).
Sex differences were also apparent in aldosterone responses, which paralleled those seen in glucocorticoids. Aldosterone plays an essential role in short-term cardiovascular regulation through sodium retention and vasoconstriction and is a known modulator of sympathetic tone and baroreflex sensitivity [64]. Given its responsiveness to acute stress and its pathophysiological implications [65], aldosterone may warrant further investigation in sex-specific stress and exercise research.
Finally, a direct comparison of the two stress test protocols revealed that sex differences were significant only during the TSST, but not the MAST. While exploratory, this finding indicates that the physiological stress responses to the MAST may be less sex-dependent in physically active individuals. However, the VAS100 indicated a different picture. The elevation of self-reported stress was more pronounced in women, specifically during TSST. But confirmatory studies are needed to evaluate this trend.
The untargeted proteomics approach revealed no changes that passed the FDR threshold. Upon further inspection, some proteins exhibited significant sex differences during both MAST and TSST, suggesting that overall sex differences may be more pronounced than the response to either stress test. A direct comparison of the maximal fold change between men and women revealed different patterns during the MAST and TSST. No protein that surpassed the threshold of 30% difference in fold change in one test condition reached a similar effect in the other test condition. This would indicate that MAST and TSST lead to different sex specific responses.
3.3. Summary
The present study implemented a broad-spectrum, multimodal approach to compare psychophysiological responses across two conceptually distinct laboratory stress protocols. A major strength of the study is the use of LC-MS for hormone quantification, the inclusion of both sexes, and a comprehensive outcome panel, providing a multidimensional view of the acute stress response.
However, several limitations must be acknowledged. Most notably, the small sample size (n = 12; with missing saliva samples for one woman and one man) limits the statistical power and the generalizability of the findings. While the observed effect sizes are broadly consistent with recent meta-analyses [36,63], replication in larger cohorts is warranted. Attempts were made to minimize the potential influence of the menstrual cycle and contraceptives based on self-reporting. However, more rigorous methods should be implemented in future studies [66]. Psychological confounders were taken into account by implementing a screening questionnaire for depression, anxiety, and stress pre-enrollment. However, other confounders, like physical fitness, related health status [67], and psychological traits [47], should also be controlled for in future studies. Caution is also necessary when comparing absolute hormone concentrations to those in other studies. Although our values align with physiologically plausible ranges, differences in sampling methods and assay techniques may affect comparability [68,69,70].
We found higher HR and lower RMSSD during the TSST compared to the MAST. However, this difference may be partly attributable to posture and physical activity during the respective protocols. During the MAST, participants are seated, but stand during the TSST. The resulting reduction in RMSSD may therefore reflect orthostatic and mathematical effects rather than physiological differences per se. A feasible methodological solution for future studies may involve mathematical correction of RR intervals, as described by Sacha [71].
4. Materials and Methods
To examine the acute stress response in a mixed-sex sample of regular exercisers, we employed a randomized, counterbalanced crossover design. Each participant completed two experimental sessions, undergoing both the TSST and MAST. The study was approved by the ethics committee of the University of Vienna (REC ID: 00880, 2023).
4.1. Participants
Twelve young, healthy, non-smoking individuals (6 females, 6 males; age = 20–40 years) who self-identified as athletes and well-trained were recruited. All participated in a regular, structured training regime to improve athletic performance and competed in their primary sports discipline. Female participants were excluded if they used hormonal contraceptives, were pregnant or lactating, or reported menstrual cycles shorter than 21 days or longer than 35 days. All participants were naïve to the study’s specific aims and were informed that the research examined hormonal responses to stress and physical demands. They arrived prepared for physical exercise but were not given further procedural details to minimize expectancy effects.
4.2. Procedure
Experimental sessions were scheduled in the afternoon (between 2:00 p.m. and 3:30 p.m.) to control for diurnal variation in hormone levels [72]. Participants were required to be well-rested and abstain from food or drink (except water) for at least one hour, from caffeine for 18 h, and from intense physical training, nicotine, and alcohol for 24 h prior to testing. The female menstrual cycle status was shown to modulate the effect of psychological stressors. To minimize variation, female participants were tested 20 to 22 days after the first day of their last menstruation. This phase typically elicits the most pronounced cortisol response [73]. Each experimental session followed a standardized timeline (see Figure 5). During the sessions, participants were not permitted to use their mobile phones or wear watches. All sessions took place during fall 2024 at a laboratory at the University of Vienna (Austria), which was kept at 22 °C throughout all sessions [71].
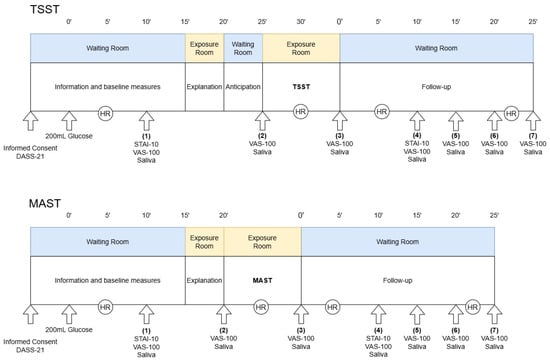
Figure 5.
Study design. The upper panel illustrates the experimental procedure for the Trier Social Stress Test (TSST), while the lower panel shows the equivalent for the Maastricht Acute Stress Test (MAST). All measurements were timed based on the administration of glucose and the end of the stress exposure. HR: heart rate measurement—participants were advised to sit quietly for robust measurement; VAS-100: Visual analog scale for subjective stress; DASS-21: Depression, anxiety and stress scale with 21 items; STAI-10: State anxiety inventory with 10 items.
On the first experimental day, participants provided written informed consent and completed the Depression, Anxiety and Stress Scale (DASS-21). Individuals scoring above the established cutoffs for depression (>10), anxiety (>6), or stress (>10) were excluded to control for the influence of clinically relevant psychological symptoms [74]. Since the stress response is closely linked to energy availability and metabolism, it was recommended to control for variations in blood glucose levels to enhance the reliability of the stress-induction [75,76]. Therefore, participants consumed 30 g of dextrose dissolved in 200 mL of water and rinsed their mouths with an additional 100 mL of water at the start of each session. This was followed by a 15 min seated resting period. Participants then underwent either the TSST or the MAST, as described in detail below. Throughout the session, they wore a heart rate monitor (Polar H10, Polar Electro Oy, Kempele, Finland) to continuously gather heart rate (HR) and HRV. Subjective ratings of stress and saliva samples were collected seven times throughout the experiment. The second experimental day followed the same structure, including the remaining stress-induction procedure.
4.2.1. Trier Social Stress Test
The TSST was conducted according to the guidelines by Labuschagne et al. [75]. Participants were escorted to the exposure room and instructed to stand on a marked spot 1.5 m in front of a desk. Two experimenters dressed in white lab coats, pants, and dark shoes were seated behind the desk, facing the participant. The assigned sex of the experimenters was shown to influence cortisol secretion [77]. Therefore, the two experimenters represented two different genders (male and female). The experimenter, representing the opposite gender to the participant, was designated as the main interviewer and would initiate and conduct the session. A video camera and microphone were positioned to enhance the perceived evaluative context.
The lead investigator read out the instructions, informing the participants that they would have five minutes in the waiting room to prepare for a mock job interview of high personal relevance. During the task, they would be required to speak about their qualifications and personality traits in front of the two evaluators, who were introduced as experts in behavioral psychology and body language. Following the ten-minute speech (which would be interrupted after five minutes), they would complete a mental arithmetic task, the details of which would be described later.
After these instructions, participants were returned to the waiting room. A saliva sample and VAS100 were collected. This time point will further be described as the anticipatory phase, as participants were now aware of the upcoming challenge. According to theoretical underpinnings regarding the predictive function of allostatic regulation [71,72], anticipatory stress was found to be associated with peak cortisol secretion [78]. The anticipatory phase lasted 5 min. However, the length of the anticipatory phase does not appear to affect the overall cortisol response [77]. Subsequently, participants re-entered the test room, and the lead investigator exited. After five minutes, the arithmetic task was introduced, requiring participants to repeatedly subtract 13 from the starting number 1009 as quickly and accurately as possible. The interviewer would ask the participant to start again if there was a mistake. Also, the interviewer would instruct them to increase speed, look into the camera, or speak louder if needed. Both interviewers were trained to give as little feedback as possible and keep a neutral expression. Upon completion of the task, the lead investigator returned and guided the participant to the follow-up phase in the waiting room.
4.2.2. Maastricht Acute Stress Test
The MAST was conducted using the original material provided by Smeets et al. [38]. Participants were brought into the test room by the lead investigator and seated in front of a computer, with a camera and microphone facing them. To keep the condition similar to the TSST, the evaluator representing the opposite gender, and dressed identically to the TSST interviewers, administered the test.
Instructions were read aloud from the computer screen. Following this, a saliva sample and VAS100 were collected to assess anticipatory stress. The lead investigator then exited the room, and the evaluator initiated the test.
During the task, participants were repeatedly instructed to immerse their dominant hand and wrist in a container of ice water (1–4 °C) for unspecified periods, described as lasting 45 to 90 s (the actual durations were 90 s, 60 s, 60 s, 90 s, and 60 s, respectively). Between the cold exposure, they performed a mental arithmetic task, subtracting 13 from a four-digit starting number (2043, 1584, 1229, and 1431) as rapidly and accurately as possible. The evaluator asked them to start again if there was a mistake, but did not provide any other information or feedback. Upon completion of the task, the lead investigator re-entered the room and escorted the participant to the waiting room for the follow-up period.
4.3. Measures
A total of six hormones were quantified at six different timepoints, and two additional ratios—cortisone-to-cortisol and testosterone-to-cortisol—and one sum-score (total glucocorticoids) were calculated. Heart periods were continuously recorded and analyzed across four specific timeframes. Four metrics of cardiac regulation were determined. Two subjective metrics were collected at six and two timepoints, respectively. Additional untargeted proteomics analyses were performed at six time points. All mentioned metrics were recorded on both experimental days under the conditions TSST and MAST for each participant. A detailed description of each metric follows.
4.3.1. Psychobiological Measures
Stimulated salivary samples (Salivettes, Sarstedt, Germany) were administered at seven time points: (1) at baseline, (2) anticipation (after explanation of the upcoming test), (3) immediately after the stress test as well as (4) 5 min, (5) 10 min, (6) 15 min, and (7) 25 min post-stress (Figure 5). The synthetic swab was kept in the mouth for two minutes at each time point. The samples were stored at 5 °C until the end of the session, centrifuged (2000 RCF, 4 °C) for two minutes, and frozen at −20 °C for later analysis.
The frozen saliva samples were sent to an external laboratory (BIOLYZ Inc., Tulln, Austria) for analysis. Hormones were extracted from samples using solid-phase extraction (SPE) and analyzed by targeted liquid chromatography-tandem mass spectrometry (LC-MS/MS). Analysis was performed on the ZentoTOF 7600 coupled to a Shimadzu Nexera X2 UHPLC system (Shimadzu, Kyoto, Japan). Data were acquired in multiple reaction monitoring (MRM) mode using optimized transitions for each analyte. All analyses were quantified using heavy-isotope labeled internal standards to ensure accuracy, reproducibility, and compensation for matrix effects. Data processing and quality control were performed using Analyst software (v1.7, SCIEX, Framingham, MA, USA).
Proteins were processed using the single-pot, solid-phase-enhanced sample preparation (SP3) protocol. Samples were reduced, alkylated, and proteins were captured on carboxylate-coated paramagnetic beads in the presence of organic solvent, followed by bead-based cleanup and on-bead digestion with sequencing-grade trypsin and Lys-C (Promega). Resulting peptides were desalted and analyzed by targeted liquid chromatography-mass spectrometry (LC-MS) using a ZenoTOF 7600 (SCIEX, Framingham, MA, USA) and an ACQUITY M-CLASS LC (Waters, Milford, MA, USA). Data were acquired in data-independent acquisition (DIA) mode using the Zeno-SWATH method. DIA data were processed using DIA-NN (v1.8) with a UniProt reference proteome database (Homo sapiens UP000005640) and common contaminants, applying a 1% lab-level false discovery rate at the peptide and protein levels. Quantitative data were normalized using DIA-NN’s built-in normalization and interference correction.
Heart period data (RR intervals) were recorded continuously using a chest strap ECG device (Polar H10, sampling rate 1000 Hz). Raw RR intervals were extracted and analyzed in R using the RHRV package (v5.0.0; [79]). Time- and frequency-domain metrics were derived from 3 min periods at each analysis time point. During the stress exposure phase of each session, three consecutive 3 min segments were extracted. Since no time-related differences were observed within this period, values were averaged across the three windows.
Artifact correction was performed using an adaptive threshold filter [80], based on a 50 bpm running mean and a physiological RR range of 20 to 220 bpm. The filtered RR time series was used to calculate mean heart rate (HR) and the root mean square of successive differences (RMSSD). Frequency domain analysis was performed via Fast Fourier Transformation on the interpolated (spline, 4 Hz) data. All 3 min analysis windows were detrended and tapered (10%), without additional smoothing. Absolute power was computed for the low-frequency (LF: 0.04–0.15 Hz) and high-frequency (HF: 0.15–0.5 Hz) bands. All HRV metrics were natural log-transformed to improve interpretability.
4.3.2. Self-Reported Measures
The German version of the DASS-21 was administered at the first test day to verify participant inclusion and inform sample characteristics. The DASS-21 is a widely used questionnaire consisting of 21 items on a 4-point Likert scale. All items are loaded positively and ask for experienced symptoms corresponding to the three distinct subscales (depression, anxiety, and stress) within the last week (example item: “I felt that my mouth was dry”). Response options range from 0 = “did not apply at all” to 3 = “does apply most of the time or very strongly”. Validity and reliability were tested for multiple cultures and languages, including German, and are considered good [81]. We estimated internal consistency for our sample using the R package psych (v2.5.6) and report Cronbach’s alpha with bootstrapped (n = 1000 iterations) 95%CI. In our sample, internal consistency was found to be acceptable (α = 0.66 [0.34, 0.77], anxiety: α = 0.65 [0.36, 0.95], stress: α = 0.52 [0.15, 0.73]).
To ensure comparability with the existing body of literature, we measured self-reported stress experience by implementing two of the most frequently used assessments in laboratory stress settings [57]: the State Anxiety Inventory (STAI-10; [82]) and a visual analog scale. The STAI-10 has been shown to capture experiential discomfort during stress protocols without interfering with the physiological stress response [77]. We administered the German version of the STAI-10 at baseline and during the early recovery phase (time point 4). The questionnaire consists of ten items measured on an 8-point Likert scale. Participants rated how well the statements apply to them at the moment of administration. Response options range from 1 = “not at all” to 8 = “completely”. An example item is: “I feel relaxed”. Four items are inversely loaded and were reversed before being summed. In our study, the STAI-10 shows acceptable to good internal consistency (α = 0.84 [0.57, 0.92]).
A horizontal 100 mm visual analog scale (VAS100) was used simultaneously with saliva samples (timepoints 1–7). Verbal anchors but no tick marks were offered at each end of the scale (0 = “not stressed”, 100 = “highly stressed”). The values were manually measured and digitized at the end of each experiment. Compared to the STAI-10, the VAS100 offers faster administration and was implemented for higher temporal resolution. It has been successfully used in similar settings [83,84,85], despite limited evidence for its psychometric validity.
4.4. Statistical Analysis
Endocrine, subjective, and HRV metrics were analyzed over the time course of each experimental session. Estimates are reported with standardized mean differences and 95% confidence intervals (CIs), calculated with the non-centrality parametric method [86]. Standardized effect sizes were adjusted for small samples (Hedges’ g) and for repeated measures (Cohen’s drm), as appropriate [87]. For variables bounded at zero (e.g., hormones), 95%CIs were truncated accordingly [88]. Parametric inference tests were accompanied by visual inspection of distribution properties (qq-plots), which were deemed unproblematic except for HRV metrics. The latter were natural-log transformed before the analyses. Sphericity was assumed to be violated by default because of the small sample. Greenhouse-Geisser correction was used as an appropriate solution.
To better understand the time kinetics of all outcomes, separate mixed ANOVA models (sex × time) were fitted for each stress-induction protocol. The STAI-10 operates on a scale from 10 to 80, and we opted not to treat it as interval-scaled. Therefore, a robust ANOVA model with trimmed means (20% trim level) was used, incorporating the R package WRS2 (v1.1.7). The analysis followed the same logic as for the previously mentioned outcomes.
To test the presented hypotheses, the overall hormonal change during each experiment was summarized as the area under the curve with respect to increase (AUCi) [89]. For HR, HRV metrics, STAI-10, and VAS100, the maximal change scores relative to the baseline were calculated. A mixed ANOVA (condition × sex) was performed on each outcome of interest, followed by pairwise comparison tests based on estimated marginal means.
In the proteomics analysis, proteins not identified in more than 20% of the samples were excluded. The remaining missing values were imputed using 50% of the lowest detected value for each protein. For each stress test, mixed ANOVAs (timepoint × sex) followed by contrasts against baseline were applied. To correct for type II errors, a threshold false discovery rate (FDR) of 20% was accepted as statistically interesting [90] using the Benjamini–Hochberg procedure. Between-sex comparisons of maximum fold changes were conducted using additional ANOVAs (sex × condition). Volcano plots visualize log2-transformed fold ratios between men and women. A minimally relevant effect was defined as a 30% difference in fold change.
All inferential tests were performed against an alpha level of α = 5%. As a pilot study, focusing on broad-spectrum analysis including proteomics, the sample size was justified by available resources. The statistical power for induced stress and sex differences was estimated using G*Power (v3.1.9.7) and ranged from 50% to 90% for medium (f = 0.25) to large (f = 0.4) effect sizes (r = 0.7).
5. Conclusions
This study is the first to directly compare the TSST and MAST in a mixed-sex sample of self-identified athletes. While most outcome measures did not differ significantly between the stress protocols, the autonomic response did. An untargeted proteomic analysis also revealed indications of potential mechanistic differences. We further observed pronounced sex differences in glucocorticoid and aldosterone responses, particularly during the TSST, underscoring the importance of including both sexes in stress and exercise research. Our data also indicate greater between-subject variability in response to the MAST. Future research should investigate how regular exercise influences stress responses across sexes and stressor types. To advance our understanding of cross-stressor adaptation, studies should not only consider the characteristics of the exercise stimulus but also systematically compare the specific demands of different stress-inducing protocols, including the typical response to exercise training.
Author Contributions
Conceptualization, P.R., B.W., M.M. and R.C.; methodology, P.R., B.W., M.M. and R.C.; validation, P.R.; formal analysis, P.R.; investigation, P.R.; resources, R.C. & B.W.; data curation, P.R.; writing—original draft preparation, P.R.; writing—review and editing, P.R., B.W., M.M. and R.C.; visualization, P.R.; supervision, R.C.; project administration, P.R. and R.C.; All authors have read and agreed to the published version of the manuscript.
Funding
This research received no external funding.
Institutional Review Board Statement
The study was conducted in accordance with the Declaration of Helsinki and approved by the Ethics Committee of the University of Vienna (Reference number: 00880, approval date: 4 May 2023).
Informed Consent Statement
Informed consent was obtained from all subjects involved in the study.
Data Availability Statement
The original data presented in the study are openly available in OSF at https://doi.org/10.17605/OSF.IO/F9ENX.
Acknowledgments
Open Access Funding by the University of Vienna. We thank Tom Smeets for the email exchange and the original MAST protocol. We also thank Urs Nater and Aljoscha Dreisörner for sharing their experiences with the application of the TSST.
Conflicts of Interest
The authors declare no conflicts of interest.
Abbreviations
The following abbreviations are used in this manuscript:
| ANS | Autonomic nervous system |
| AUCi | Area under the curve with respect to increase |
| Cn:C | Cortisone-to-cortisol-ratio |
| DASS-21 | Depression Anxiety Stress Scale (21-itmes) |
| FDR | False discovery rate |
| HF | High Frequency HRV |
| HPA | Hypothalamic–pituitary–adrenal axis |
| HR | Heart rate |
| HRV | Heart rate variability |
| LF | Low-frequency HRV |
| MAST | Maastricht Acute Stress Test |
| RMSSD | Root mean square of successive differences |
| STAI-10 | State Anxiety Inventory (10-items) |
| T:C | Testosterone-to-cortisol-ratio |
| TSST | Trier Social Stress Test |
| VAS100 | Visual analogue scale (100 mm) |
References
- Spencer-Segal, J.L.; Akil, H. Glucocorticoids and Resilience. Horm. Behav. 2019, 111, 131–134. [Google Scholar] [CrossRef]
- Lupien, S.J.; Ouellet-Morin, I.; Hupbach, A.; Tu, M.T.; Buss, C.; Walker, D.; Pruessner, J.; Mcewen, B.S. Beyond the Stress Concept: Allostatic Load—A Developmental Biological and Cognitive Perspective. In Developmental Psychopathology; John Wiley & Sons, Ltd.: Hoboken, NJ, USA, 2015; pp. 578–628. ISBN 978-0-470-93939-0. [Google Scholar]
- Theriault, J.E.; Katsumi, Y.; Reimann, H.M.; Zhang, J.; Deming, P.; Dickerson, B.C.; Quigley, K.S.; Barrett, L.F. It’s Not the Thought That Counts: Allostasis at the Core of Brain Function. Neuron 2025, 113, 4107–4133. [Google Scholar] [CrossRef] [PubMed]
- Epel, E.S.; Crosswell, A.D.; Mayer, S.E.; Prather, A.A.; Slavich, G.M.; Puterman, E.; Mendes, W.B. More than a Feeling: A Unified View of Stress Measurement for Population Science. Front. Neuroendocrinol. 2018, 49, 146–169. [Google Scholar] [CrossRef] [PubMed]
- Selye, H. Stress without Distress. Brux. Med. 1976, 56, 205–210. [Google Scholar] [PubMed]
- Segerstrom, S.C.; Miller, G.E. Psychological Stress and the Human Immune System: A Meta-Analytic Study of 30 Years of Inquiry. Psychol. Bull. 2004, 130, 601–630. [Google Scholar] [CrossRef]
- Brotman, D.J.; Golden, S.H.; Wittstein, I.S. The Cardiovascular Toll of Stress. Lancet 2007, 370, 1089–1100. [Google Scholar] [CrossRef]
- Kivimäki, M.; Steptoe, A. Effects of Stress on the Development and Progression of Cardiovascular Disease. Nat. Rev. Cardiol. 2018, 15, 215–229. [Google Scholar] [CrossRef]
- Wirtz, P.H.; von Känel, R. Psychological Stress, Inflammation, and Coronary Heart Disease. Curr. Cardiol. Rep. 2017, 19, 111. [Google Scholar] [CrossRef]
- Gianotti, L.; Belcastro, S.; D’Agnano, S.; Tassone, F. The Stress Axis in Obesity and Diabetes Mellitus: An Update. Endocrines 2021, 2, 334–347. [Google Scholar] [CrossRef]
- Hackett, R.A.; Steptoe, A. Type 2 Diabetes Mellitus and Psychological Stress—A Modifiable Risk Factor. Nat. Rev. Endocrinol. 2017, 13, 547–560. [Google Scholar] [CrossRef]
- Kivimäki, M.; Bartolomucci, A.; Kawachi, I. The Multiple Roles of Life Stress in Metabolic Disorders. Nat. Rev. Endocrinol. 2023, 19, 10–27. [Google Scholar] [CrossRef] [PubMed]
- McEwen, B.S.; Akil, H. Revisiting the Stress Concept: Implications for Affective Disorders. J. Neurosci. 2020, 40, 12–21. [Google Scholar] [CrossRef] [PubMed]
- Chan, J.S.Y.; Liu, G.; Liang, D.; Deng, K.; Wu, J.; Yan, J.H. Special Issue–Therapeutic Benefits of Physical Activity for Mood: A Systematic Review on the Effects of Exercise Intensity, Duration, and Modality. J. Psychol. 2019, 153, 102–125. [Google Scholar] [CrossRef]
- Stonerock, G.L.; Hoffman, B.M.; Smith, P.J.; Blumenthal, J.A. Exercise as Treatment for Anxiety: Systematic Review and Analysis. Ann. Behav. Med. Publ. Soc. Behav. Med. 2015, 49, 542–556. [Google Scholar] [CrossRef]
- Mücke, M.; Ludyga, S.; Colledge, F.; Gerber, M. Influence of Regular Physical Activity and Fitness on Stress Reactivity as Measured with the Trier Social Stress Test Protocol: A Systematic Review. Sports Med. 2018, 48, 2607–2622. [Google Scholar] [CrossRef]
- Gerber, M.; Pühse, U. Review Article: Do Exercise and Fitness Protect against Stress-Induced Health Complaints? A Review of the Literature. Scand. J. Public Health 2009, 37, 801–819. [Google Scholar] [CrossRef]
- Martín-Rodríguez, A.; Gostian-Ropotin, L.A.; Beltrán-Velasco, A.I.; Belando-Pedreño, N.; Simón, J.A.; López-Mora, C.; Navarro-Jiménez, E.; Tornero-Aguilera, J.F.; Clemente-Suárez, V.J. Sporting Mind: The Interplay of Physical Activity and Psychological Health. Sports 2024, 12, 37. [Google Scholar] [CrossRef]
- Fuchs, R.; Klaperski, S. Stressregulation durch Sport und Bewegung. In Handbuch Stressregulation und Sport; Fuchs, R., Gerber, M., Eds.; Springer: Berlin, Heidelberg, 2018; pp. 205–226. ISBN 978-3-662-49322-9. [Google Scholar]
- Athanasiou, N.; Bogdanis, G.C.; Mastorakos, G. Endocrine Responses of the Stress System to Different Types of Exercise. Rev. Endocr. Metab. Disord. 2022, 24, 251–266. [Google Scholar] [CrossRef]
- Michael, S.; Graham, K.S.; Davis, G.M. Cardiac Autonomic Responses during Exercise and Post-Exercise Recovery Using Heart Rate Variability and Systolic Time Intervals—A Review. Front. Physiol. 2017, 8, 301. [Google Scholar] [CrossRef] [PubMed]
- Duclos, M.; Tabarin, A. Exercise and the Hypothalamo-Pituitary-Adrenal Axis. In Frontiers of Hormone Research; Lanfranco, F., Strasburger, C.J., Eds.; S. Karger AG: Basel, Switzerland, 2016; Volume 47, pp. 12–26. ISBN 978-3-318-05868-0. [Google Scholar]
- Kudielka, B.M.; Hellhammer, D.H.; Wüst, S. Why Do We Respond so Differently? Reviewing Determinants of Human Salivary Cortisol Responses to Challenge. Psychoneuroendocrinology 2009, 34, 2–18. [Google Scholar] [CrossRef]
- Sothmann, M.S. The Cross-Stressor Adaptation Hypothesis and Exercise Training. In Psychobiology of Physical Activity; Human Kinetics: Champaign, IL, USA, 2006; pp. 149–160. ISBN 978-0-7360-5536-9. [Google Scholar]
- Sothmann, M.S.; Buckworth, J.; Claytor, R.P.; Cox, R.H.; White-Welkley, J.E.; Dishman, R.K. Exercise Training and the Cross-Stressor Adaptation Hypothesis. Exerc. Sport Sci. Rev. 1996, 24, 267–287. [Google Scholar] [CrossRef]
- LeClair, K.B.; Russo, S.J. Using Social Rank as the Lens to Focus on the Neural Circuitry Driving Stress Coping Styles. Curr. Opin. Neurobiol. 2021, 68, 167–180. [Google Scholar] [CrossRef]
- Mason, J.W. A Historical View of the Stress Field. J. Human Stress 1975, 1, 22–36. [Google Scholar] [CrossRef]
- Arvidson, E.; Dahlman, A.S.; Börjesson, M.; Gullstrand, L.; Jonsdottir, I.H. The Effects of Exercise Training on Hypothalamic-Pituitary-Adrenal Axis Reactivity and Autonomic Response to Acute Stress—A Randomized Controlled Study. Trials 2020, 21, 888. [Google Scholar] [CrossRef] [PubMed]
- Gerber, M.; Imboden, C.; Beck, J.; Brand, S.; Colledge, F.; Eckert, A.; Holsboer-Trachsler, E.; Pühse, U.; Hatzinger, M. Effects of Aerobic Exercise on Cortisol Stress Reactivity in Response to the Trier Social Stress Test in Inpatients with Major Depressive Disorders: A Randomized Controlled Trial. J. Clin. Med. 2020, 9, 1419. [Google Scholar] [CrossRef] [PubMed]
- Klaperski, S.; Von Dawans, B.; Heinrichs, M.; Fuchs, R. Effects of a 12-Week Endurance Training Program on the Physiological Response to Psychosocial Stress in Men: A Randomized Controlled Trial. J. Behav. Med. 2014, 37, 1118–1133. [Google Scholar] [CrossRef] [PubMed]
- Bae, Y.J.; Reinelt, J.; Netto, J.; Uhlig, M.; Willenberg, A.; Ceglarek, U.; Villringer, A.; Thiery, J.; Gaebler, M.; Kratzsch, J. Salivary Cortisone, as a Biomarker for Psychosocial Stress, Is Associated with State Anxiety and Heart Rate. Psychoneuroendocrinology 2019, 101, 35–41. [Google Scholar] [CrossRef]
- Botía, M.; Escribano, D.; Martínez-Subiela, S.; Tvarijonaviciute, A.; Tecles, F.; López-Arjona, M.; Cerón, J.J. Different Types of Glucocorticoids to Evaluate Stress and Welfare in Animals and Humans: General Concepts and Examples of Combined Use. Metabolites 2023, 13, 106. [Google Scholar] [CrossRef]
- Barel, E.; Abu-Shkara, R.; Colodner, R.; Masalha, R.; Mahagna, L.; Zemel, O.C.; Cohen, A. Gonadal Hormones Modulate the HPA-Axis and the SNS in Response to Psychosocial Stress. J. Neurosci. Res. 2018, 96, 1388–1397. [Google Scholar] [CrossRef]
- Chichinadze, K.; Chichinadze, N. Stress-Induced Increase of Testosterone: Contributions of Social Status and Sympathetic Reactivity. Physiol. Behav. 2008, 94, 595–603. [Google Scholar] [CrossRef]
- Kirschbaum, C.; Pirke, K.M.; Hellhammer, D.H. The ‘Trier Social Stress Test’—A Tool for Investigating Psychobiological Stress Responses in a Laboratory Setting. Neuropsychobiology 1993, 28, 76–81. [Google Scholar] [CrossRef]
- Gu, H.; Ma, X.; Zhao, J.; Liu, C. A Meta-Analysis of Salivary Cortisol Responses in the Trier Social Stress Test to Evaluate the Effects of Speech Topics, Sex, and Sample Size. Compr. Psychoneuroendocrinol. 2022, 10, 100125. [Google Scholar] [CrossRef]
- Dickerson, S.S.; Kemeny, M.E. Acute Stressors and Cortisol Responses: A Theoretical Integration and Synthesis of Laboratory Research. Psychol. Bull. 2004, 130, 355–391. [Google Scholar] [CrossRef]
- Smeets, T.; Cornelisse, S.; Quaedflieg, C.W.E.M.; Meyer, T.; Jelicic, M.; Merckelbach, H. Introducing the Maastricht Acute Stress Test (MAST): A Quick and Non-Invasive Approach to Elicit Robust Autonomic and Glucocorticoid Stress Responses. Psychoneuroendocrinology 2012, 37, 1998–2008. [Google Scholar] [CrossRef]
- Cowley, E.S.; Olenick, A.A.; McNulty, K.L.; Ross, E.Z. “Invisible Sportswomen”: The Sex Data Gap in Sport and Exercise Science Research. Women Sport Phys. Act. J. 2021, 29, 146–151. [Google Scholar] [CrossRef]
- Landen, S.; Hiam, D.; Voisin, S.; Jacques, M.; Lamon, S.; Eynon, N. Physiological and Molecular Sex Differences in Human Skeletal Muscle in Response to Exercise Training. J. Physiol. 2023, 601, 419–434. [Google Scholar] [CrossRef]
- Kraemer, W.J.; Ratamess, N.A.; Hymer, W.C.; Nindl, B.C.; Fragala, M.S. Growth Hormone(s), Testosterone, Insulin-Like Growth Factors, and Cortisol: Roles and Integration for Cellular Development and Growth With Exercise. Front. Endocrinol. 2020, 11, 33. [Google Scholar] [CrossRef] [PubMed]
- Cano Sokoloff, N.; Misra, M.; Ackerman, K.E. Exercise, Training, and the Hypothalamic-Pituitary-Gonadal Axis in Men and Women. Front. Horm. Res. 2016, 47, 27–43. [Google Scholar] [CrossRef] [PubMed]
- Zilioli, S.; Watson, N.V. Testosterone across Successive Competitions: Evidence for a ‘Winner Effect’ in Humans? Psychoneuroendocrinology 2014, 47, 1–9. [Google Scholar] [CrossRef] [PubMed]
- Jiménez, M.; Alvero-Cruz, J.R.; Solla, J.; García-Bastida, J.; García-Coll, V.; Rivilla, I.; Ruiz, E.; García-Romero, J.; Carnero, E.A.; Clemente-Suárez, V.J. Competition Seriousness and Competition Level Modulate Testosterone and Cortisol Responses in Soccer Players. Int. J. Environ. Res. Public. Health 2020, 17, 350. [Google Scholar] [CrossRef]
- Schwabe, L.; Schächinger, H. Ten Years of Research with the Socially Evaluated Cold Pressor Test: Data from the Past and Guidelines for the Future. Psychoneuroendocrinology 2018, 92, 155–161. [Google Scholar] [CrossRef]
- Chapman, K.; Holmes, M.; Seckl, J. 11β-Hydroxysteroid Dehydrogenases: Intracellular Gate-Keepers of Tissue Glucocorticoid Action. Physiol. Rev. 2013, 93, 1139–1206. [Google Scholar] [CrossRef]
- Allen, A.P.; Kennedy, P.J.; Cryan, J.F.; Dinan, T.G.; Clarke, G. Biological and Psychological Markers of Stress in Humans: Focus on the Trier Social Stress Test. Neurosci. Biobehav. Rev. 2014, 38, 94–124. [Google Scholar] [CrossRef]
- Leal, D.V.; Taylor, L.; Hough, J. Reproducibility of Acute Steroid Hormone Responses in Men to Short-Duration Running. Int. J. Sports Physiol. Perform. 2019, 14, 1430–1437. [Google Scholar] [CrossRef] [PubMed]
- Hackney, A.C.; Walz, E.A. Hormonal Adaptation and the Stress of Exercise Training: The Role of Glucocorticoids. Trends Sport Sci. 2013, 20, 165–171. [Google Scholar] [PubMed]
- Tesarz, J.; Schuster, A.K.; Hartmann, M.; Gerhardt, A.; Eich, W. Pain Perception in Athletes Compared to Normally Active Controls: A Systematic Review with Meta-Analysis. Pain 2012, 153, 1253. [Google Scholar] [CrossRef] [PubMed]
- Ehlers, T.S.; Møller, S.; Hansen, C.C.; Tamariz-Ellemann, A.S.; Vermeulen, T.D.; Shoemaker, J.K.; Gliemann, L.; Hellsten, Y. Sympathetic Activity Is Not a Main Cause of Blood Pressure Reduction with Exercise Training in Un-Medicated Middle-Aged/Older Men. Scand. J. Med. Sci. Sports 2023, 33, 586–596. [Google Scholar] [CrossRef]
- Lamotte, G.; Boes, C.J.; Low, P.A.; Coon, E.A. The Expanding Role of the Cold Pressor Test: A Brief History. Clin. Auton. Res. 2021, 31, 153–155. [Google Scholar] [CrossRef]
- Ifuku, H.; Moriyama, K.; Arai, K.; Shiraishi-Hichiwa, Y. Regulation of Cardiac Function during a Cold Pressor Test in Athletes and Untrained Subjects. Eur. J. Appl. Physiol. 2007, 101, 75–79. [Google Scholar] [CrossRef]
- Hamunen, K.; Kontinen, V.; Hakala, E.; Talke, P.; Paloheimo, M.; Kalso, E. Effect of Pain on Autonomic Nervous System Indices Derived from Photoplethysmography in Healthy Volunteers. BJA Br. J. Anaesth. 2012, 108, 838–844. [Google Scholar] [CrossRef]
- Huang, M.; Yoo, J.-K.; Stickford, A.S.L.; Moore, J.P.; Hendrix, J.M.; Crandall, C.G.; Fu, Q. Early Sympathetic Neural Responses during a Cold Pressor Test Linked to Pain Perception. Clin. Auton. Res. 2021, 31, 215–224. [Google Scholar] [CrossRef]
- Castellani, J.W.; Tipton, M.J. Cold Stress Effects on Exposure Tolerance and Exercise Performance. Compr. Physiol. 2016, 6, 443–469. [Google Scholar] [CrossRef]
- Campbell, J.; Ehlert, U. Acute Psychosocial Stress: Does the Emotional Stress Response Correspond with Physiological Responses? Psychoneuroendocrinology 2012, 37, 1111–1134. [Google Scholar] [CrossRef] [PubMed]
- Dalile, B.; La Torre, D.; Verbeke, K.; Vanm Oudenhove, L.; Vervliet, B. When the Mind Says One Thing, but the HPA Axis Says Another: Lack of Coherence between Subjective and Neuroendocrine Stress Response Trajectories in Healthy Men. Psychoneuroendocrinology 2022, 139, 105692. [Google Scholar] [CrossRef] [PubMed]
- Forcier, K.; Stroud, L.R.; Papandonatos, G.D.; Hitsman, B.; Reiches, M.; Krishnamoorthy, J.; Niaura, R. Links between Physical Fitness and Cardiovascular Reactivity and Recovery to Psychological Stressors: A Meta-Analysis. Health Psychol. 2006, 25, 723–739. [Google Scholar] [CrossRef]
- Jackson, E.M.; Dishman, R.K. Cardiorespiratory Fitness and Laboratory Stress: A Meta-Regression Analysis. Psychophysiology 2006, 43, 57–72. [Google Scholar] [CrossRef] [PubMed]
- Linden, W.; Earle, T.L.; Gerin, W.; Christenfeld, N. Physiological Stress Reactivity and Recovery: Conceptual Siblings Separated at Birth? J. Psychosom. Res. 1997, 42, 117–135. [Google Scholar] [CrossRef]
- Degering, M.; Linz, R.; Puhlmann, L.M.C.; Singer, T.; Engert, V. Revisiting the Stress Recovery Hypothesis: Differential Associations of Cortisol Stress Reactivity and Recovery after Acute Psychosocial Stress with Markers of Long-Term Stress and Health. Brain Behav. Immun.-Health 2023, 28, 100598. [Google Scholar] [CrossRef]
- Liu, J.J.W.; Ein, N.; Peck, K.; Huang, V.; Pruessner, J.C.; Vickers, K. Sex Differences in Salivary Cortisol Reactivity to the Trier Social Stress Test (TSST): A Meta-Analysis. Psychoneuroendocrinology 2017, 82, 26–37. [Google Scholar] [CrossRef]
- Heindl, S.; Holzschneider, J.; Hinz, A.; Sayk, F.; Fehm, H.L.; Dodt, C. Acute Effects of Aldosterone on the Autonomic Nervous System and the Baroreflex Function in Healthy Humans. J. Neuroendocrinol. 2006, 18, 115–121. [Google Scholar] [CrossRef]
- Caroccia, B.; Seccia, T.M.; Barton, M.; Rossi, G.P. Estrogen Signaling in the Adrenal Cortex. Hypertension 2016, 68, 840–848. [Google Scholar] [CrossRef]
- O’Bryan, S.M.; Connor, K.R.; Drummer, D.J.; Lavin, K.M.; Bamman, M.M. Considerations for Sex-Cognizant Research in Exercise Biology and Medicine. Front. Sports Act. Living 2022, 4, 903992. [Google Scholar] [CrossRef]
- Kasiak, P.; Kowalski, T.; Rębiś, K.; Klusiewicz, A.; Ładyga, M.; Sadowska, D.; Wilk, A.; Wiecha, S.; Barylski, M.; Poliwczak, A.R.; et al. Is the Ventilatory Efficiency in Endurance Athletes Different?—Findings from the NOODLE Study. J. Clin. Med. 2024, 13, 490. [Google Scholar] [CrossRef]
- Büttler, R.M.; Bagci, E.; Brand, H.S.; den Heijer, M.; Blankenstein, M.A.; Heijboer, A.C. Testosterone, Androstenedione, Cortisol and Cortisone Levels in Human Unstimulated, Stimulated and Parotid Saliva. Steroids 2018, 138, 26–34. [Google Scholar] [CrossRef]
- Ney, L.J.; Felmingham, K.L.; Nichols, D. Reproducibility of Saliva Progesterone Measured by Immunoassay Compared to Liquid Chromatography Mass Spectrometry. Anal. Biochem. 2020, 610, 113984. [Google Scholar] [CrossRef]
- Sakkas, D.; Howles, C.M.; Atkinson, L.; Borini, A.; Bosch, E.A.; Bryce, C.; Cattoli, M.; Copperman, A.B.; de Bantel, A.F.; French, B.; et al. A Multi-Centre International Study of Salivary Hormone Oestradiol and Progesterone Measurements in ART Monitoring. Reprod. Biomed. Online 2021, 42, 421–428. [Google Scholar] [CrossRef] [PubMed]
- Sacha, J. Why Should One Normalize Heart Rate Variability with Respect to Average Heart Rate. Front. Physiol. 2013, 4, 306. [Google Scholar] [CrossRef] [PubMed]
- Leliavski, A.; Dumbell, R.; Ott, V.; Oster, H. Adrenal Clocks and the Role of Adrenal Hormones in the Regulation of Circadian Physiology. J. Biol. Rhythms 2015, 30, 20–34. [Google Scholar] [CrossRef] [PubMed]
- Kajantie, E.; Phillips, D.I.W. The Effects of Sex and Hormonal Status on the Physiological Response to Acute Psychosocial Stress. Psychoneuroendocrinology 2006, 31, 151–178. [Google Scholar] [CrossRef] [PubMed]
- Nilges, P.; Essau, C. Die Depressions-Angst-Stress-Skalen. Schmerz 2015, 29, 649–657. [Google Scholar] [CrossRef]
- Labuschagne, I.; Grace, C.; Rendell, P.; Terrett, G.; Heinrichs, M. An Introductory Guide to Conducting the Trier Social Stress Test. Neurosci. Biobehav. Rev. 2019, 107, 686–695. [Google Scholar] [CrossRef]
- Zänkert, S.; Kudielka, B.M.; Wüst, S. Effect of Sugar Administration on Cortisol Responses to Acute Psychosocial Stress. Psychoneuroendocrinology 2020, 115, 104607. [Google Scholar] [CrossRef]
- Goodman, W.K.; Janson, J.; Wolf, J.M. Meta-Analytical Assessment of the Effects of Protocol Variations on Cortisol Responses to the Trier Social Stress Test. Psychoneuroendocrinology 2017, 80, 26–35. [Google Scholar] [CrossRef]
- Engert, V.; Efanov, S.I.; Duchesne, A.; Vogel, S.; Corbo, V.; Pruessner, J.C. Differentiating Anticipatory from Reactive Cortisol Responses to Psychosocial Stress. Psychoneuroendocrinology 2013, 38, 1328–1337. [Google Scholar] [CrossRef]
- García Martínez, C.A.; Otero Quintana, A.; Vila, X.A.; Lado Touriño, M.J.; Rodríguez-Liñares, L.; Rodríguez Presedo, J.M.; Méndez Penín, A.J. Heart Rate Variability Analysis with the R Package RHRV; Use R!; Springer International Publishing: Cham, Switzerland, 2024; ISBN 978-3-031-65752-8. [Google Scholar]
- Vila, J.; Palacios, F.; Presedo, J.; Fernandez-Delgado, M.; Felix, P.; Barro, S. Time-Frequency Analysis of Heart-Rate Variability. IEEE Eng. Med. Biol. Mag. 1997, 16, 119–126. [Google Scholar] [CrossRef]
- Adu, P.; Popoola, T.; Iqbal, N.; Medvedev, O.N.; Simpson, C.R. Validating the Depression Anxiety Stress Scales (DASS-21) across Germany, Ghana, India, and New Zealand Using Rasch Methodology. J. Affect. Disord. 2025, 383, 363–373. [Google Scholar] [CrossRef] [PubMed]
- Grimm, J. STAI-Test: State-Trait-Anxiety Inventory (Deutsche Version); MF-Working Paper; Methodenforum der Universität Wien: Wien, Austria, 2009; Volume 2. [Google Scholar]
- Fischer, S.; Doerr, J.M.; Strahler, J.; Mewes, R.; Thieme, K.; Nater, U.M. Stress Exacerbates Pain in the Everyday Lives of Women with Fibromyalgia Syndrome—The Role of Cortisol and Alpha-Amylase. Psychoneuroendocrinology 2016, 63, 68–77. [Google Scholar] [CrossRef] [PubMed]
- Linnemann, A.; Ditzen, B.; Strahler, J.; Doerr, J.M.; Nater, U.M. Music Listening as a Means of Stress Reduction in Daily Life. Psychoneuroendocrinology 2015, 60, 82–90. [Google Scholar] [CrossRef] [PubMed]
- Sattler, F.A.; Nater, U.M.; Mewes, R. Gay Men’s Stress Response to a General and a Specific Social Stressor. J. Neural Transm. 1996, 2021, 1325–1333. [Google Scholar] [CrossRef]
- Ben-Shachar, M.S.; Lüdecke, D.; Makowski, D. Effectsize: Estimation of Effect Size Indices and Standardized Parameters. J. Open Source Softw. 2020, 5, 2815. [Google Scholar] [CrossRef]
- Lakens, D. Calculating and Reporting Effect Sizes to Facilitate Cumulative Science: A Practical Primer for t-Tests and ANOVAs. Front. Psychol. 2013, 4, 863. [Google Scholar] [CrossRef]
- Cowen, S.; Ellison, S.L.R. Reporting Measurement Uncertainty and Coverage Intervals near Natural Limits. Analyst 2006, 131, 710–717. [Google Scholar] [CrossRef] [PubMed]
- Pruessner, J.C.; Kirschbaum, C.; Meinlschmid, G.; Hellhammer, D.H. Two Formulas for Computation of the Area under the Curve Represent Measures of Total Hormone Concentration versus Time-Dependent Change. Psychoneuroendocrinology 2003, 28, 916–931. [Google Scholar] [CrossRef] [PubMed]
- Murray, M.H.; Blume, J.D. FDRestimation: Flexible False Discovery Rate Computation in R. F1000Research 2021, 10, 441. [Google Scholar] [CrossRef] [PubMed]
Disclaimer/Publisher’s Note: The statements, opinions and data contained in all publications are solely those of the individual author(s) and contributor(s) and not of MDPI and/or the editor(s). MDPI and/or the editor(s) disclaim responsibility for any injury to people or property resulting from any ideas, methods, instructions or products referred to in the content. |
© 2025 by the authors. Licensee MDPI, Basel, Switzerland. This article is an open access article distributed under the terms and conditions of the Creative Commons Attribution (CC BY) license.