Abstract
This study describes the results of integrative analysis of cyanobacterial communities in waterbodies of Moscow, Russia. 16S rRNA V3–V4 metabarcoding and light microscopy are implemented to investigate the diversity, abundance, and distribution of cyanobacteria, including the representatives of potentially toxigenic taxa—Anabaena, Aphanizomenon, Dolichospermum, Microcystis, and Planktothrix. High convergence is observed between microscopy and metabarcoding data for dominant genera, including Microcystis and Planktothrix. Sequence verification reveals total (100%) similarity between previously isolated toxigenic strains (e.g., Microcystis aeruginosa CBMC403m and CBMC523m) and corresponding highly abundant ASVs. In addition, current study ascertains the efficiency of metabarcoding for detection of rare cyanobacterial taxa missed by microscopy. We hereby acknowledge the limitations of V3–V4 16S rRNA-based metabarcoding approach for region species-level resolution and distinguishing potentially toxigenic taxa of cyanobacteria. At the same time, our findings validate metabarcoding as a rapid and reliable tool for monitoring of CyanoHABs in urban water ecosystems.
1. Introduction
Methods of high-throughput sequencing or DNA metabarcoding are now increasingly being used to study the diversity of cyanobacteria [1,2,3,4,5]. While DNA metabarcoding still has some constraints—incompleteness of databases, incorrect identification of reference sequences, or limitations of molecular markers for resolution of species (sometimes genera)—studies indicate that this approach provides results comparable to microscopy, reveals a greater diversity of cyanobacteria, and serves as a more sensitive, efficient, and less time-consuming method for assessing cyanobacteria communities, as well as for identifying toxigenic (and potentially toxigenic) species [1,2,3,4,5,6].
Events of harmful cyanobacterial blooms (CyanoHABs) are registered all over the world with increasing frequency [4,7,8]. The danger of CyanoHABs lies in the fact that cyanobacteria are capable of synthesizing a variety of secondary metabolites, e.g., cyanotoxins, including the hepatotoxic heptapeptides microcystins, the neurotoxic alkaloids anatoxins, saxitoxins, and the cytotoxic alkaloid cylindrospermopsin. These metabolites can accumulate in water environments and, if ingested, can affect human and animal health, causing serious poisoning or death [9,10,11]. To date, toxigenicity is demonstrated for 40 genera of cyanobacteria [12].
In Russia, the number of cyanobacterial blooms has been increasing in the recent decades. Over time, the content of toxins was detected using HPLC-HRMS methods in various waterbodies throughout Russia—in the lakes and ponds of recreational utility in the region of Saint-Petersburg [13,14], in Lake Baikal and the reservoirs of the Angarsk cascade of hydroelectric power plants [15,16,17], in the reservoirs of the River Volga and Tsimlyansk reservoir of the lower reaches of the River Don [11,18,19], etc. Therefore, the detection and monitoring of CyanoHABs is urgent for maintaining the safety of surface sources of drinking water and recreational waters for human health. DNA metabarcoding is considered as an effective tool for such monitoring. However, studies of freshwater cyanobacterial communities using high-throughput sequencing approaches are still limited. Mostly, the studies were devoted to the study of cyanobacterial metagenome in Lake Baikal [20,21,22,23,24].
The city of Moscow is the largest city in Russia, with the population of more than 13 million people live. About 150 small rivers and streams and about 240 open reservoirs (ponds and lakes) flow through the city territory [25]. These reservoirs are experiencing a great anthropogenic impact, as well as a significant recreational load. Given the high risk of CyanoHABs to human health, special control is required in reservoirs that are used by the city residents for recreational activities, e.g., swimming and fishing. This work is the first study of cyanobacteria in the ecosystems of Moscow utilizing DNA metabarcoding and microscopy approaches. Current research is a continuation of our recent study, which investigated the morphology, molecular data, and toxigenic potential of 20 strains of cyanobacteria from 12 reservoirs in Moscow and resulted in the discovery of two toxigenic strains of Microcystis aeruginosa (Kützing) Kützing [26].
The purpose of this study is to analyze the diversity of cyanobacteria, including potentially toxigenic species in 18 reservoirs of Moscow (including 12 locations assessed in [26]) using two approaches—metabarcoding and microscopy. We hereby combine and analyze three datasets: (1) data on the diversity, distribution, and development of cyanobacteria based on DNA metabarcoding, (2) data on the diversity and abundance of cyanobacteria based on microscopy, and (3) cyanobacterial metagenome data. We compare the reference sequences of cyanobacteria strains isolated from the same reservoirs and characterized in detail in our recent study [26] to the ASVs obtained through DNA metabarcoding.
2. Materials and Methods
2.1. Study Area and Sample Collection
The sampling was conducted in June–July 2024 across 18 aquatic sites (rivers and ponds) of Moscow city. The sites were chosen for sampling due to their recreational role and exposure to anthropogenic pressure. Recreational waterbodies—Bolshoy Krylatsky Pond (M1), Krylatskoye Rowing Canal (M2), Bolshoy Sadovy Pond (M6), and Meshchersky Pond (M10)—are used for swimming and sports training in the spring–summer season. The ponds—Nizhny Fermsky Pond (M7), Unnamed pond in Odintsovsky district (M9), Unnamed pond #1 in Marfino district (M13), Unnamed pond #2 in Marfino district (M14), Pervy Kamensky Pond (M16), Patriarshiy Pond (M18), and Clean Pond (M19)—are located in park areas of the city, i.e., prohibited for swimming, but, at the same, are utilized for unauthorized fishing. Information about the collected samples is summarized in Table 1.

Table 1.
List of collected samples with hydrochemical parameters of water.
The samples of phytoplankton were collected in the coastal area at every sampling site. Surface water (100 L) was concentrated through a sterile phytoplankton Epstein net (mesh size = 29 µm) to 250 mL. After each round of sample collection, the plankton net was soaked in a 10% sodium hypochlorite solution for 2–3 h. Then, two 50 mL subsamples were collected from the total sample. For microscopic analysis, the subsample was fixed by 40% formaldehyde solution to a final concentration of 4%. For 16S rRNA gene analysis, the subsample was stored in a cooling bag up to arrival at the laboratory. Afterwards, the sample was filtered through Reatrek-filter analytical track-etched membranes (LLC “REATREK-Filter”, Obninsk, Russia) with a 0.4-μm pore diameter using a Sartorius vacuum filtration apparatus (Sartorius, Göttingen, Germany) and a hand vacuum pump. The filters were immediately frozen at −20 °C and kept frozen until analysis.
2.2. Analysis of Environmental Parameters
Hydrological parameters—water temperature, pH, and conductivity (μS/cm)—were measured in situ using a Hanna Combo (HI 98129) handheld device (Hanna Instruments, Woonsocket, RI, USA). Information about the collected samples is summarized in Table 1.
Analysis of concentrations of the dissolved inorganic nutrients including DIN (NH4+, NO2−, and NO3−), DIP (PO43−), and DSi (SiO32−) was conducted in the testing center MSULab (Moscow, Russia). Information about corresponding hydrochemical measurements is summarized in Supplementary Table S1.
2.3. Microscopy, Morphological Identification, and Quantitative Analysis
Morphological examination was conducted using a Zeiss Axio Scope A1 microscope (ZEISS, Oberkochen, Germany) equipped with an oil immersion objective (100×, n.a. 1.4, DIC) and a Zeiss Axiocam ERc 5s camera (ZEISS, Oberkochen, Germany). Morphological identification was carried out based on LM observations, using standard taxonomic keys for cyanobacteria [27,28].
For quantitative processing of phytoplankton, a 0.001 cm3 Goryaev counting chamber was used. A cell was taken as a counting unit. Recalculation of abundance was performed using the following formula:
where N is the number of cells in 1 cm3 of water, n is the number of cells in a 0.001 cm3 chamber, V1 is the volume of sample concentrate, V2 is the volume of the chamber, and w is the volume of filtered water [29].
2.4. DNA Extraction, PCR Amplification, and High-Throughput Sequencing
Extraction and purification of environmental DNA, primers synthesis, PCR amplification, and high-throughput sequencing were carried out at the research and production company Syntol (Moscow, Russia). DNA extraction and purification were performed using the Sorb-GMO-B plant material extraction kit (cat. no. GM-503-50, Syntol, Moscow, Russia). The concentration of DNA was determined using a fluorescence-based quantitative analysis method with a kit for counting small amounts of double-stranded DNA in dsDNA solution on a Qubit 4 (Thermo Fisher Scientific, Waltham, MA, USA). The extracted DNA was stored at −80 °C, before being used as the template for PCR amplification. The region V3–V4 of the 16S rRNA (a barcode of 425 bp) was amplified using the pair of cyanobacteria-specific primers CYA359F (5′-GGGGAATYTTCCGCAATGG-3′) and CYA781Rd (5′-GACTACWGGGGTATCTAATCCCWTT-3′) [30,31,32]. In the study conducted by Kang et al. [31], it was shown that using cyanobacteria-specific 16S rRNA gene primers detect a significantly higher number of cyanobacteria than universal prokaryotic 16S rRNA gene primers. Libraries were prepared for sequencing using the protocol described in the 16S Metagenomic Sequencing Library Preparation manual (Part # 15044223 Rev. B; Illumina, San Diego, CA, USA). The PCR cycle conditions were as follows: (1) initial denaturation for 3 min at 95 °C; (2) 25 cycles of 30 s denaturation at 95 °C, 30 s annealing at 55 °C, and 30 s extension at 72 °C; (3) final extension at 72 °C for 5 min, ending at 4 °C. Purification of PCR products was conducted using XP Beads (Illumina, San Diego, CA, USA). Indexing libraries with Nextera XT indices were used (Illumina, San Diego, CA, USA). The library was subsequently sequenced on an Illumina MiSeq platform and 250 bp paired-end reads were generated using MiSeq Reagent Kit v2 (500 cycles) (Illumina, San Diego, CA, USA).
Raw data was deposited to the National Center for Biotechnology Information (NCBI), BioProject number: PRJNA1358805.
2.5. Bioinformatic Processing
The raw Illumina paired-end reads obtained from Syntol (Moscow, Russia) were processed using the QIIME 2 pipeline (version 2023.x; https://qiime2.org) following the standard amplicon sequence variant (ASV)-based workflow. All analyses were performed in a Linux environment.
Demultiplexed reads were trimmed to remove primers and low-quality regions (Phred < 20). Quality filtering, denoising, merging of paired reads, and chimera removal were carried out using the DADA2 plugin (qiime dada2 de-noise-paired). Parameters were optimized per dataset (trunc_len_f = 250, trunc_len_r = 230, max_ee = 2), ensuring the retention of high-quality reads. The process generated a high-resolution ASV table representing unique, error-corrected sequences.
Taxonomic assignment of representative ASVs was performed using a Naïve Bayes classifier trained on the SILVA v138 reference database (https://www.arb-silva.de, accessed on 9 October 2025), specific to the bacterial 16S rRNA V3–V4 region. Classification was conducted with the qiime feature-classifier classify-sklearn plugin using a confidence threshold of 0.7. Sequences annotated as mitochondria, chloroplasts, Eukaryota, or unclassified at the domain level were filtered out using the qiime taxa filter-table and qiime taxa filter-seqs commands.
To minimize sequencing artifacts, ASVs with fewer than 10 reads across all samples were filtered out (qiime feature-table filter-features-p-min-frequency 10). The resulting filtered table (ASV_counts_corrected.csv) was exported for further statistical analysis.
The progress of reads through each DADA2 processing stage—input, filtered, denoised, merged, and non-chimeric—was summarized in the read-tracking file (dada2_read_tracking_final.xlsx). These statistics were used to evaluate sequencing quality and retention efficiency.
Taxonomic assignments of the most abundant ASVs and names associated with rare taxa, monotypic genera, and taxa typical of specific environments were further manually verified using NCBI BLASTn algorithm (https://blast.ncbi.nlm.nih.gov/Blast.cgi?PROGRAM=blastn&BLAST_SPEC=GeoBlast&PAGE_TYPE=BlastSearch, accessed on 9 October 2025) (percent identity > 98%, query cover = 100%). This verification revealed several misannotations typical for automated database classifications. For example, 183 ASVs with abundance from 3 to 36,626 assigned to monotypic genus Caldora (C. penicillata described as a pantropical marine species) based Greengenes2 database were re-assigned as chloroplast 16S rRNA gene of uncultured eukaryote or cyanobacterium clone; 28 ASVs from them with abundance from 147 to 21,743 reads were re-assigned as chloroplast 16S rRNA gene of different diatoms from class Bacillariophyceae (Nitzschia, Surirella, Gomphonema, Diatoma, Amphora), from class Mediophyceae (Stephanocyclus, Thalassiosira, Acanthoceras, Cyclotella), and Coscinodiscophyceae (Melosira varians). One ASV was re-assigned to Chrysochromulina parva (Coccolithophyceae). Representatives of all these genera are common in water bodies of the European part of Russia. ASVs assigned to monotypic genus of a seaweed symbiont Waterburya were re-assigned to Pleurocapsa, some species of which are known as a freshwater. Ten ASVs (abundance 6-1047) of marine species Allocoleopsis franciscana were re-assigned to genus Microcoleus, Pycnacronema, and Phormidium, representatives of which common in fresh waterbodies. Eighteen ASVs with abundance from 3 to 76,737 referred to an invalidly published genus Vulcanococcus renamed as Synechococcus sp. based on NCBI BLAST. All taxon names from molecular-genetic and microscopy data as well as taxonomy position at the levels of order and family were harmonized according to the taxonomy used in the continuously updated Algaebase [33].
For the convenience of further analysis, all ASVs were assigned with numbers in descending order of the total abundance of reads.
It is worth mentioning that cyanobacteria were not detected in sample M15 either during microscopic analysis, or during 16S rRNA metabarcoding. Therefore, this material was excluded from the analysis.
2.6. Phylogenetic Analysis
For phylogenetic analysis, sorting of ASVs was performed. At the first stage, we selected only the ASVs identified to the species or genus level (sometimes families if they had a high—>2000—total abundance) were selected. The total number of selected ASVs was 781. At the second stage, ASVs with a total abundance of >200 (or >0.01%) reads were selected for the phylogeny and all ASVs (regardless of abundance) of potentially toxic species and genera were retained. The latter are discussed in detail in this study (Dolichospermum, Planktothrix, Aphanizomenon, Woronichinia, Snowella, Argonema). As a result, the dataset consisted of 323 ASVs from 56 genera. The data matrix was supplemented with sequences of type strains (if available) of the corresponding species/genera. The choice of type strains was based on [34]. For ASVs 99.74–100% similar to the NCBI sequences, the numbers of the corresponding strains are given.
The constructed dataset was aligned through the G-INS-I algorithm in Mafft ver.7 (RIMD, Osaka, Japan) [35]. Aligned matrix was trimmed and unpaired regions were edited in MEGA11.5 [36]. The resulting dataset comprised 382 nucleotides. Bayesian inference (BI) analysis was performed in BEAST ver.1.10.1 software (BEAST Developers, Auckland, New Zealand [37]. The following parameters were chosen for the BI study: Yule process tree prior speciation model, GTR + G + I substitution model, 10 MCMC analyses, and 10 mln generations (burn-in 1 mln generations). The resulting data of BI was analyzed in Tracer ver. 1.7.1 (MCMC Trace Analysis Tool, Edinburgh, UK [37], the initial 10% of trees were removed. Randomized Axelerated Maximum Likelihood (RAxML) search was utilized to assess the tree topologies robustness uisng the raxmlGUI 2.0 software [38], 1000 replicas, GTR substitution matrix, and gamma substitution rates. The matrix for RAxML was identical to that used for BI. The best resulting phylogram from BI and RAxML was analyzed in FigTree ver.1.4.4 (University of Edinburgh, Edinburgh, UK) and finally edited in Adobe Photoshop CC ver.19.0 (Adobe, San Jose, CA, USA).
In addition, the degree of similarity between gene sequences of type strains and corresponding sequences from our analysis was estimated by the calculatuion of p-distances. The values of p-distances were determined using MEGA11.5 software, calculated according to the formula (1 − p) × 100.
The results of phylogenetic analysis and p-distance calculation can be accessed in Supplementary Files (File S2, Tables S2–S7).
3. Results
As a result of the analysis of the V3–V4 region of the 16S rRNA gene using cyano-specific primers, a total of 3887 ASV were obtained from 18 studied samples. At the level of macrotaxa, representatives of phylum Cyanobacteriota predominate in the communities (1782 ASVs, 46%) (Figure 1A). A high proportion of the sequences belong to phylum Patescibacteria (16%), Bacillota (13%), and Acidobacteriota (9%). The cumulative proportion of other bacterial groups does not exceed 6%. Overall, the community includes the representatives of 28 phyla.
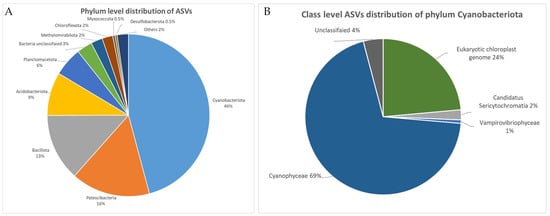
Figure 1.
Distribution of ASVs for V3–V4 hypervariable region of 16S rRNA gene. (A) Phylum-level distribution. (B) Class-level distribution of phylum Cyanobacteriota.
The analysis of total ASVs list showed that the number of ASVs in the waterbodies varies from 68 (M18) to 1025 (M14) with a median of 348 ASVs, the abundance of sequences in the reservoirs varied slightly, from 108,234 to 176,158. The proportion of Cyanophyceae ranges from 51.7% (M8) to 99.7% (M9) with a median of 98.5%. The ASVs as singletons or doubletons (n = 45) were removed from the dataset.
3.1. Taxonomic Composition of Cyanobacteria Community Based on 16S rRNA Gene Metabarcoding
Among the representatives of Cyanobacteriota, more than 2/3 of ASVs (69%) belong to the class Cyanophyceae, non-photosynthetic phylogenetic relatives of cyanobacteria including 50 ASVs (3%) (37 ASVs—Sericytochromatia—and 13 ASV—Vampirovibrionophyceae (=Vampirovibrionia according to Greengenes2 database)). Almost a third of ASVs (n = 420 or 24%) originate from the eukaryotic plastid genome (Figure 1B). The proportion of Cyanobacteriota sequences unclassified at the level of class is 4%. Further analysis includes only the ASVs assigned to Cyanophyceae (1239 ASVs in total).
At the level of orders, among the ASVs assigned to Cyanophyceae, 976 ASVs (78%) are classified. Slightly fewer are determined to the level of families—929 ASVs (74.5%). At the genus level, we were able to assign only 770 ASVs (63%). The general taxonomic composition was represented by the cyanobacteria of 22 orders, 38 families, and 76 genera. In terms of ASVs diversity, Synechococcales (223 ASVs, 18%), Nostocales (178 ASVs, 14%), Chroococcales (130 ASVs, 10%), Leptolyngbyales (106. ASVs or 9%), and Oscillatoriales (101 ASVs or 8%) predominate at the order level, while the accumulated contribution of the remaining orders does not exceed 4% (49 ASVs) (Figure 2A). Among the genera, the largest number of ASVs belong to Cyanobium (83 ASVs), Synechococcus (56 ASVs), Leptolyngbya (47 ASVs), Nodosilinea (46 ASVs), Dolichospermum (36), Chamaesiphon (27 ASVs), Planktothrix (26 ASVs), Oscillatoria (26 ASVs), Aliterella (22 ASVs), Thermoleptolyngbya (20 ASVs), and Aphanizomenon (17 ASVs). The rest of the genera include no more than 16 ASVs each (Figure 2B).
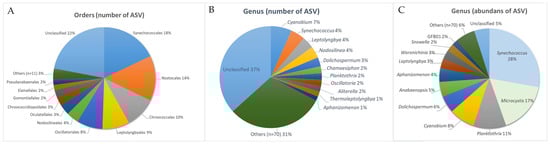
Figure 2.
Distribution of ASVs of phylum Cyanobacteriota by order and genus level. Percentages are indicated. (A) Order-level distribution of ASVs. (B) Leading genera of cyanobacteria by number of ASVs. (C) Leading genera of cyanobacteria by abundance of ASVs.
Regarding the abundance of ASVs, genera are distributed differently (Figure 2C). Eight genera with the highest abundance of sequences (from 51,586 to 576,656) account for 90.8%, of which more than 60% of sequences correspond to Synechococcus (29%), Microcystis (18%), and Planktothrix (11%). The smaller contribution is demonstrated for Cyanobium (9%) and Dolichospermum (6%). In addition, a relatively high abundance of ASVs was noted for Aphanizomenon (5%), Leptolyngbya (3%), Woronichinia (3%), and Snowella (2%) (Figure 2C). The abundance of unclassified (to the level of genera) sequences is low (5% accumulated).
3.2. Phylogenetic Analysis of ASV
The results of the phylogenetic analysis confirmed the identification of representatives of all genera. ASVs assigned to the same genus are positioned within the highly supported clades together with the corresponding type strains. The large clades of Dolichospermum/Aphanizomenon and Synechococcus/Cyanobium mostly comprise large branches with low supports. However, ASVs assigned to a particular genus are mostly grouped into subclades along with type strains of the corresponding taxa. Phylogenetic tree can be accessed in Supplementary Materials File S3.
3.3. Distribution and Abundance Cyanobacteria Based on 16S rRNA Gene Metabarcoding
To assess the distribution of cyanobacteria, we used the identified ASVs exclusively. In fact, the samples differ significantly in terms of the total abundance of ASVs. The maximum values of abundance were recorded in ponds at M9 and M7 sampling locations, in river (M17) and canal (M2) (169,063–148,544 reads) (Figure 3). The minimum values were detected in ponds at stations M8 and M18 (34,955–79,128 reads). The latter waterbodies, as well as the river M12, are characterized by the lowest absolute number of ASVs detected (47–81 ASVs). In the rest of waterbodies, the number of ASVs varies from 119 to 237 (Figure 3).
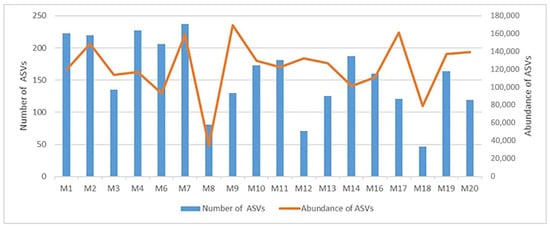
Figure 3.
Diversity and abundance of cyanobacteria ASVs in studied waterbodies of Moscow city.
The analysis of the relative abundance of genera (top 12 genera with the highest proportion of reads) revealed that the representatives of the genus Synechococcus predominate in five ponds (Figure 4). In ponds M3 and M16, the proportion of sequences of this genus is about 90%, in ponds M6, M9, and M11 it varies from 57% to 72%, and in other reservoirs the relative abundance of Synechococcus equals 2–34%. Notably, the highest abundance of Microcystis was observed in the river M17 (65%) and in ponds M13 (50%), M19 (37%), and M10 (39%). In the waterbodies M1, M2, M4, M6, and M9, the proportion of Microcystis sequences ranged from 11% to 25%, and in the rest they did not exceed 3%. At stations M4, M8, and M12, representatives of Planktothrix prevailed in terms of abundance of reads—68% to 82%. In pond M18, 94% of ASVs belonged to the genus Aphanizomenon. In pond M20, 79% of the sequences were classified as the representatives of the genus Anabaenopsis. It is worth noting that this genus is recorded only in this pond as a result of our study. Cyanobium representatives were found in all reservoirs except for M18, with a relative abundance of sequences varying from 1% (M20) to 24% (M2). The maximum abundance of genera Cephalothrix (50%) and Woronichinia (22%) was observed in pond M14. With the exception of ponds M1 (abundance 0.1%) and M9 (0.5%), sequences of Cephalothrix were not detected elsewhere. Sequences of Woronichinia were also observed in six more waterbodies, with the abundance of 1% to 12%. Lastly, a significant proportion of Leptolyngbya sequences was detected in ponds M1 (17%) and M7 (28%), while in other reservoirs it never exceeded 7%.
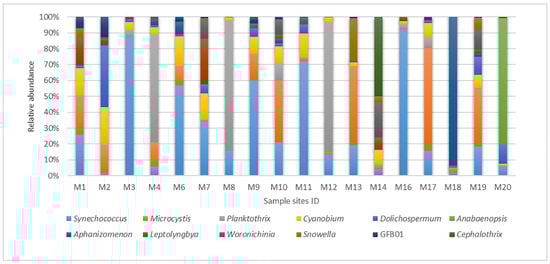
Figure 4.
Top 12 genus-level distribution (%) of cyanobacterial community in Moscow waterbodies in June 2024 based on the results of DNA metabarcoding.
Distribution and abundance of the top 30 cyanobacterial genera detected during this study is presented in Figure 5. Arthrospira, Tolypothrix, Ancylothrix, Planktothricoides, Microcoleusiopsis, unclassified Leptolyngbyaceae JSC-12, Thermoleptolyngbya, Cephalothrix, Microcoleus, and Anabaenopsis are characterized as “rare” genera (ASVs with number of reads < 1000 found in one or two waterbodies). The most common genera (with highest abundance of reads) are Synechococcus, Microcystis, Planktothrix, Cyanobium, Dolichospermum, Aphanizomenon, and Leptolyngbya.
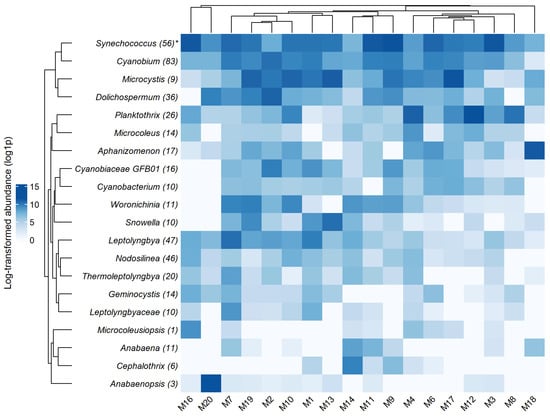
Figure 5.
Heat map of the distribution profiles for abundance of the top 30 genera in the samples detected by DNA metabarcoding. (*) indicates the number of ASVs.
3.4. Morphological Analysis: Taxonomic Composition, Distribution, and Abundance
Based on the morphological analysis of permanent phytoplankton samples, only twelve species from nine genera, four orders, and four families were identified in the studied reservoirs. Half of the taxa belong to the Microcystaceae (Chroococcales) family and are represented by Microcystis aeruginosa; M. wesenbergii (Komárek), Komárek and Komárek; Snowella lacustris (Chodat), Komárek & Hindák; Woronichinia naegeliana (Unger), Elenkin; Merismopedia tenuissima, Lemmermann; and Aphanocapsa spp. There are three species from the genus Dolichospermum (of the family Aphanizomenonaceae, Nostocales)—D. crassum (Lemmermann), P. Wacklin, L. Hoffmann & J. Komárek; D. planctonicum (Brunnthaler), Wacklin, L. Hoffmann & Komárek; D. spiroides (Klebahn), Wacklin, L. Hoffmann & Komárek; and Aphanizomenon flos-aquae, Ralfs and Bornet & Flahault. Another species found represented the family Microcoleaceae (Oscillatoriales)—Planktothrix agardhii (Gomont), Anagnostidis & Komárek. Family Leptolyngbyaceae (Leptolyngbyales) was also represented by a single species—Planktolyngbya sp. This list is supplemented by Anabaena sp. (Aphanizomenonaceae, Nostocales) and Argonema galeatum, Skoupý & Dvořák (Phormidiaceae, Oscillatoriales), which were studied separately based on isolated strains from our recent study [26].
In general, the diversity of cyanobacteria in the investigated waterbodies should be described as poor, e.g., the species composition in each environment includes from one to seven taxa. The greatest diversity was noted in pond M10 (seven taxa, see Figure 6) and in ponds M9 and M6 (with five taxa detected in each). Cyanobacteria were not found in ponds M3 and M16. At each of the following stations—canal M2, ponds M8, M11, and M14—a single species was noted (Figure 6). Finally, cyanobacterial flora in pond M20 was represented by two species of Dolichospermum (D. planctonicum and D. spiroides). The species composition of the remaining reservoirs includes no more than four species (Table 2).
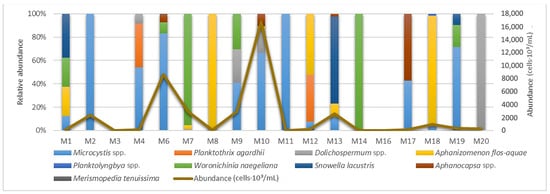
Figure 6.
Relative abundance of genera and total abundance of cyanobacteria in the waterbodies of Moscow in June 2024 detected by microscopy.
Table 2.
List of cyanobacteria and cell abundance in Moscow waterbodies in June 2024 detected by microscopy.
The maximum total abundance of cyanobacteria was observed in waterbodies of recreational use—Meshchersky Pond (M10, 16,860 × 103 cells/mL) and in Bolshoy Sadovy Pond (M6, 8636 × 103 cells/mL). In other locations, the total abundance did not exceed 2950 × 103 cells/mL. Representatives of the genus Microcystis are the most widespread among the identified taxa (Figure 6)—they are found in 11 of the 18 reservoirs. The maximum abundance of Mycrocystis was recorded in the recreational reservoirs of pond M10 (11,200 × 103 cells/mL) and pond M6 (7200 × 103 cells/mL). Species of the genus Dolichospermum were detected in seven reservoirs, and the most widely distributed species of the genus, D. spiroides, was found in five ponds (M6, M7, M9, M18, M20). The absolutely maximum value of abundance among the representatives of the genus is noted for D. crassum in ponds M9 and M10 (550 × 103 cells/mL and 3200 × 103 cells/mL); the abundance of the other two species does not exceed 175 × 103 cells/mL. It is worth mentioning that a potentially toxigenic species, Aphanizomenon flos-aquae, was found in five ponds (M1, M7, M10, M13, M18), as well as in rivers M12 and M8. In turn, the maximum abundance of this species was observed in the ponds M18 (900 × 103 cells/mL) and M10 (600 × 103 cells/mL). In other reservoirs, the abundance of this species never exceeded 300 × 103 cells/mL (Figure 6, Table 2).
3.5. Comparison of Metabarcoding and Microscopy Data for the Analysis of Diversity and Distribution of Cyanobacteria
According to the data of metabarcoding, the diversity of cyanobacteria in the studied waterbodies is significantly higher than that revealed through microscopy. In particular, 76 genera and 1239 ASVs were identified based on DNA sequencing, whereas microscopy data revealed only nine genera and twelve species. In addition, with the exceptions of Aphanocapsa spp. and Planktolyngbya spp., all genera revealed by microscopy were also detected by the metabarcoding. Based on seven genera of cyanobacteria represented in both datasets (microscopy and metabarcoding), we compared the levels of cell abundance and the values of ASVs abundance in the studied samples (Figure 7).
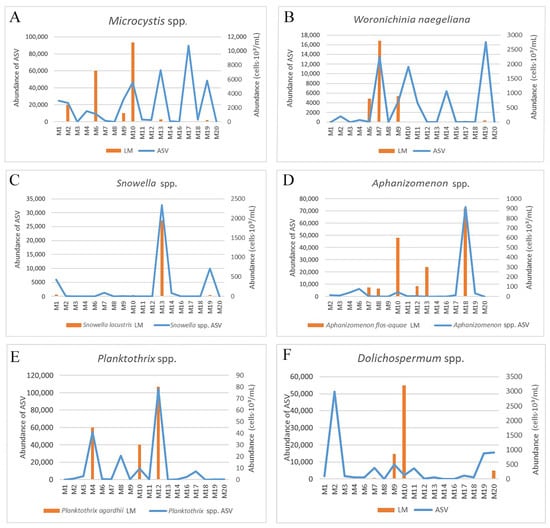
Figure 7.
Comparison abundance of ASVs/cells of cyanobacteria in six genera across Moscow waterbodies in June 2024 detected by DNA metabarcoding and microscopy. (A) Microcystis spp. (B) Woronichinia naegeliana. (C) Snowella spp. (D) Aphanizomenon spp. (E) Planktothrix spp. (F) Dolichospermum spp.
According to the data of metabarcoding, Microcystis ASVs are found in all waterbodies with an abundance varying from 20 to 89,425 (Figure 7A). Data from microscopy, however, indicates that the representatives of this genus are absent in samples with a low abundance of ASVs (<1265) (sampling sites M3, M7, M8, M14, M16, M20). At the remaining locations, the data of the two analyses coincided, i.e., the presence of sequences is confirmed by microscopic investigation (M2, M6, M9, M10). Moreover, it should be noted that at points M13, M17, and M19 there was a significant difference in the relative abundance of reads and cells, i.e., with a relatively high abundance of reads, but a relatively low abundance of cells. Nevertheless, the presence of Microcystis in the samples was confirmed by both types of analysis.
Sequences of Woronichinia naegeliana were found in fourteen samples. Of these, four (M3, M8, M12, M17) demonstrated the abundance of ASVs that did not exceed 34. In these probes, representatives of W. naegeliana were not registered by the microscopy. The dynamics of the abundance of ASVs and number of cells are somewhat different (Figure 7B). For example, in samples M10, M14, and M19, the maximum abundance of ASVs was noted, whereas according to microscopy data, the number of cells was relatively low. At the same time, the peaks of maximum abundance of ASVs/cells coincide in samples M6 and M9. Notably, in samples M10 and M4, with a relatively high abundance of ASVs (11,409 and 482, Respectively), microscopy was unable to detect the colonies of W. naegeliana. However, in our previous study, several strains of this species were obtained from the same samples [26]. Such peculiarity could be due to the high abundance of Microcystis spp. in the samples. When processing the material in LM, W. naegeliana could have been missed or confused with Microcystis spp.
Cyanobacteria of the genus Snowella (Figure 7C) demonstrate the greatest consistency. The dynamics of the abundance of ASVs and cells are completely identical. The maximum abundance was noted in sample M13 in both datasets, while low values (ASVs from 30 to 9981 and cell levels of 120–180 cells·103/mL) were typical for samples M1, M10, and M19. Snowella was not registered through microscopic analysis in nine samples, where the abundance of ASVs was less than 1140.
Similarly, a high correspondence of the data from the two analyses was noted for Aphanizomenon (Figure 7D). According to the data from microscopy, Aphanizomenon flos-aquae was identified in seven samples. Regarding the sequencing data, 17 ASVs were assigned to this genus, of which 88.7% of all reads belong to ASV6, which is totally similar to the reference sequences of Aphanizomenon flos-aquae from GenBank. According to the data of metabarcoding, sequences were found in sixteen of the eighteen studied reservoirs, and in three of them the abundance of reads did not exceed 56. In the sample M13, the data from the two analyses did not match—the high abundance of cells found during microscopy was not confirmed by the sequencing data (no Aphanizomenon sequences were found in this sample). It is also worth noting that with a low relative abundance of ASVs (<252) in samples M1, M7, M8, and M12, microscopy data revealed a relatively high abundance of cells. However, the maximum abundance peaks in both analyses are equal (points M18, M10).
According to the LM data, a potentially toxic species Planktothrix agardhii was detected in three samples (M4, M10, M12) with an abundance of 120–320 × 103 cells/mL. These findings are supported by metabarcoding, e.g., the maximum abundance of ASVs assigned to this genus was noted in the same samples (Figure 7E). At the same time, a relatively high abundance of ASVs was observed in the sample M8, whereas this species was not detected during microscopy. Interestingly, the genus Planktothrix was represented by a single species after LM analysis, whereas the data of metabarcoding provided evidence for the species P. agardhii, P. paucivesiculata, and P. pseudagardhii (26 ASVs total). Of these, the maximum abundance is shown for ASV2, which is 100% identical to the P. agardhii strain NRERC-755 (originating South Korea).
After two analyses, the data on the genus Dolichospermum differed most significantly (Figure 7F). The maximum abundance of ASVs was revealed in sample M2, whereas according to microscopy data, Dolichospermum was not found at this location. At the same time, the results of microscopic analysis on samples M9 and M10 indicated a relatively high abundance of representatives of this genus. On the contrary, the abundance of ASVs in these samples was relatively low. In general, Dolichospermum ASVs were observed in almost all samples (with the exceptions of M16 and M8), with an abundance from 61 to 51,285. Microscopy provided evidence for the presence of Dolichospermum in seven samples only (Figure 7F). Thus, there is no definite correspondence between the abundance of ASVs and the detection of representatives of the genus by LM. For example, microscopy confirmed the presence of Dolichospermum in samples with a low abundance of ASVs (898–938, M4, M6, M18), whereas in samples with an abundance of ASVs from 1629 to 6136, representatives of the genus were not noted by LM.
3.6. Detection of Strain Sequences in Metabarcoding Data
In our recent study [26], we assessed the morphology, 16S rRNA gene data, and toxigenic potential (based on PCR and HPLC-HRMS) of 20 stains of cyanobacteria, obtained from the waterbodies in Moscow. The same set of samples and the same strains are analyzed herein. These strains were identified as Aphanizomenon sp. (CBMC 479m), Dolichospermum sp. (CBMC469m), Anabaena sp. (CBMC473m), Argonema galeatum (CBMC475m), Woronichinia naegeliana (CBMC672m, CBMC674m CBMC675m, CBMC677m, CBMC680m, CBMC681m, CBMC683m, CBMC685m, CBMC687m, CBMC689m, CBMC691m), and Microcystis aeruginosa (CBMC403m and CBMC523m). In this study, by computing the p-distances, we compare the sequences of the strains to the corresponding sequences of ASVs detected during metabarcoding. We hereby discuss the results of comparison for each taxon.
3.6.1. Argonema galeatum, Skoupý & Dvořák
A single ASV (ASV416) was assigned to this species (with 100% similarity by NCBI-Blast). The sequence of our strain A. galeatum CBMC475m is completely identical to ASV416, as well as to the sequences of this species available in GenBank (Table S2). Notably, A. galeatum and A. antarcticum are quite dissimilar (1.4%) when analyzing the long partial 16S rRNA gene sequences (906 bp), but absolutely identical based on the short V3–V4 16S rRNA region (276 bp). Strain A. galeatum CBMC475m was isolated from sample M9. According to the metabarcoding data, the sequence of this species (ASV416), was detected in samples M1, M9, and M10. The abundance of sequences is low, from 12 (in sample M10) to 120 (M1). It is worth mentioning, the genus has been described recently from soil crusts of James Ross Island (Western Antarctica [39]), but, based on the analysis of the NCBI nucleotide database, authors have demonstrated the worldwide distribution of Argonema. It is possible that the representatives of the genus prefer the benthic environments in freshwater waterbodies, which is why the genus may be poorly represented in the samples of phytoplankton.
3.6.2. Anabaena sp.
Eleven ASVs detected through metabarcoding were attributed as Anabaena sp. (values of similarity with Anabaena > 99.21% by both databases). Of these, nine ASVs were rare, with the total abundance of lower than 150. The abundance of two ASVs was significantly higher: ASV94 (n = 2311) and ASV119 (n = 1741). The largest number of these ASVs was noted in the sample M14. We did not find ASVs sequences which were 100% similar to strain Anabaena sp. CBMC473m (see Table S3). The maximum level of similarity (99.8%) was noted for the ASV782, which was found in only one sample—M11 (32 reads). However, strain Anabaena sp. CBMC473m from our previous study was isolated from sample M7.
3.6.3. Aphanizomenon sp.
Seventeen ASVs were assigned to the genus Aphanizomenon, of which more than half (nine ASVs) were classified as the potentially toxigenic species Aphanizomenon flos-aquae (with similarity values of 99.74–100%). The rest were attributed to Aphanizomenon gracile and Aphanizomenon sp. Regarding the abundance, 88.7% of all readings included ASV6, corresponding to A. flos-aquae. This ASV is noted in eight samples. Among these samples, the greatest abundance of ASV6 was found in the pond M18 (n = 73,267) and in the recreational pond (M6, n = 4657) (Figure 5). In other waterbodies, the abundance of A. flos-aquae ASV6 did not exceed 2511. To conduct the sequence similarity analysis (based on p-distances), we have supplemented the dataset with six reference sequences of A. flos-aquae from GenBank (including the type strain) (Table S4). The latter are totally identical to the sequence of ASV6, which confirms the correct identification. Nevertheless, the sequence of strain Aphanizomenon sp. CBMC479m isolated from sample M10 differs from type strain sequences by 1.5%, and probably belongs to a different species. In general, the ASVs of Aphanizomenon spp. show high heterogeneity, with differences among themselves reaching the value of 5.1%, which, apparently, may indicate their affinities to different species.
3.6.4. Dolichospermum sp.
The genus Dolichospermum occupies the fifth place in terms of the abundance of ASVs and the total number of corresponding ASVs (n = 36). ASVs assigned to this genus were found in almost all samples (n = 16). In fact, the short barcode region of the 16S rRNA gene did not provide precise resolution to the species of this genus. Search for reference sequences in GenBank database yielded many totally similar sequences classified as D. circinale, D. lemmermannii, D. planctonicum, D. brachiatum, D. smithii, and other species. On the contrary, a pairwise comparison of ASVs sequences revealed a high heterogeneity of oligotypes. The similarity values (p-distances) range from 88.2% to 99.6–100% (Table S5). However, we found ASV179, the sequence of which is completely identical to the Dolichospermum sp. CBMC469m strain sequence. The strain was isolated from the sample M4. ASV179 sequences were found in the same sample (M4) and in eight more samples, with low levels of abundance (7 to 296 reads).
3.6.5. Microcystis aeruginosa (Kützing) Kützing
In terms of the total abundance of sequences, Microcystis ranks second among all genera and includes nine ASVs. Of these, the maximum abundance was noted for two ASVs, ASV1 and ASV5 (238,956 and 95,297 reads in total, respectively). Pairwise comparison of the sequences of ASVs of Microcystis spp. and sequences of toxigenic Microcystis aeruginosa strains, CBMC403m and CBMC523m, isolated from samples M13 and M10 (see [26]) demonstrated their total similarity to the sequence of ASV1 (Table S6). With an abundance of reads from 20 to 60,152, ASV1 sequences were noted in almost all samples (in 16 of 18).
3.6.6. Woronichinia naegeliana (Unger) Elenkin
In our dataset, eleven ASVs were assigned to W. naegeliana with 99.21–100% values of similarity to reference strains from NCBI-Blast. The total abundance of reads varied from 7 to 19,629. Interestingly, according to the Greegenes2 database, these sequences were assigned to Synechocystis. In our previous study [26], we studied and obtained the reference sequences of the partial 16S rRNA gene for fourteen strains of this species, which represented five oligotypes. Sequence similarity was calculated based on p-distances in comparison to the type strain W. naegeliana 0LE35S01. The values ranged from 99.1% (one strain) to 99.7% (two strains), 99.8% (one strain), 99.9% (two strains), and 100% (seven strains).
It should be noted that according to the short barcode region (338 bp), the strain sequences were divided into three (rather than five) oligotypes. As a result of pairwise comparison of the reference sequences of previously obtained W. naegeliana strains and eleven ASVs obtained here, it was found that two ASVs (ASV25 and ASV27) totally correspond to two oligotypes of strains (Table S7).
The first oligotype (100% similar to the strain type sequence W. naegeliana 0LE35S01) includes sequences of eleven strains and ASV25. The strains were isolated from samples M9 and M10. The maximum abundance of ASV25 was found in the same set of samples (2439 and 9765, respectively). In addition, ASV25 were detected in eight more samples with abundance of reads from 10 (M12) to 3686 (M11).
The second oligotype included previously studied W. naegeliana strains (CBMC672m and CBMC675m) and ASV27. The similarity of the sequences is 100% (Table S7). Additionally, strains W. naegeliana (CBMC672m and CBMC675m) were isolated from sample M7, where the maximum abundance of ASV27 (13,229 reads) was recorded. The second oligotype is less common, and the sequences of ASV27 were found in samples M19 (69 reads), M9 (1080), and M14 (2917).
We did not detect the oligotype of strain CBMC674m in metagenomic data. The similarity of the sequences of the remaining ASV phylotypes with the first two is quite high, from 99.1% to 99.7%.
4. Discussion
4.1. Comparison Between the Microscopic and Metabarcoding Datasets
The results of our research demonstrate a significant difference in the diversity of cyanobacterial communities determined by microscopy and the method of DNA metabarcoding. As it was already mentioned, microscopy revealed only 12 species from 9 genera, whereas according to metabarcoding data, the diversity of cyanobacteria is, by far, higher—represented by 76 genera and 1239 ASV. We found it difficult to give an accurate estimate of the number of species present in the studied communities based on sequencing data. On the one hand, many ASVs had 100% similarity to several species from the GenBank database (i.e., the selected genetic marker did not provide accurate resolution to the species, or it could be due to erroneous identification of the uploaded sequences). On the other hand, multiple sequences assigned to the same species in the database had high heterogeneity among themselves (differences up to 4–5%, see Table S4 (p-distance matrix of Aphanizomenon spp.), see Table S5 (p-distance matrix of Dolichospermum spp.), and, probably, represent different species, thus requiring additional clarification of the taxonomic status.
Despite the large difference in the diversity of communities detected by the two methods, with the exception of Planktolyngbya spp. and Aphanocapsa spp., microscopy was fully confirmed by the sequencing data. All genera/species found by microscopy are among the top 12 genera with the highest abundance of ASVs. Small-celled representatives of the genera Synechococcus and Cyanobium were not found among the genera with a high abundance of ASVs during microscopy. Such discrepancies have already been noted in similar studies, for example, by MacKeigan et al. [5], during a comprehensive study of 379 Canadian lakes by microscopy and DNA metabarcoding techniques. Also, the same cases with mismatches of identification of small-celled Cyanobacteria were discussed in Li et al. [2,3] and Albrecht et al. [40]. In general, the fact that DNA metabarcoding reveals a significantly greater diversity of cyanobacteria than microscopy has been repeatedly discussed in the studies dedicated to comparing the two methods. Speaking again about the large-scale study of Canadian lakes by MacKeigan et al. [5], 31 genera were found by microscopy, while metabarcoding detected 57 genera and 1016 ASVs of cyanobacteria. Similarly, Li et al. [2] detected 34 cyanobacterial morphospecies based on microscopy and 69 cyanobacterial OTUs while analyzing the cyanobacterial communities in seven freshwater systems. The analogous situations were described by Gelis et al. [32], during the study of cyanobacteria in four large alpine lakes in France; by Tukhtaboeva et al. [41] regarding the cyanobacterial communities in eroded soils in Uzbekistan; and by Patova et al. [42] in their research on the biological soil crusts of the Northern Ural Mountain Region. The discrepancy was explained by MacKeigan et al. [5] (see also references in it) by technical issues (differences in the sample volumes, DNA extraction methods, primer set, bioinformatic processing), copy number variation, incomplete reference databases, etc. Although studies comparing the two approaches are very time-consuming and still limited, the authors agree that the results obtained by the two methods are usually comparable and metabarcoding is recommended as an effective tool for improved understanding of cyanobacterial communities, in monitoring programs, and assessing the spread of potentially toxic species [2,5,43].
Our detailed comparison of the distribution and abundance of seven genera of cyanobacteria represented in both datasets showed a high congruence of methods. For the genera Microcystis, Woronichinia, Snowella, Planktothrix, and Merismopedia, the presence in the samples was confirmed by both methods in the vast majority of cases, and the peaks of high abundance of cells/ASV coincided. A discrepancy in the data was noted for the genera Aphanizomenon and Dolichospermum. In some samples for these genera with a high abundance of ASVs, according to microscopy data, representatives of the genera were not found, and vice versa, with a relatively high abundance of cells, according to microscopy data, genera were not noted in the metabarcoding data (e.g., Aphanizomenon in sample M13). The latter example can be explained by insufficient homogenization of biomass before DNA isolation or problems during amplification. There is also a possibility that some ASVs from the M13 sample may have been incorrectly identified from databases, which led to the absence of Aphanizomenon ASVs in this sample. A similar case was described by [31] using the example of cyanobacterial communities on coral reefs studied through metabarcoding and cultivation. For DNA metabarcoding, the authors used two sets of primers (universal and cyano-specific). As a result, the genera Planktothricoides and Xenococcus were detected only in universal sets of primers. This likely indicates the limitations of cyanobacteria-specific primers.
A comparison of the sequences of 20 strains isolated from the same waterbodies (described in Kezlya et al. [26]) with the ASVs obtained here (“internal verification”) confirmed the presence of sequences of almost all strains in the metabarcoding data. Strains Aphanizomenon sp. CBMC479m and Anabaena sp. CBMC473m were the exceptions: their sequences with 100% similarity were not found among the obtained ASVs. Such discrepancies have been reported in previous studies. In the above-mentioned work by Kang et al. [31], the authors cultured Anabaena, Chroococcus, and Merismopedia, but did not find them in any set of DNA metabarcoding data. Also, using the example of microalgal mock communities analysis by Bradley et al. [44], differences in the composition of the community were shown based on the results of metagenomic sequencing.
4.2. Distribution of Toxigenic and Potentially Toxigenic Species of in the Studied Waterbodies According to Microscopy and Metabarcoding
Among the most widespread genera detected by two methods, Microcystis, Planktothrix, Dolichospermum, and Aphanizomenon are potentially toxigenic. The share of ASVs (in the analysis of the top 12 in terms of the abundance of genera in metadata) varies from 39 to 94% depending on the sampling location and genus. The massive development of representatives of these genera is confirmed by microscopy data in most samples.
The first thing to be noted is the high abundance of ASV1 Microcystis aeruginosa, the most common sequence in our dataset, (see Section 3.5 and Section 3.6.5). ASV1 is 100% similar to the 16S rRNA sequences of Microcystis aeruginosa strains (CBMC403m, CBMC523m), which are capable of producing microcystins and were studied in detail in our recent study [26]. In fact, cyanobacteria of the genus Microcystis are known to be among the most common producers of microcystins in freshwater bodies on all continents except Antarctica [7]. At the same time, it is known that the representatives of this genus belonging to different species may be characterized by 16S rRNA sequences of 99+% similarity. In this regard, it is believed that all Microcystis species should be considered as a single species complex [7,45]. By contrast, Berry et al. [46] in a study devoted to the analysis of the connections of the oligotypes of M. aeruginosa to the environmental factors and toxicity, concluded that oligotypes cannot be used to infer toxic ecotypes. In our previous study, two toxic strains of M. aeruginosa (CBMC403m, CBMC523m) with the same oligotype were isolated from different reservoirs (M10, M13). When comparing partial 16S rRNA sequences of our toxic Microcystis aeruginosa strains with type strains from GenBank, several strains of microcystin-producing and non-microcystin-producing M. aeruginosa 16S rRNA sequences were demonstrated as completely identical ([26], Table S1). Based on this, it can be assumed that ASV1 sequences can include both toxic and non-toxic variants of M. aeruginosa. On the other hand, in our data, out of nine ASVs attributed to Microcystis aeruginosa, only ASV1 totally matched the sequences of toxic Microcystis aeruginosa from our previous study. This suggests that the metabarcoding data may indicate the widespread occurrence of toxic Microcystis aeruginosa in the studied reservoirs. In any case, the data obtained and described herein provide a basis for checking the microcystin content during the algal blooms in the reservoirs (primarily in recreational reservoirs M1, M2, M6, M10) in the summer, in order to avoid negative consequences for the health of the city’s human population.
Planktothrix agardhii is one of the most widespread toxin-producing cyanobacteria in temperate lakes [4,47,48,49]. In Russia, the dominance of this genus is also often documented ([11] and references in there). It is known that not all isolates of P. agardhii are capable of synthesizing toxins, and the issues of biogeography of toxic and non-toxic forms of this species have not yet been resolved [4,48]. According to metabarcoding data, representatives of Planktothrix occupy the third place in terms of sequence abundance and include 11% of all acquired reads. The metabarcoding data is well confirmed by microscopy data, with maximum abundance peaks observed in three reservoirs (M4, M12, and recreational M10). Hitherto, there is no data on the toxic potential of P. agardhii in studied reservoirs. However, the results of our analysis revealed a high abundance of this species in the recreational reservoir M10, which, in turn, indicates the need to control the content of cyanotoxins in the ecosystem.
According to the review by Melnikova et al. [50], which summarized data on the diversity of cyanobacteria species that cause algal blooms in Russia, the potentially toxic Aphanizomenon flos-aquae, Microcystis aeruginosa, Dolichospermum flos-aquae, and Dolichospermum lemmermannii dominate in continental reservoirs during CyanoHABs. It is noted that Aphanizomenon flos-aquae, Microcystis aeruginosa, and Dolichospermum flos-aquae have the widest distribution throughout Russia and are found in reservoirs both in the Arctic zone of the Russian Federation and in the south of the country, as well as in freshwater parts of coastal seas. Dolichospermum species are known to produce various types of cyanotoxins, in particular microcystins of different kinds, saxitoxin, anatoxin-a, as well as metabolites that impair the taste and odor of water, e.g., geosmin [51]. Aphanizomenon flos-aquae is also known to be a producer of anatoxin-a [11].
In our previous work, the isolated strains of Dolichospermum sp. and Aphanizomenon sp. did not contain genes involved in cyanotoxin synthesis. In this study, microscopy and metabarcoding indicate a high abundance of Aphanizomenon flos-aquae/Dolichospermum sp. in recreational reservoirs M2, M10. Further study of their toxic potential is needed. In addition, Anabaenopsis (with high abundance of corresponding ASVs found in M20), Cuspidothrix, and Phormidium are worth noting, as they were detected only by metabarcoding in rare numbers, but are potentially toxigenic, too.
5. Conclusions
This study confirms the effectiveness of metabarcoding for studying the diversity of cyanobacteria, as well as for assessing the spread and development of toxigenic and potentially toxigenic cyanobacteria in urban reservoirs. A detailed comparison of the abundance dynamics of ASVs/cells using the example of six genera, including the widely distributed and potentially toxigenic Microcystis, Planktothrix, Dolichospermum, and Aphanizomenon, showed high level of convergence of microscopy and metabarcoding data. We verified the presence of sequences of 20 strains of cyanobacteria previously isolated from the same reservoirs (including toxic Microcystis aeruginosa; see [26]) in the metabarcoding data. Thus, we recorded 100% similarities of strain sequences to the ASVs of the corresponding taxa. The metabarcoding data indicate the high level of abundance and distribution of the toxigenic species Microcystis aeruginosa—ASV1 is 100% similar to the sequences of toxic Microcystis aeruginosa strains, CBMC403m and CBMC523m, found in all reservoirs.
The following conclusions can be drawn from the results of our research:
- Repeated sequence verification in NCBI improves the taxonomic assignment of ASVs.
- The databases of cyanobacterial sequences should be further supplemented with securely identified and well-documented gene data.
- The short barcode region V3–V4 16S rRNA often does not provide accurate resolution for the species of many cyanobacteria, including the widespread and potentially toxigenic representatives of Microcystis, Planktothrix, Dolichospermum, and Aphanizomenon. Using additional genetic markers (e.g., rbcL, cpcBA or toxin genes) might improve resolution for the cyanobacteria species and toxic genotypes in future studies.
- As yet, it is impossible to unambiguously identify toxic and non-toxic forms of species based on this genetic marker. We agree with the opinion of Casero et al. [4], who pointed out the need to develop accurate methods for determining toxic/non-toxic genotypes within populations using integrative approaches—coupling genomics, transcriptomics, proteomics, and metabalomics in combination with field research.
- Using the example of the Argonema galeatum, which is rare for the studied waterbodies, the presence of the taxon at different locations was proved with minimal abundance values of ASV (<0.01%). Due to the very low abundance, the species was not detected during microscopy of the samples, while the Argonema galeatum strain CBMC475m was isolated from the M9 sample [26]. The 16S rRNA sequence region totally matched ASV416 identified as Argonema galeatum and detected in the same sample (M9). This indicates that low abundance sequences should not be neglected during the analysis of metabarcoding data.
- Our data on the analysis of cyanobacteria based on microscopy confirm the effectiveness of metabarcoding for the monitoring of CyanoHABs in urban waterbodies. Metabarcoding makes it possible to quickly assess the diversity of cyanobacteria, identify reservoirs with a high abundance of potentially toxigenic species, and detect the priority reservoirs with a high probability of toxic blooms.
Supplementary Materials
The following supporting information can be downloaded at: https://www.mdpi.com/article/10.3390/phycology5040088/s1, File S1: Table S1. The hydrochemical parameters of water in the sample sites. File S2: Table S2. Percent similarity (p-distance) matrix of ASV416 and similar Argonema galeatum strains on the basis of the 16S rRNA V3–V4 hypervariable region (276 bp); Table S3. Percent similarity (p-distance) matrix of Anabaena sp. CBMC473m and most similar ASVs on the basis of the 16S rRNA V3–V4 region (278 bp); Table S4. Percent similarity (p-distance) matrix of Aphanizomenon sp. CBMC479m, Aphanizomenon flos-aquae strains, and most similar ASVs on the basis of the 16S rRNA V3–V4 region (276 bp); Table S5. Percent similarity (p-distance) matrix of Dolichospermum sp. CBMC469m and most similar ASVs on the basis of the 16S rRNA V3–V4 region (278 bp); Table S6. Percent similarity (p-distance) matrix of Microcystis sp. CBMC523m, Microcystis sp. CBMC403m, and most similar ASVs (338 bp); Table S7. Percent similarity (p-distance) matrix of the cultured strains of Woronichinia naegeliana and most similar ASVs on the basis of the 16S rRNA V3–V4 region (338 bp). File S3: Figure S1. Phylogeny of ASVs with type strains of cyanobacteria based on BI analyses. The strains from Kezlya et al. [26] are blue color. File S4: Alignment of V3–V4 region of 16S rRNA gene used for molecular phylogenetic analyses in this study; File S5: The Bayesian phylogenetic topology for V3–V4 region of 16S rRNA gene tree. File S6: Table S8. List of ASVs and its abundance in the sample sites. Taxonomy assignment determined through blast in NCBI for order, family, genus, and species level are indicated. Taxonomy assignment determined through Greengenes2 database is indicated for each species level.
Author Contributions
Conceptualization, E.K.; methodology, E.K., S.K., E.V., E.M. and A.M.; validation, E.K., S.K. and E.V.; formal analysis, E.M., E.C., V.K., Y.M. and A.I.; investigation, E.K., S.K. and E.V.; resources, E.K., S.K. and E.V.; data curation, M.K.; writing—original draft preparation, E.K.; writing—review and editing, E.K., A.M., E.C., A.I. and M.K.; visualization, E.K., E.M., A.M. and V.K.; supervision, M.K.; project administration, E.K.; funding acquisition, E.K. All authors have read and agreed to the published version of the manuscript.
Funding
This work is based on research carried out with financial support by the Russian Science Foundation (24-24-20116, https://rscf.ru/project/24-24-20116/ accessed on 9 October 2025).
Institutional Review Board Statement
Not applicable.
Informed Consent Statement
Not applicable.
Data Availability Statement
The samples collected during this study and the strains analyzed herein are housed at the Culture and Barcode Collection of Microalgae and Cyanobacteria “Algabank” (CBMC) at K. A. Timiryazev Institute of Plant Physiology, RAS, Moscow, Russia. Raw data utilized for metabarcoding study was deposited to the National Center for Biotechnology Information (NCBI), BioProject number: PRJNA1358805.
Conflicts of Interest
The authors declare no conflicts of interest.
Abbreviations
The following abbreviations are used in this manuscript:
| ASV | Amplicon Sequence Variants |
| BI | Bayesian inference |
| CyanoHAB | Cyanobacterial Harmful Algal Bloom |
| DIC | Differential Interference Contrast |
| DIN | Dissolved Inorganic Nitrogen |
| DIP | Dissolved Inorganic Phosphorus |
| DSi | Dissolved Silica |
| HPLC-HRMS | High-Performance Liquid Chromatography–High-Resolution Mass Spectrometry |
| LM | Light microscopy |
| PCR | Polymerase Chain Reaction |
| RAxML | Randomized Axelerated Maximum Likelihood |
References
- Salmaso, N.; Bernabei, S.; Boscaini, A.; Capelli, C.; Cerasino, L.; Domaizon, I.; Elersek, T.; Greco, C.; Klemenčič, A.; Tomassetti, P.; et al. Biodiversity patterns of cyanobacterial oligotypes in lakes and rivers: Results of a large-scale metabarcoding survey in the Alpine region. Hydrobiologia 2024, 851, 1035–1062. [Google Scholar] [CrossRef]
- Li, X.C.; Huo, S.; Zhang, J.; Ma, C.; Xiao, Z.; Zhang, H.; Xi, B.; Xia, X. Metabarcoding reveals a more complex cyanobacterial community than morphological identification. Ecol. Indic. 2019, 107, 105653. [Google Scholar] [CrossRef]
- Li, H.; Alsanea, A.; Barber, M.; Goel, R. High-throughput DNA sequencing reveals the dominance of pico- and other filamentous cyanobacteria in an urban freshwater Lake. Sci. Total Environ. 2019, 661, 465–480. [Google Scholar] [CrossRef]
- Casero, M.C.; Velázquez, D.; Medina-Cobo, M.; Quesada, A.; Cirés, S. Unmasking the identity of toxigenic cyanobacteria driving a multi-toxin bloom by high-throughput sequencing of cyanotoxins genes and 16S rRNA metabarcoding. Sci. Total Environ. 2019, 665, 367–378. [Google Scholar] [CrossRef]
- MacKeigan, P.W.; Garner, R.E.; Monchamp, M.È.; Walsh, D.A.; Onana, V.E.; Kraemer, S.A.; Pick, F.R.; Beisner, B.E.; Agbeti, M.D.; da Costa, N.B.; et al. Comparing microscopy and DNA metabarcoding techniques for identifying cyanobacteria assemblages across hundreds of lakes. Harmful Algae 2022, 113, 102187. [Google Scholar] [CrossRef]
- Fabrin, T.M.C.; Stabile, B.H.M.; da Silva, M.V.; Jati, S.; Rodrigues, L.; de Oliveira, A.V. Cyanobacteria in an urban lake: Hidden diversity revealed by metabarcoding. Aquat. Ecol. 2020, 54, 671–675. [Google Scholar] [CrossRef]
- Harke, M.J.; Steffen, M.M.; Gobler, C.J.; Otten, T.G.; Wilhelm, S.W.; Wood, S.A.; Paerl, H.W. A review of the global ecology, genomics, and biogeography of the toxic cyanobacterium, Microcystis spp. Harmful Algae 2016, 54, 4–20. [Google Scholar] [CrossRef]
- Jiang, Y.; Xiao, P.; Liu, Y.; Wang, J.; Li, R. Targeted deep sequencing reveals high diversity and variable dominance of bloom-forming cyanobacteria in eutrophic lakes. Harmful Algae 2017, 64, 42–50. [Google Scholar] [CrossRef]
- Jackim, E.; Gentile, J. Toxins of a blue-green alga: Similarity to saxitoxin. Science 1968, 162, 915–916. [Google Scholar] [CrossRef]
- Evans, M.H. Mechanism of saxitoxin and tetrodotoxin poisoning. Br. Med. Bull. 1969, 25, 263–267. [Google Scholar] [CrossRef] [PubMed]
- Chernova, E.; Sidelev, S.; Russkikh, I.; Voyakina, E.; Babanazarova, O.; Romanov, R.; Kotovshchikov, A.; Mazur-Marzec, H. Dolichospermum and Aphanizomenon as neurotoxins producers in some Russian freshwaters. Toxicon 2017, 130, 47–55. [Google Scholar] [CrossRef]
- Bernard, C.; Ballot, A.; Thomazeau, S.; Maloufi, S.; Furey, A.; Mankiewicz-Boczek, J.; Pawlik Skowrońska, B.; Capelli, C.; Salmaso, N. Appendix 2: Cyanobacteria associated with the production of cyanotoxins. In Handbook of Cyanobacterial Monitoring and Cyanotoxin Analysis; Meriluoto, J., Spoof, L., Codd, G.A., Eds.; John Wiley & Sons: Hoboken, NJ, USA, 2017; pp. 501–525. [Google Scholar]
- Voloshko, L.N.; Pinevich, A.V.; Kopecky, I.; Titova, N.N.; Hrouzek, P.; Zelic, P. Water blooms and toxins produced by cyanobacteria in the lower Suzdalskoe Lake (Saint-Petersburg, Russia). Algology 2010, 12, 210–223. [Google Scholar]
- Voyakina, E.Y.; Russkikh, Y.V.; Chernova, E.N.; Zhakovskaya, Z.A. Toxic cyanobacteria and their metabolites in the water bodies of North West of Russia. Theor. Appl. Ecol. 2020, 1, 124–129. [Google Scholar] [CrossRef]
- Sorokovikova, E.; Tikhonova, I.; Fedorova, G.; Chebunina, N.; Kuzmin, A.; Suslova, M.; Naidanova, Y.; Potapov, S.; Krasnopeev, A.; Gladkikh, A.; et al. Two New Strains of Microcystis Cyanobacteria from Lake Baikal, Russia: Ecology and Toxigenic Potential. Limnol. Rev. 2025, 25, 31. [Google Scholar] [CrossRef]
- Belykh, O.I.; Tikhonova, I.V.; Kuzmin, A.V.; Sorokovikova, E.G.; Fedorova, G.A.; Khanaev, I.V.; Sherbakova, T.; Timoshkin, O.A. First detection of benthic cyanobacteria in Lake Baikal producing paralytic shellfish toxins. Toxicon 2016, 121, 36–40. [Google Scholar] [CrossRef] [PubMed]
- Belykh, O.I.; Tikhonova, I.V.; Kuzmin, A.V.; Sorokovikova, E.G.; Potapov, S.A.; Galkin, A.V.; Fedorova, G.A. Toxin-producung cyanobacteria in Lake Baikal and the water bodies of Baikal region. Theor. Appl. Ecol. 2020, 1, 21–27. [Google Scholar] [CrossRef]
- Sidelev, S.I. Molecular genetic identification and seasonal succession of toxigenic cyanobacteria in phytoplankton of the Rybinsk Reservoir (Russia). Inland Water Biol. 2016, 9, 368–374. [Google Scholar] [CrossRef]
- Chernova, E.; Sidelev, S.; Russkikh, I.; Korneva, L.; Solovyova, V.; Mineeva, N.; Stepanova, I.; Zhakov-skaya, Z. Spatial distribution of cyanotoxins and ratios of microcystin to biomass indicators in the reservoirs of the Volga, Kama and Don rivers, the European part of Russia. Limnologica 2020, 84, 125819. [Google Scholar] [CrossRef]
- Belykh, O.I.; Gladkikh, A.S.; Sorokovikova, E.G.; Tikhonova, I.V.; Potapov, S.A.; Butina, T.V. Saxitoxin-producing cyanobacteria in Lake Baikal. Contemp. Probl. Ecol. 2015, 8, 186–192. [Google Scholar] [CrossRef]
- Mikhailov, I.S.; Zakharova, Y.R.; Bukin, Y.S.; Galachyants, Y.; Petrova, D.; Sakirko, M.; Likhoshway, Y. Co-occurrence Networks Among Bacteria and Microbial Eukaryotes of Lake Baikal During a Spring Phytoplankton Bloom. Microb. Ecol. 2019, 77, 96–109. [Google Scholar] [CrossRef]
- Mikhailov, I.S.; Galachyants, Y.P.; Bukin, Y.S.; Petrova, D.; Bashenkhaeva, M.; Sakirko, M.; Blinov, V.; Titova, L.; Zakharova, Y.; Likhoshway, Y. Seasonal Succession and Coherence Among Bacteria and Microeukaryotes in Lake Baikal. Microb. Ecol. 2022, 84, 404–422. [Google Scholar] [CrossRef] [PubMed]
- Sorokovikova, E.; Belykh, O.; Krasnopeev, A.; Potapov, S.; Tikhonova, I.; Khanaev, I.; Kabilov, M.; Baturina, O.; Podlesnaya, G.; Timoshkin, O. First data on cyanobacterial biodiversity in benthic biofilms during mass mortality of endemic sponges in Lake Baikal. J. Great Lakes Res. 2020, 46, 75–84. [Google Scholar] [CrossRef]
- Belykh, O.I.; Krasnopeev, A.Y.; Potapov, S.A.; Gutnik, D.I.; Sorokovikova, E.G.; Butina, T.V.; Tikhonova, I.V. Ultramicrobacteria and filterable bacteria in the plankton of Lake Baikal. Limnol. Freshw. Biol. 2024, 4, 795–820. [Google Scholar] [CrossRef]
- Prokhorov, A.M. (Ed.) Moscow (capital of the USSR). In Great Soviet Encyclopedia: [In 30 tons], 3rd ed.; Soviet Encyclopedia: Moscow, Russia, 1969–1978. (In Russian) [Google Scholar]
- Kezlya, E.; Mironova, E.; Chernova, E.; Gololobova, M.; Mironov, A.; Voyakina, E.; Maltsev, Y.; Snarskaya, D.; Kulikovskiy, M. Comprehensive Study of Some Cyanobacteria in Moscow Waterbodies (Russia), Including Characteristics of the Toxigenic Microcystis aeruginosa Strains. Toxins 2025, 17, 506. [Google Scholar] [CrossRef]
- Komárek, J.; Anagnostidis, K. Cyanoprokaryota. 1. Chroococcales. In Süßwasserflora von Mitteleuropa; Begründet von A. Pascher. Band 19/1; Ettl, H., Gärtner, G., Heynig, H., Mollenhauer, D., Eds.; Spektrum, Akademischer Verlag: Berlin/Heidelberg, Germany, 1999; pp. 1–548. [Google Scholar]
- Komárek, J. Cyanoprokaryota: Heterocystous Genera (Nostocales, Stigonematales). In Süßwasserflora von Mitteleuropa; Springer Spektrum: Berlin/Heidelberg, Germany, 2013; Volume 19/3, pp. 1–1130. [Google Scholar]
- Abakumov, V.A.; Bubnova, N.P.; Kholikova, N.I.; Goridchenko, T.P.; Liepa, R.A.; Svirskaya, N.L.; Ganshina, L.A.; Semin, V.A.; Khromov, V.M.; Nikitin, D.I.; et al. Guide to Methods of Hydrobiological Analysis of Surface Waters and Bottom Sediments; Gidrometeoizdat: Leningrad, Russia, 1983; 239p. (In Russian) [Google Scholar]
- Nübel, U.; Garcia-Pichel, F.; Muyzer, G. PCR primers to amplify 16S rRNA genes from cyanobacteria. Appl. Environ. Microbiol. 1997, 63, 3327–3332. [Google Scholar] [CrossRef]
- Kang, J.; Mohamed, H.F.; Liu, X.; Pei, L.; Huang, S.; Lin, X.; Zheng, X.; Luo, Z. Combined Culture and DNA Metabarcoding Analysis of Cyanobacterial Community Structure in Response to Coral Reef Health Status in the South China Sea. J. Mar. Sci. Eng. 2022, 10, 1984. [Google Scholar] [CrossRef]
- Gelis, M.M.N.; Canino, A.; Bouchez, A.; Domaizon, I.; Laplace-Treyture, C.; Rimet, F.; Alric, B. Assessing the relevance of DNA metabarcoding compared to morphological identification for lake phytoplankton monitoring. Sci. Total Environ. 2024, 914, 169774. [Google Scholar] [CrossRef]
- Guiry, M.D.; Guiry, G.M. AlgaeBase. World-Wide Electronic Publication, University of Galway. Available online: https://www.algaebase.org (accessed on 25 October 2025).
- Herdman, M.; Rippka, R. CYANOBACTERIOTA: Phylogeny and Taxonomy. 2024. Available online: https://cyanophylogeny.scienceontheweb.net (accessed on 25 October 2025).
- Katoh, K.; Toh, H. Parallelization of the MAFFT multiple sequence alignment program. Bioinformatics 2010, 26, 1899–1900. [Google Scholar] [CrossRef]
- Kumar, S.; Stecher, G.; Tamura, K. MEGA7: Molecular evolutionary genetics analysis version 7.0 for bigger datasets. Mol. Biol. Evol. 2016, 33, 1870–1874. [Google Scholar] [CrossRef] [PubMed]
- Drummond, A.J.; Rambaut, A. BEAST: Bayesian evolutionary analysis by sampling trees. BMC Evol. Biol. 2007, 7, 214. [Google Scholar] [CrossRef] [PubMed]
- Edler, D.; Klein, J.; Antonelli, A.; Silvestro, D. raxmlGUI 2.0: A graphical interface and toolkit for phylogenetic analyses using RAxML. Methods Ecol. Evol. 2021, 12, 373–377. [Google Scholar] [CrossRef]
- Skoupý, S.; Stanojkovi’c, A.; Pavlíková, M.; Poulĩcková, A.; Dvŏrák, P. New cyanobacterial genus Argonema is hiding in soil crusts around the world. Sci. Rep. 2022, 12, 7203. [Google Scholar] [CrossRef]
- Albrecht, M.; Pröschold, T.; Schumann, R. Identification of cyanobacteria in a eutrophic coastal lagoon on the Southern Baltic coast. Front. Microbiol. 2017, 8, 923. [Google Scholar] [CrossRef]
- Tukhtaboeva, Y.A.; Redkina, V.V.; Bukin, Y.S.; Temraleeva, A.D. Diversity of Cyanobacteria and Algae in Erodited Soils of the Fergana Valley (Uzbekistan) According to Light Microscopy Data and High-Throughput Sequencing. Arid Ecosyst. 2025, 15, 232–245. [Google Scholar] [CrossRef]
- Patova, E.; Novakovskaya, I.; Gusev, E.; Martynenko, N. Diversity of Cyanobacteria and Algae in Biological Soil Crusts of the Northern Ural Mountain Region Assessed through Morphological and Metabarcoding Approaches. Diversity 2023, 15, 1080. [Google Scholar] [CrossRef]
- Eiler, A.; Drakare, S.; Bertilsson, S.; Pernthaler, J.; Peura, S.; Rofner, C.; Simek, K.; Yang, Y.; Znachor, P.; Lindstr¨om, E.S. Unveiling distribution patterns of freshwater phytoplankton by a next generation sequencing based approach. PLoS ONE 2013, 8, e53516. [Google Scholar] [CrossRef]
- Bradley, I.M.; Pinto, A.J.; Guest, J.S. Design and evaluation of Illumina MiSeq-compatible, 18S rRNA gene-specific primers for improved characterization of mixed phototrophic communities. Appl. Environ. Microbiol. 2016, 82, 5878–5891. [Google Scholar] [CrossRef]
- Ballot, A.; Swe, T.; Mjelde, M.; Cerasino, L.; Hostyeva, V.; Miles, C.O. Cylindrospermopsin- and Deoxycylindrospermopsin-Producing Raphidiopsis raciborskii and Microcystin-Producing Microcystis spp. in Meiktila Lake, Myanmar. Toxins 2020, 12, 232. [Google Scholar] [CrossRef] [PubMed]
- Berry, M.A.; White, J.D.; Davis, T.W.; Jain, S.; Johengen, T.H.; Dick, G.J.; Sarnelle, O.; Denef, V.J. Are Oligotypes Meaningful Ecological and Phylogenetic Units? A Case Study of Microcystis in Freshwater Lakes. Front. Microbiol. 2017, 8, 365. [Google Scholar] [CrossRef] [PubMed]
- Ernst, B.; Hitzfeld, B.; Dietrich, D.R. Presence of Planktothrix sp. and cyanobac terial toxins in lake Ammersee, Germany and their impact on whitefish (Coregonus lavaretus L.). Environ. Toxicol. 2001, 16, 483–488. [Google Scholar] [CrossRef]
- Kurmayer, R.; Deng, L.; Entfellner, E. Role of toxic and bioactive secondary metabolites in colonization and bloom formation by filamentous cyanobacteria Planktothrix. Harmful Algae 2016, 54, 69–86. [Google Scholar] [CrossRef]
- Lenard, T.; Poniewozik, M. Planktothrix agardhii versus Planktothrix rubescens: Separation of Ecological Niches and Consequences of Cyanobacterial Dominance in Freshwater. Int. J. Environ. Res. Public Health 2022, 19, 14897. [Google Scholar] [CrossRef] [PubMed]
- Melnikova, A.A.; Komova, A.V.; Namsaraev, Z.B. Trends and Driving Forces of Cyanobacterial Blooms in Russia in the 20th and Early 21st Centuries. Microbiology 2022, 91, 649–661. [Google Scholar] [CrossRef]
- Li, X.; Dreher, T.W.; Li, R. An overview of diversity, occurrence, genetics and toxin production of bloom-forming Dolichospermum (Anabaena) species. Harmful Algae 2016, 54, 54–68. [Google Scholar] [CrossRef] [PubMed]
Disclaimer/Publisher’s Note: The statements, opinions and data contained in all publications are solely those of the individual author(s) and contributor(s) and not of MDPI and/or the editor(s). MDPI and/or the editor(s) disclaim responsibility for any injury to people or property resulting from any ideas, methods, instructions or products referred to in the content. |
© 2025 by the authors. Licensee MDPI, Basel, Switzerland. This article is an open access article distributed under the terms and conditions of the Creative Commons Attribution (CC BY) license (https://creativecommons.org/licenses/by/4.0/).