
Adoption of Sustainable Supply Chain Management for Performance Improvement in the Construction Industry: A System Dynamics Approach


 ,
,  ,
,  and
and 
Abstract
:1. Introduction
2. Literature Review
2.1. Sustainable Supply Chain Management (SSCM)
2.2. System Dynamics: An Approach to Deal with Complexity
2.3. Identification of Challenges from Literature
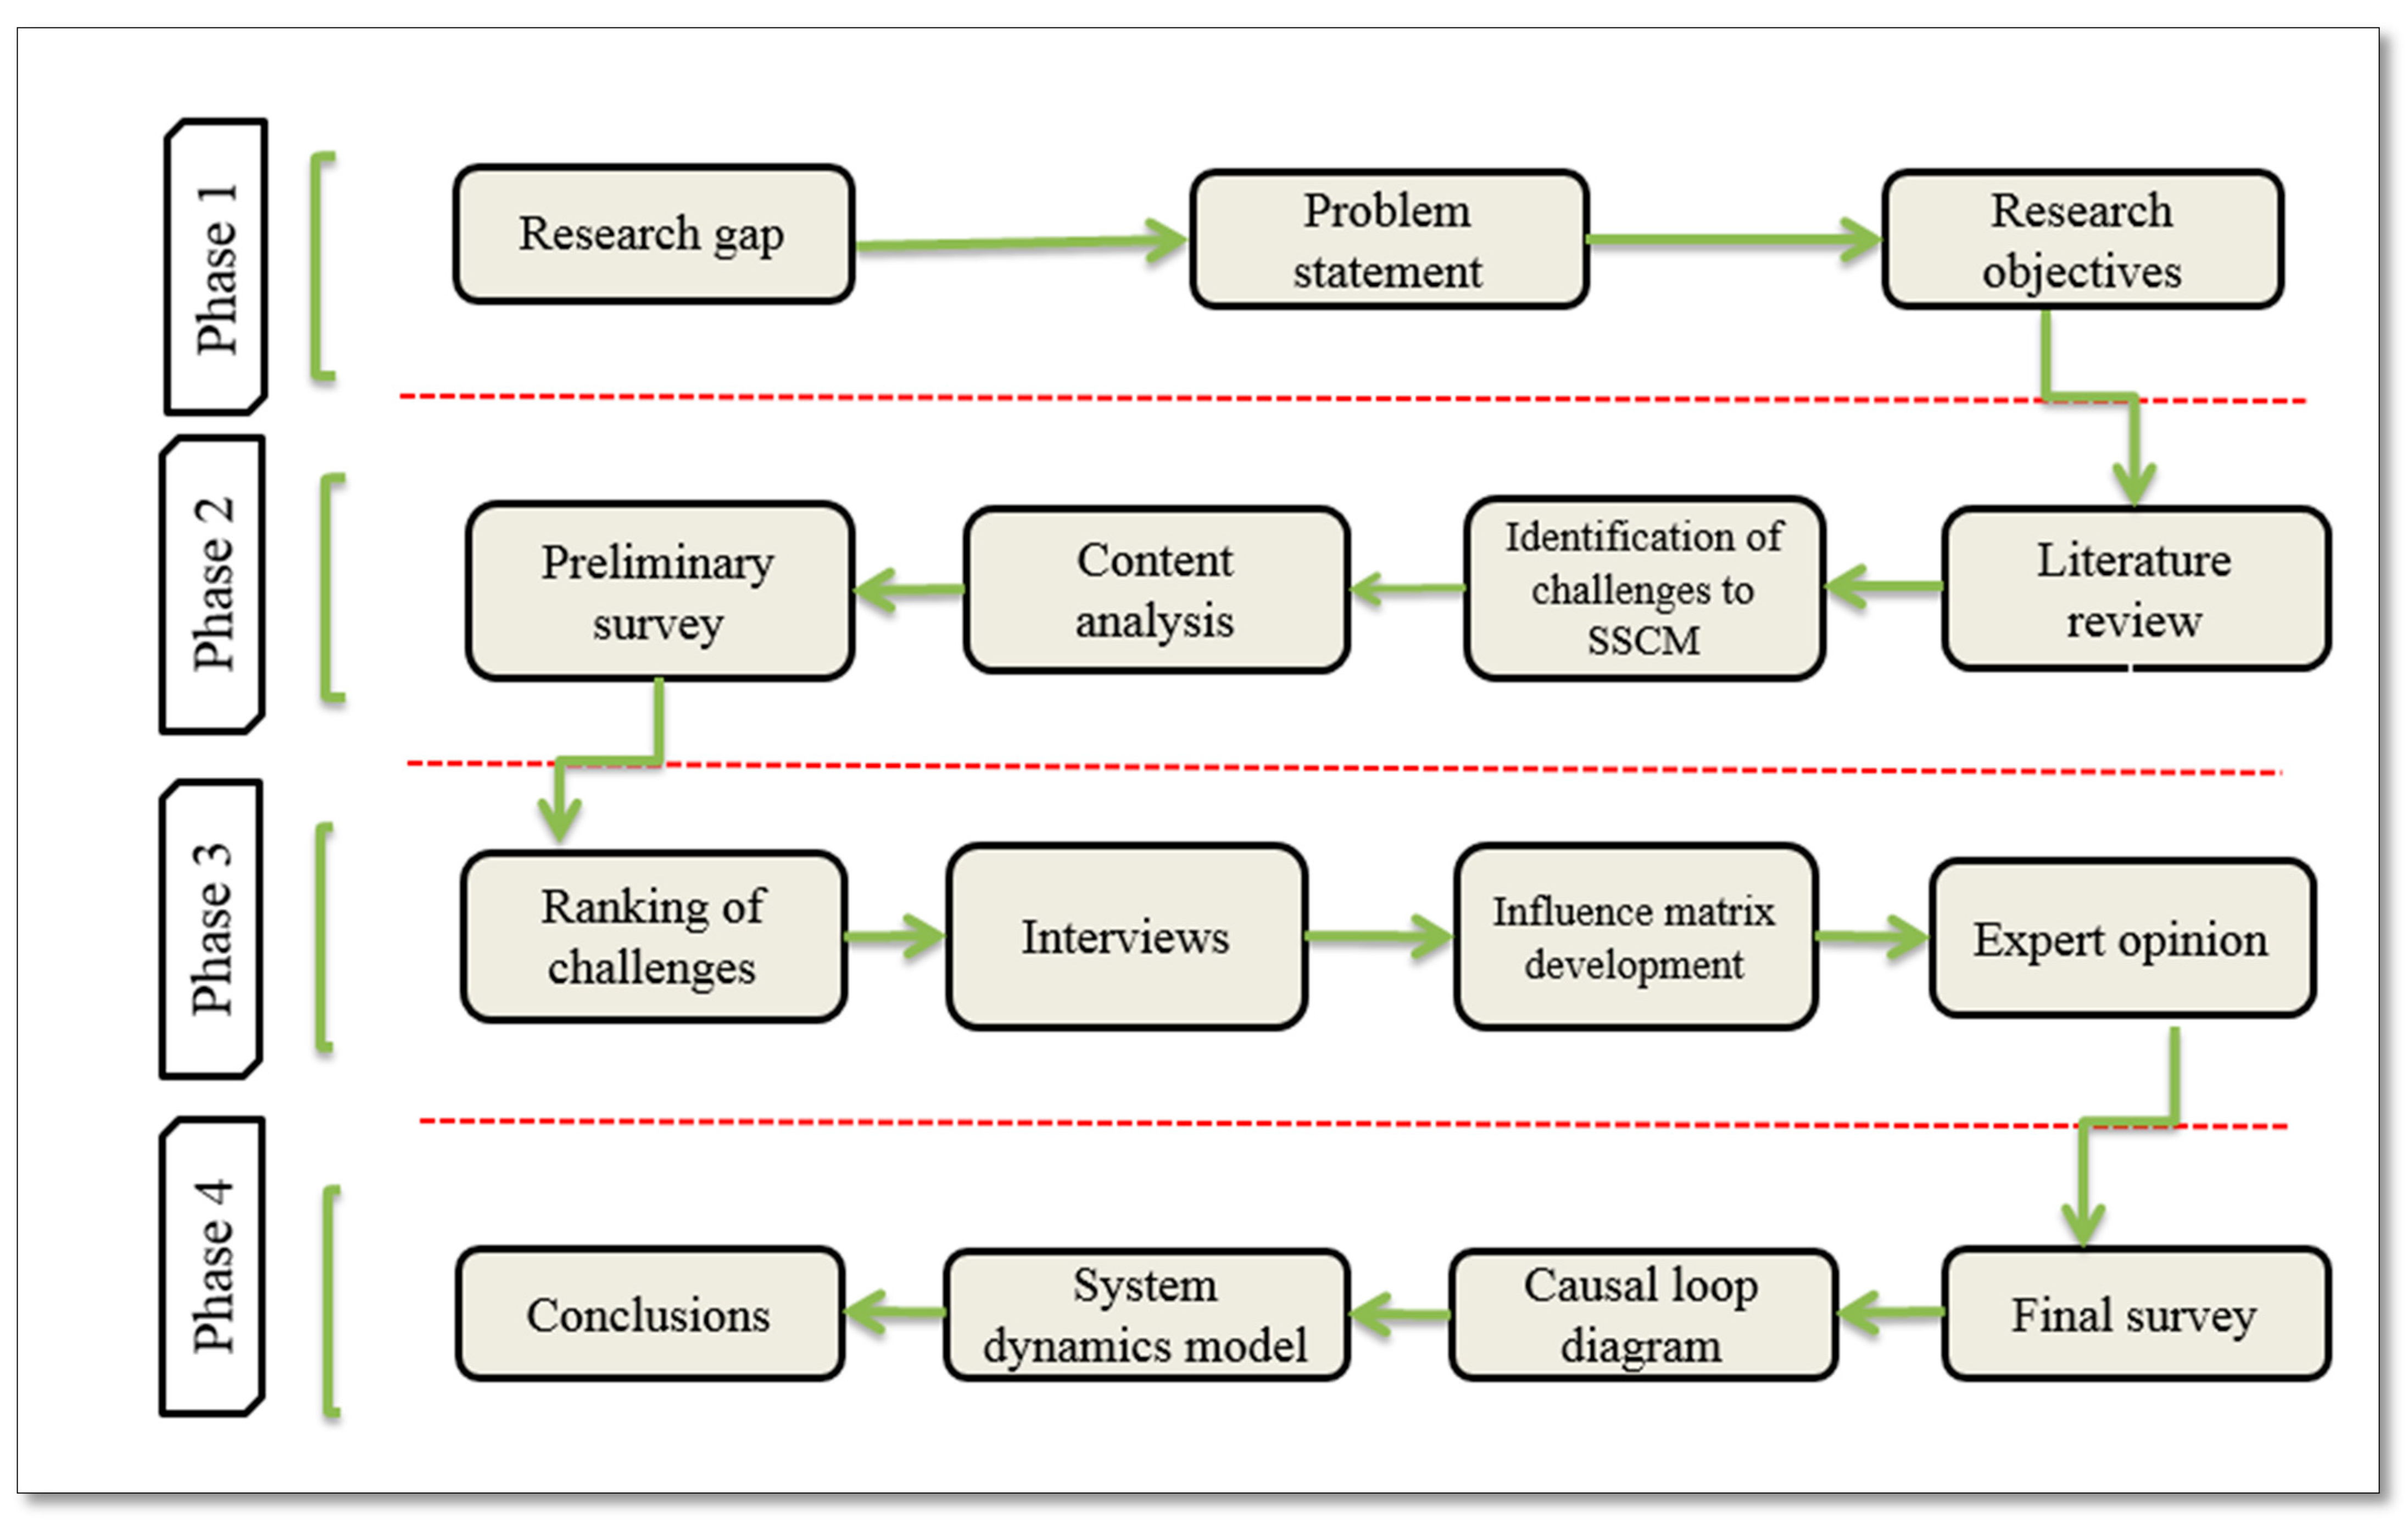
3. Method and Materials
3.1. Data Collection and Analysis
3.2. Survey Demographics
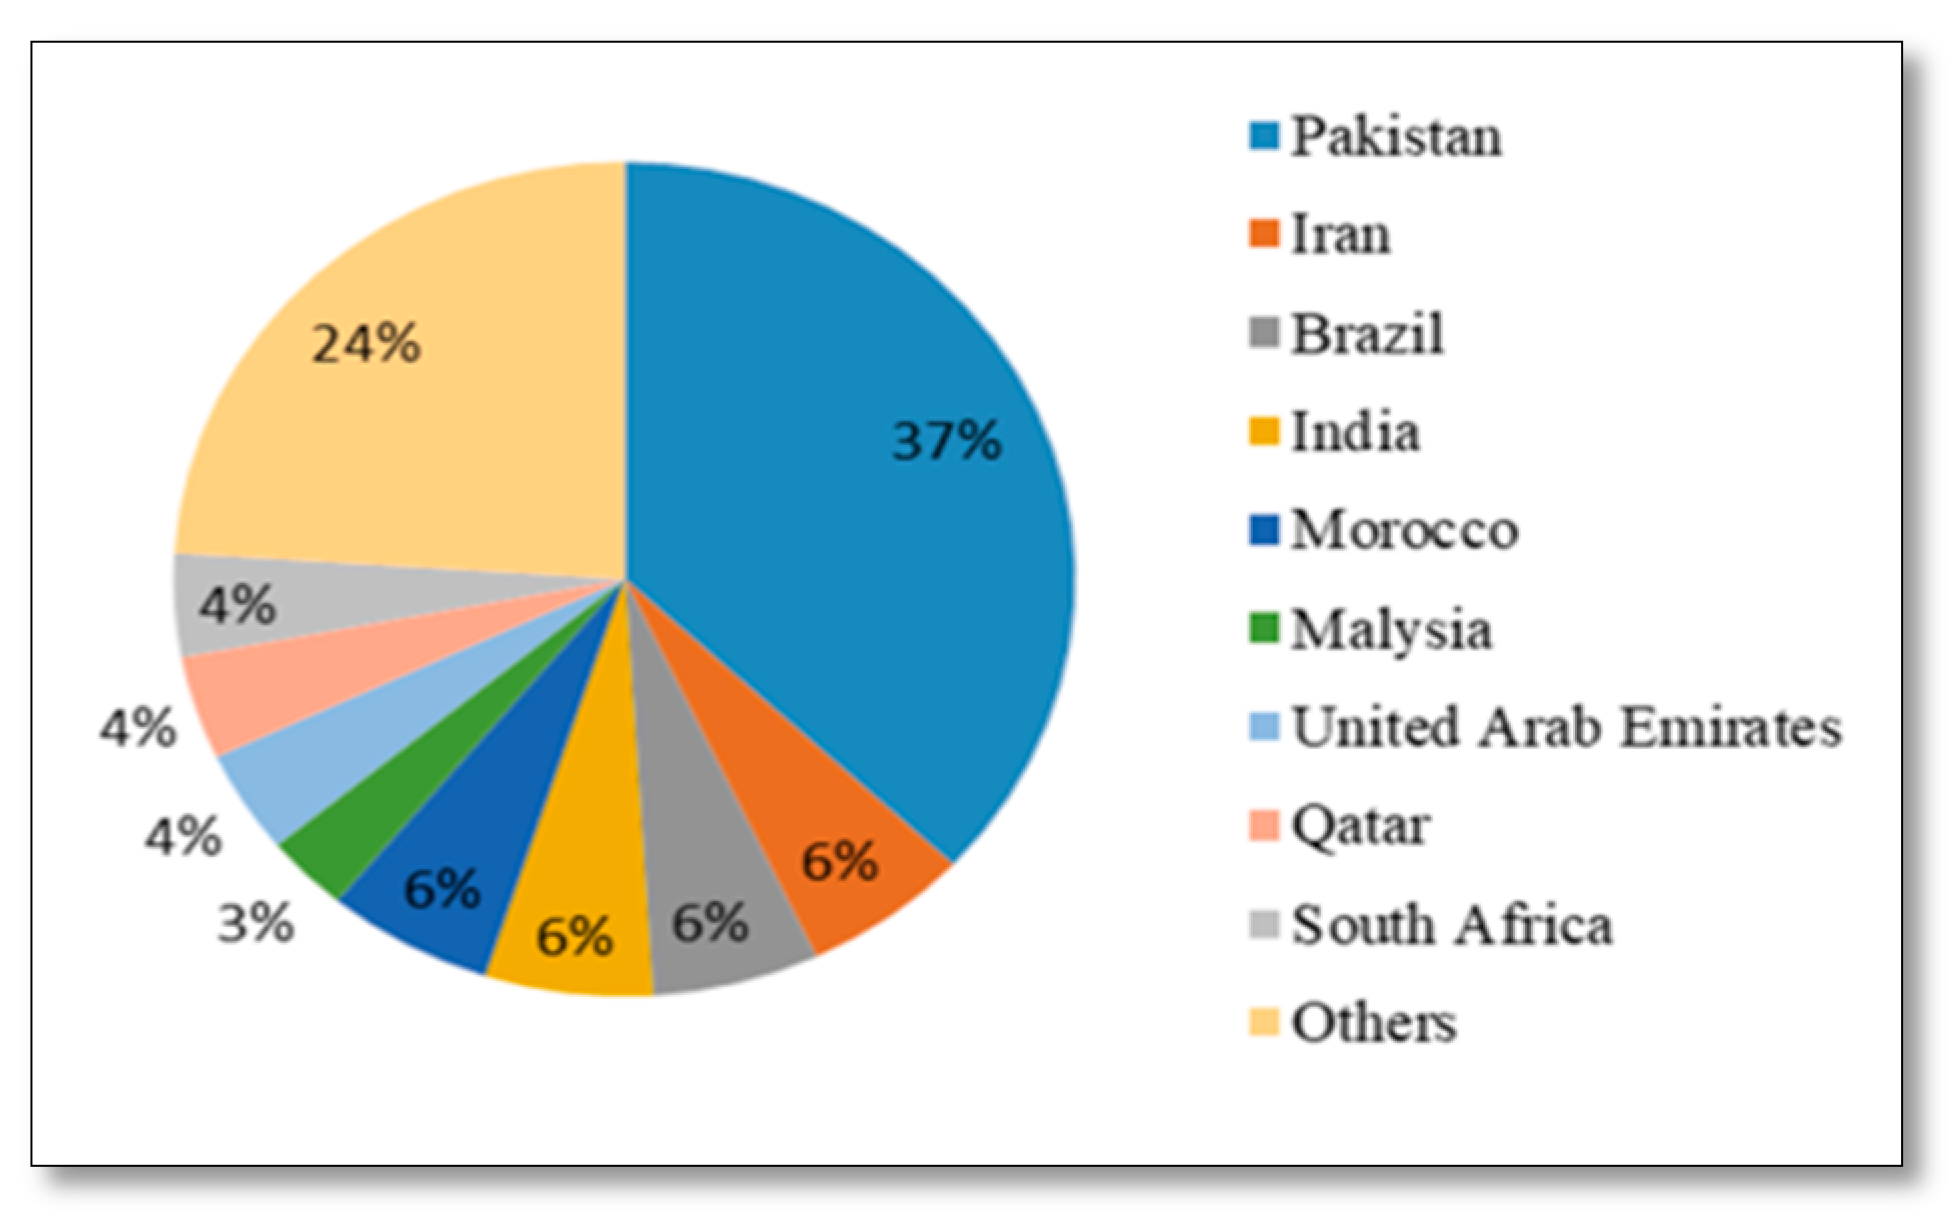
3.3. Regional Distribution of Responses
3.4. System Dynamics Approach
4. Results and Discussions
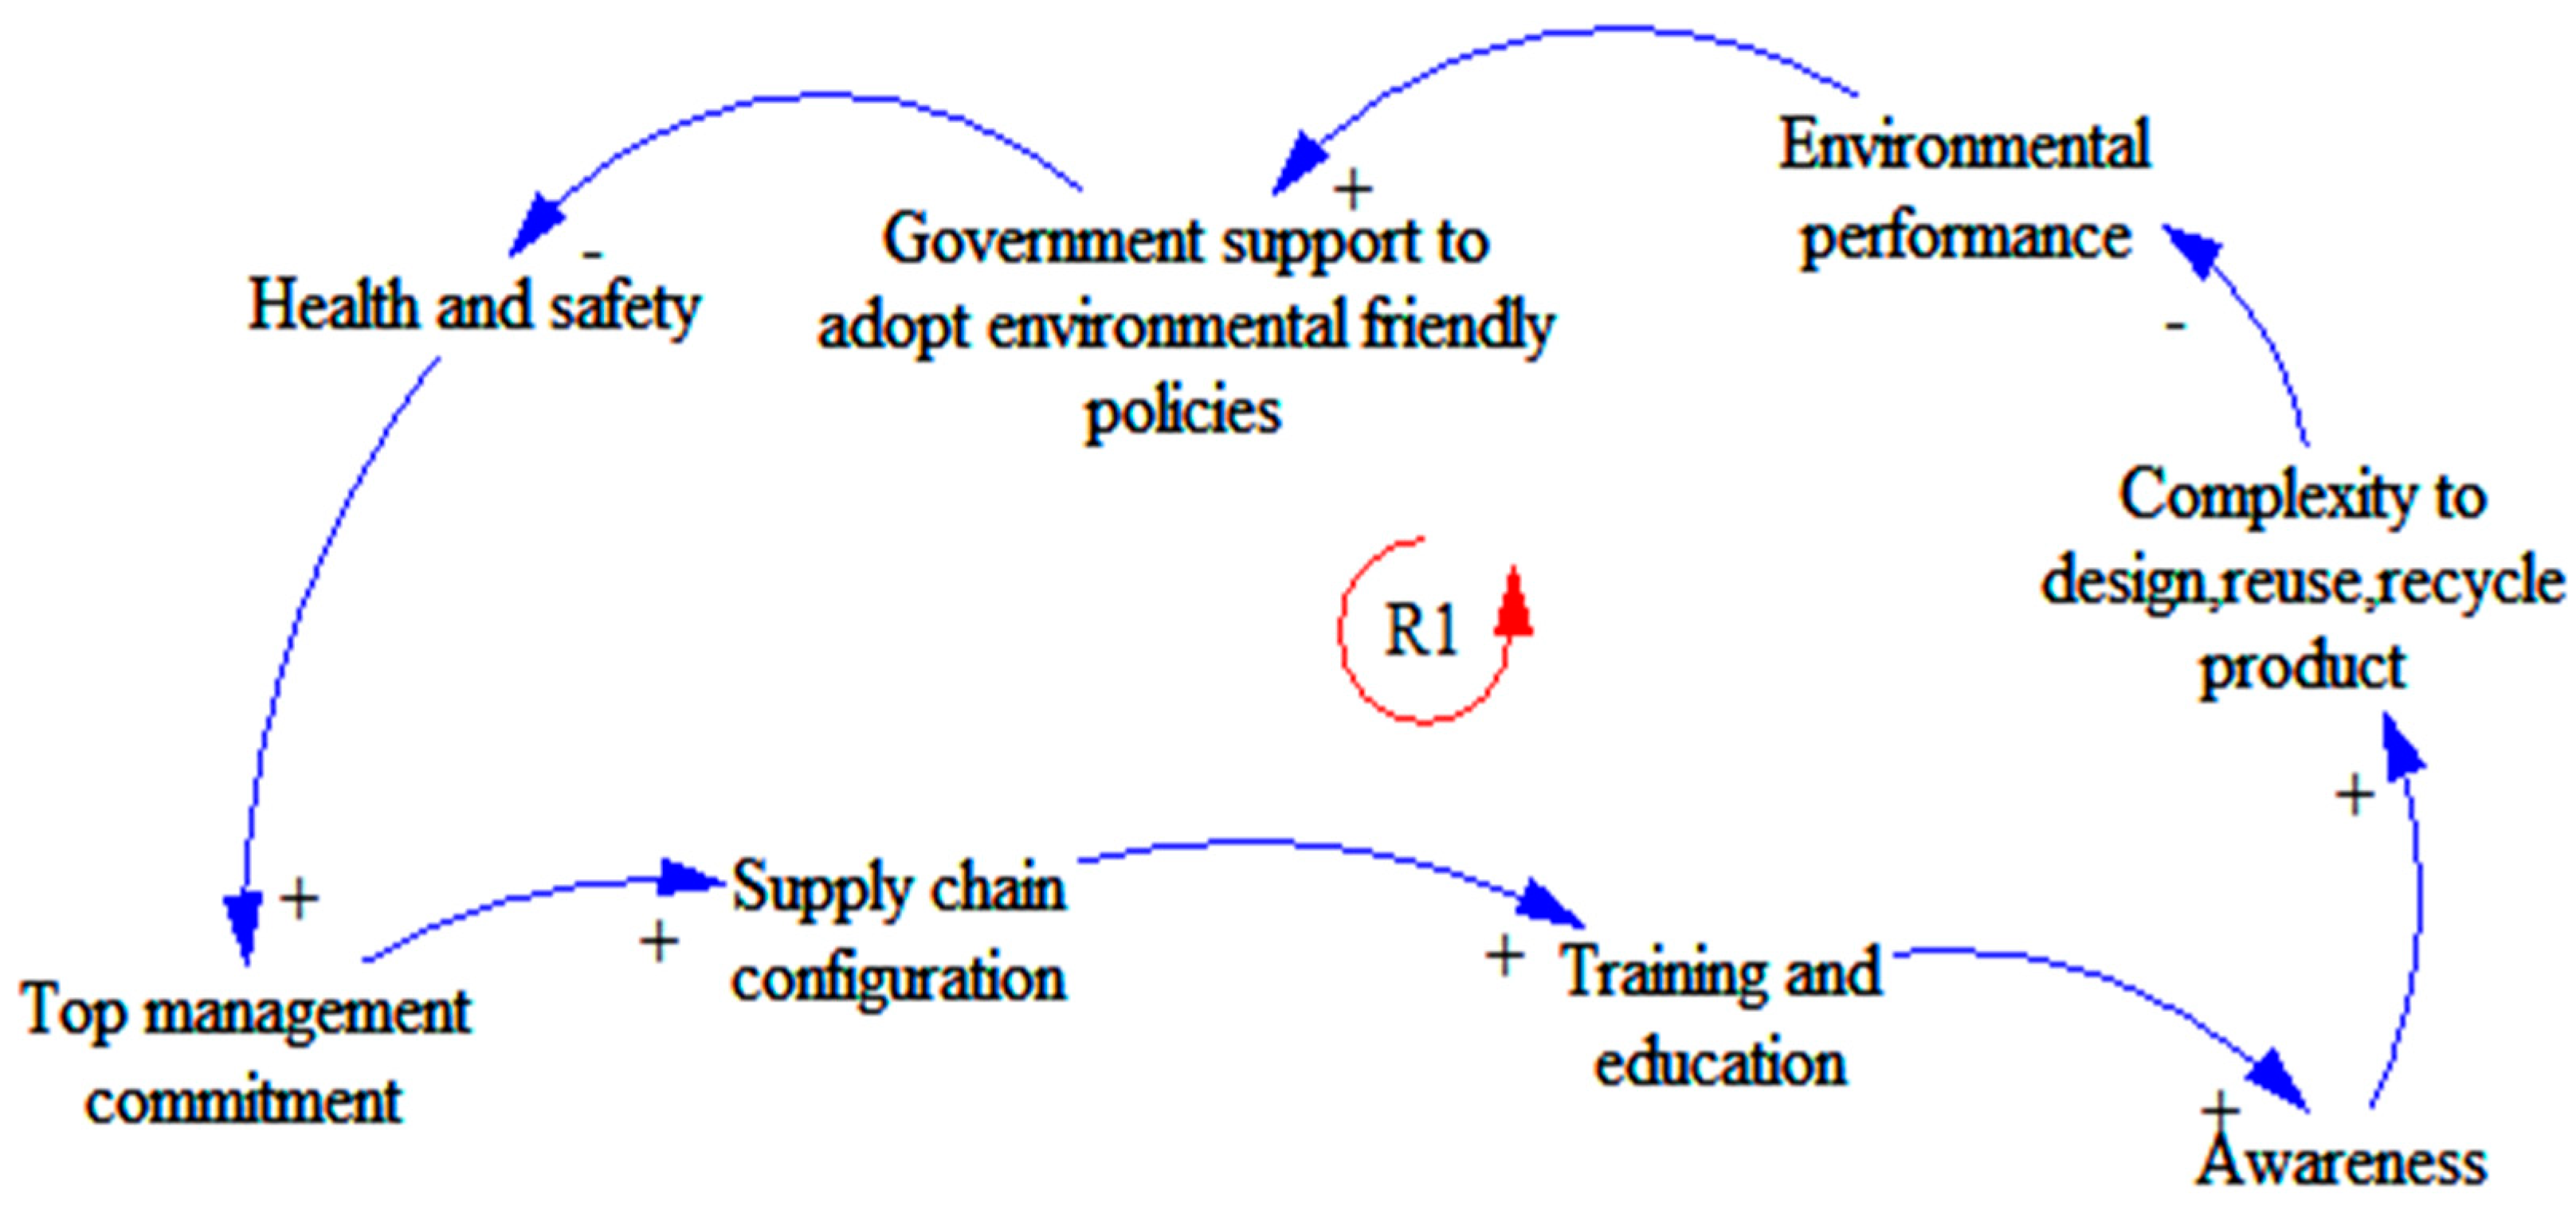
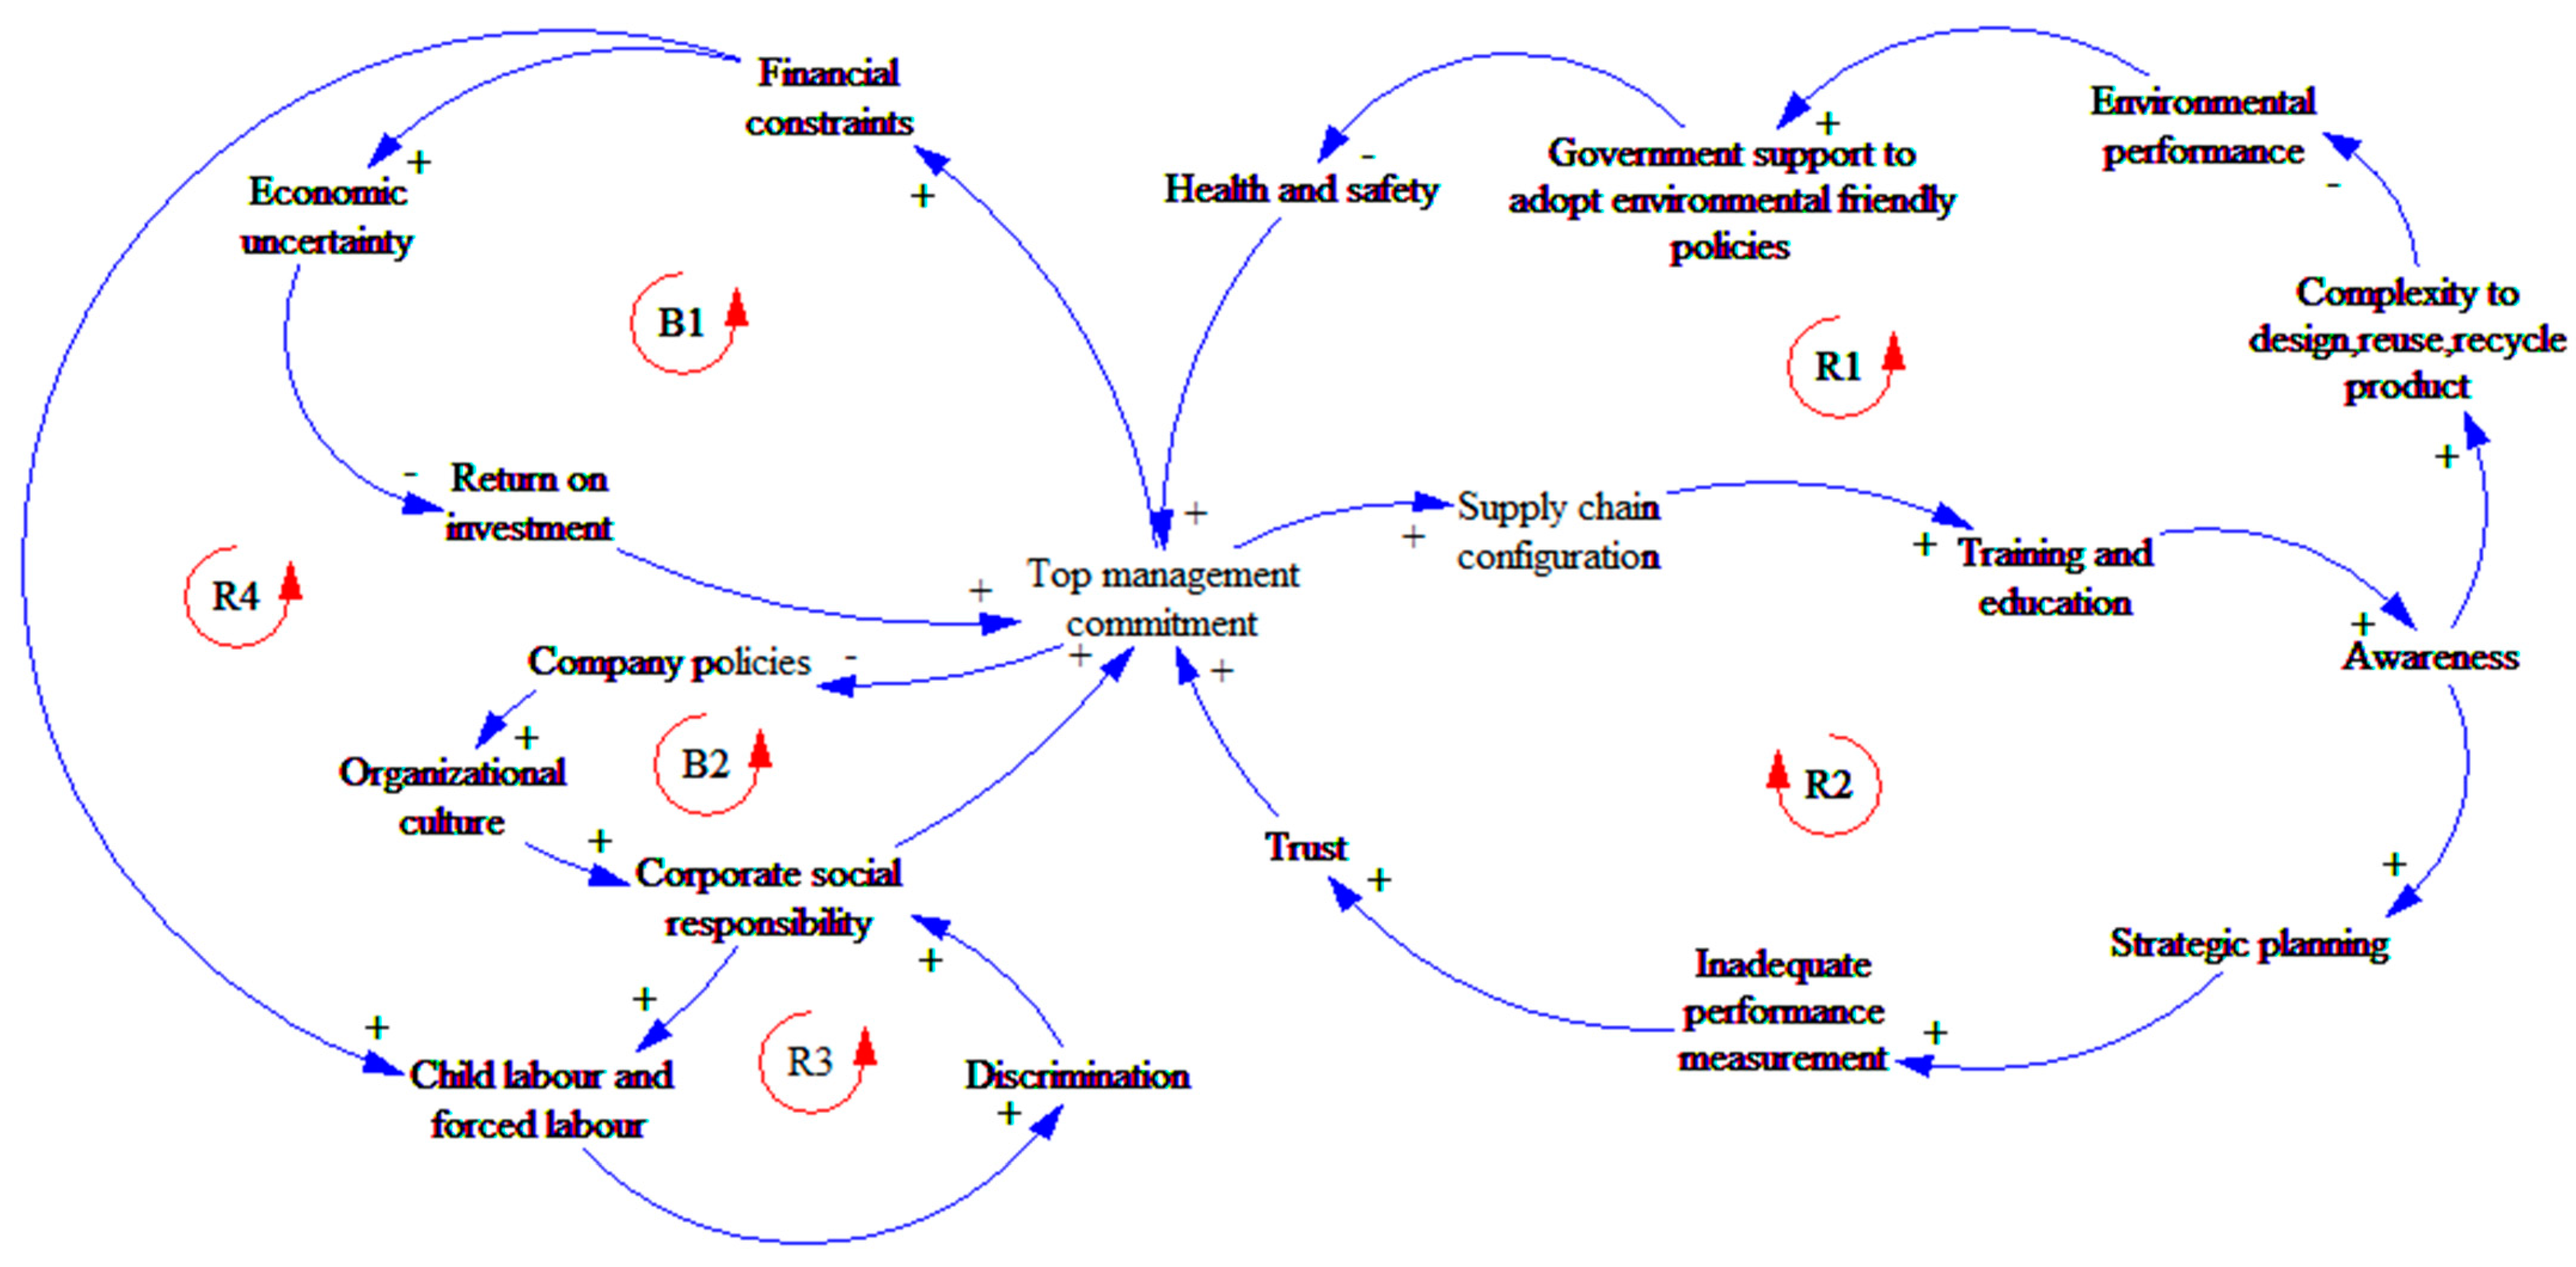
4.1. Causal Loop Diagram
4.1.1. Reinforcing Loop R1
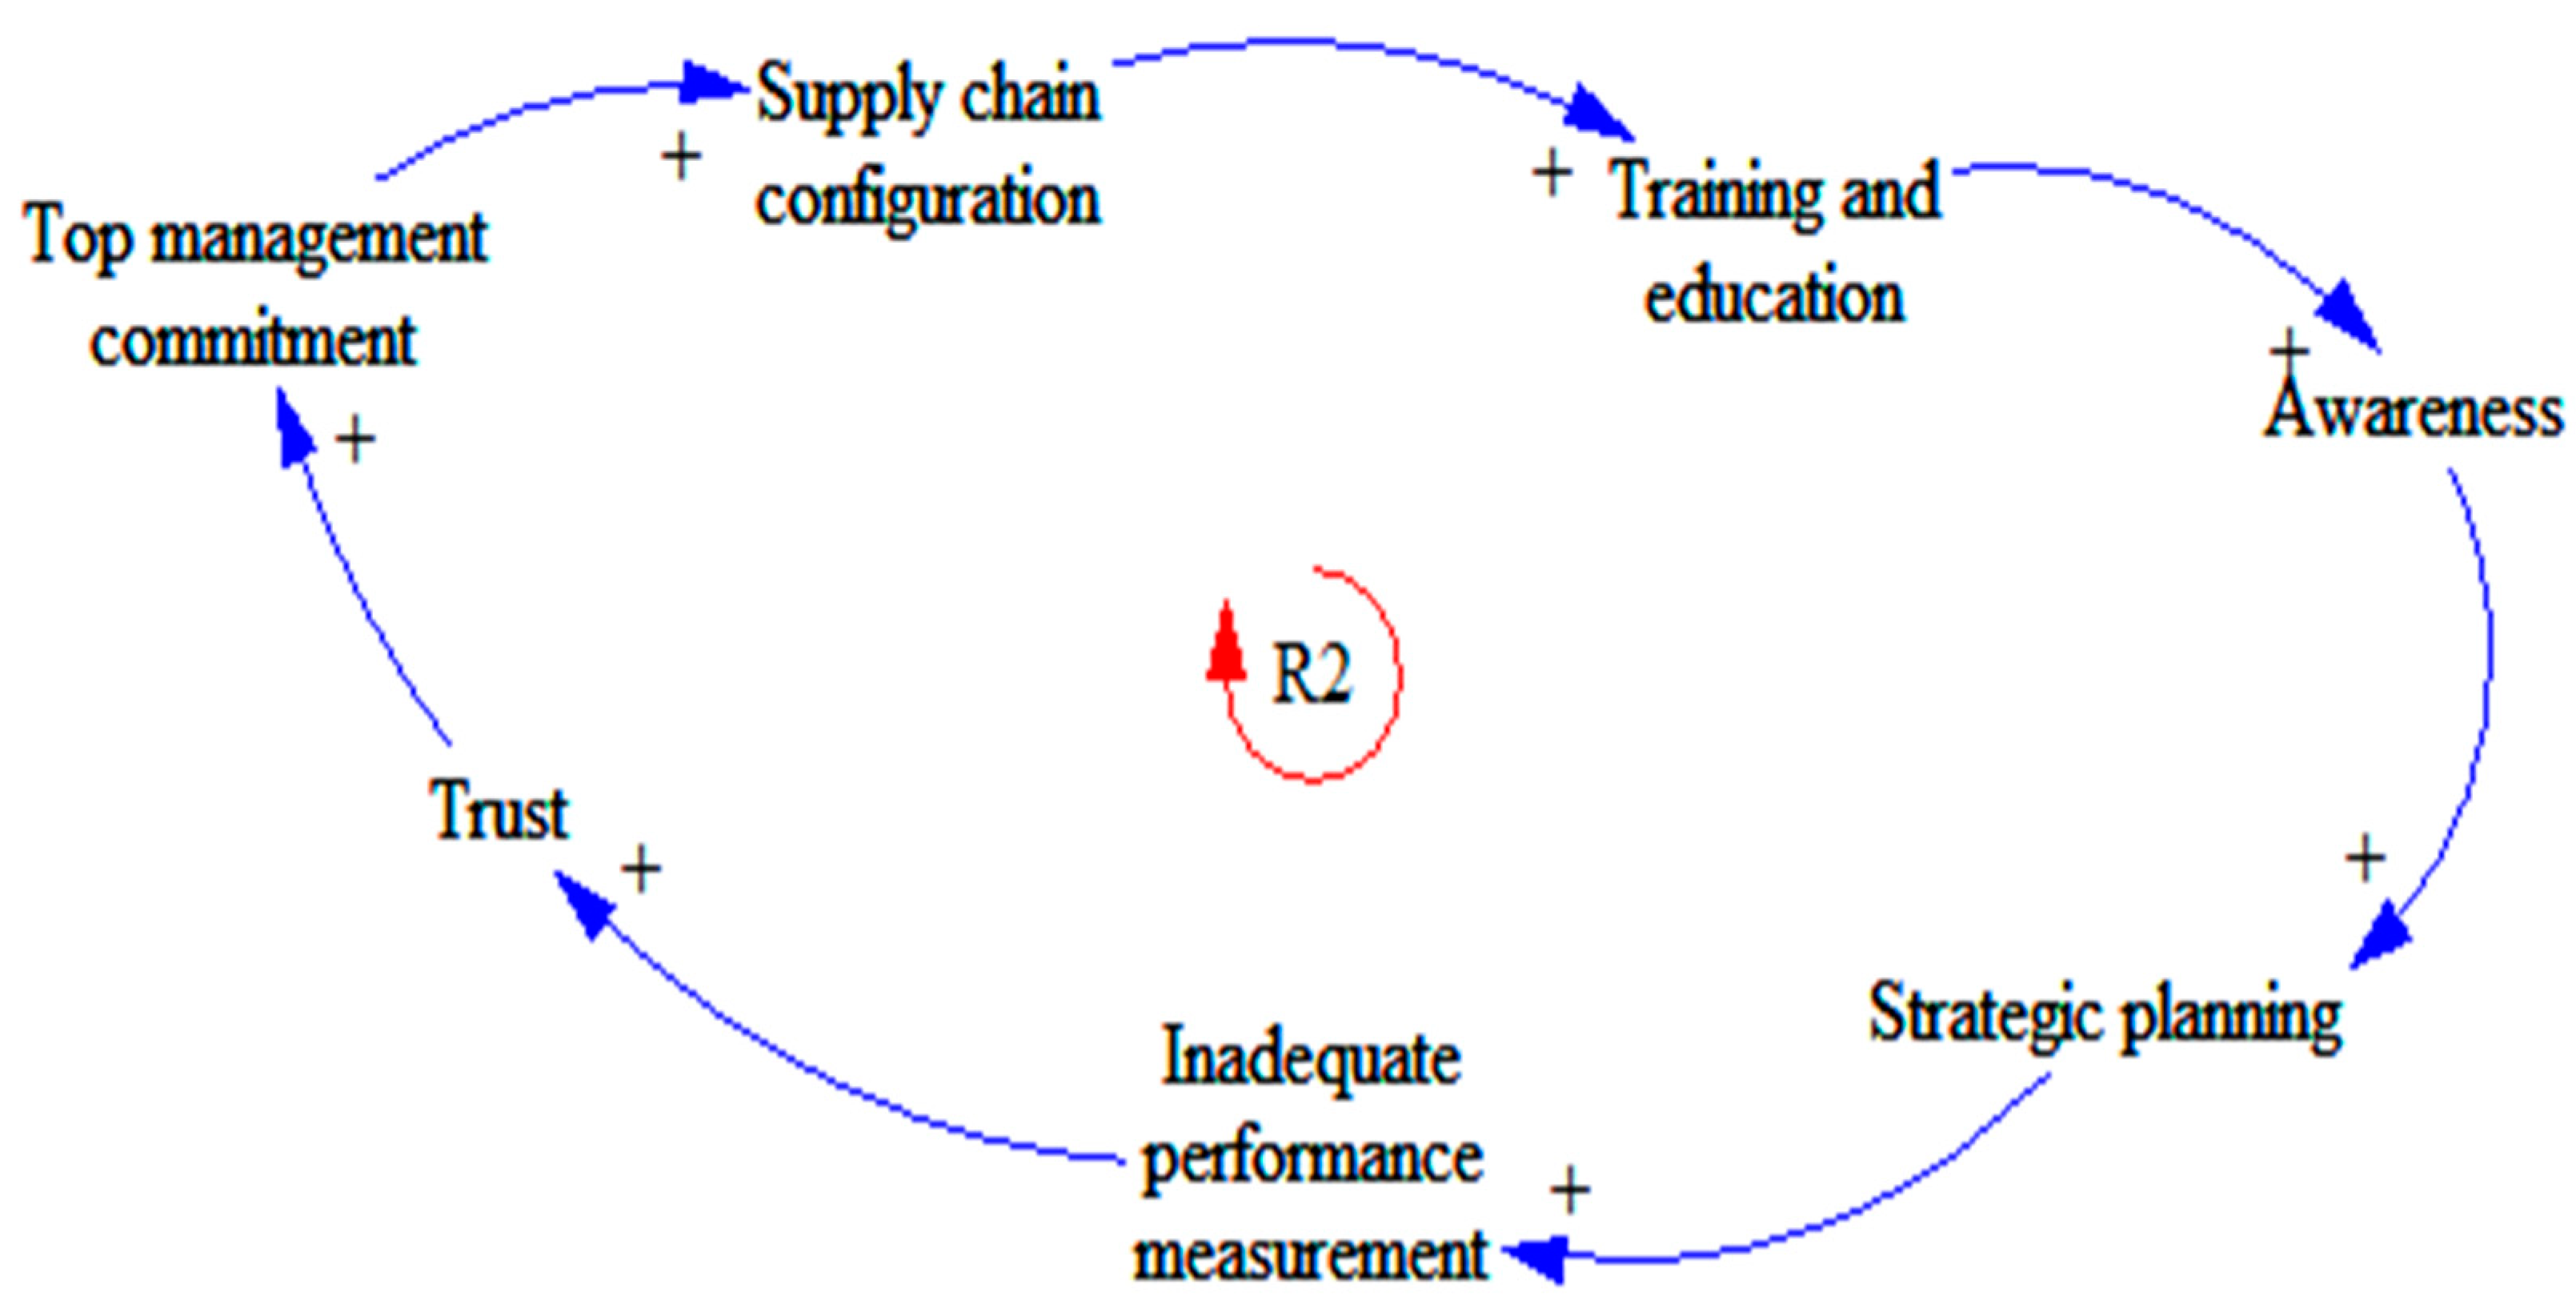
4.1.2. Reinforcing Loop R2
4.1.3. Reinforcing Loop R3
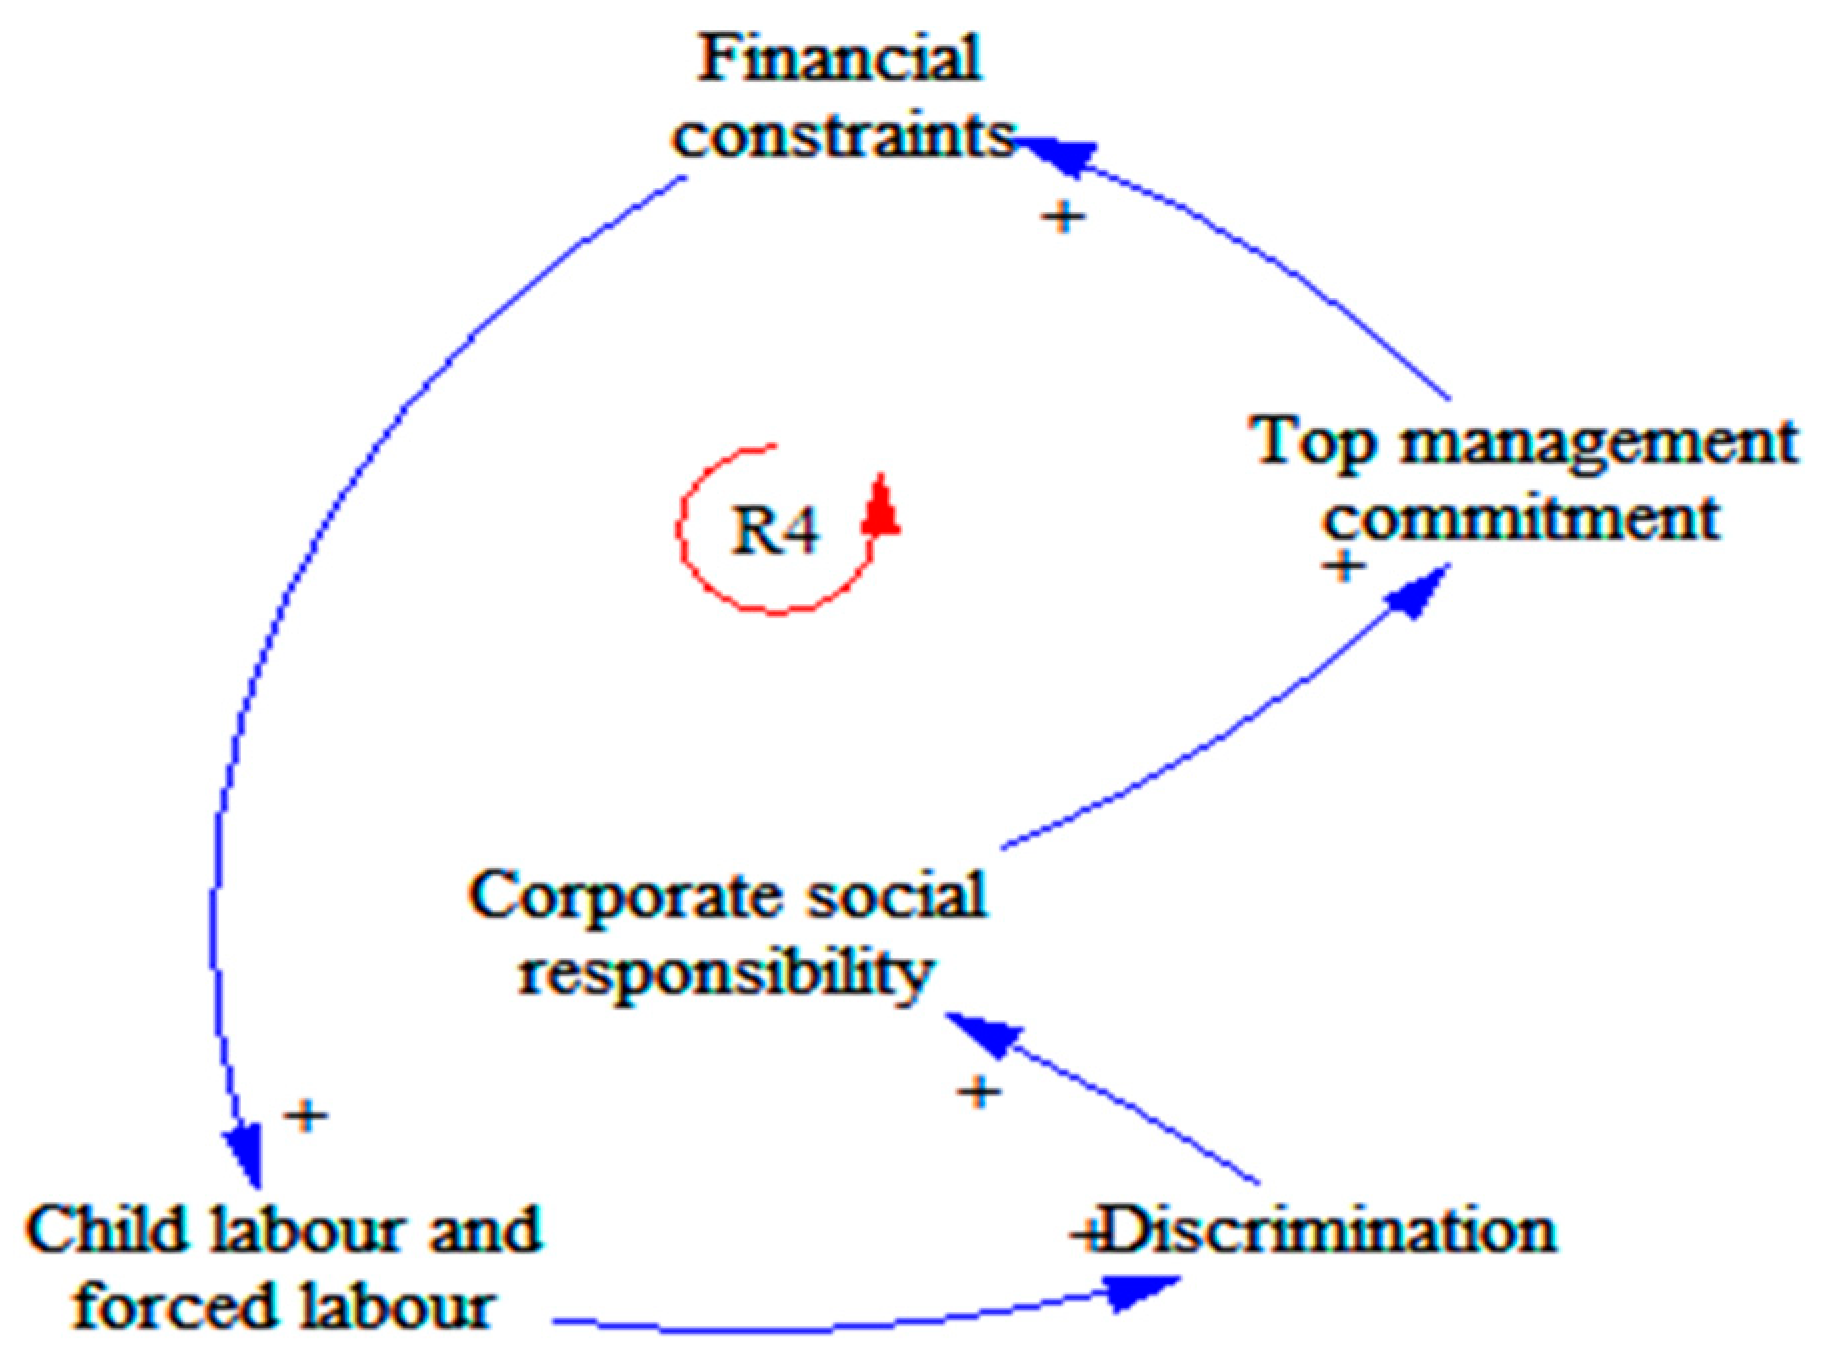
4.1.4. Reinforcing Loop R4
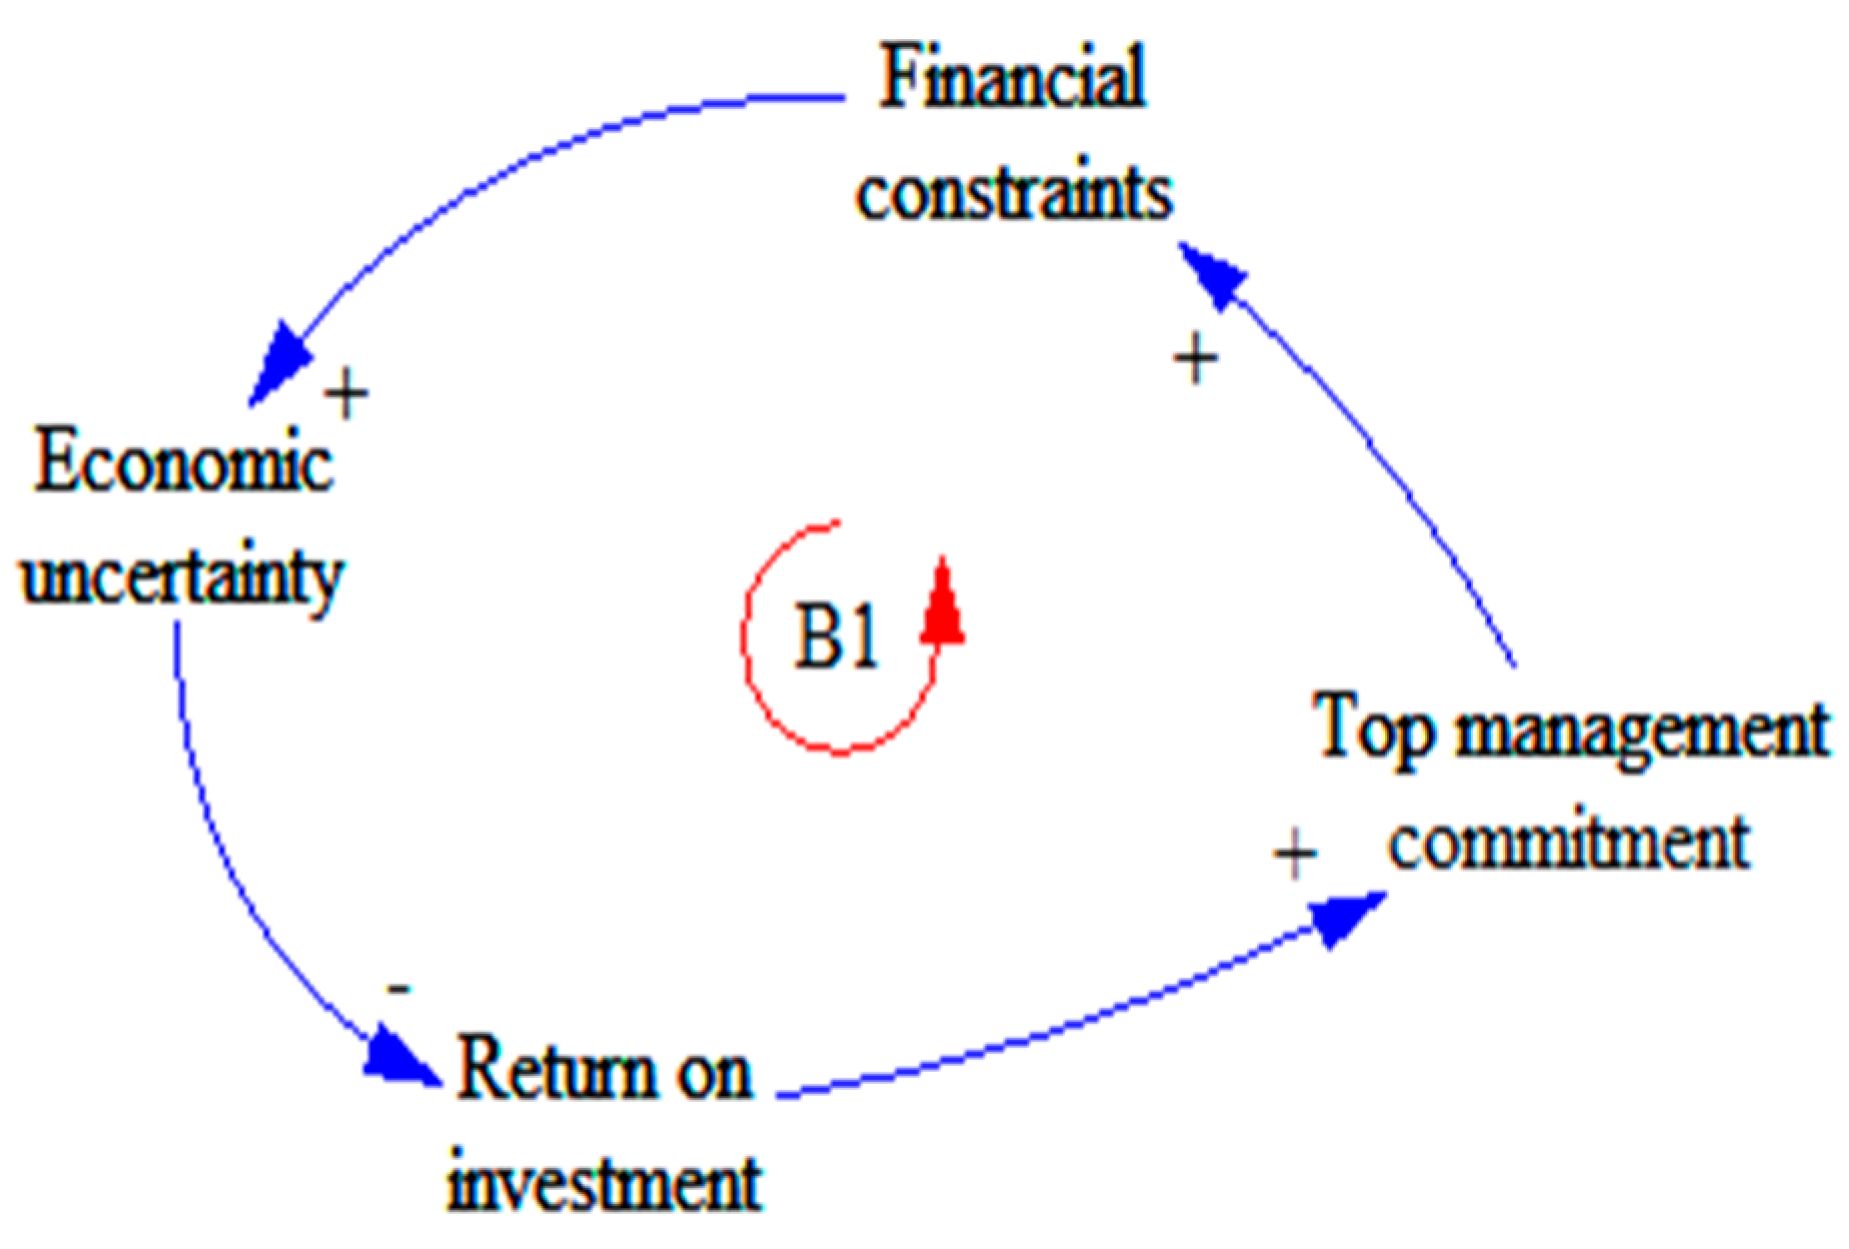
4.1.5. Balancing Loop B1
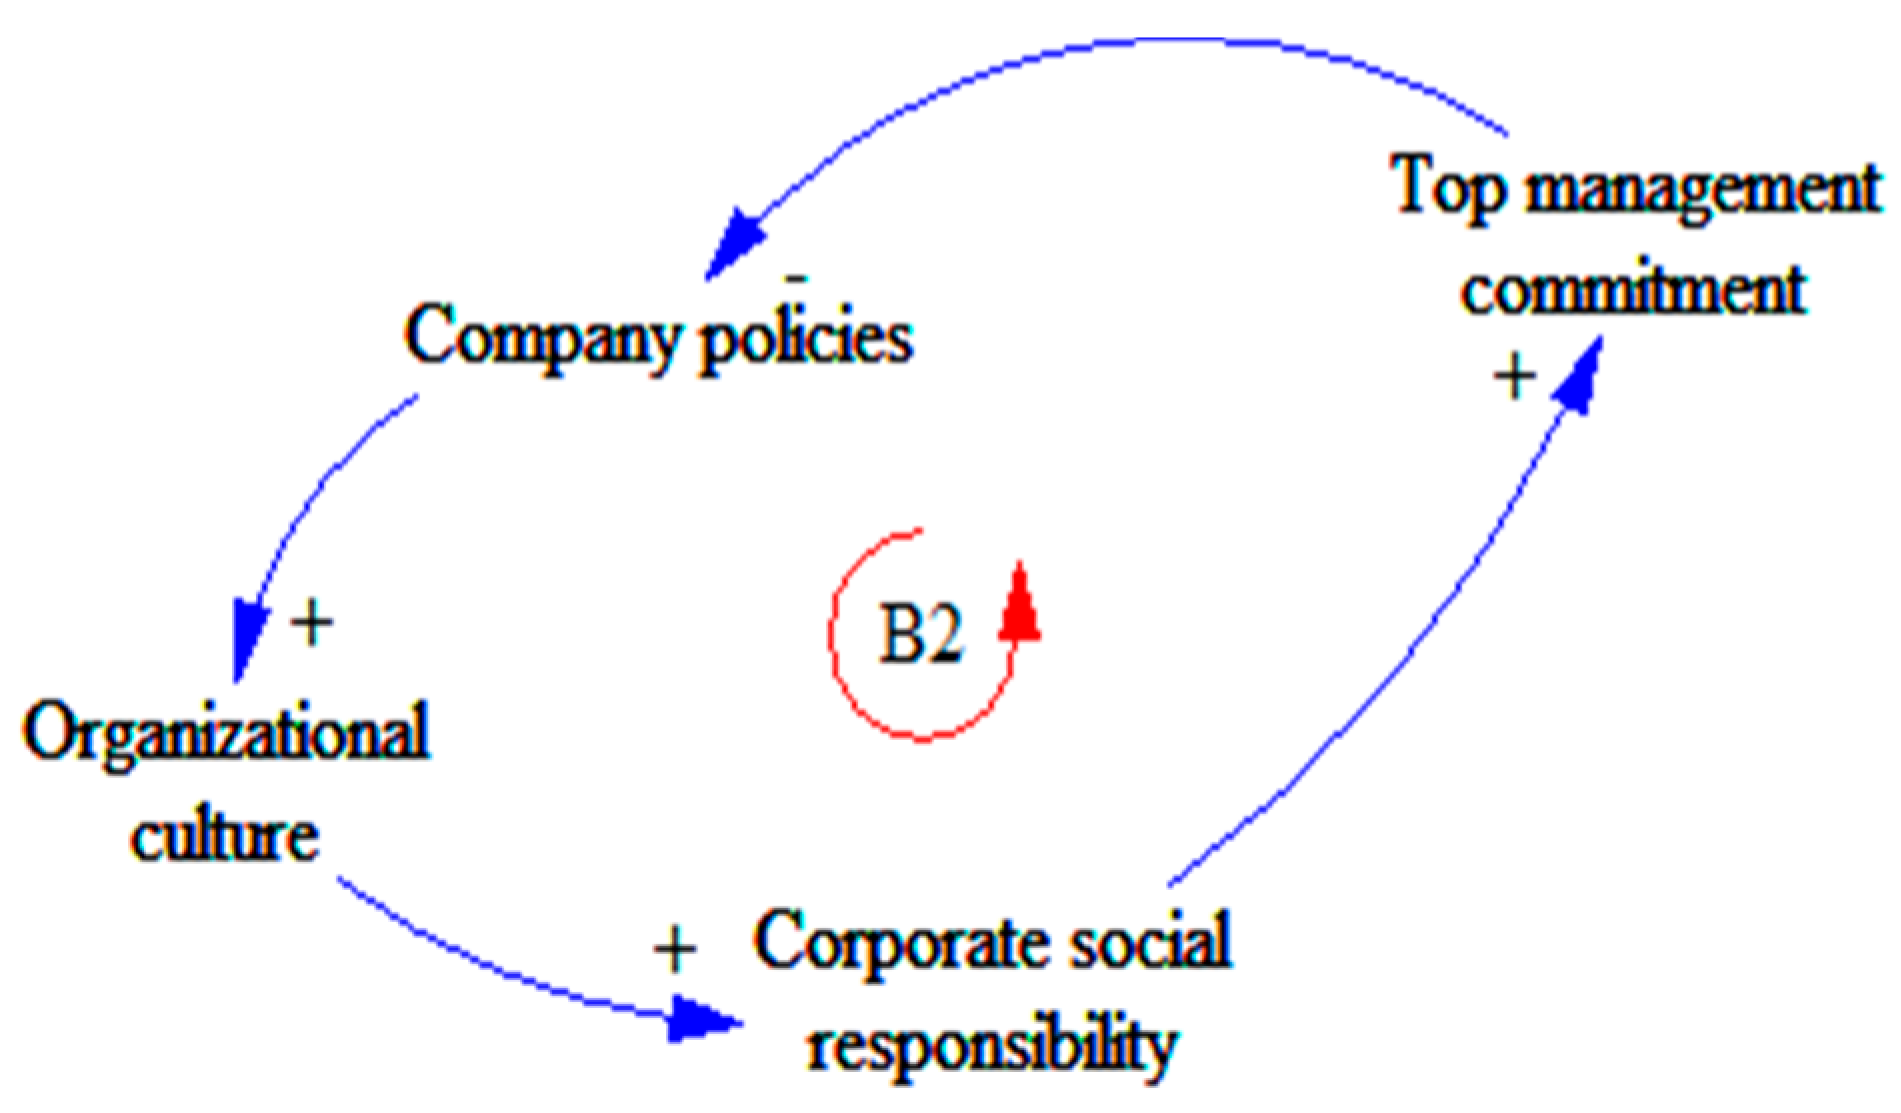
4.1.6. Balancing Loop B2
4.2. System Dynamics Model
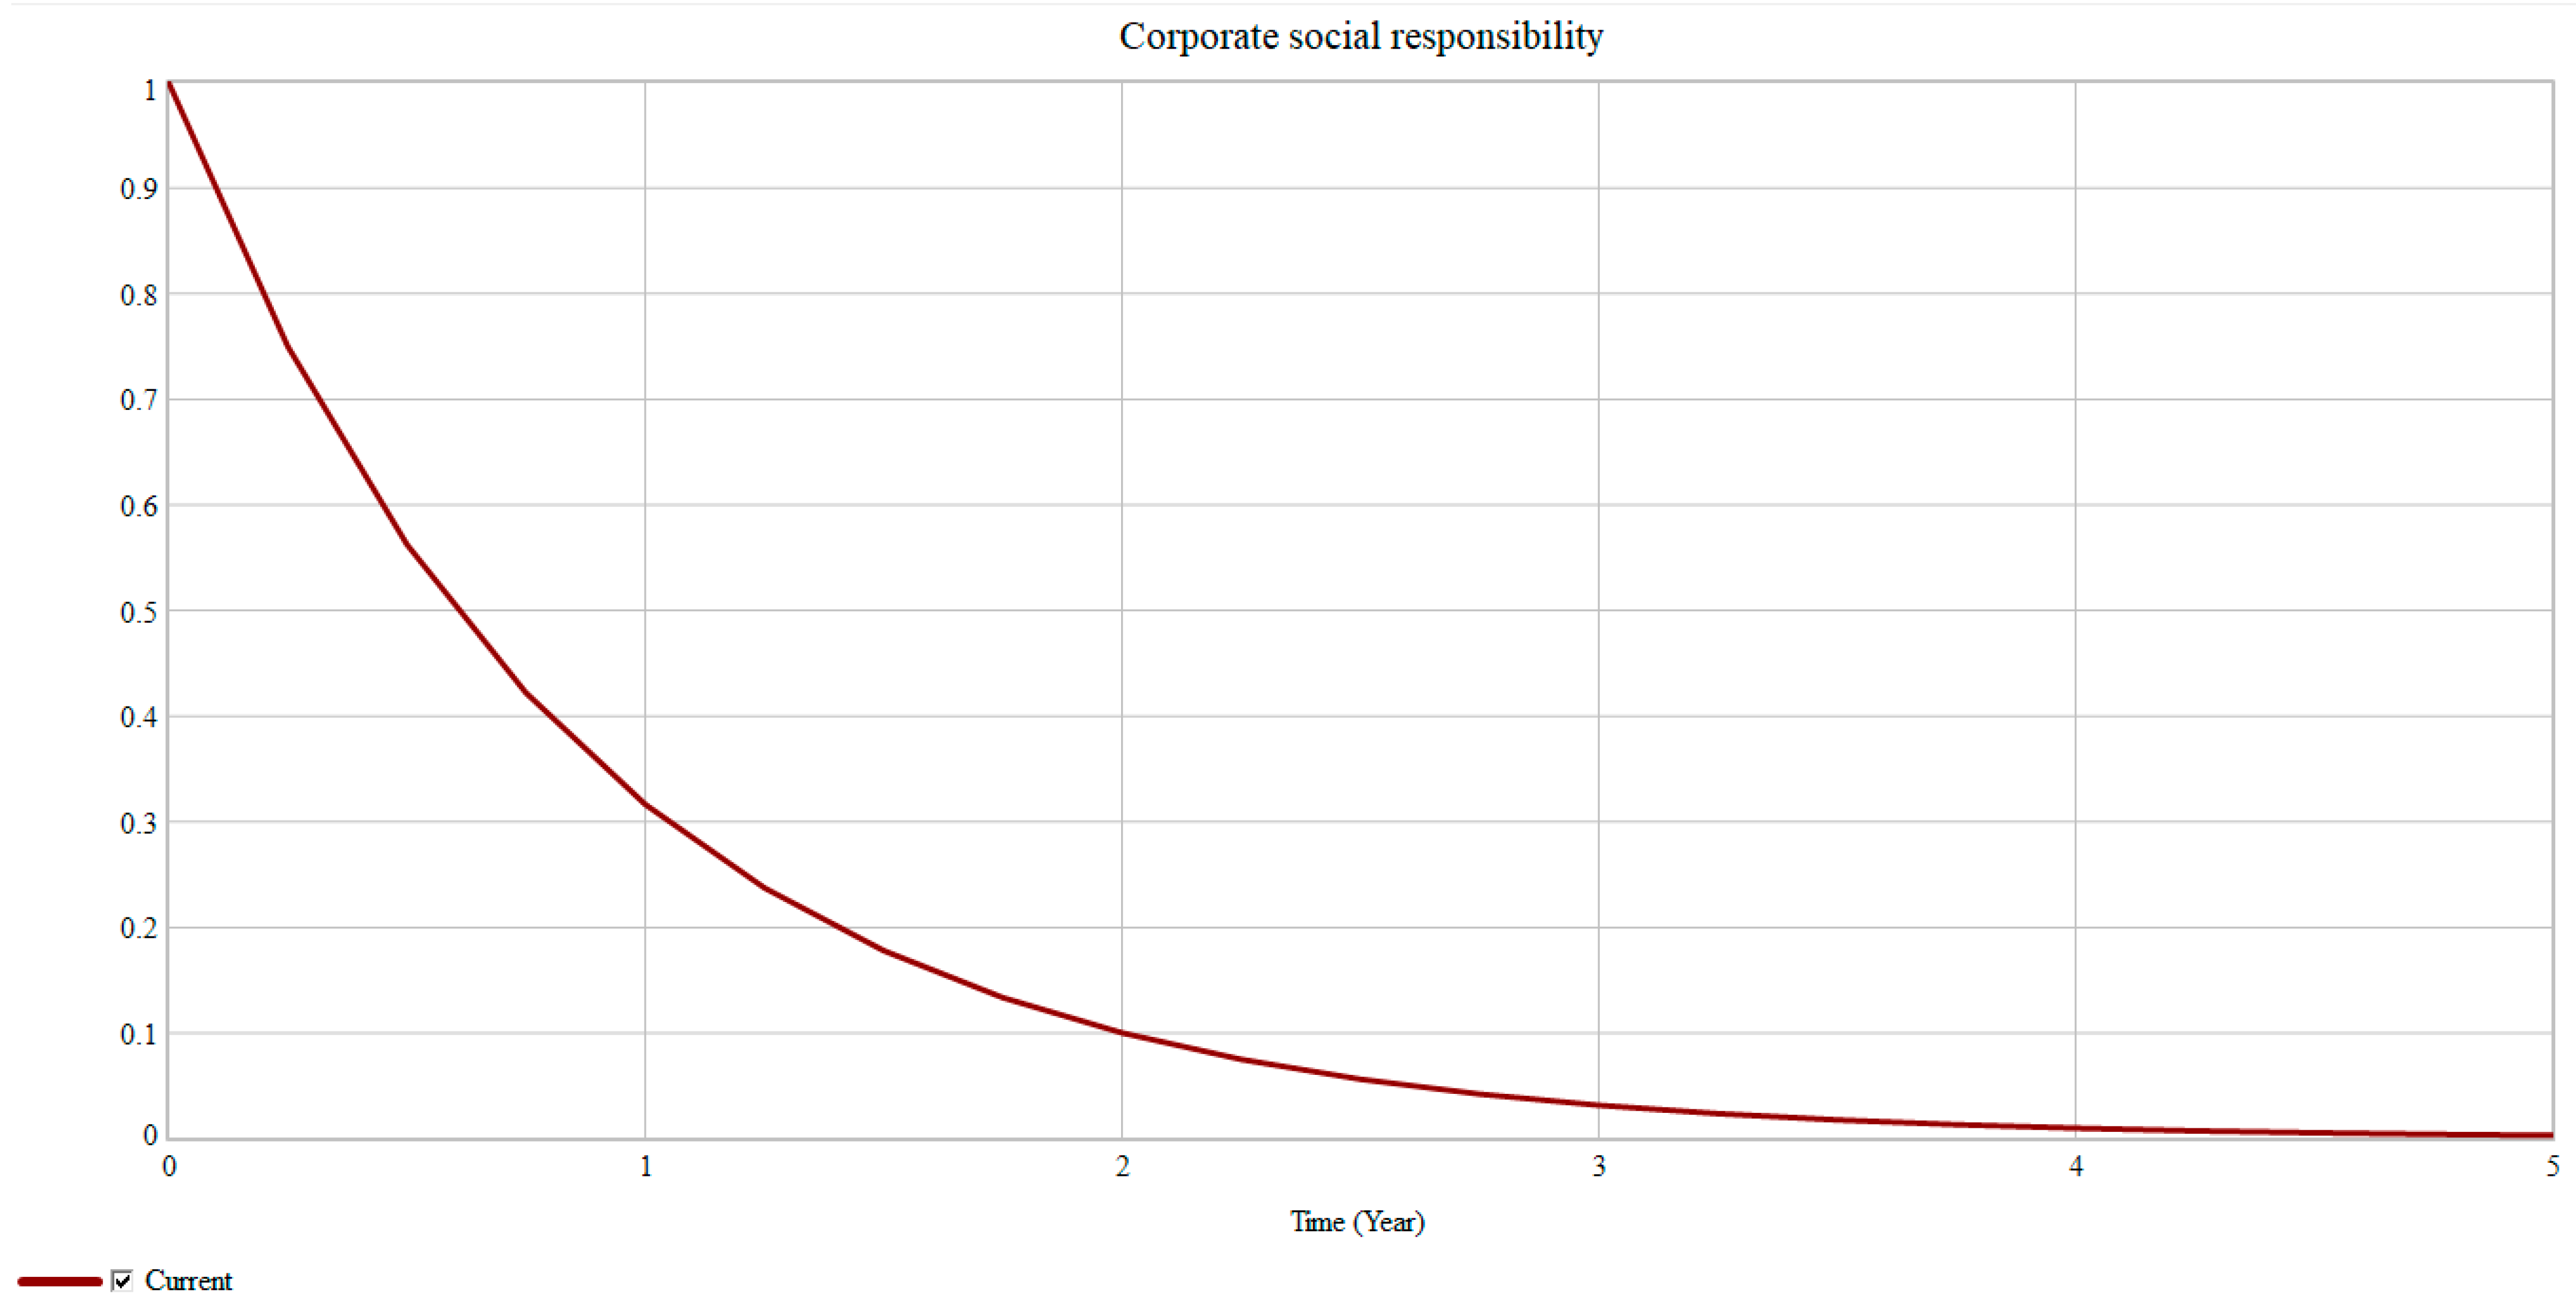
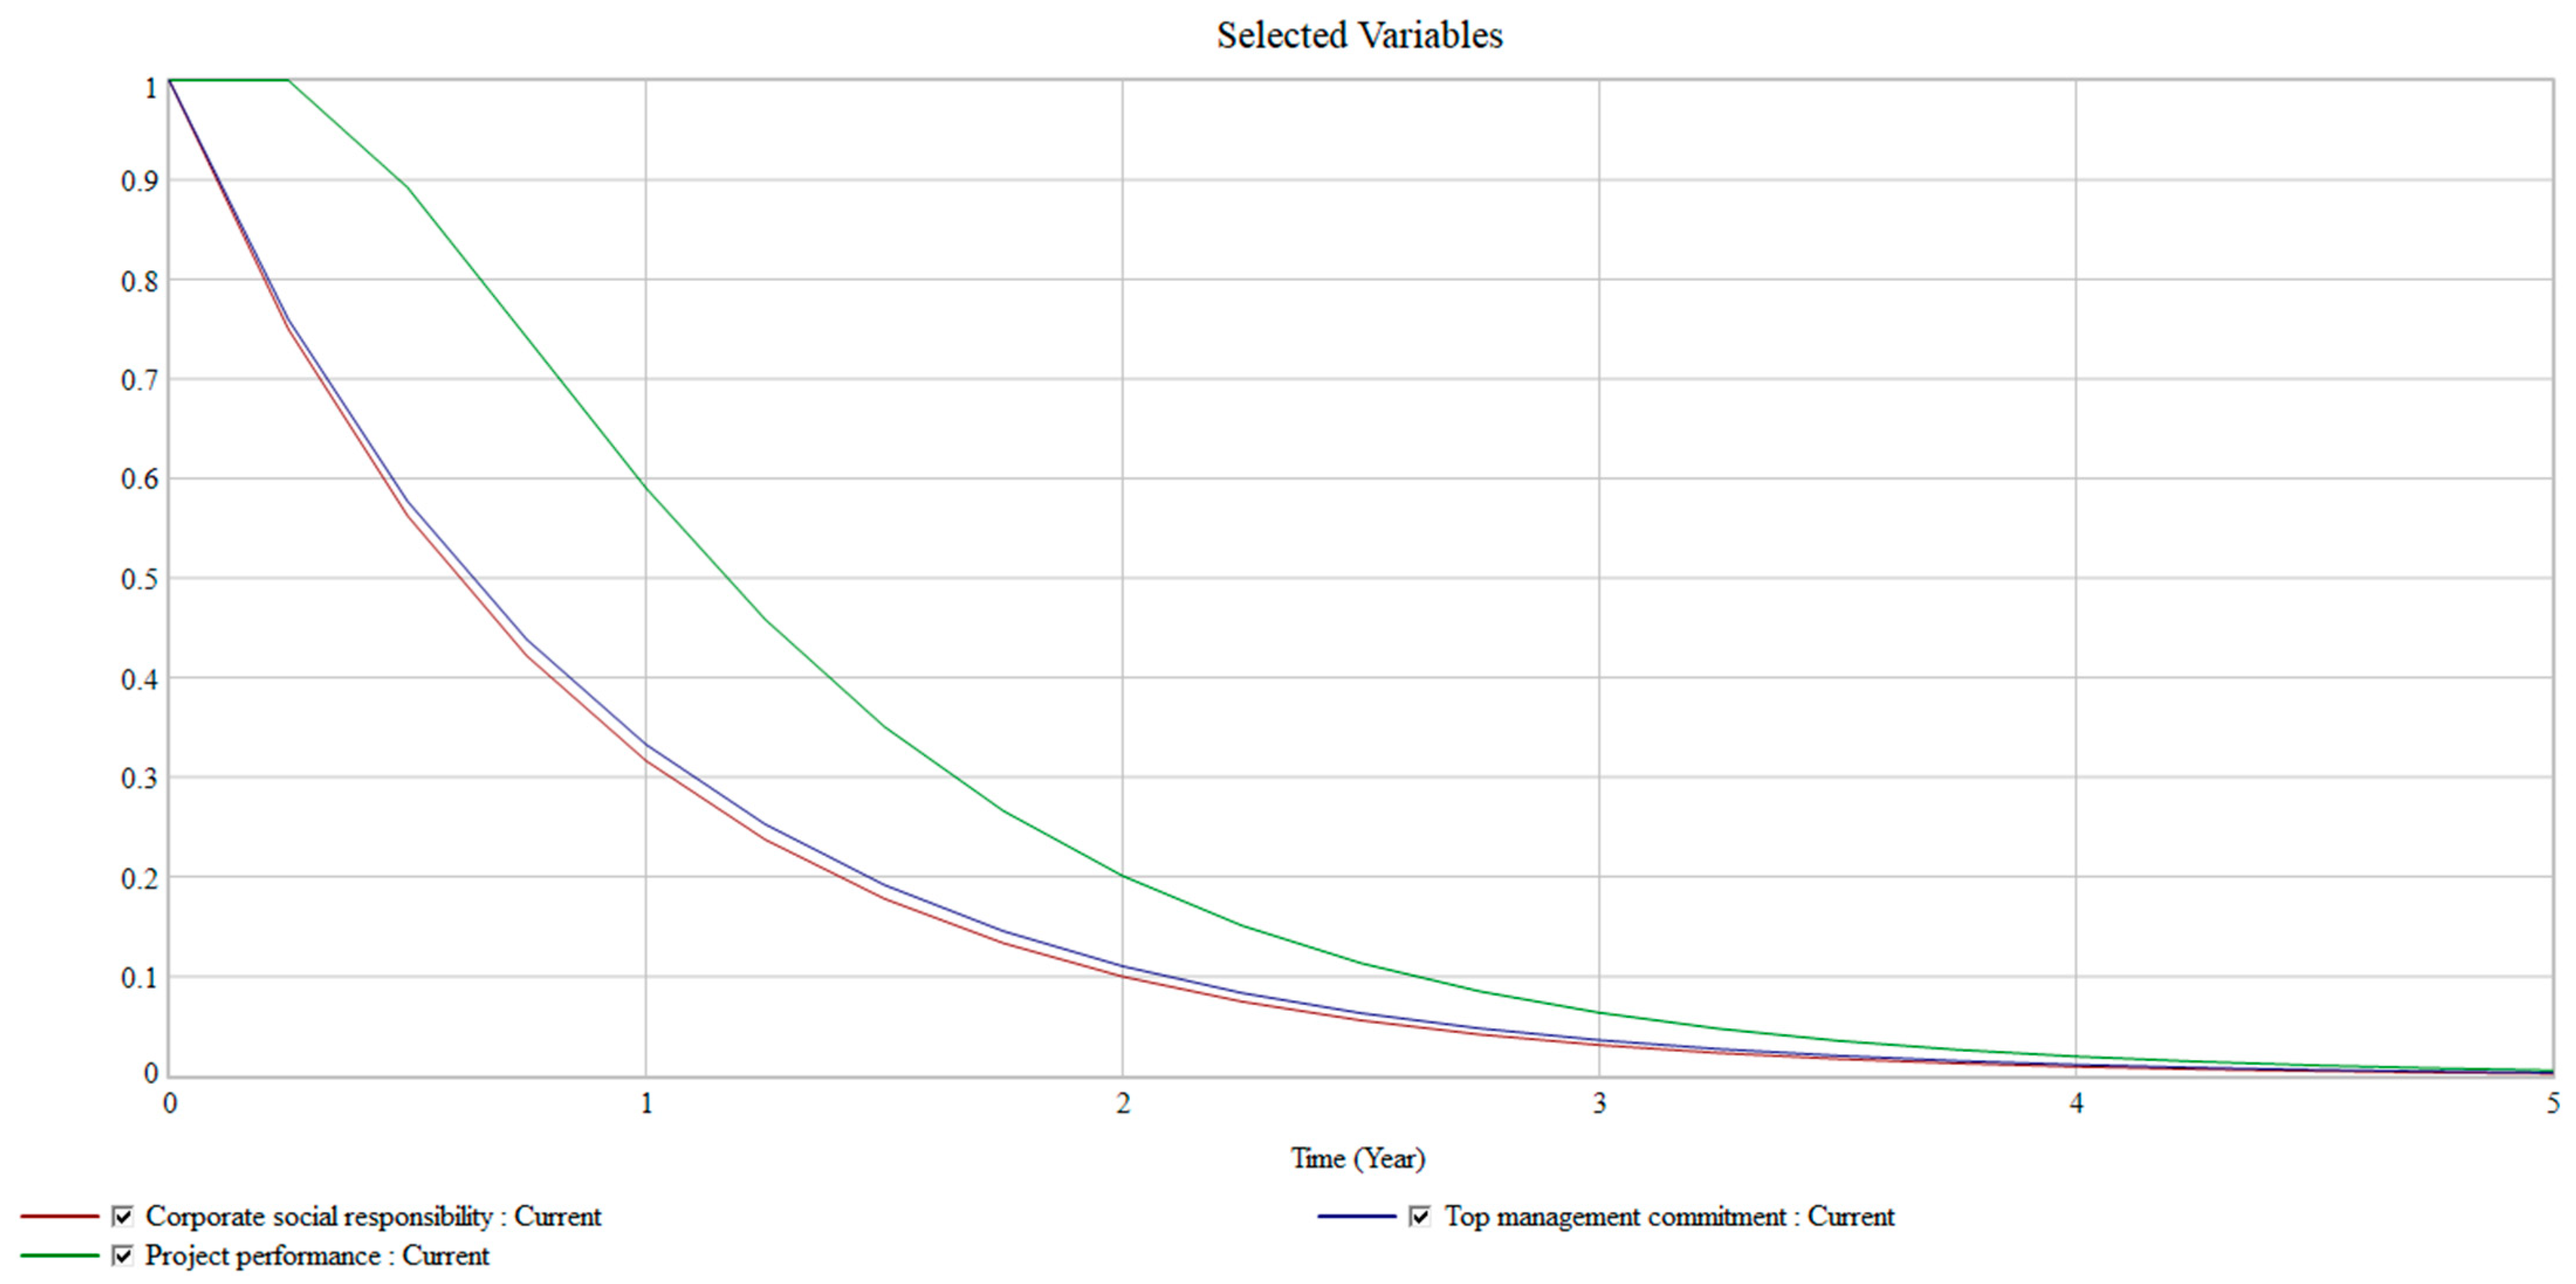
4.3. Simulation Results and Discussion
4.4. Model Validation
4.4.1. Boundary Adequacy Test
4.4.2. Structure Verification Test
4.4.3. Parametric Verification Test
5. Conclusions and Implications
5.1. Theoretical Contribution
5.2. Managerial Contribution
6. Limitations and Future Research
Author Contributions
Funding
Institutional Review Board Statement
Informed Consent Statement
Data Availability Statement
Acknowledgments
Conflicts of Interest
References
- Isa, R.B.; Jimoh, R.A.; Achuenu, E. An overview of the contribution of construction sector to sustainable development in Nigeria. Net J. Bus. Manag. 2013, 1, 1–6. [Google Scholar]
- Maqsoom, A.; Charoenngam, C.; Awais, M. Internationalization process of pakistani contractors: An exploratory study. In ICCREM 2013: Construction and Operation in the Context of Sustainability; American Society of Civil Engineer: Reston, VA, USA, 2013; pp. 59–72. [Google Scholar]
- Ullah, F.; Thaheem, M.J.; Siddiqui, S.Q.; Khurshid, M.B. Influence of six sigma on project success in construction industry of Pakistan. TQM J. 2017, 29, 276–309. [Google Scholar] [CrossRef]
- Sudusinghe, J.I.; Jayaratne, R.P.; Kumarage, A.S. UN SDGs Shaping Sustainable Supply Chains: The Case of Apparel Manufacturers in Developing Countries. In Proceedings of the 2018 IEEE International Conference on Service Operations and Logistics, and Informatics (SOLI), Singapore, 31 July–2 August 2018; pp. 102–107. [Google Scholar]
- Yeo, K.; Ning, J. Integrating supply chain and critical chain concepts in engineer-procure-construct (EPC) projects. Int. J. Proj. Manag. 2002, 20, 253–262. [Google Scholar] [CrossRef]
- Kerzner, H. Project Management: A Systems Approach to Planning, Scheduling, and Controlling, 12th ed.; John Wiley & Sons, Inc.: Hoboken, NJ, USA, 2017. [Google Scholar]
- Tan, K.C.; Lyman, S.B.; Wisner, J.D. Supply chain management: A strategic perspective. Int. J. Oper. Prod. Manag. 2002, 22, 614–631. [Google Scholar]
- Gimenez, C.; Sierra, V.; Rodon, J. Sustainable operations: Their impact on the triple bottom line. Int. J. Prod. Econ. 2012, 140, 149–159. [Google Scholar] [CrossRef]
- Albaloushi, H.; Skitmore, M. Supply chain management in the UAE construction industry. Int. J. Constr. Manag. 2008, 8, 53–71. [Google Scholar] [CrossRef]
- Galal, N.; Moneim, A.F.A. Developing sustainable supply chains in developing countries. Procedia CIRP 2016, 48, 419–424. [Google Scholar] [CrossRef] [Green Version]
- Koberg, E.; Longoni, A. A systematic review of sustainable supply chain management in global supply chains. J. Clean. Prod. 2019, 207, 1084–1098. [Google Scholar] [CrossRef]
- Gopalakrishnan, K.; Yusuf, Y.Y.; Musa, A.; Abubakar, T.; Ambursa, H.M. Sustainable supply chain management: A case study of British Aerospace (BAe) Systems. Int. J. Prod. Econ. 2012, 140, 193–203. [Google Scholar] [CrossRef]
- Govindan, K.; Kaliyan, K.M.; Kannan, D.; Haq, A. Barriers analysis for green supply chain management implementation in Indian industries using analytic hierarchy process. Int. J. Prod. Econ. 2014, 147, 555–568. [Google Scholar] [CrossRef]
- Christopher, M. Logistics & Supply Chain Management; Pearson: London, UK, 2016. [Google Scholar]
- De Angelis, R.; Howard, M.; Miemczyk, J. Supply chain management and the circular economy: Towards the circular supply chain. Prod. Plan. Control. 2018, 29, 425–437. [Google Scholar] [CrossRef] [Green Version]
- Naderpour, A.; Sardroud, J.M.; Mofid, M.; Xenidis, Y.; Pour Rostam, T. Uncertainty management in time estimation of construction projects: A systematic literature review and new model development. Sci. Iran. 2017, 26, 752–778. [Google Scholar] [CrossRef] [Green Version]
- Limsila, K.; Ogunlana, S.O. Performance and leadership outcome correlates of leadership styles and subordinate commitment. Eng. Constr. Arch. Manag. 2008, 15, 164–184. [Google Scholar] [CrossRef]
- Martens, M.L.; Carvalho, M.M. Key factors of sustainability in project management context: A survey exploring the project managers’ perspective. Int. J. Proj. Manag. 2017, 35, 1084–1102. [Google Scholar] [CrossRef]
- Hubbard, G. Measuring organizational performance: Beyond the triple bottom line. Bus. Strat. Environ. 2009, 18, 177–191. [Google Scholar] [CrossRef]
- Onat, N.C.; Kucukvar, M.; Tatari, O. Integrating triple bottom line input–output analysis into life cycle sustainability assessment framework: The case for US buildings. Int. J. Life Cycle Assess. 2014, 19, 1488–1505. [Google Scholar] [CrossRef]
- Ramaswamy, M. Leveraging information technology to create sustainable supply chains. Issues Inf. Syst. 2017, 18, 95–102. [Google Scholar]
- Redclift, M. Sustainable development (1987–2005): An oxymoron comes of age. Sustain. Dev. 2005, 13, 212–227. [Google Scholar] [CrossRef] [Green Version]
- Segerstedt, A.; Olofsson, T. Supply chains in the construction industry. Supply Chain Manag. Int. J. 2010, 15, 347–353. [Google Scholar] [CrossRef]
- Boström, M. A missing pillar? Challenges in theorizing and practicing social sustainability: Introduction to the special issue. Sustain. Sci. Pr. Policy 2012, 8, 3–14. [Google Scholar] [CrossRef] [Green Version]
- Al Zaabi, S.; Al Dhaheri, N.; Diabat, A. Analysis of interaction between the barriers for the implementation of sustainable supply chain management. Int. J. Adv. Manuf. Technol. 2013, 68, 895–905. [Google Scholar] [CrossRef]
- Dixit, S.; Mandal, S.N.; Sawhney, A.; Singh, S. Area of linkage between lean construction and sustainability in Indian construction industry. Int. J. Civ. Eng. Technol. 2017, 8, 623–636. [Google Scholar]
- Diabat, A.; Govindan, K. An analysis of the drivers affecting the implementation of green supply chain management. Resour. Conserv. Recycl. 2011, 55, 659–667. [Google Scholar] [CrossRef]
- Zuo, J.; Jin, X.-H.; Flynn, L. Social sustainability in construction—An explorative study. Int. J. Constr. Manag. 2012, 12, 51–63. [Google Scholar] [CrossRef]
- Rogers, S.H.; Gardner, K.H.; Carlson, C.H. Social Capital and Walkability as Social Aspects of Sustainability. Sustainability 2013, 5, 3473–3483. [Google Scholar] [CrossRef] [Green Version]
- Morais, D.O.; Silvestre, B.S. Advancing social sustainability in supply chain management: Lessons from multiple case studies in an emerging economy. J. Clean. Prod. 2018, 199, 222–235. [Google Scholar] [CrossRef]
- Qorri, A.; Mujkić, Z.; Kraslawski, A. A conceptual framework for measuring sustainability performance of supply chains. J. Clean. Prod. 2018, 189, 570–584. [Google Scholar] [CrossRef]
- Ahi, P.; Searcy, C. A comparative literature analysis of definitions for green and sustainable supply chain management. J. Clean. Prod. 2013, 52, 329–341. [Google Scholar] [CrossRef]
- Kulkarni, A.; Halder, S. A simulation-based decision-making framework for construction supply chain management (SCM). Asian J. Civ. Eng. 2019, 21, 229–241. [Google Scholar] [CrossRef]
- Bal, M.; Bryde, D.; Fearon, D.; Ochieng, E. Stakeholder engagement: Achieving sustainability in the construction sector. Sustainability 2013, 5, 695–710. [Google Scholar] [CrossRef] [Green Version]
- McBeath, B.; Nissen, L.; Goodluck, C.; Brennan, E.M. The intersection of disparity reduction and social sustainability. In Social Sustainability: A Multilevel Approach to Social Inclusion; Routledge: Oxfordshire, UK, 2013; p. 126. [Google Scholar]
- Wheeler, S.M. Planning for Sustainability: Creating Livable, Equitable and Ecological Communities; Routledge: Oxfordshire, UK, 2013. [Google Scholar]
- Seuring, S.; Müller, M. From a literature review to a conceptual framework for sustainable supply chain management. J. Clean. Prod. 2008, 16, 1699–1710. [Google Scholar] [CrossRef]
- Wang, Y.; Han, Q.; De Vries, B.; Zuo, J. How The Public Reacts To Social Impacts In Construction Projects? A Structural Equation Modeling Study. Int. J. Proj. Manag. 2016, 34, 1433–1448. [Google Scholar] [CrossRef]
- Bell, S.; Morse, S. Sustainability Indicators: Measuring the Immeasurable? Routledge: Oxfordshire, UK, 2012. [Google Scholar]
- Sapiri, H.; Hew, J.Z.; Ahmad, N.; Abidin, N.Z.; Hawari, N.N. Introduction to System Dynamic Modelling and Vensim Software; UUM Press: Kedah, Malaysia, 2017. [Google Scholar]
- Khan, K.I.A.; Flanagan, R.; Lu, S.-L. Managing information complexity using system dynamics on construction projects. Constr. Manag. Econ. 2016, 34, 192–204. [Google Scholar] [CrossRef]
- Melkonyan, A.; Krumme, K.; Gruchmann, T.; Spinler, S.; Schumacher, T.; Bleischwitz, R. Scenario and strategy planning for transformative supply chains within a sustainable economy. J. Clean. Prod. 2019, 231, 144–160. [Google Scholar] [CrossRef]
- Khan, S.A.R.; Yu, Z.; Golpîra, H.; Sharif, A.; Mardani, A. A state-of-the-art review and meta-analysis on sustainable supply chain management: Future research directions. J. Clean. Prod. 2020, 278, 123357. [Google Scholar] [CrossRef]
- Crompton, L. A Standardised Incorporated Partnering Model for the UK Construction Industry; University of Central Lancashire: Preston, UK, 2016. [Google Scholar]
- Papadopoulos, G.A.; Zamer, N.; Gayialis, S.P.; Tatsiopoulos, I.P. Supply Chain Improvement in Construction Industry. Univers. J. Manag. 2016, 4, 528–534. [Google Scholar] [CrossRef] [Green Version]
- Mentzer, J.T.; DeWitt, W.; Keebler, J.S.; Min, S.; Nix, N.W.; Smith, C.D.; Zacharia, Z.G. Defining supply chain management. J. Bus. Logist. 2001, 22, 1–25. [Google Scholar] [CrossRef]
- Stevenson, M.; Spring, M. Flexibility from a supply chain perspective: Definition and review. Int. J. Oper. Prod. Manag. 2007, 27, 685–713. [Google Scholar] [CrossRef]
- Abbasi, M.; Nilsson, F. Themes and challenges in making supply chains environmentally sustainable. Supply Chain Manag. Int. J. 2012, 17, 517–530. [Google Scholar] [CrossRef]
- Ashby, A.L.; Leat, M.; Smith, M. Making connections: A review of supply chain management and sustainability literature. Supply Chain Manag. Int. J. 2012, 17, 497–516. [Google Scholar] [CrossRef]
- Ballou, R.H. Business Logistics/Supply Chain Management; 5/E (With Cd); Pearson Education India: Noida, India, 2007. [Google Scholar]
- Jadhav, A.; Orr, S.; Malik, M. The role of supply chain orientation in achieving supply chain sustainability. Int. J. Prod. Econ. 2019, 217, 112–125. [Google Scholar] [CrossRef]
- Laeequddin, M.; Sahay, B.; Sahay, V.; Waheed, K.A. Measuring trust in supply chain partners’ relationships. Meas. Bus. Excel. 2010, 14, 53–69. [Google Scholar] [CrossRef]
- Kusi-Sarpong, S.; Gupta, H.; Sarkis, J. A supply chain sustainability innovation framework and evaluation methodology. Int. J. Prod. Res. 2019, 57, 1990–2008. [Google Scholar] [CrossRef] [Green Version]
- Saavedra, M.M.R.; Fontes, C.H.d.O.; Freires, F.G.M. Sustainable and renewable energy supply chain: A system dynamics overview. Renew. Sustain. Energy Rev. 2018, 82, 247–259. [Google Scholar] [CrossRef]
- Martins, C.; Pato, M. Supply chain sustainability: A tertiary literature review. J. Clean. Prod. 2019, 225, 995–1016. [Google Scholar] [CrossRef]
- Elmualim, A.; Shockley, D.; Valle, R.; Ludlow, G.; Shah, S. Barriers and commitment of facilities management profession to the sustainability agenda. Build. Environ. 2010, 45, 58–64. [Google Scholar] [CrossRef]
- Chan, A.P.C.; Darko, A.; Olanipekun, A.O.; Ameyaw, E.E. Critical barriers to green building technologies adoption in developing countries: The case of Ghana. J. Clean. Prod. 2018, 172, 1067–1079. [Google Scholar] [CrossRef]
- das Neves, J.G.; Duarte, A.P.; Simões, E.; Santos, M.J. Theoretical contributions towards rethinking corporate social responsibility. Manag. Res. J. Iberoam. Acad. Manag. 2014, 12, 288–307. [Google Scholar]
- Kaveh, A.; Vazirinia, Y. Optimization of Tower Crane Location and Material Quantity between Supply and Demand Points: A Comparative Study. Period. Polytech. Civ. Eng. 2018, 62, 732–745. [Google Scholar] [CrossRef] [Green Version]
- Lindgreen, A.; Swaen, V.; Maon, F.; Andersen, M.; Skjoett-Larsen, T. Corporate social responsibility in global supply chains. Supply Chain. Manag. Int. J. 2009, 161, 161–172. [Google Scholar]
- Saberi, S.; Kouhizadeh, M.; Sarkis, J.; Shen, L. Blockchain technology and its relationships to sustainable supply chain management. Int. J. Prod. Res. 2019, 57, 2117–2135. [Google Scholar] [CrossRef] [Green Version]
- Brandenburg, M.; Govindan, K.; Sarkis, J.; Seuring, S. Quantitative models for sustainable supply chain management: Developments and directions. Eur. J. Oper. Res. 2014, 233, 299–312. [Google Scholar] [CrossRef]
- Faisal, M.N. Sustainable supply chains: A study of interaction among the enablers. Bus. Process. Manag. J. 2010, 16, 508–529. [Google Scholar] [CrossRef]
- Adetunji, I.; Price, A.D.F.; Fleming, P. Achieving sustainability in the construction supply chain. In Proceedings of the Institution of Civil Engineers-Engineering Sustainability; Thomas Telford Ltd.: London, UK, 2008; Volume 161, pp. 161–172. [Google Scholar]
- Ageron, B.; Gunasekaran, A.; Spalanzani, A. Sustainable supply management: An empirical study. Int. J. Prod. Econ. 2012, 140, 168–182. [Google Scholar] [CrossRef]
- Jakhar, S.K.; Rathore, H.; Mangla, S.K. Is lean synergistic with sustainable supply chain? An empirical investigation from emerging economy. Resour. Conserv. Recycl. 2018, 139, 262–269. [Google Scholar] [CrossRef]
- Utting, P. Business Responsibility for Sustainable Development; Geneva 2000 Occasional Paper; UN Research Institute for Social Development Geneva: Geneva, Switzerland, 2000. [Google Scholar]
- Jamali, D.; Karam, C. Corporate Social Responsibility in Developing Countries as an Emerging Field of Study. Int. J. Manag. Rev. 2016, 20, 32–61. [Google Scholar] [CrossRef]
- Mani, V.; Gunasekaran, A.; Delgado, C. Supply chain social sustainability: Standard adoption practices in Portuguese manufacturing firms. Int. J. Prod. Econ. 2018, 198, 149–164. [Google Scholar] [CrossRef]
- Lehtonen, M. The environmental?—Social interface of sustainable development: Capabilities, social capital, institutions. Ecol. Econ. 2004, 49, 199–214. [Google Scholar] [CrossRef]
- Sedereviciute, K.; Valentini, C. Towards a More Holistic Stakeholder Analysis Approach. Mapping Known and Undiscovered Stakeholders from Social Media. Int. J. Strat. Commun. 2011, 5, 221–239. [Google Scholar] [CrossRef]
- Wong, J.K.W.; Chan, J.K.S.; Wadu, M.J. Facilitating effective green procurement in construction projects: An empirical study of the enablers. J. Clean. Prod. 2016, 135, 859–871. [Google Scholar] [CrossRef]
- Farooqui, R.; Ahmed, S.; Lodi, S. Assessment of pakistani construction industry–current performance and the way forward. J. Adv. Perform. Inf. Value 2008, 1, 51. [Google Scholar] [CrossRef]
- Hassini, E.; Surti, C.; Searcy, C. A literature review and a case study of sustainable supply chains with a focus on metrics. Int. J. Prod. Econ. 2012, 140, 69–82. [Google Scholar] [CrossRef]
- Weingaertner, C.; Moberg, A. Åsa Exploring Social Sustainability: Learning from Perspectives on Urban Development and Companies and Products. Sustain. Dev. 2014, 22, 122–133. [Google Scholar] [CrossRef] [Green Version]
- Thompson, B.P.; Bank, L.C. Use of system dynamics as a decision-making tool in building design and operation. Build. Environ. 2010, 45, 1006–1015. [Google Scholar] [CrossRef]
- Xu, Z.; Coors, V. Combining system dynamics model, GIS and 3D visualization in sustainability assessment of urban residential development. Build. Environ. 2012, 47, 272–287. [Google Scholar] [CrossRef]
- Rasul, N.; Malik, M.S.A.; Bakhtawar, B.; Thaheem, M.J. Risk assessment of fast-track projects: A systems-based approach. Int. J. Constr. Manag. 2021, 21, 1099–1114. [Google Scholar] [CrossRef]
- Walker, H.; Brammer, S. Sustainable procurement in the United Kingdom public sector. Supply Chain Manag. Int. J. 2009, 14, 128–137. [Google Scholar] [CrossRef] [Green Version]
- Ravi, V.; Shankar, R. Analysis of interactions among the barriers of reverse logistics. Technol. Forecast. Soc. Chang. 2005, 72, 1011–1029. [Google Scholar] [CrossRef]
- Akintoye, A.; McIntosh, G.; Fitzgerald, E. A survey of supply chain collaboration and management in the UK construction industry. Eur. J. Purch. Supply Manag. 2000, 6, 159–168. [Google Scholar] [CrossRef]
- Dainty, A.R.; Millett, S.J.; Briscoe, G.H. New perspectives on construction supply chain integration. Supply Chain Manag. Int. J. 2001, 6, 163–173. [Google Scholar] [CrossRef]
- Walker, H.; Di Sisto, L.; McBain, D. Drivers and barriers to environmental supply chain management practices: Lessons from the public and private sectors. J. Purch. Supply Manag. 2008, 14, 69–85. [Google Scholar] [CrossRef]
- Wognum, P.N.; Bremmers, H.; Trienekens, J.H.; van der Vorst, J.G.; Bloemhof, J. Systems for sustainability and transparency of food supply chains–current status and challenges. Adv. Eng. Informatics 2011, 25, 65–76. [Google Scholar] [CrossRef]
- de Brito, M.P.; Carbone, V.; Blanquart, C.M. Towards a sustainable fashion retail supply chain in Europe: Organisation and performance. Int. J. Prod. Econ. 2008, 114, 534–553. [Google Scholar] [CrossRef] [Green Version]
- Negi, M.; Ahuja, V.; Baruah, P. Sustainable supply chain management in indian construction industry. In Proceedings of the National Conference on Sustainable Supply Chain Management an Indian Perspective (CRIMM), West Bengal, India, 10 March 2017. [Google Scholar]
- Keating, B.; Quazi, A.; Kriz, A.; Coltman, T. In pursuit of a sustainable supply chain: Insights from Westpac Banking Corporation. Supply Chain Manag. Int. J. 2008, 13, 175–179. [Google Scholar] [CrossRef] [Green Version]
- Svensson, G. Aspects of sustainable supply chain management (SSCM): Conceptual framework and empirical example. Supply Chain Manag. Int. J. 2007, 12, 262–266. [Google Scholar] [CrossRef]
- Swee, S.K.; Sev, V.N.; Amer, Y. Challenges in implementing sustainable supply chain within a collaborative manufacturing network. In Proceedings of the 2010 8th International Conference on Supply Chain Management and Information, Hong Kong, China, 6–9 October 2010; IEEE: Piscataway, NJ, USA, 2010. [Google Scholar]
- Walker, H.; Jones, N. Sustainable supply chain management across the UK private sector. Supply Chain Manag. Int. J. 2012, 17, 15–28. [Google Scholar] [CrossRef]
- Ahmad, N.K.W.; De Brito, M.P.; Rezaei, J.; Tavasszy, L.A. An integrative framework for sustainable supply chain management practices in the oil and gas industry. J. Environ. Plan. Manag. 2016, 60, 577–601. [Google Scholar] [CrossRef] [Green Version]
- Giunipero, L.C.; Hooker, R.E.; Denslow, D. Purchasing and supply management sustainability: Drivers and barriers. J. Purch. Supply Manag. 2012, 18, 258–269. [Google Scholar] [CrossRef]
- Seuring, S.; Müller, M. Core issues in sustainable supply chain management—A Delphi study. Bus. Strategy Environ. 2008, 17, 455–466. [Google Scholar] [CrossRef]
- Beske, P. Dynamic capabilities and sustainable supply chain management. Int. J. Phys. Distrib. Logist. Manag. 2012, 42, 372–387. [Google Scholar] [CrossRef]
- Beske, P.; Seuring, S. Putting sustainability into supply chain management. Supply Chain Manag. Int. J. 2014, 19, 322–331. [Google Scholar] [CrossRef]
- Ojo, E.; Mbowa, C.; Akinlabi, E.T. Barriers in implementing green supply chain management in construction industry. In Proceedings of the 2014 International Conference on Industrial Engineering and Operations Management, Bali, India, 7–9 January 2014. [Google Scholar]
- Ahmad, Z.; Thaheem, M.J.; Maqsoom, A. Building information modeling as a risk transformer: An evolutionary insight into the project uncertainty. Autom. Constr. 2018, 92, 103–119. [Google Scholar] [CrossRef]
- Wang, Y.; Yin, W.; Zeng, J. Global Convergence of ADMM in Nonconvex Nonsmooth Optimization. J. Sci. Comput. 2019, 78, 29–63. [Google Scholar] [CrossRef] [Green Version]
- Nguyen, N.C.; Bosch, O.J.H. A Systems Thinking Approach to identify Leverage Points for Sustainability: A Case Study in the Cat Ba Biosphere Reserve, Vietnam. Syst. Res. Behav. Sci. 2013, 30, 104–115. [Google Scholar] [CrossRef] [Green Version]
- Loehlin, J.C.; Beaujean, A.A. Latent Variable Models: An Introduction to Factor, Path, and Structural Equation Analysis; Taylor & Francis: Oxford, UK, 2016. [Google Scholar]
- Sterman, J.D. Business Dynamics: Systems Thinking and Modeling for a Complex World; Massachusetts Institute of Technology: Cambridge, MA, USA, 2002. [Google Scholar]
- Sterman, J. Business Dynamics; Irwin/McGraw-Hill: New York, NY, USA, 2000. [Google Scholar]
- Richardson, G.P. Reflections on the foundations of system dynamics. Syst. Dyn. Rev. 2011, 27, 219–243. [Google Scholar] [CrossRef]
- Ullah, W.; Noor, S.; Tariq, A. The development of a basic framework for the sustainability of residential buildings in Pakistan. Sustain. Cities Soc. 2018, 40, 365–371. [Google Scholar] [CrossRef]
- Al-Kofahi, Z.G.; Mahdavian, A.; Oloufa, A. System dynamics modeling approach to quantify change orders impact on labor productivity 1: Principles and model development comparative study. Int. J. Constr. Manag. 2020, 1–12. [Google Scholar] [CrossRef]
- Richardson, G.P.; Pugh, L.A. Introduction to system dynamics modeling with DYNAMO. J. Oper. Res. Society 1997, 48, 1146. [Google Scholar] [CrossRef]
- Harrell, F.E., Jr. Regression Modeling Strategies: With Applications to Linear Models, Logistic and Ordinal Regression, and Survival Analysis; Springer: New York, NY, USA, 2015. [Google Scholar]
- Barlas, Y. Formal aspects of model validity and validation in system dynamics. Syst. Dyn. Rev. J. Syst. Dyn. Soc. 1996, 12, 183–210. [Google Scholar] [CrossRef]
- Qudrat-Ullah, H.; Seong, B.S. How to do structural validity of a system dynamics type simulation model: The case of an energy policy model. Energy Policy 2010, 38, 2216–2224. [Google Scholar] [CrossRef]
- Nylund, K.L.; Asparouhov, T.; Muthén, B.O. Deciding on the Number of Classes in Latent Class Analysis and Growth Mixture Modeling: A Monte Carlo Simulation Study. Struct. Equ. Model. A Multidiscip. J. 2007, 14, 535–569. [Google Scholar] [CrossRef]


| Sr.# | Challenges | Nature | Normalized Score | Rank | Source |
|---|---|---|---|---|---|
| 1 | Lack of top management commitment | Social | 0.071 | 2 | [56,63,79,80,81] |
| 2 | Lack of training and education | Social | 0.066 | 1 | [18,25,56,82,83] |
| 3 | Complexity to design, reuse, recycle product | Environmental | 0.051 | 59 | [12,13,25,27,84,85] |
| 4 | Financial constraints | Economic | 0.051 | 72 | [13,48,56,65,80,82,86] |
| 5 | Supply chain configuration | Social | 0.041 | 7 | [12,18,65,87,88,89] |
| 6 | Organizational culture | Social | 0.036 | 30 | [12,18,79,90,91] |
| 7 | Health and safety | Social | 0.031 | 44 | [10,18,69,79,85] |
| 8 | Lack of awareness | Social | 0.025 | 26 | [63,80,83,92,93] |
| 9 | Company policies | Social | 0.025 | 31 | [13,80,84,86,87] |
| 10 | Environmental performance | Environmental | 0.025 | 65 | [79,83,87,89,94] |
| 11 | Lack of trust | Social | 0.020 | 20 | [56,81,82,89] |
| 12 | Less involvement in environmental related programs and meetings | Environmental | 0.020 | 63 | [13,27,86,93] |
| 13 | High cost for waste disposal | Economic | 0.020 | 69 | [13,25,86,92] |
| 14 | Return on investment | Economic | 0.020 | 74 | [13,18,65,86] |
| 15 | Suppliers’ top management commitment | Social | 0.018 | 4 | [13,56,81,95] |
| 16 | Lack of resource (human) | Social | 0.018 | 11 | [13,83,86,92] |
| 17 | Lack of corporate social responsibility | Social | 0.015 | 18 | [13,86,93,96] |
| 18 | Child labor and forced labor | Social | 0.015 | 46 | [18,87,91] |
| 19 | Discrimination | Social | 0.015 | 47 | [87,91] |
| 20 | Human rights | Social | 0.015 | 51 | [18,79,91] |
| 21 | Stakeholder engagement | Social | 0.012 | 56 | [18,56,87,91,93] |
| 22 | Lack of awareness about reverse logistics | Social | 0.010 | 17 | [13,56,79,86] |
| 23 | Suppliers firm culture | Social | 0.010 | 5 | [65,83,84] |
| 24 | Inadequate performance measurement | Social | 0.010 | 24 | [56,92] |
| 25 | Vendor selection | Social | 0.010 | 29 | [93] |
| 26 | Lack of strategic planning | Social | 0.010 | 34 | [80,87] |
| 27 | Employment creation | Social | 0.010 | 54 | [10,91] |
| 28 | Gender inequality | Social | 0.010 | 55 | [10,87] |
| 29 | Green induced changes | Environmental | 0.010 | 60 | [27,65] |
| 30 | Product quality | Environmental | 0.010 | 61 | [80,94] |
| 31 | Lack of effective environmental measures | Environmental | 0.010 | 62 | [13,86] |
| 32 | Lack of government support to adopt environmental friendly policies | Environmental | 0.010 | 64 | [13,86] |
| 33 | Product price | Economic | 0.010 | 75 | [65,93] |
| 34 | Economic uncertainty | Economic | 0.010 | 7 | [48,92] |
| 35 | Cost of third part certification | Economic | 0.010 | 79 | [64,95] |
| 36 | Availability of funds | Economic | 0.010 | 81 | [48,63] |
| 37 | Suppliers firm size | Social | 0.009 | 6 | [65,90] |
| 38 | Lack of technical expertise | Social | 0.009 | 12 | [13,56,86] |
| 39 | Lack of customer awareness | Social | 0.009 | 14 | [13,86] |
| 40 | Disbelief about environmental benefits | Social | 0.009 | 16 | [13,96] |
| 41 | Philanthropy | Social | 0.009 | 45 | [18,79,91] |
| 42 | Labor practices | Social | 0.009 | 49 | [18,91,93] |
| 43 | Maintaining environmental suppliers | Social | 0.006 | 10 | [13,86] |
| 44 | Fear of failure | Social | 0.006 | 13 | [13,86] |
| 45 | Perception of out of responsibility zone | Social | 0.006 | 15 | [13,86] |
| 46 | Suppliers’ human skills | Social | 0.005 | 3 | [65] |
| 47 | Resistance to change | Social | 0.005 | 21 | [56] |
| 48 | Unwillingness to share risks and rewards | Social | 0.005 | 22 | [56] |
| 49 | Cross functional conflicts | Social | 0.005 | 23 | [56] |
| 50 | Employee involvement | Social | 0.005 | 28 | [90] |
| 51 | Resistance to change to reverse logistics | Social | 0.005 | 32 | [80] |
| 52 | Low commitment of partners | Social | 0.005 | 35 | [81] |
| 53 | Reliability of supply | Social | 0.005 | 39 | [81] |
| 54 | Poverty | Social | 0.005 | 43 | [91] |
| 55 | Wages | Social | 0.005 | 48 | [91] |
| 56 | Unethical practices | Social | 0.005 | 50 | [91] |
| 57 | Sustainable sourcing | Social | 0.005 | 52 | [91] |
| 58 | Local sourcing | Social | 0.005 | 53 | [91] |
| 59 | Collaboration with suppliers | Social | 0.005 | 57 | [27] |
| 60 | Collaboration with customers | Social | 0.005 | 58 | [27] |
| 61 | Usage of renewable materials | Environmental | 0.005 | 66 | [86] |
| 62 | Waste minimization | Environmental | 0.005 | 67 | [18] |
| 63 | Eco-efficiency | Environmental | 0.005 | 68 | [18] |
| 64 | Eco-friendly packaging cost | Economic | 0.005 | 70 | [25] |
| 65 | Cost of sustainability and economic conditions | Economic | 0.005 | 71 | [25] |
| 66 | Green investments | Economic | 0.005 | 73 | [65] |
| 67 | Non availability of bank loans | Economic | 0.005 | 76 | [92] |
| 68 | Distribution of cost benefits | Economic | 0.005 | 80 | [64] |
| 69 | Initial buyer and supplier investment | Economic | 0.005 | 82 | [92] |
| 70 | Lack of information sharing between construction firms and suppliers | Social | 0.004 | 19 | [13,27,86,96] |
| 71 | Poor supplier commitment | Social | 0.003 | 27 | [25,90] |
| 72 | Reluctance of the support of dealers, distributors, and retailers | Social | 0.003 | 33 | [80] |
| 73 | Closer links between demand and supply | Social | 0.003 | 37 | [81] |
| 74 | Problems in maintaining environmental suppliers | Social | 0.003 | 38 | [83] |
| 75 | Initial burden on suppliers | 0.003 | 40 | [92] | |
| 76 | Lack of legitimacy | Social | 0.003 | 41 | [90] |
| 77 | Supplier commitment | Social | 0.003 | 42 | [90] |
| 78 | Cost concern hinders | Economic | 0.003 | 78 | [83] |
| 79 | Focal firms’ previous sustainability experiences | Social | 0.001 | 8 | [65] |
| 80 | Suppliers’ location | Social | 0.001 | 9 | [65] |
| 81 | Suppliers lack resources | Social | 0.001 | 25 | [86,92] |
| 82 | Frequent meetings | Social | 0.001 | 36 | [81] |
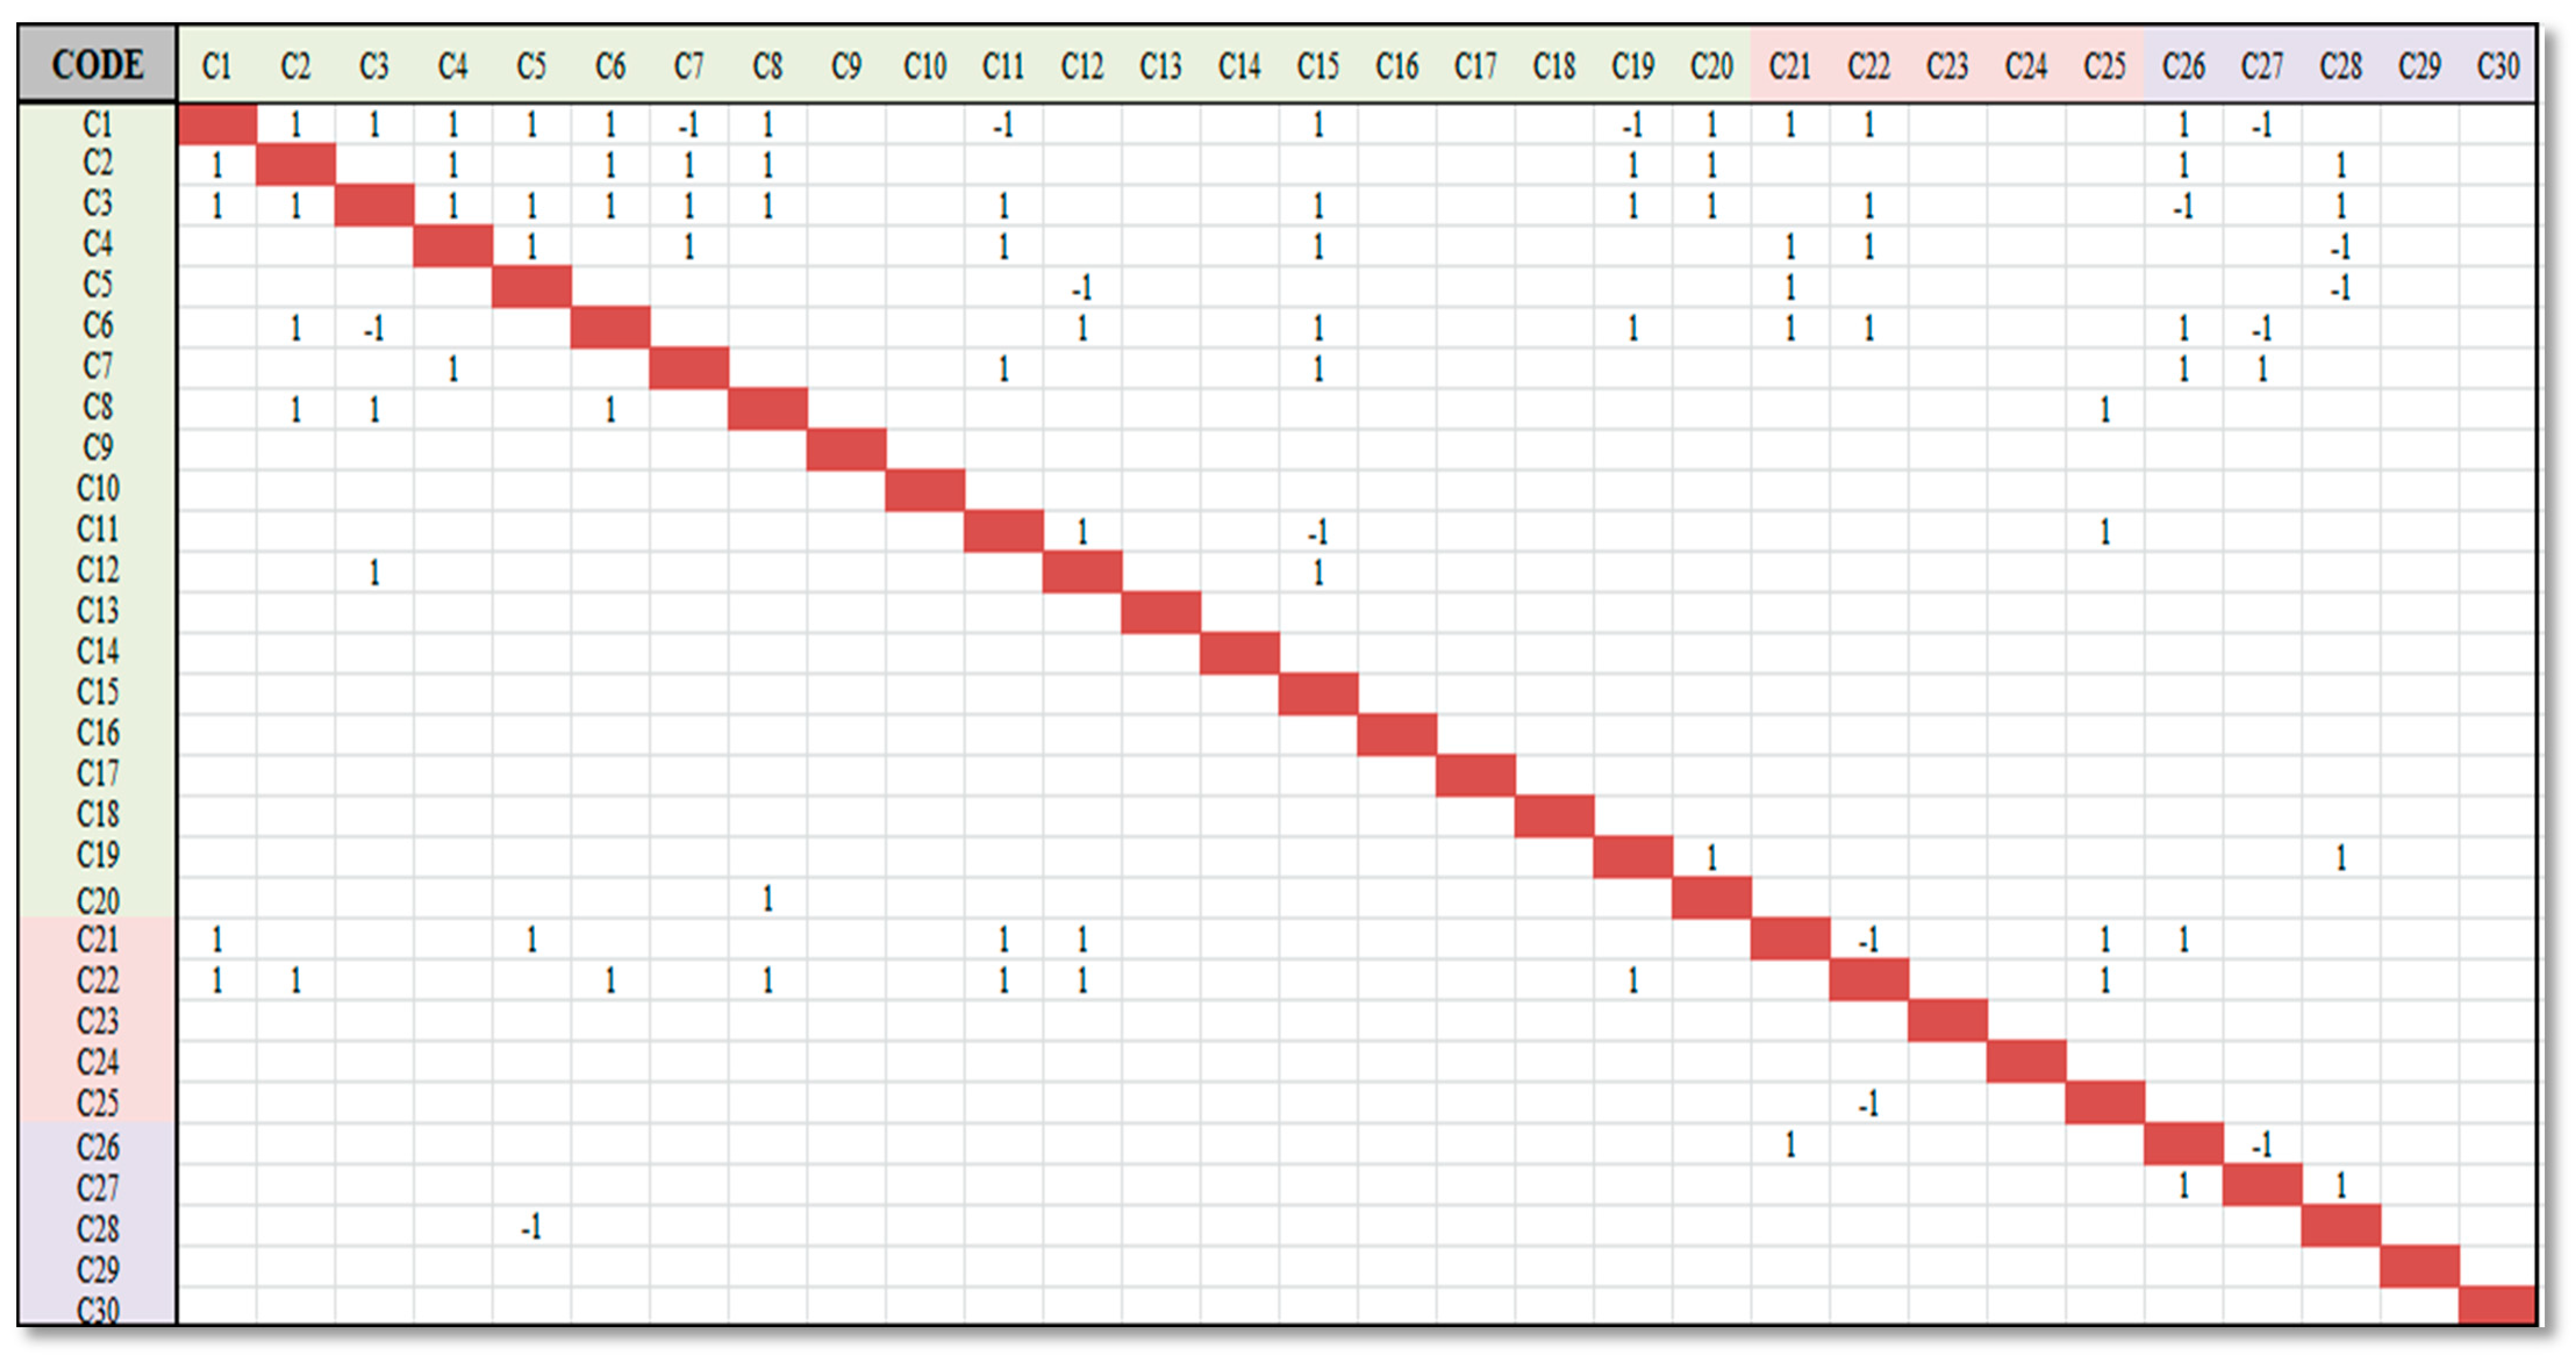
| Code | Challenges | 60 R/40 L | Cumulative Score | Rank | Nature of Challenge |
|---|---|---|---|---|---|
| C1 | Lack of top management commitment | 0.0346 | 0.0346 | 1 | Social |
| C2 | Lack of training and education | 0.0346 | 0.0692 | 2 | Social |
| C26 | Complexity to design, reuse, recycle product | 0.0285 | 0.0977 | 3 | Environmental |
| C21 | Financial constraints | 0.0285 | 0.1261 | 4 | Economical |
| C3 | Supply chain configuration | 0.0224 | 0.1485 | 5 | Social |
| C4 | Organizational culture | 0.0203 | 0.1688 | 6 | Social |
| C5 | Health and safety | 0.0183 | 0.1871 | 7 | Social |
| C6 | Lack of awareness | 0.0183 | 0.2054 | 8 | Social |
| C7 | Company policies | 0.0183 | 0.2237 | 9 | Social |
| C27 | Environmental performance | 0.0163 | 0.2400 | 10 | Environmental |
| C8 | Lack of trust | 0.0163 | 0.2562 | 11 | Social |
| C29 | Less involvement in environmental related programs and meetings | 0.0163 | 0.2725 | 12 | Social |
| C23 | High cost for waste disposal | 0.0163 | 0.2888 | 13 | Economical |
| C22 | Return on investment | 0.0163 | 0.3050 | 14 | Economical |
| C9 | Suppliers’ top management commitment | 0.0154 | 0.3204 | 15 | Social |
| C10 | Lack of resource (human) | 0.0154 | 0.3359 | 16 | Social |
| C11 | Lack of corporate social responsibility | 0.0142 | 0.3501 | 17 | Social |
| C12 | Child labor and forced labor | 0.0142 | 0.3643 | 18 | Social |
| C13 | Stakeholder engagement | 0.0142 | 0.3785 | 19 | Social |
| C30 | Product quality | 0.0142 | 0.3928 | 20 | Environmental |
| C14 | Lack of awareness about reverse logistics | 0.0130 | 0.4057 | 21 | Social |
| C15 | Discrimination | 0.0122 | 0.4179 | 22 | Social |
| C16 | Human rights | 0.0122 | 0.4301 | 23 | Social |
| C17 | Suppliers firm culture | 0.0122 | 0.4423 | 24 | Social |
| C20 | Inadequate performance measurement | 0.0122 | 0.4545 | 25 | Social |
| C19 | Lack of strategic planning | 0.0122 | 0.4667 | 26 | Social |
| C18 | Gender inequality | 0.0122 | 0.4789 | 27 | Social |
| C28 | Lack of government support to adopt environmental friendly policies | 0.0122 | 0.4910 | 28 | Environmental |
| C24 | Product price | 0.0122 | 0.5032 | 29 | Economical |
| C25 | Economic uncertainty | 0.0122 | 0.5154 | 30 | Economical |
| Profile | Frequency | Percentage |
|---|---|---|
| Job Title | ||
| CEO | 5 | 4% |
| Project Director | 6 | 5% |
| Project Manager | 12 | 10% |
| Construction Manager | 9 | 7% |
| Assistant Manager | 12 | 10% |
| Project manager | 22 | 18% |
| Planning Engineer | 15 | 12% |
| Site Manager | 4 | 3% |
| Architect/Designer | 6 | 5% |
| University Professor | 10 | 8% |
| Other | 24 | 19% |
| Years of Experience | ||
| 0–5 | 55 | 44% |
| 6–10 | 27 | 22% |
| 11–20 | 21 | 17% |
| >20 | 22 | 18% |
| Qualification | ||
| Diploma Holder | 7 | 6% |
| Graduate | 53 | 42% |
| Post-Graduate | 54 | 43% |
| PhD | 11 | 9% |
| Understanding of SSCM | ||
| No understanding at all | 5 | 4% |
| Slight | 24 | 19% |
| Moderate | 77 | 62% |
| Exceptional | 19 | 15% |
Publisher’s Note: MDPI stays neutral with regard to jurisdictional claims in published maps and institutional affiliations. |
© 2021 by the authors. Licensee MDPI, Basel, Switzerland. This article is an open access article distributed under the terms and conditions of the Creative Commons Attribution (CC BY) license (https://creativecommons.org/licenses/by/4.0/).
Share and Cite
Ghufran, M.; Khan, K.I.A.; Thaheem, M.J.; Nasir, A.R.; Ullah, F. Adoption of Sustainable Supply Chain Management for Performance Improvement in the Construction Industry: A System Dynamics Approach. Architecture 2021, 1, 161-182. https://doi.org/10.3390/architecture1020012
Ghufran M, Khan KIA, Thaheem MJ, Nasir AR, Ullah F. Adoption of Sustainable Supply Chain Management for Performance Improvement in the Construction Industry: A System Dynamics Approach. Architecture. 2021; 1(2):161-182. https://doi.org/10.3390/architecture1020012
Chicago/Turabian StyleGhufran, Maria, Khurram Iqbal Ahmad Khan, Muhammad Jamaluddin Thaheem, Abdur Rehman Nasir, and Fahim Ullah. 2021. "Adoption of Sustainable Supply Chain Management for Performance Improvement in the Construction Industry: A System Dynamics Approach" Architecture 1, no. 2: 161-182. https://doi.org/10.3390/architecture1020012
APA StyleGhufran, M., Khan, K. I. A., Thaheem, M. J., Nasir, A. R., & Ullah, F. (2021). Adoption of Sustainable Supply Chain Management for Performance Improvement in the Construction Industry: A System Dynamics Approach. Architecture, 1(2), 161-182. https://doi.org/10.3390/architecture1020012