Article

Cell-Free Mitochondrial DNA in Cell Culture Supernatant: Fragment Size Analysis and FBS Contamination Assessment

Department of Life, Health and Environmental Sciences, University of L’Aquila, 67100 L’Aquila, Italy
*
Author to whom correspondence should be addressed.
Submission received: 30 April 2025 / Revised: 1 August 2025 / Accepted: 20 August 2025 / Published: 27 August 2025

Abstract

Background/Objectives: Circulating cell-free DNA (cfDNA) consists of genomic DNA (cf-nDNA) and mitochondrial DNA (cf-mtDNA) fragments released from cells primarily through apoptosis and necrosis. In healthy individuals, the main source of cfDNA is apoptosis, whereas in cancer patients, necrosis predominates. Considering that in vitro cfDNA models are valuable research tools, this study presents an in vitro characterization of cf-mtDNA patterns released into the culture medium by four human cell lines: normal dermal fibroblasts (Hs27), induced pluripotent stem cells (iPSCs), melanoma cells (BMel), and prostate cancer cells (PC3). Furthermore, as fetal bovine serum (FBS)—a widely used supplement in cell culture media—has been shown to contain bovine cfDNA, species-specific primers were employed to eliminate potential artifacts arising from this contamination in in vitro experiments. Methods: Fragmentation analysis of cf-mtDNA was conducted by amplifying the human MT-CYB gene and the D-loop region in four cell lines using species-specific primers. Two indices, Q and λ, were employed to quantify fragmentation. Results: These indices reveal that cancer cells exhibit the highest degree of fragmentation compared to fibroblasts, whereas stem cells show the lowest degree of fragmentation. This study identified species-specific primers for the human and bovine MT-CYB gene, confirming the presence of bovine cf-mtDNA in cell culture media supplemented with FBS. Conclusions: in vitro cellular models are useful for studying the mechanisms of cfDNA release and fragmentation; designed primers provide a reliable tool for assessing contamination across different growth time points minimizing interference errors and non-specific amplifications.

Graphical Abstract

1. Introduction

Cells release fragments of DNA, known as circulating cell-free DNA (cfDNA), into body fluids under certain conditions. The study of cfDNA holds significant potential as a prognostic biomarker in liquid biopsy for clinical applications [1,2,3,4]. cfDNA is detectable in various body fluids, including blood, urine, cerebrospinal fluid, saliva, pleural effusions, and ascites [5,6,7].
Circulating cell-free DNA originates from cells via apoptosis, necrosis, and active secretion, comprising both genomic (cf-nDNA) and mitochondrial (cf-mtDNA) fragments. In healthy individuals, apoptosis is the primary source of cfDNA, whereas necrosis predominates in cancer patients [8].
The size of cfDNA fragments varies depending on pathological or physiological conditions, such as cancer, fetal or maternal state [9,10,11]. Analyzing cfDNA fragment size distributions has provided insights into the biological mechanisms of DNA release, enabling discrimination between tumor-derived and normal cell-derived cfDNA [12].
In healthy individuals, cf-nDNA is primarily derived from apoptosis and exhibits a non-random fragmentation pattern, with a predominant peak at 166 bp. This results from endogenous endonuclease-mediated cleavage of chromatin into internucleosomal fragments. In contrast, cf-nDNA in cancer patients originates largely from necrosis, which produces randomly sized fragments due to incomplete DNA digestion. Consequently, cfDNA size distribution patterns may serve as valuable diagnostic and prognostic biomarkers in oncology [13,14,15,16].
Mitochondrial DNA (mtDNA) is a circular, double-stranded molecule spanning 16.6 kb in mammals. It lacks nucleosomal organization but exhibits a high copy number and is primarily coated by mitochondrial transcription factor A (TFAM) [17,18]. The protein–DNA architecture of the mitochondrial genome suggests that cell-free mtDNA (cf-mtDNA) fragments non-randomly in healthy individuals. Moreover, fragmentation patterns may vary across physiological and pathological states due to altered protein–DNA interactions, highlighting their potential utility in cancer detection [19,20].
Numerous sensitive and specific techniques have been developed to assess the integrity of cfDNA, including quantitative PCR (qPCR), droplet digital PCR (ddPCR), capillary electrophoresis, and next-generation sequencing (NGS). Both digital PCR (dPCR) and qPCR are highly effective for detecting specific mutations or alterations in cfDNA [21,22,23,24,25].
In the scientific literature, numerous studies have analyzed cfDNA released by cell cultures into in vitro growth media [26,27,28,29,30,31,32,33]. These studies have provided valuable insights into cfDNA size characterization and release mechanisms, employing biomolecular techniques, including qPCR.
Cultured cell lines provide a valuable in vitro model for studying the origin, physical properties, release dynamics, and fragmentation profile of cfDNA, owing to the greater control they offer over experimental conditions [7,26,27,34,35,36,37,38,39,40].
Most cells cultured in vitro require growth media supplemented with 10% fetal bovine serum (FBS). Recent studies [30,41,42] highlight that adding FBS to growth media introduces bovine cfDNA, potentially creating artifacts and compromising experimental reproducibility and reliability. Consequently, evaluating bovine cfDNA contamination and its impact on data has become a critical priority. We, therefore, investigated the presence of bovine cf-mtDNA contamination resulting from the addition of FBS to culture media. To verify and quantify the contribution of Bos taurus (bovine) cfDNA derived from FBS, we employed a targeted approach using species-specific primers for the bovine cytochrome B gene (MT-CYB). This strategy was designed to eliminate artifacts arising from the non-specificity of the analytical methods employed.
In this study, we focused on analyzing cf-mtDNA due to its significant contribution to total cfDNA content. cf-mtDNA is present in high copy numbers, enhancing the sensitivity of detection techniques for monitoring tumor burden. Additionally, its fragmentation profile, determined by protein binding, differs between normal and tumor cells [43,44,45,46,47,48,49,50,51,52].
Given the continued utility and promise of in vitro cellular models for elucidating the origin and fragmentation processes of cfDNA under diverse experimental conditions, we investigated the release of cf-mtDNA in four cell lines: Hs27: Normal human dermal fibroblasts (ATCC® CRL-1634™, American Type Culture Collection, Manassas, VA, USA); PC3: Human prostate adenocarcinoma cells (ATCC® CRL-1435™, American Type Culture Collection); BMel: Human melanoma cells (kindly provided by Prof. P.G. Natali, Regina Elena National Cancer Institute, Rome, Italy); iPSCs: Human induced pluripotent stem cells (SCTi003-A, STEMCELL Technologies, Vancouver, BC, Canada) [12,26,28,29,35].
We quantified the concentration (quantity) and quality of cf-mtDNA by qPCR using specific primers and standard curves [53]. To assess cf-mtDNA fragmentation patterns in normal, tumor, and stem cell lines at different growth stages, we amplified two regions of the human mitochondrial genome (NC_012920.1): the mitochondrially encoded cytochrome b gene (MT-CYB) and the D-loop region. Fragmentation was quantified using an integrity index (Q) and a coefficient (λ) [54]. While cfDNA is best characterized in humans, it has also been detected in other mammals, including pigs and bovines [55].

2. Materials and Methods

2.1. Cell Lines and Culture Conditions

Four cell lines were selected for this study:
Hs27: Normal human dermal fibroblasts (ATCC® CRL-1634™, American Type Culture Collection, Manassas, VA, USA);
PC3: Human prostate adenocarcinoma cells (ATCC® CRL-1435™, American Type Culture Collection);
BMel: Human melanoma cells (kindly provided by Prof. P.G. Natali, Regina Elena National Cancer Institute, Rome, Italy);
iPSCs: Human induced pluripotent stem cells (SCTi003-A, STEMCELL Technologies, Vancouver, BC, Canada).
All cell lines, except iPSCs, were cultured in Dulbecco’s Modified Eagle Medium (DMEM) supplemented with 10% FBS, 2 mM L-glutamine, 100 IU/mL penicillin, and 100 μg/mL streptomycin (all reagents from EuroClone, Milan, Italy). iPSCs were maintained in mTeSR™ Plus medium (STEMCELL Technologies, #05825).
Cells were incubated at 37 °C in a humidified 5% CO2 atmosphere, with medium replacement every 3 days until ~90% confluence was reached. For experiments, cells were detached and seeded at optimal densities to ensure exponential growth. After 12 h of incubation, the medium was refreshed, and after 4, 8, 24, and 48 h of cell growth, the media of the various cell lines were collected. Samples were centrifuged sequentially at 335× g for 3 min and 3500× g for 10 min to remove cellular debris. The supernatant (cell-free native sample) was aliquoted and stored at −80 °C until analysis.
All cell culture reagents and consumables were obtained from Euroclone (Milan, Italy) and STEMCELL Technologies (Vancouver, BC, Canada).

2.2. DNA Extraction

cfDNA was extracted from the culture media of all cell lines at different time points using the PureLink™ Rapid Extraction Kit (Invitrogen), following the manufacturer’s protocol. For each condition, three biological replicates were processed. Purified cfDNA samples were stored at −20 °C until further analysis. cfDNA concentration under all extraction conditions was quantified using a Qubit® 4.0 fluorimeter (Thermo Fisher Scientific, Waltham, MA, USA).
To determine the optimal extraction conditions for maximizing cfDNA yield, 2 mL of native sample from each condition at 24 h of growth was freeze-dried at −40 °C using an SJIA-18N laboratory freeze-dryer (Ningbo SJIA Instrument Co., Ltd., Ningbo, China). The freeze-dried product was then resuspended in 400 µL of ultrapure water (hereafter referred to as “freeze-dried sample”).
For each condition, both native (2 mL) and freeze-dried (400 µL) samples were either treated or untreated with 200 µg/mL Proteinase K (Norgen) and incubated for 20 min at 37 °C prior to cfDNA purification.

2.3. Primers

The primers for qPCR and PCR were either obtained from the literature or designed using Primer Express 3.0 software (Applied Biosystems, Foster City, CA, USA) (Table 1).
To assess cfDNA fragmentation, two primer pairs were designed targeting the human mitochondrial genome (NC_012920.1), generating amplicons of 1091 bp (MT-CYB gene; positions 14715–15805; primers FORW_CYB_1091/REV_CYB_1091) and 807 bp (spanning the D-loop region and 12S rRNA gene; positions 249–1055; primers FORW_HVR_807/REV_HVR_807).
On the sequence of amplicon 1091, a forward primer and several reverse primers were constructed (FORW_CYB, REV_CYB_110, REV_CYB_206, REV_CYB_251, REV_CYB_325); with these primer pairs, 4 amplicons of different lengths on the MT-CYB gene were obtained (110, 206, 251, and 325 bp). On the sequence of amplicon 807, a forward primer and several reverse primers were constructed (FORW_D-loop, REV_D-loop_73, REV_D-loop_151, REV_D-loop_250, REV_D-loop_392); with these primer pairs, 4 amplicons of different lengths on the D-loop region were obtained (73, 151, 250, and 392 bp) (Table 1) [56,57].
Evaluation of bovine serum contamination was performed using a primer pair specific to the Bos taurus MT-CYB gene. Primers (FORW_CYB_Bovine, REV_CYB_Bovine) were designed based on the Bos taurus genome (NCBI ARS-UCD2.0 assembly and The Bovine Genome Database [58,59]), yielding a 99-bp amplicon (Table 1).
A primer pair (FORW_18SrRNA, REV_18SrRNA_61) targeting the human nuclear 18S ribosomal RNA (18SrRNA) gene (GRCh38.p14 NCBI RefSeq assembly GCF_000001405.40) was used, generating a 61-bp amplicon. These primers also amplify the homologous 18SrRNA gene in the Bos taurus genome (NCBI ARS-UCD2.0 assembly and The Bovine Genome Database. (Table 1).
An internal positive control (IPC) was included to monitor cfDNA recovery efficiency and potential PCR inhibitors. Primers FORW_IPC and REV_IPC amplified a 65-bp fragment from the OLIGO_IPC template (Table 1) [60].

2.4. qPCR and PCR Assays

Quantitative PCR (qPCR) was performed using an ABI 7300 Real-Time PCR System (Applied Biosystems) in 96-well plates with SYBR Green chemistry. The reaction mixture and amplification conditions followed previously described protocols [61].
All analyzed samples exhibited specific single-peak melting curves, PCR efficiency > 90%, high-quality standard curves (R2 ≈ 1), and precise quantification values.
The specificity of the reaction was confirmed by a single peak in the thermal denaturation profile, a single band in electrophoretic analysis of reaction products, and the absence of non-specific amplification. Negative controls (no-template controls, NTCs) were included in each amplification run. To assess cfDNA recovery efficiency and potential PCR inhibition, an internal positive control (IPC), a 65-bp synthetic oligonucleotide (250,000 copies/mL), was spiked into all samples (supernatant, lyophilized, or proteinase K-treated) prior to extraction. The IPC was quantified using qPCR with specific primers (FORW_IPC/Reverse_IPC) [60]. A standard curve (1:10 serial dilutions, 1,000,000–100 copies/µL) was used for absolute quantification.
A dedicated IPC control sample underwent the same extraction and elution procedures as the cfDNA samples. The recovery percentage and potential inhibition were calculated based on the IPC copy number post-extraction.
For conventional PCR, amplifications were carried out in a Hybaid PCR Express ThermoCycler using KAPA2G Fast HotStart ReadyMix 2X (Kbiosystems, Basildon, UK).

2.5. DNA Quantification and Primer Efficiency

cfDNA quantification was performed using a Qubit® 4.0 Fluorometer (Thermo Fisher Scientific) with the Qubit™ dsDNA HS Assay Kit (cat. no. Q32851), following the manufacturer’s protocol. Additionally, extracted cfDNA was quantified via qPCR by amplifying the human MT-CYB gene (primers FORW_CYB and REV_CYB_110; 110 bp amplicon), the bovine MT-CYB gene (primers FORW_CYB_Bovine and REV_CYB_Bovine; 99 bp amplicon), and the multicopy 18SrRNA gene (primers FORW_18SrRNA and REV_18SrRNA_61; 61 bp amplicon, conserved in human and bovine genomes) (Table 1).
Standard curves, generated using the same primer sets, enabled conversion of Ct values to cfDNA concentration (ng/mL of culture medium).
Jurkat DNA (Thermo Fisher Scientific, Waltham, MA, USA; Cat. No. SD1111) and calf thymus DNA (Sigma-Aldrich, St. Louis, MO, USA) at a concentration of 100 ng/μL were sonicated and used to generate standard curves in qPCR. Sonication conditions were optimized to produce DNA fragments with an average size of 196 bp, mimicking circulating cfDNA [54]. Serial 1:10 dilutions (100,000 pg/µL to 10 pg/µL) of the sonicated standard were used for qPCR (Figure S1).
The curves plot the Ct values on the ordinate (y-axis) against the logarithm of the concentration (expressed in pg/µL) on the abscissa (x-axis). The resulting linear regressions exhibit correlation coefficients (R2) of ≥0.99.
Absolute quantification of fragments (copies/µL) was performed using standard curves generated from purified PCR products. Jurkat standard DNA (Thermo Scientific, SD1111; Waltham, MA, USA) served as the template for amplifying two regions of the human mitochondrial genome (NC_012920.1): a 1091-bp amplicon spanning the MT-CYB gene (positions 14715–15805; primers: FORW_CYB_1091, REV_CYB_1091), an 807- bp amplicon, spanning the sequence between the D-loop region and the 12S rRNA gene (positions 249–1055; primers: FORW_HVR_807, REV_HVR_807).
PCR products were verified by electrophoresis, purified using NucleoSpin® Extract II Kits (MACHEREY-NAGEL, Düren, NRW, Germany), and quantified via Qubit fluorometry (Thermo Fisher Scientific). Copy numbers/µL were calculated using the Thermo Fisher online platform.
qPCR standard curves were constructed using serial 1:10 dilutions (10,000,000 to 100 copies/µL) of the amplicons. Primer pairs targeting MT-CYB (FORW_CYB; REV_CYB_110; REV_CYB_206; REV_CYB_251; REV_CYB_325) and the D-loop (FORW_D-loop; REV_D-loop_73; REV_D-loop_151; REV_D-loop_250; REV_D-loop_392) generated fragments of 110, 206, 251, 325, and 350 bp and 73, 151, 250, and 392 bp, respectively.
The standard curves displayed Ct values (y-axis) plotted against the logarithm of the template concentration (x-axis, copies/µL). All calibration curves exhibited a correlation coefficient (R2) ≥ 0.99.
Amplification efficiencies ranged between 95% and 103%, confirming the validity of the qPCR system for accurate quantification.

2.6. Evaluation of cf-mtDNA Fragmentation

cf-mtDNA was amplified using primers listed in Table 1, generating amplicons of increasing length spanning the MT-CYB gene and the D-loop region. The concentrations of the amplified fragments (amplicons) in different cf-mtDNA samples, expressed as copies/μL, were quantified using standard curves. DNA fragmentation was assessed by calculating two distinct indices: λ and Q.
The amount of available template decreases exponentially with increasing fragment size. Plotting the logarithm of the copy number against fragment size yields a straight line upon linear interpolation. The slope (λ) of this line represents the rate of decline in the amplification, as described by the following equation:
L o g A X     = L o g N   λ x
where AX is the copy number corresponding to the size of each fragment (x); N is the maximum number of amplifiable fragments, and λ is the slope of the linear regression [62].
The degree of fragmentation in a cf-mtDNA sample can be quantified by calculating the ratio (Q) of the DNA amplified using larger amplicons (x) to that amplified with the smallest amplicons (101 bp for the MT-CYB gene and 73 bp for the D-loop region).
Q = n °   c o p i e s   o f   a m p l i c o n   x / n °   c o p i e s   o f   s m o l l e r   a m p l i c o n
The value of Q ranges between 0 and 1. It equals 1 when the template DNA is intact and decreases below 1 in the case of fragmentation [63].

2.7. Statistics

Statistical analyses were conducted using PAST (Paleontological Statistics, Version 3.0) and Microsoft Excel. Data are presented as mean ± standard deviation (SD). Comparisons between means were performed using Student’s t-test, with statistical significance set at p < 0.05.
For all experiments, cfDNA was isolated from three independent biological replicates, and each analysis was performed in three technical replicates.

3. Results

3.1. Optimization of cfDNA Extraction

To optimize cfDNA extraction, culture media from all cell lines at 24 h of growth were processed as described in Section 2. cfDNA was extracted from both native and lyophilized media, either treated or untreated with proteinase K, and quantified using the Qubit® 4.0 Fluorometer (Thermo Fisher Scientific).
Figure 1A demonstrates that lyophilization significantly reduced cfDNA yield, whereas the highest recovery was achieved in native samples treated with proteinase K.
To assess extraction efficiency and potential PCR inhibition, a synthetic oligonucleotide (IPC) was spiked into the culture media collected at 24 h of growth from all cell lines, as detailed in Section 2.
As shown in Figure 1B, native samples with or without proteinase K treatment exhibited a recovery rate of approximately 75%, comparable to the control. This confirms the absence of qPCR inhibitors in proteinase K-treated native samples.
Based on these findings, all media collected from all cell lines at all growth times were treated with proteinase K and used for cfDNA extraction.

3.2. Quantification of cfDNA and Assessment of Bovine DNA Contamination

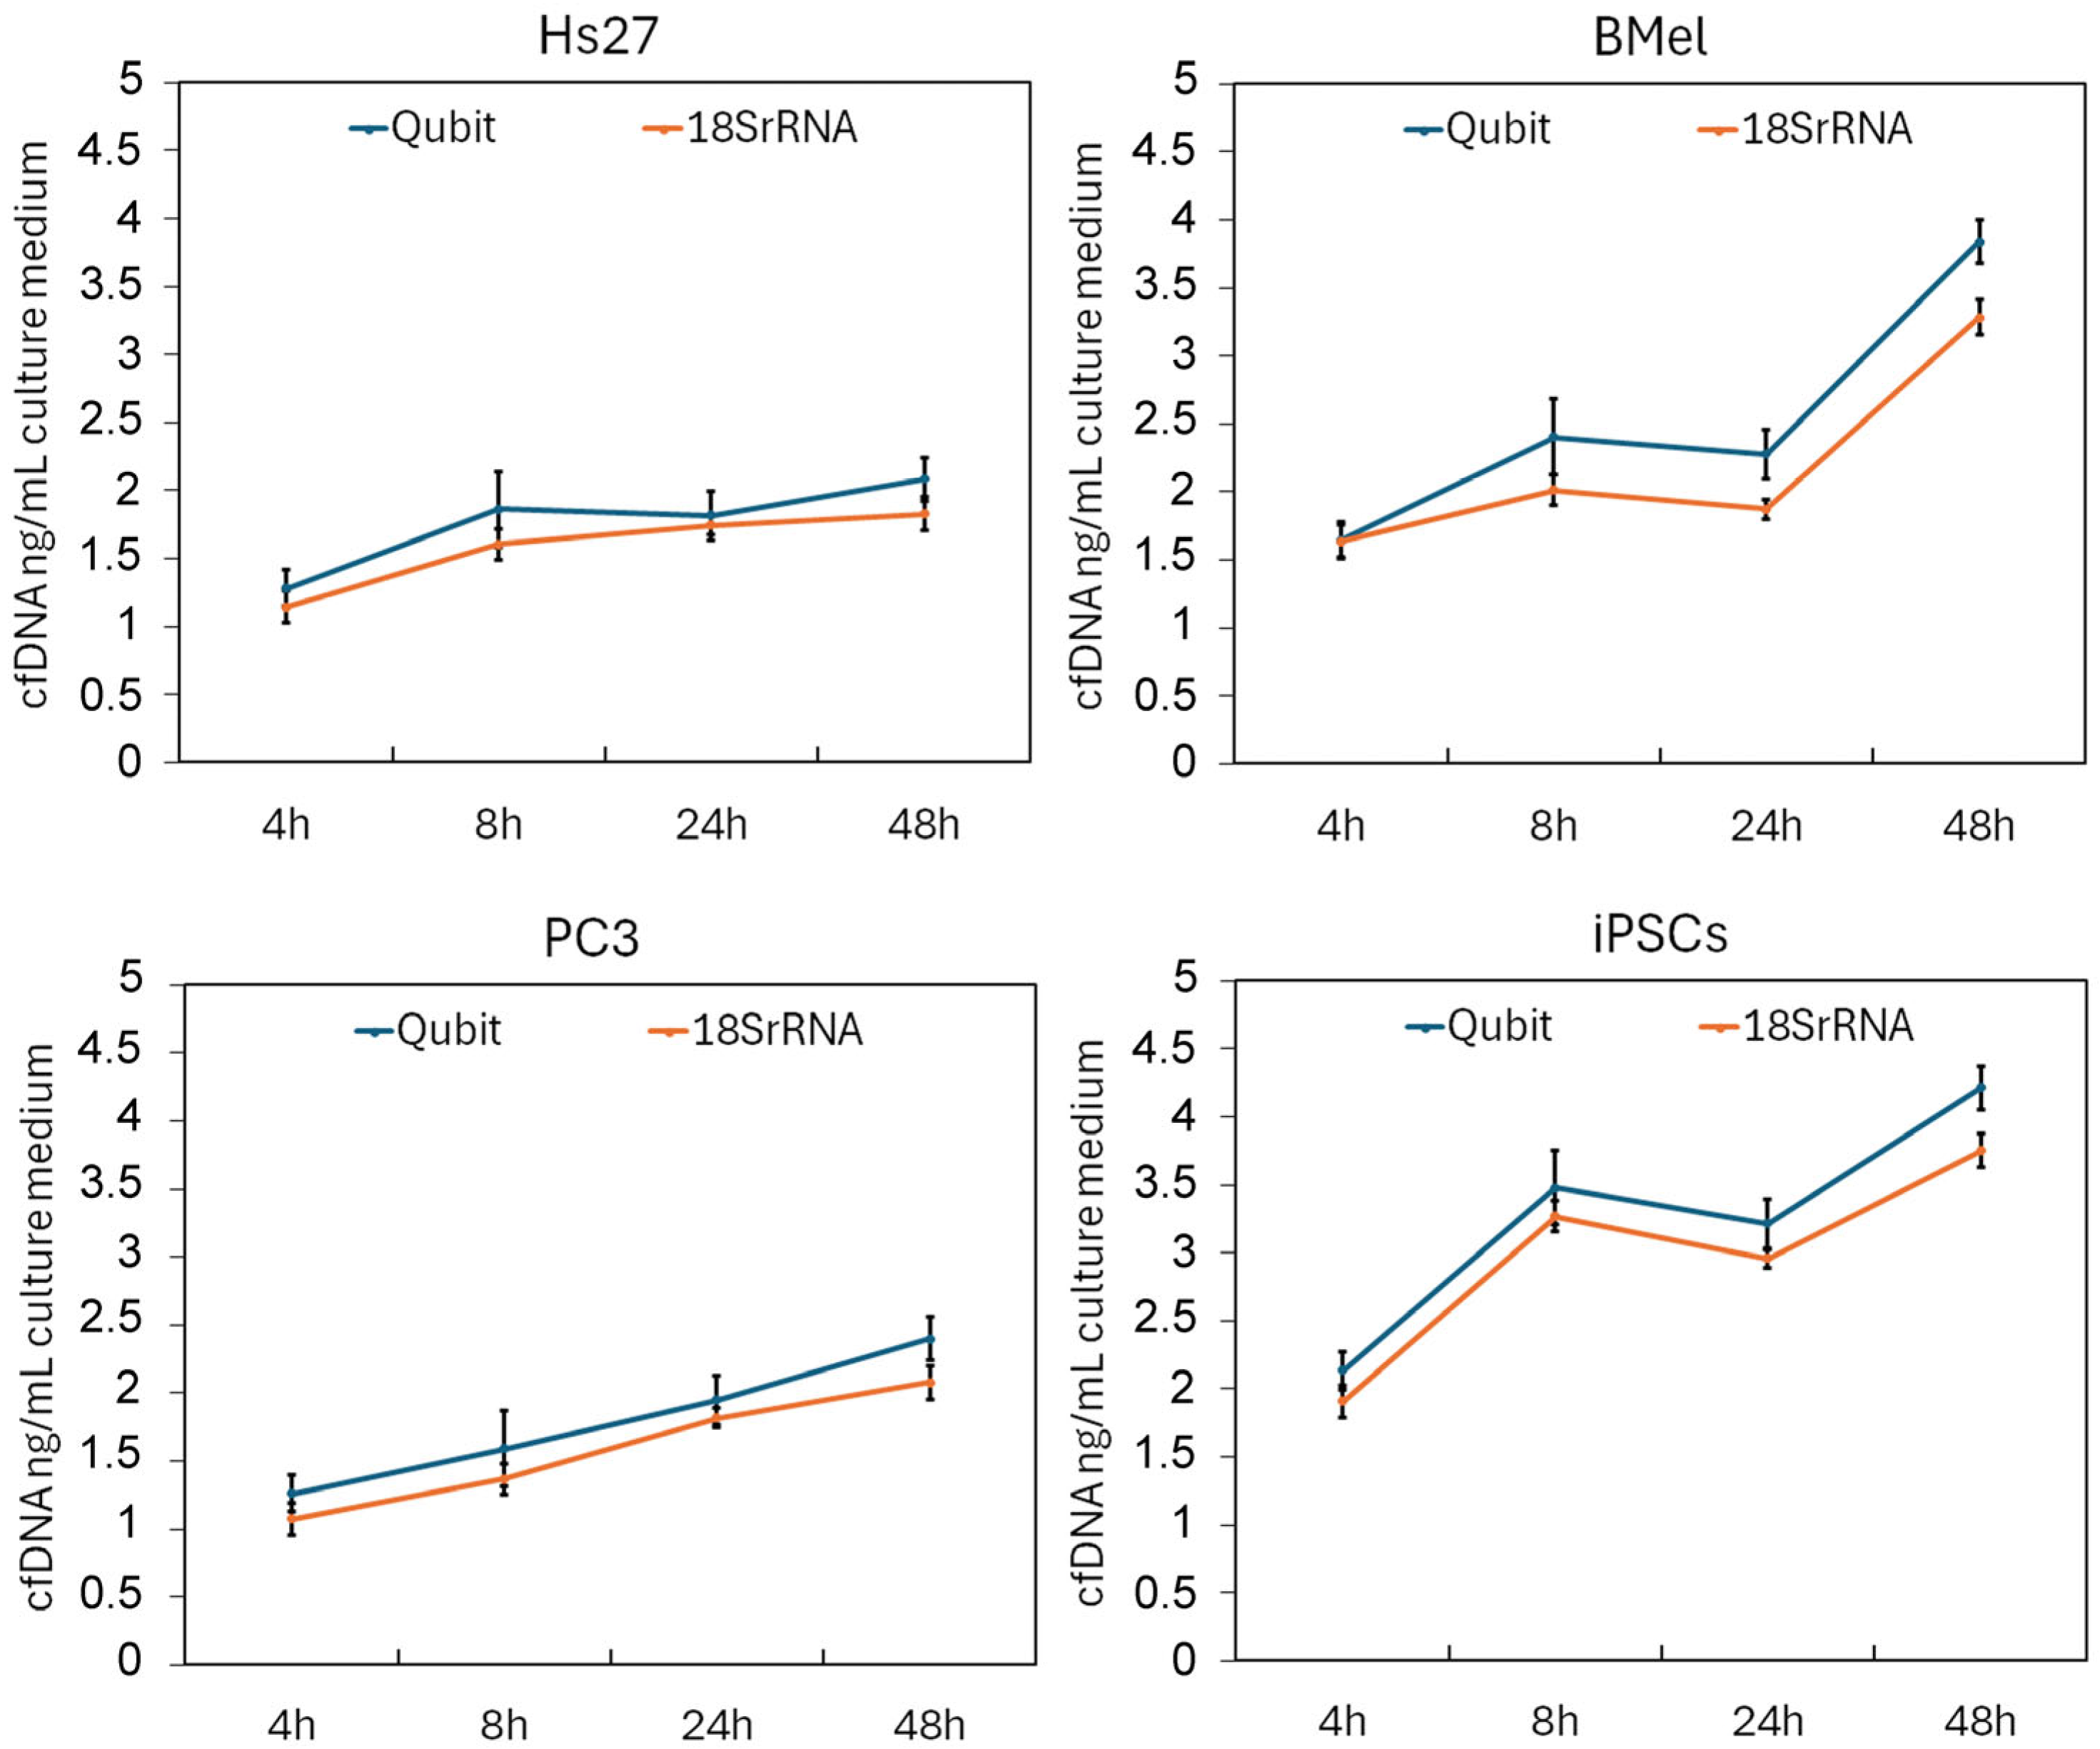
Figure 2 presents the concentration (ng/mL) of cfDNA detected in culture media across all cell lines at different time points, as measured by two independent methods: (1) absolute quantification via qPCR amplification of a conserved region in the multicopy 18S rRNA gene (primers FORW_18SrRNA/REV_18SrRNA_61, which detect both human and bovine DNA), and (2) fluorometric quantification using the Qubit system. In all cell lines, cfDNA tends to increase over time, and the two methods yield consistent results.
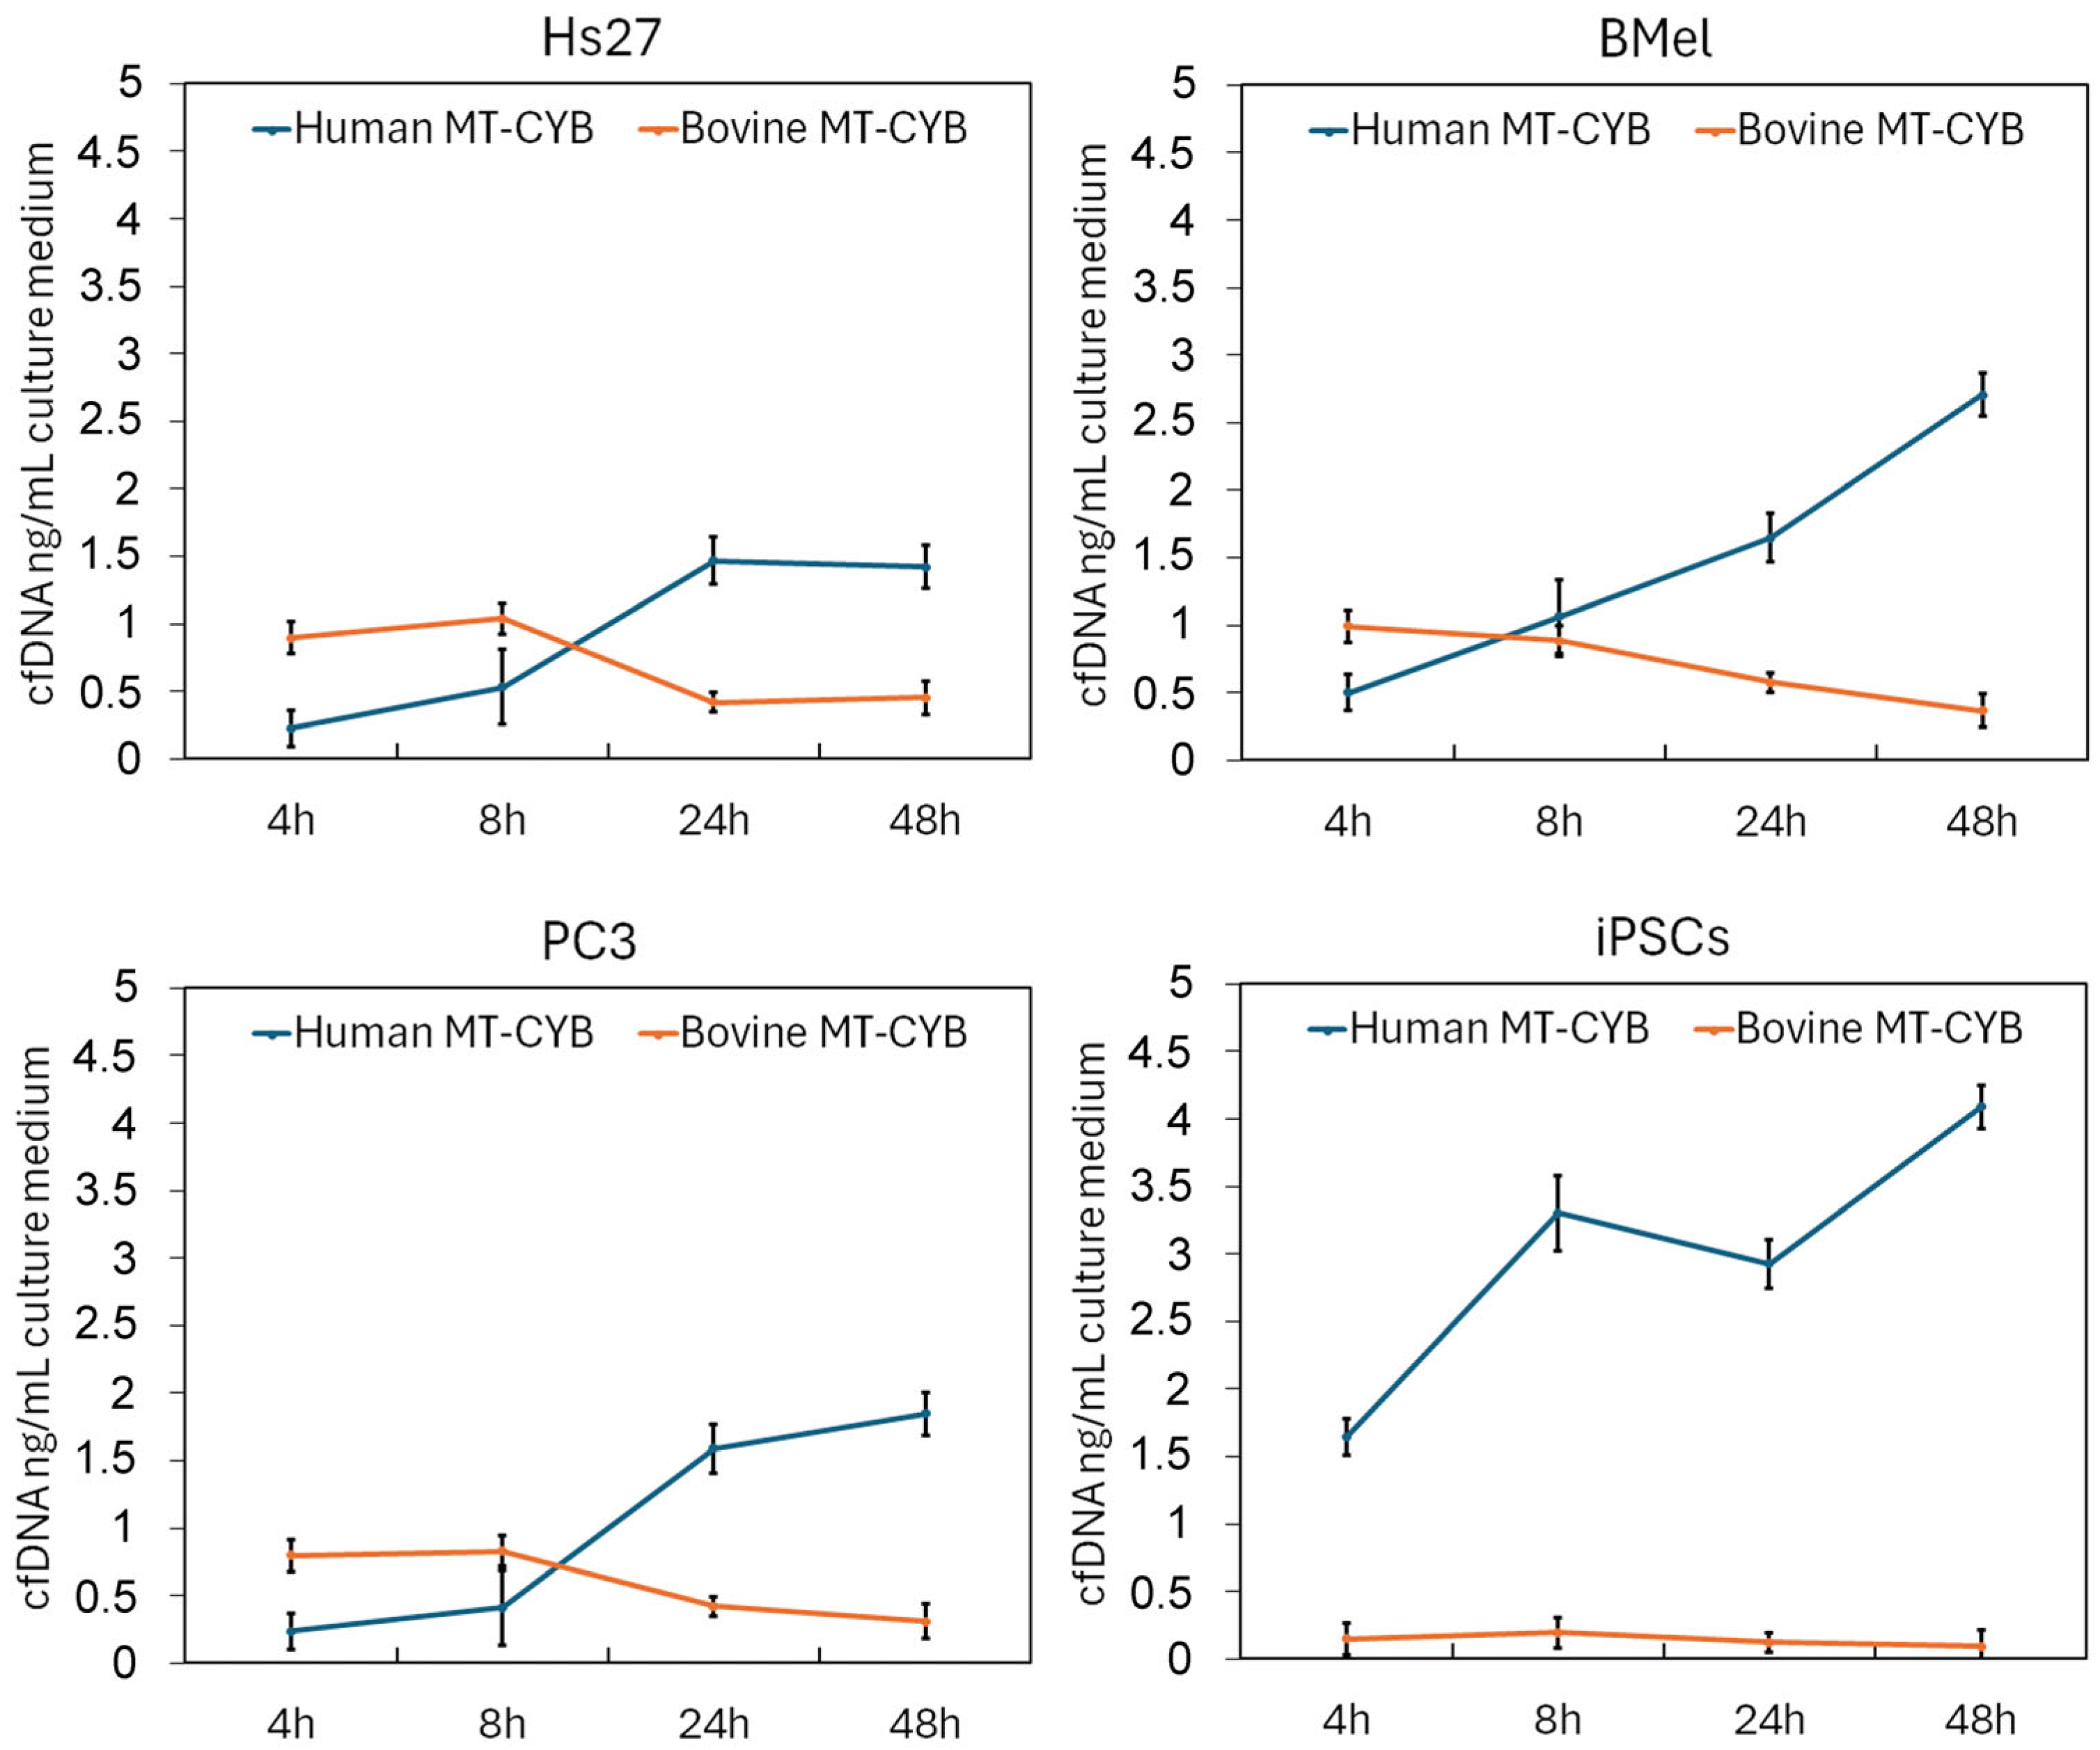
The previous literature [30] reports the presence of cfDNA in FBS, a common supplement in cell culture media. However, the two quantification methods described above, which measure total DNA in the growth medium, cannot distinguish potential contamination from bovine cfDNA. To assess this contamination and prevent interference, we amplified the mitochondrial genes MT-CYB human and MT-CYB bovine using specific primers: FORW_CYB-, REV_CYB_110, and FORW_CYB_Bovine- REV_CYB_Bovine, respectively (Table 1). Absolute quantification via standard curves (see Section 2, Figure S1) yielded the cfDNA concentrations (ng/mL) shown in Figure 3.
cfDNA from all cell types was contaminated with bovine DNA, except for iPSCs cultured in medium without FBS. At the first incubation time points (4 h and 8 h), bovine DNA concentrations ranged between 800 and 1000 ng/mL but progressively declined to 300–450 ng/mL by 48 h across all cell lines. In contrast, human-specific cfDNA levels increased over time, rising five–eight-fold from 4 to 48 h in all cell types except iPSCs. These findings underscore the necessity of using human-specific primers for amplification, as bovine DNA remains quantitatively predominant during the first 8 h of culture.

3.3. cf DNA Fragmentation Analysis

In all cell lines at different growth time points, cf-mtDNA was amplified using specific primers targeting the MT-CYB gene and the D-loop region (Table 1). The resulting amplicons had variable lengths of 110, 206, 251, and 325 bp (MT-CYB) and 73, 151, 250, and 392 bp (D-loop).
The concentrations of the amplified fragments, expressed as copy number/µL, were determined using standard curves (see Section 2 and Figure S2).
When plotting the logarithm of the copy number/mL of culture medium against amplicon size for each cf-mtDNA sample (across all cell lines, growth times, and target regions), linear relationships were observed. These results indicate no significant variation in fragmentation patterns across different growth times. Consequently, Figure S3 displays only the 24-h time point as representative of all conditions.
The degree of DNA fragmentation was assessed using two indices, Q and λ.
The Q index was defined as the ratio between the copy number concentration (copies/mL) of a longer amplicon and that of the shortest amplicon within the same target sequence (101 bp for MT-CYB and 73 bp for the D-loop region). A higher degree of fragmentation corresponds to a lower Q value. Theoretically, Q = 1 indicates intact, non-fragmented DNA, while Q < 1 suggests fragmentation. Notably, Q is influenced by the amplicon length selected for comparison.
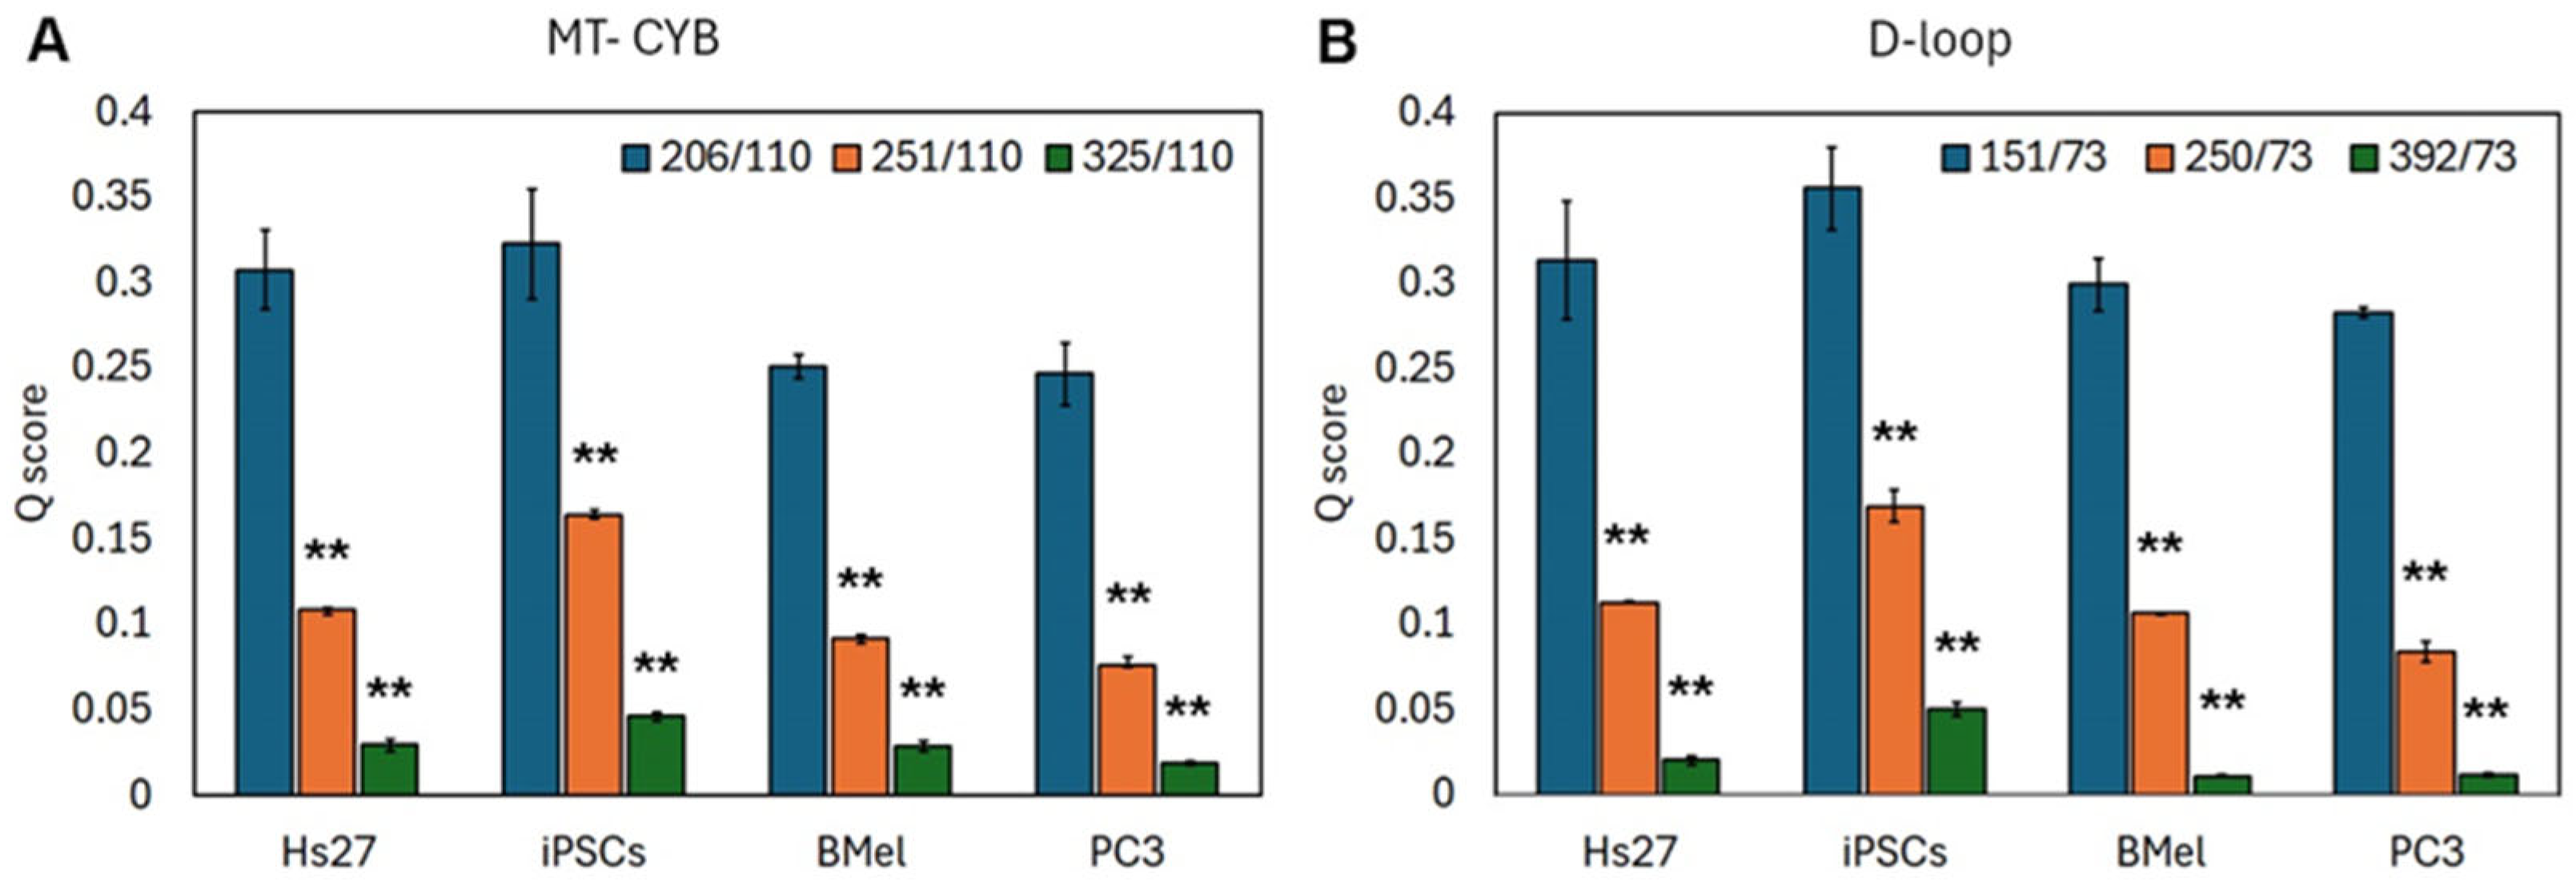
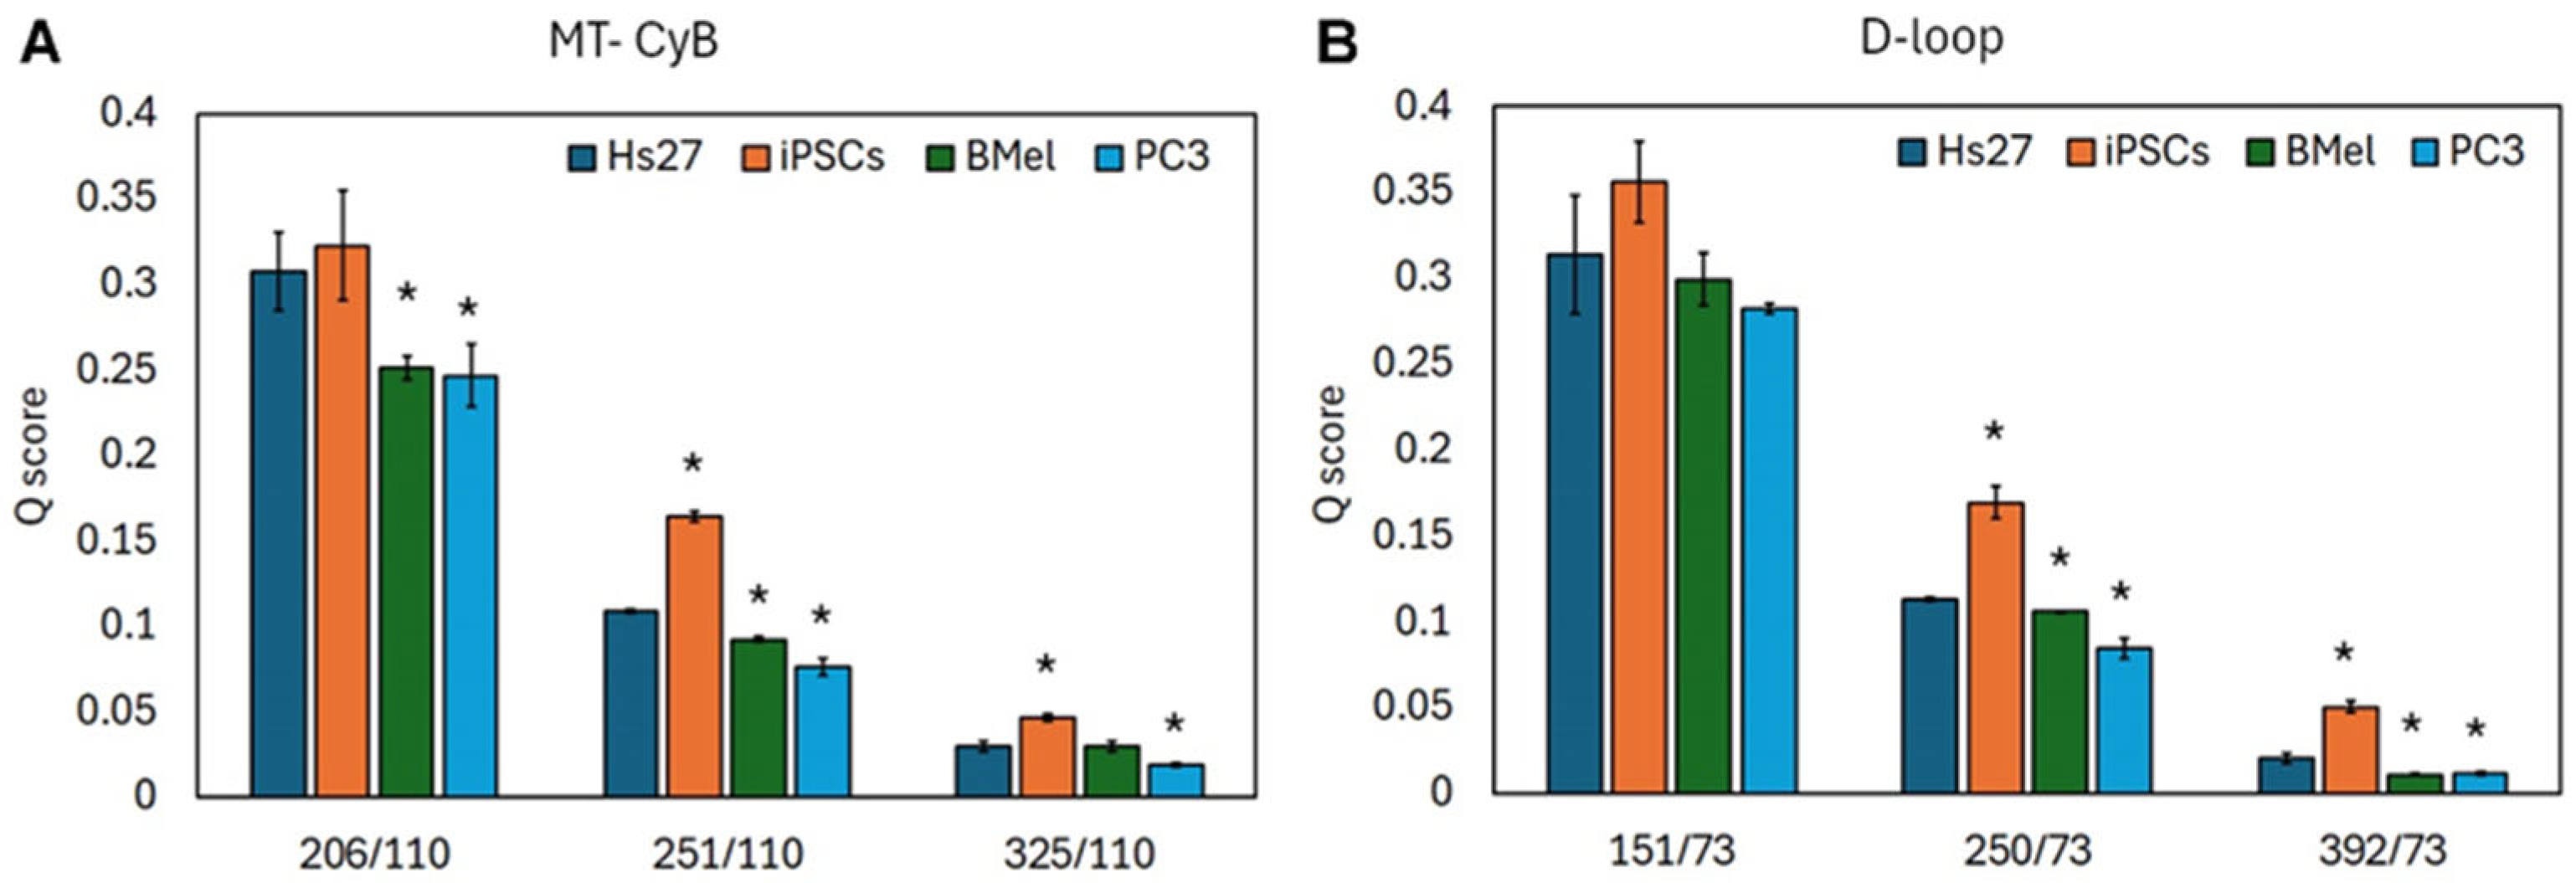
Figure 4 and Figure 5 present the Q-scores for each cell line, calculated across different amplicons after 24 h of growth.
Consistent trends in Q-scores were observed for both the MT-CYB gene and the D-loop region. As shown in Figure 4A,B, Q decreased significantly (p < 0.01) in all cell lines when longer fragments were used in the ratio (e.g., Q325/110 and Q251/110 for MT-CYB; Q392/73 and Q250/73 for the D-loop region).
Figure 5B demonstrates that the Q-score 151/73 for the D-loop region remains stable across all tested cell lines, showing no significant fluctuations. In contrast, Q-scores 250/73 and 392/73 exhibit a marked increase in iPSCs but a significant decrease in tumor cell lines BMel and PC3.
In Figure 5A, the Q-score 206/110 for the MT-CYB gene exhibits a significant decrease exclusively in the two tumor lines. The Q-score 251/110 shows a marked increase in iPSCs but a significant decrease in tumor lines (BMel and PC3). The Q-score 325/110 is significantly elevated in iPSCs but reduced only in the PC3 tumor line. Statistical significance was assessed relative to the normal cell line Hs27.
The results indicate that the iPSC cell line exhibits the lowest degree of DNA fragmentation, whereas the two tumor lines, BMel and PC3, show the highest degree of fragmentation.
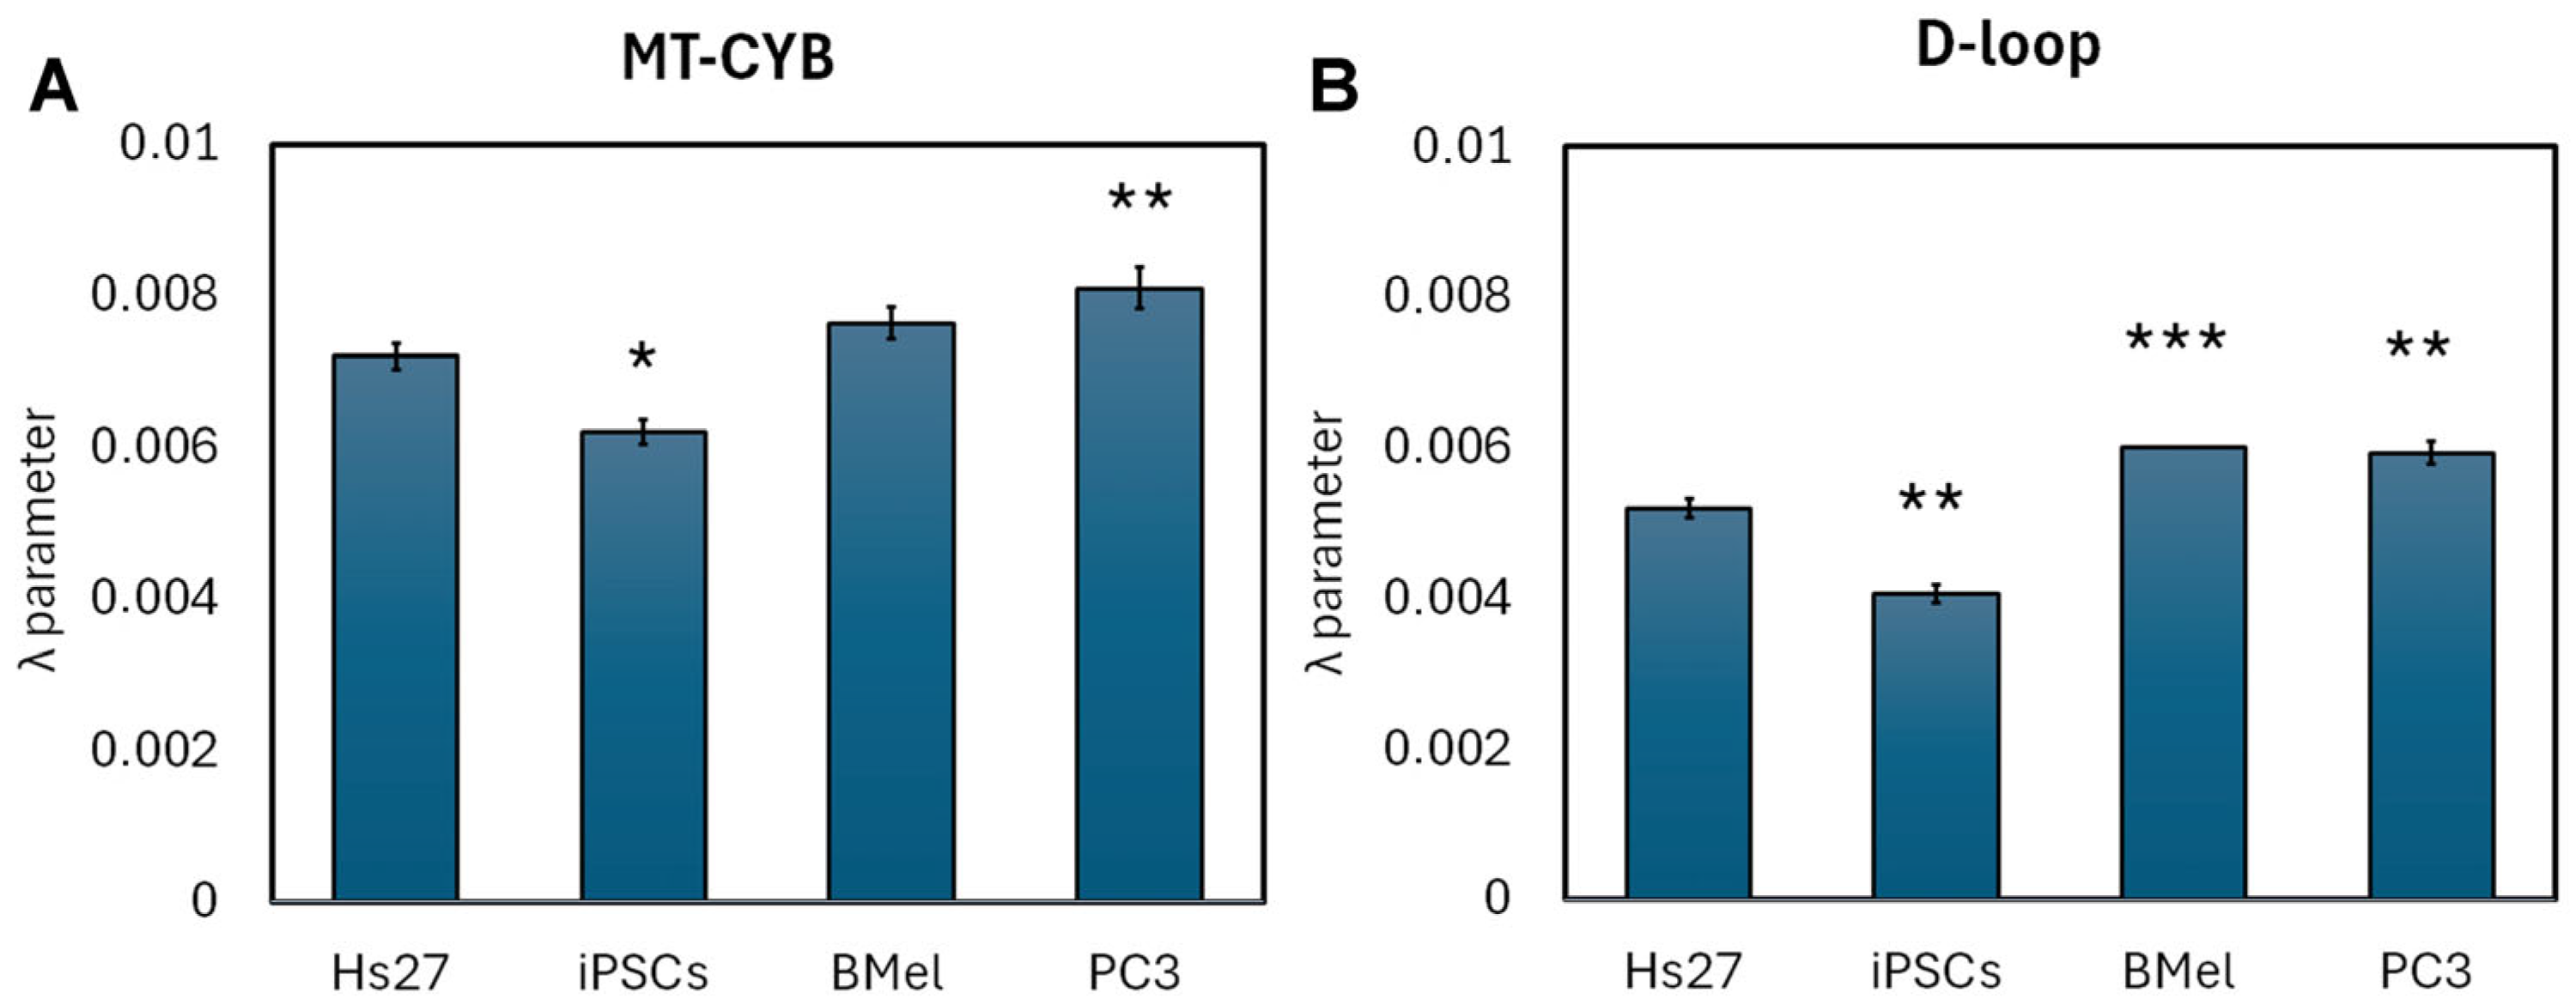
The second parameter, λ, quantifies fragmentation by considering all amplicons of a given sequence. It measures the rate of decline in the number of amplified copies as amplicon size increases. Specifically, λ is the slope of the linear regression obtained by plotting the logarithm of copy number against fragment size (Figure S3). A higher λ value corresponds to greater fragmentation.
Figure 6A,B displays λ values calculated at 24 h for the MT-CYB gene and the D-loop region: stem cells exhibit the lowest λ, indicating significantly less fragmentation than both fibroblasts and tumor cells; PC3 tumor cells show a significant increase in λ compared to Hs27 in both the MT-CYB gene and the D-loop region, and BMel tumor cells display a significant increase in λ relative to Hs27 only in the D-loop region.

4. Discussion

Circulating free DNA (cfDNA) consists of genomic DNA (cf-nDNA) and mitochondrial DNA (cf-mtDNA) fragments released by cells primarily through apoptosis and necrosis.
Numerous studies have suggested that cfDNA could serve as a biomarker for early diagnosis, prognosis, therapy monitoring, and tumor follow-up [2,4]. Although the existing literature on cfDNA released by cell cultures in in vitro growth media [26,27,28,29,30,31,32,33] provides valuable insights into size characterization and release mechanisms, a critical issue has emerged. Recent studies have highlighted potential critical issues due to the presence of contaminating cfDNA in cell culture media or biological samples [30,41,42]. Therefore, in our studies, it proved decisive to determine contamination from bovine cfDNA derived from FBS.
The aim of our study was to evaluate bovine cfDNA contamination in cell culture media and its impact on experimental data under controlled conditions using four human cell lines: fibroblasts (Hs27), induced pluripotent stem cells (iPSCs), malignant melanoma (BMel), and prostate cancer cells (PC3).
We focused on the analysis of cf-mtDNA, as it represents a significant component of total cfDNA. Due to its high copy number, cf-mtDNA is more readily detectable than nuclear cfDNA and is less prone to loss during extraction processes. Furthermore, its fragmentation profile can differ between normal and tumor cells, reflecting alterations in release mechanisms, mitochondrial structure, and interactions with binding proteins, making it a promising biomarker in cancer diagnostics.
In cfDNA detection, the quantity recovered from samples is crucial. Therefore, we conducted preliminary experiments to optimize extraction conditions and obtain more concentrated cfDNA. Culture media were lyophilized, but this treatment resulted in lower DNA recovery. In parallel, proteinase K treatments were performed, which significantly improved recovery efficiency (Figure 1A).
Since circulating nucleic acids can be incorporated into exosomes, associated with lipoprotein complexes, or bound to nucleoids [17], we hypothesize that the use of Proteinase K may disrupt these complexes, making the cfDNA more accessible for purification.
We also verified and excluded, via qPCR using an Internal Positive Control (IPC), any potential influence of the extraction and purification procedures on cfDNA recovery, as well as the presence of inhibitors in the extracted cfDNA samples that could affect qPCR reactions (Figure 1B).
The quantity of extracted cfDNA was assessed using both Qubit fluorometry and qPCR amplification of the nuclear gene 18S rRNA. In all cell lines, cfDNA levels tended to increase over time, and the two methods yielded comparable results (Figure 2).
To evaluate FBS-derived contamination, we designed species-specific primers targeting the MT-CYB gene in both humans and bovines.
The cfDNA from all cell types, except iPSCs cultured in media without FBS supplementation, shows contamination by bovine DNA.
Bovine cfDNA is predominant during the first 8 h of growth, then progressively decreases, consistent with literature data [30]. Since the amount of human cfDNA in the early hours is limited and the interference is significant, in vitro studies must not only employ specific primers but also account for the temporal dynamics of contamination (Figure 3).
Human-specific cfDNA increases over time and, except in iPSCs, rises five–eight-fold between 4 and 48 h of culture.
Our studies, therefore, focused on analyzing the release of cf-mtDNA into the cell culture supernatants of the four cell lines under investigation using qPCR. We designed human-specific primers targeting the MT-CYB and D-loop regions to assess the size distribution of cf-mtDNA fragments released into the supernatants. This approach yielded amplicons of 110, 206, 251, and 325 bp for the MT-CYB gene, and amplicons of 73, 151, 250, and 325 bp for the D-loop region (Table 1).
The results show a higher fragmentation degree in tumor cell lines compared to normal ones, as indicated by the Q and λ indices, suggesting the potential use of the cf-mtDNA fragmentation profile as an indicator of neoplastic transformation. These data support the employment of cf-mtDNA as a non-invasive diagnostic tool and open new perspectives for the molecular characterization of tumors through extracellular DNA analysis.
Absolute quantification of copy numbers was performed using standard curves (Figure S2). Fragmentation was evaluated using the Q and γ indices.
Q, defined as the ratio between the concentration (in copies/µL) of a larger amplicon and that of a shorter amplicon from the same sequence, decreases as amplicon size increases in all cell lines, for both MT-CYB and D-loop (Figure 4). When comparing cell lines, the lowest Q values, and, thus, the highest degree of fragmentation, were observed in tumor cell lines, whereas stem cells exhibited the lowest fragmentation levels.
λ is a parameter that increases with the degree of fragmentation. It represents the slope of the linear regression obtained by plotting the logarithm of the copy number for each fragment size against the corresponding fragment length (Figure S3 and Figure 6). This parameter confirms and reinforces the results obtained using the Q index.
The obtained results are interesting and align with the majority of the existing literature. They demonstrate a higher degree of fragmentation in tumor cell lines compared to normal ones, as indicated by the Q and λ indices. This suggests the potential utility of the cf-mtDNA fragmentation profile as an indicator of neoplastic transformation. These data support the use of cf-mtDNA as a non-invasive diagnostic tool and open new avenues for the molecular characterization of tumors through extracellular DNA analysis.
The obtained data confirm that in vitro cellular models can provide significant insights into the mechanisms of active or passive cfDNA release, its fragmentation patterns, tissue-of-origin-associated characteristics, and its role as a biomarker in diagnostic applications. Cf-mtDNA released from tumor cells exhibits distinct characteristics compared to that released from normal cells, such as increased fragmentation. This is likely attributable to altered mitochondrial organization, elevated oxidative stress, and modifications in mitochondrial DNA-binding protein complexes. These alterations, combined with mutations and genomic instability, render cf-mtDNA a potential biomarker for the diagnosis and monitoring of tumor pathologies and the personalized management of cancer patients. In this work, we demonstrate that quantitative and qualitative analysis of cf-mtDNA via species-specific primer qPCR techniques, using fragmentation indices, can provide valuable insights into cellular state and tumor aggressiveness. This highlights the diagnostic and prognostic potential of this biomarker in precision medicine.
We can conclude that in vitro cellular models are useful for studying the mechanisms of cfDNA release and fragmentation, as they allow us to compare normal and tumor cell lines. They are valuable for investigating the effect of mutations, pharmacological treatments, or pathological conditions on cfDNA release. These models provide an experimental basis for identifying diagnostic and prognostic biomarkers prior to proceeding to clinical studies.
Although qPCR remains an effective, sensitive, and reliable tool, the study of cfDNA requires an integrated approach involving multiple techniques such as Next-Generation Sequencing (NGS), capillary electrophoresis, and Digital PCR.

Supplementary Materials

The following supporting information can be downloaded at https://www.mdpi.com/article/10.3390/dna5030041/s1, Figure S1: Standard curve of Ct versus log concentration (pg/µL); Figure S2: Standard curves for the human MT-CYB gene and the D-loop sequence—Ct versus log concentration (copies/µL); Figure S3: Log copy number versus amplicon size.

Author Contributions

Conceptualization, O.Z., A.B. and A.M.G.P.; methodology, P.C., S.C., A.R.V. and M.A.; software, formal analysis, P.C. and O.Z.; resources, A.R.V. and A.M.G.P.; data curation, S.C., O.Z., A.B., P.C. and M.A.; writing—original draft preparation, A.B., P.C. and O.Z.; writing—review and editing, A.R.V.; supervision, project administration, and funding acquisition, O.Z., A.R.V. and A.M.G.P. All authors have read and agreed to the published version of the manuscript.

Funding

This study was supported by institutional research funds from the University of L’Aquila FFO 2023-24, to A.R.V., P.C., A.B., and A.M.G.P.

Institutional Review Board Statement

Not applicable.

Informed Consent Statement

Not applicable.

Data Availability Statement

The data presented in this study are available in the present article upon request to the corresponding authors.

Conflicts of Interest

The authors declare no conflicts of interest.

References

  1. Filatova, A.A.; Alekseeva, L.A.; Sen’kova, A.V.; Savin, I.A.; Sounbuli, K.; Zenkova, M.A.; Mironova, N.L. Tumor- and Fibroblast-Derived Cell-Free DNAs Differently Affect the Progression of B16 Melanoma In Vitro and In Vivo. Int. J. Mol. Sci. 2024, 25, 5304. [Google Scholar] [CrossRef]
  2. Bronkhorst, A.J.; Ungerer, V.; Holdenrieder, S. The Emerging Role of Cell-Free DNA as a Molecular Marker for Cancer Management. Biomol. Detect. Quantif. 2019, 17, 100087. [Google Scholar] [CrossRef]
  3. Batool, S.M.; Yekula, A.; Khanna, P.; Hsia, T.; Gamblin, A.S.; Ekanayake, E.; Escobedo, A.K.; You, D.G.; Castro, C.M.; Im, H.; et al. The Liquid Biopsy Consortium: Challenges and Opportunities for Early Cancer Detection and Monitoring. Cell Rep. Med. 2023, 4, 101198. [Google Scholar] [CrossRef]
  4. Cisneros-Villanueva, M.; Hidalgo-Pérez, L.; Rios-Romero, M.; Cedro-Tanda, A.; Ruiz-Villavicencio, C.A.; Page, K.; Hastings, R.; Fernandez-Garcia, D.; Allsopp, R.; Fonseca-Montaño, M.A.; et al. Cell-Free DNA Analysis in Current Cancer Clinical Trials: A Review. Br. J. Cancer 2022, 126, 391–400. [Google Scholar] [CrossRef]
  5. Husain, H.; Melnikova, V.O.; Kosco, K.; Woodward, B.; More, S.; Pingle, S.C.; Weihe, E.; Park, B.H.; Tewari, M.; Erlander, M.G.; et al. Monitoring Daily Dynamics of Early Tumor Response to Targeted Therapy by Detecting Circulating Tumor DNA in Urine. Clin. Cancer Res. 2017, 23, 4716–4723. [Google Scholar] [CrossRef]
  6. Husain, H.; Nykin, D.; Bui, N.; Quan, D.; Gomez, G.; Woodward, B.; Venkatapathy, S.; Duttagupta, R.; Fung, E.; Lippman, S.M.; et al. Cell-Free DNA from Ascites and Pleural Effusions: Molecular Insights into Genomic Aberrations and Disease Biology. Mol. Cancer Ther. 2017, 16, 948–955. [Google Scholar] [CrossRef]
  7. Das, D.; Avssn, R.; Chittela, R.K. A Phenol-Chloroform Free Method for cfDNA Isolation from Cell Conditioned Media: Development, Optimization and Comparative Analysis. Anal. Biochem. 2024, 687, 115454. [Google Scholar] [CrossRef]
  8. Hu, Z.; Chen, H.; Long, Y.; Li, P.; Gu, Y. The Main Sources of Circulating Cell-Free DNA: Apoptosis, Necrosis and Active Secretion. Crit. Rev. Oncol. Hematol. 2021, 157, 103166. [Google Scholar] [CrossRef]
  9. Zheng, Y.W.L.; Chan, K.C.A.; Sun, H.; Jiang, P.; Su, X.; Chen, E.Z.; Lun, F.M.F.; Hung, E.C.W.; Lee, V.; Wong, J.; et al. Nonhematopoietically Derived DNA Is Shorter than Hematopoietically Derived DNA in Plasma: A Transplantation Model. Clin. Chem. 2012, 58, 549–558. [Google Scholar] [CrossRef]
  10. Straver, R.; Oudejans, C.B.M.; Sistermans, E.A.; Reinders, M.J.T. Calculating the Fetal Fraction for Noninvasive Prenatal Testing Based on Genome-wide Nucleosome Profiles. Prenat. Diagn. 2016, 36, 614–621. [Google Scholar] [CrossRef]
  11. Fan, H.C.; Blumenfeld, Y.J.; Chitkara, U.; Hudgins, L.; Quake, S.R. Analysis of the Size Distributions of Fetal and Maternal Cell-Free DNA by Paired-End Sequencing. Clin. Chem. 2010, 56, 1279–1286. [Google Scholar] [CrossRef]
  12. Ungerer, V.; Bronkhorst, A.J.; Van Den Ackerveken, P.; Herzog, M.; Holdenrieder, S. Serial Profiling of Cell-Free DNA and Nucleosome Histone Modifications in Cell Cultures. Sci. Rep. 2021, 11, 9460. [Google Scholar] [CrossRef] [PubMed]
  13. Shi, J.; Zhang, R.; Li, J.; Zhang, R. Size Profile of Cell-Free DNA: A Beacon Guiding the Practice and Innovation of Clinical Testing. Theranostics 2020, 10, 4737–4748. [Google Scholar] [CrossRef]
  14. Ivanov, M.; Baranova, A.; Butler, T.; Spellman, P.; Mileyko, V. Non-Random Fragmentation Patterns in Circulating Cell-Free DNA Reflect Epigenetic Regulation. BMC Genom. 2015, 16, S1. [Google Scholar] [CrossRef]
  15. Salvi, S.; Gurioli, G.; De Giorgi, U.; Conteduca, V.; Tedaldi, G.; Calistri, D.; Casadio, V. Cell-Free DNA as a Diagnostic Marker for Cancer: Current Insights. OncoTargets Ther. 2016, 9, 6549–6559. [Google Scholar] [CrossRef]
  16. Jung, K.; Fleischhacker, M.; Rabien, A. Cell-Free DNA in the Blood as a Solid Tumor Biomarker—A Critical Appraisal of the Literature. Clin. Chim. Acta 2010, 411, 1611–1624. [Google Scholar] [CrossRef]
  17. Bonekamp, N.A.; Larsson, N.-G. SnapShot: Mitochondrial Nucleoid. Cell 2018, 172, 388–388.e1. [Google Scholar] [CrossRef]
  18. Marom, S.; Blumberg, A.; Kundaje, A.; Mishmar, D. mtDNA Chromatin-like Organization Is Gradually Established during Mammalian Embryogenesis. iScience 2019, 12, 141–151. [Google Scholar] [CrossRef]
  19. Weerts, M.J.A.; Timmermans, E.C.; Van De Stolpe, A.; Vossen, R.H.A.M.; Anvar, S.Y.; Foekens, J.A.; Sleijfer, S.; Martens, J.W.M. Tumor-Specific Mitochondrial DNA Variants Are Rarely Detected in Cell-Free DNA. Neoplasia 2018, 20, 687–696. [Google Scholar] [CrossRef]
  20. Van Der Pol, Y.; Moldovan, N.; Ramaker, J.; Bootsma, S.; Lenos, K.J.; Vermeulen, L.; Sandhu, S.; Bahce, I.; Pegtel, D.M.; Wong, S.Q.; et al. The Landscape of Cell-Free Mitochondrial DNA in Liquid Biopsy for Cancer Detection. Genome Biol. 2023, 24, 229. [Google Scholar] [CrossRef] [PubMed]
  21. Li, J.; Xu, M.; Peng, J.; Wang, J.; Zhao, Y.; Wu, W.; Lan, X. Novel Technologies in cfDNA Analysis and Potential Utility in Clinic. Chin. J. Cancer Res. 2021, 33, 708–718. [Google Scholar] [CrossRef]
  22. Neuberger, E.W.I.; Brahmer, A.; Ehlert, T.; Kluge, K.; Philippi, K.F.A.; Boedecker, S.C.; Weinmann-Menke, J.; Simon, P. Validating Quantitative PCR Assays for cfDNA Detection without DNA Extraction in Exercising SLE Patients. Sci. Rep. 2021, 11, 13581. [Google Scholar] [CrossRef]
  23. Alcaide, M.; Cheung, M.; Hillman, J.; Rassekh, S.R.; Deyell, R.J.; Batist, G.; Karsan, A.; Wyatt, A.W.; Johnson, N.; Scott, D.W.; et al. Evaluating the Quantity, Quality and Size Distribution of Cell-Free DNA by Multiplex Droplet Digital PCR. Sci. Rep. 2020, 10, 12564. [Google Scholar] [CrossRef]
  24. Bitenc, M.; Grebstad Tune, B.; Melheim, M.; Atneosen-Åsegg, M.; Lai, X.; Rajar, P.; Solberg, R.; Baumbusch, L.O. Assessing Nuclear versus Mitochondrial Cell-Free DNA (cfDNA) by qRT-PCR and Droplet Digital PCR Using a Piglet Model of Perinatal Asphyxia. Mol. Biol. Rep. 2023, 50, 1533–1544. [Google Scholar] [CrossRef]
  25. Koval, A.P.; Khromova, A.S.; Blagodatskikh, K.A.; Zhitnyuk, Y.V.; Shtykova, Y.A.; Alferov, A.A.; Kushlinskii, N.E.; Shcherbo, D.S. Application of PCR-Based Approaches for Evaluation of Cell-Free DNA Fragmentation in Colorectal Cancer. Front. Mol. Biosci. 2023, 10, 1101179. [Google Scholar] [CrossRef] [PubMed]
  26. Bronkhorst, A.J.; Wentzel, J.F.; Aucamp, J.; Van Dyk, E.; Du Plessis, L.; Pretorius, P.J. Characterization of the Cell-Free DNA Released by Cultured Cancer Cells. Biochim. Biophys. Acta BBA-Mol. Cell Res. 2016, 1863, 157–165. [Google Scholar] [CrossRef] [PubMed]
  27. Ungerer, V.; Bronkhorst, A.J.; Uhlig, C.; Holdenrieder, S. Cell-Free DNA Fragmentation Patterns in a Cancer Cell Line. Diagnostics 2022, 12, 1896. [Google Scholar] [CrossRef] [PubMed]
  28. Aucamp, J.; Calitz, C.; Bronkhorst, A.J.; Wrzesinski, K.; Hamman, S.; Gouws, C.; Pretorius, P.J. Cell-Free DNA in a Three-Dimensional Spheroid Cell Culture Model: A Preliminary Study. Int. J. Biochem. Cell Biol. 2017, 89, 182–192. [Google Scholar] [CrossRef]
  29. Wang, W.; Kong, P.; Ma, G.; Li, L.; Zhu, J.; Xia, T.; Xie, H.; Zhou, W.; Wang, S. Characterization of the Release and Biological Significance of Cell-Free DNA from Breast Cancer Cell Lines. Oncotarget 2017, 8, 43180–43191. [Google Scholar] [CrossRef]
  30. Werner, B.; Warton, K.; Ford, C.E. Endogenous Cell-Free DNA in Fetal Bovine Serum Introduces Artifacts to in Vitro Cell-Free DNA Models. BioTechniques 2022, 73, 219–226. [Google Scholar] [CrossRef]
  31. Yuwono, N.L.; Warton, K.; Ford, C.E. The Influence of Biological and Lifestyle Factors on Circulating Cell-Free DNA in Blood Plasma. eLife 2021, 10, e69679. [Google Scholar] [CrossRef]
  32. Gong, Y.; Huang, Q.; Deng, Y.; Zhou, L.; Yi, X.; Zhu, J.; Wu, W. Analysis of Cf-mtDNA and Cf-nDNA Fragment Size Distribution Using Different Isolation Methods in BV-2 Cell Supernatant of Starvation-Induced Autophagy. Biochim. Biophys. Acta BBA-Mol. Cell Res. 2022, 1869, 119147. [Google Scholar] [CrossRef]
  33. Marques, J.F.; Junqueira-Neto, S.; Pinheiro, J.; Machado, J.C.; Costa, J.L. Induction of Apoptosis Increases Sensitivity to Detect Cancer Mutations in Plasma. Eur. J. Cancer 2020, 127, 130–138. [Google Scholar] [CrossRef]
  34. Bronkhorst, A.J.; Ungerer, V.; Holdenrieder, S. Comparison of Methods for the Quantification of Cell-Free DNA Isolated from Cell Culture Supernatant. Tumor Biol. 2019, 41, 1010428319866369. [Google Scholar] [CrossRef]
  35. Panagopoulou, M.; Karaglani, M.; Balgkouranidou, I.; Pantazi, C.; Kolios, G.; Kakolyris, S.; Chatzaki, E. Circulating Cell-free DNA Release in Vitro: Kinetics, Size Profiling, and Cancer-related Gene Methylation. J. Cell. Physiol. 2019, 234, 14079–14089. [Google Scholar] [CrossRef]
  36. Layek, S.S.; Kanani, S.; Doultani, S.; Gohil, T.; Patil, S.; Sudhakar, A.; Raval, K.B.; Kuppusamy, K.; Gorani, S.; Raj, S.; et al. Analyzing Cell-Free Genomic DNA in Spent Culture Media: Noninvasive Insight into the Blastocysts. Glob. Med. Genet. 2024, 11, 227–232. [Google Scholar] [CrossRef]
  37. Vera-Rodriguez, M.; Diez-Juan, A.; Jimenez-Almazan, J.; Martinez, S.; Navarro, R.; Peinado, V.; Mercader, A.; Meseguer, M.; Blesa, D.; Moreno, I.; et al. Origin and Composition of Cell-Free DNA in Spent Medium from Human Embryo Culture during Preimplantation Development. Hum. Reprod. 2018, 33, 745–756. [Google Scholar] [CrossRef]
  38. Rostami, A.; Lambie, M.; Yu, C.W.; Stambolic, V.; Waldron, J.N.; Bratman, S.V. Senescence, Necrosis, and Apoptosis Govern Circulating Cell-Free DNA Release Kinetics. Cell Rep. 2020, 31, 107830. [Google Scholar] [CrossRef]
  39. Kobayashi, M.; Ito, J.; Shirasuna, K.; Kuwayama, T.; Iwata, H. Comparative Analysis of Cell-Free DNA Content in Culture Medium and Mitochondrial DNA Copy Number in Porcine Parthenogenetically Activated Embryos. J. Reprod. Dev. 2020, 66, 539–546. [Google Scholar] [CrossRef]
  40. Deig, C.R.; Thowe, R.T.; Frye, E.D.; Chin-Sinex, H.J.; Mendonca, M.S.; Lautenschlaeger, T. In Vitro Cell-Free DNA Quantification: A Novel Method to Accurately Quantify Cell Survival after Irradiation. Radiat. Res. 2018, 190, 22. [Google Scholar] [CrossRef]
  41. Liu, S.; Yang, W.; Li, Y.; Shen, X.; Yuan, J.; Zhang, J.; Zhang, Y. Fetal bovine serum, an important factor affecting the reproducibility of cell experiments. Sci. Rep. 2023, 13, 1942. [Google Scholar] [CrossRef]
  42. Golshan, M.; Dortaj, H.; Rajabi, M.; Omidi, Z.; Golshan, M.; Pourentezari, M.; Rajabi, A. Animal origins free products in cell culture media: A new frontier. Cytotechnology 2025, 77, 12. [Google Scholar] [CrossRef]
  43. Jiang, P.; Chan, C.W.M.; Chan, K.C.A.; Cheng, S.H.; Wong, J.; Wong, V.W.-S.; Wong, G.L.H.; Chan, S.L.; Mok, T.S.K.; Chan, H.L.Y.; et al. Lengthening and Shortening of Plasma DNA in Hepatocellular Carcinoma Patients. Proc. Natl. Acad. Sci. USA 2015, 112, E1317–E1325. [Google Scholar] [CrossRef] [PubMed]
  44. Liu, Y.; Peng, F.; Wang, S.; Jiao, H.; Dang, M.; Zhou, K.; Guo, W.; Guo, S.; Zhang, H.; Song, W.; et al. Aberrant Fragmentomic Features of Circulating Cell-Free Mitochondrial DNA as Novel Biomarkers for Multi-Cancer Detection. EMBO Mol. Med. 2024, 16, 3169–3183. [Google Scholar] [CrossRef] [PubMed]
  45. Perdas, E.; Stawski, R.; Kaczka, K.; Nowak, D.; Zubrzycka, M. Altered Levels of Circulating Nuclear and Mitochondrial DNA in Patients with Papillary Thyroid Cancer. Sci. Rep. 2019, 9, 14438. [Google Scholar] [CrossRef]
  46. Gambardella, S.; Limanaqi, F.; Ferese, R.; Biagioni, F.; Campopiano, R.; Centonze, D.; Fornai, F. Ccf-mtDNA as a Potential Link Between the Brain and Immune System in Neuro-Immunological Disorders. Front. Immunol. 2019, 10, 1064. [Google Scholar] [CrossRef] [PubMed]
  47. Yin, C.; Li, D.Y.; Guo, X.; Cao, H.Y.; Chen, Y.B.; Zhou, F.; Ge, N.J.; Liu, Y.; Guo, S.S.; Zhao, Z.; et al. NGS-Based Profiling Reveals a Critical Contributing Role of Somatic D-Loop mtDNA Mutations in HBV-Related Hepatocarcinogenesis. Ann. Oncol. 2019, 30, 953–962. [Google Scholar] [CrossRef]
  48. Bulgakova, O.; Kussainova, A.; Kakabayev, A.; Aripova, A.; Baikenova, G.; Izzotti, A.; Bersimbaev, R. The Level of Free-Circulating mtDNA in Patients with Radon-Induced Lung Cancer. Environ. Res. 2022, 207, 112215. [Google Scholar] [CrossRef]
  49. Bulgakova, O.; Kausbekova, A.; Kussainova, A.; Kalibekov, N.; Serikbaiuly, D.; Bersimbaev, R. Involvement of Circulating Cell-Free Mitochondrial DNA and Proinflammatory Cytokines in Pathogenesis of Chronic Obstructive Pulmonary Disease and Lung Cancer. Asian Pac. J. Cancer Prev. 2021, 22, 1927–1933. [Google Scholar] [CrossRef]
  50. Xu, Y.; Zhou, J.; Yuan, Q.; Su, J.; Li, Q.; Lu, X.; Zhang, L.; Cai, Z.; Han, J. Quantitative Detection of Circulating MT-ND1 as a Potential Biomarker for Colorectal Cancer. Bosn. J. Basic Med. Sci. 2021, 21, 577. [Google Scholar] [CrossRef]
  51. Johnson, P.; Zhou, Q.; Dao, D.Y.; Lo, Y.M.D. Circulating Biomarkers in the Diagnosis and Management of Hepatocellular Carcinoma. Nat. Rev. Gastroenterol. Hepatol. 2022, 19, 670–681. [Google Scholar] [CrossRef]
  52. Peng, F.; Wang, S.; Feng, Z.; Zhou, K.; Zhang, H.; Guo, X.; Xing, J.; Liu, Y. Circulating Cell-Free mtDNA as a New Biomarker for Cancer Detection and Management. Cancer Biol. Med. 2023, 21, 105. [Google Scholar] [CrossRef] [PubMed]
  53. Bustin, S.A.; Benes, V.; Garson, J.A.; Hellemans, J.; Huggett, J.; Kubista, M.; Mueller, R.; Nolan, T.; Pfaffl, M.W.; Shipley, G.L.; et al. The MIQE Guidelines: Minimum Information for Publication of Quantitative Real-Time PCR Experiments. Clin. Chem. 2009, 55, 611–622. [Google Scholar] [CrossRef]
  54. Bonfigli, A.; Cesare, P.; Volpe, A.R.; Colafarina, S.; Forgione, A.; Aloisi, M.; Zarivi, O.; Poma, A.M.G. Estimation of DNA Degradation in Archaeological Human Remains. Genes 2023, 14, 1238. [Google Scholar] [CrossRef]
  55. Zhu, D.; Wang, H.; Wu, W.; Geng, S.; Zhong, G.; Li, Y.; Guo, H.; Long, G.; Ren, Q.; Luan, Y.; et al. Circulating Cell-Free DNA Fragmentation Is a Stepwise and Conserved Process Linked to Apoptosis. BMC Biol. 2023, 21, 253. [Google Scholar] [CrossRef] [PubMed]
  56. Matsuda, H.; Seo, Y.; Kakizaki, E.; Kozawa, S.; Muraoka, E.; Yukawa, N. Identification of DNA of Human Origin Based on Amplification of Human-Specific Mitochondrial Cytochrome b Region. Forensic Sci. Int. 2005, 152, 109–114. [Google Scholar] [CrossRef]
  57. Jackson, C.B.; Gallati, S.; Schaller, A. qPCR-Based Mitochondrial DNA Quantification: Influence of Template DNA Fragmentation on Accuracy. Biochem. Biophys. Res. Commun. 2012, 423, 441–447. [Google Scholar] [CrossRef]
  58. Shamimuzzaman, M.; Le Tourneau, J.J.; Unni, D.R.; Diesh, C.M.; Triant, D.A.; Walsh, A.T.; Tayal, A.; Conant, G.C.; Hagen, D.E.; Elsik, C.G. Bovine Genome Database: New Annotation Tools for a New Reference Genome. Nucleic Acids Res. 2019, 48, D676–D681. [Google Scholar] [CrossRef]
  59. Lahiff, S.; Glennon, M.; Lyng, J.; Smith, T.; Shilton, N.; Maher, M. Real-Time Polymerase Chain Reaction Detection of Bovine DNA in Meat and Bone Meal Samples. J. Food Prot. 2002, 65, 1158–1165. [Google Scholar] [CrossRef]
  60. Kavlick, M.F. Development of a Universal Internal Positive Control. BioTechniques 2018, 65, 275–280. [Google Scholar] [CrossRef]
  61. Poma, A.; Cesare, P.; Bonfigli, A.; Volpe, A.R.; Colafarina, S.; Vecchiotti, G.; Forgione, A.; Zarivi, O. A qPCR-Duplex Assay for Sex Determination in Ancient DNA. PLoS ONE 2022, 17, e0269913. [Google Scholar] [CrossRef] [PubMed]
  62. Deagle, B.E.; Eveson, J.P.; Jarman, S.N. Quantification of Damage in DNA Recovered from Highly Degraded Samples—A Case Study on DNA in Faeces. Front. Zool. 2006, 3, 11. [Google Scholar] [CrossRef] [PubMed]
  63. Watanabe, M.; Hashida, S.; Yamamoto, H.; Matsubara, T.; Ohtsuka, T.; Suzawa, K.; Maki, Y.; Soh, J.; Asano, H.; Tsukuda, K.; et al. Estimation of Age-Related DNA Degradation from Formalin-Fixed and Paraffin-Embedded Tissue According to the Extraction Methods. Exp. Ther. Med. 2017, 14, 2683–2688. [Google Scholar] [CrossRef] [PubMed]
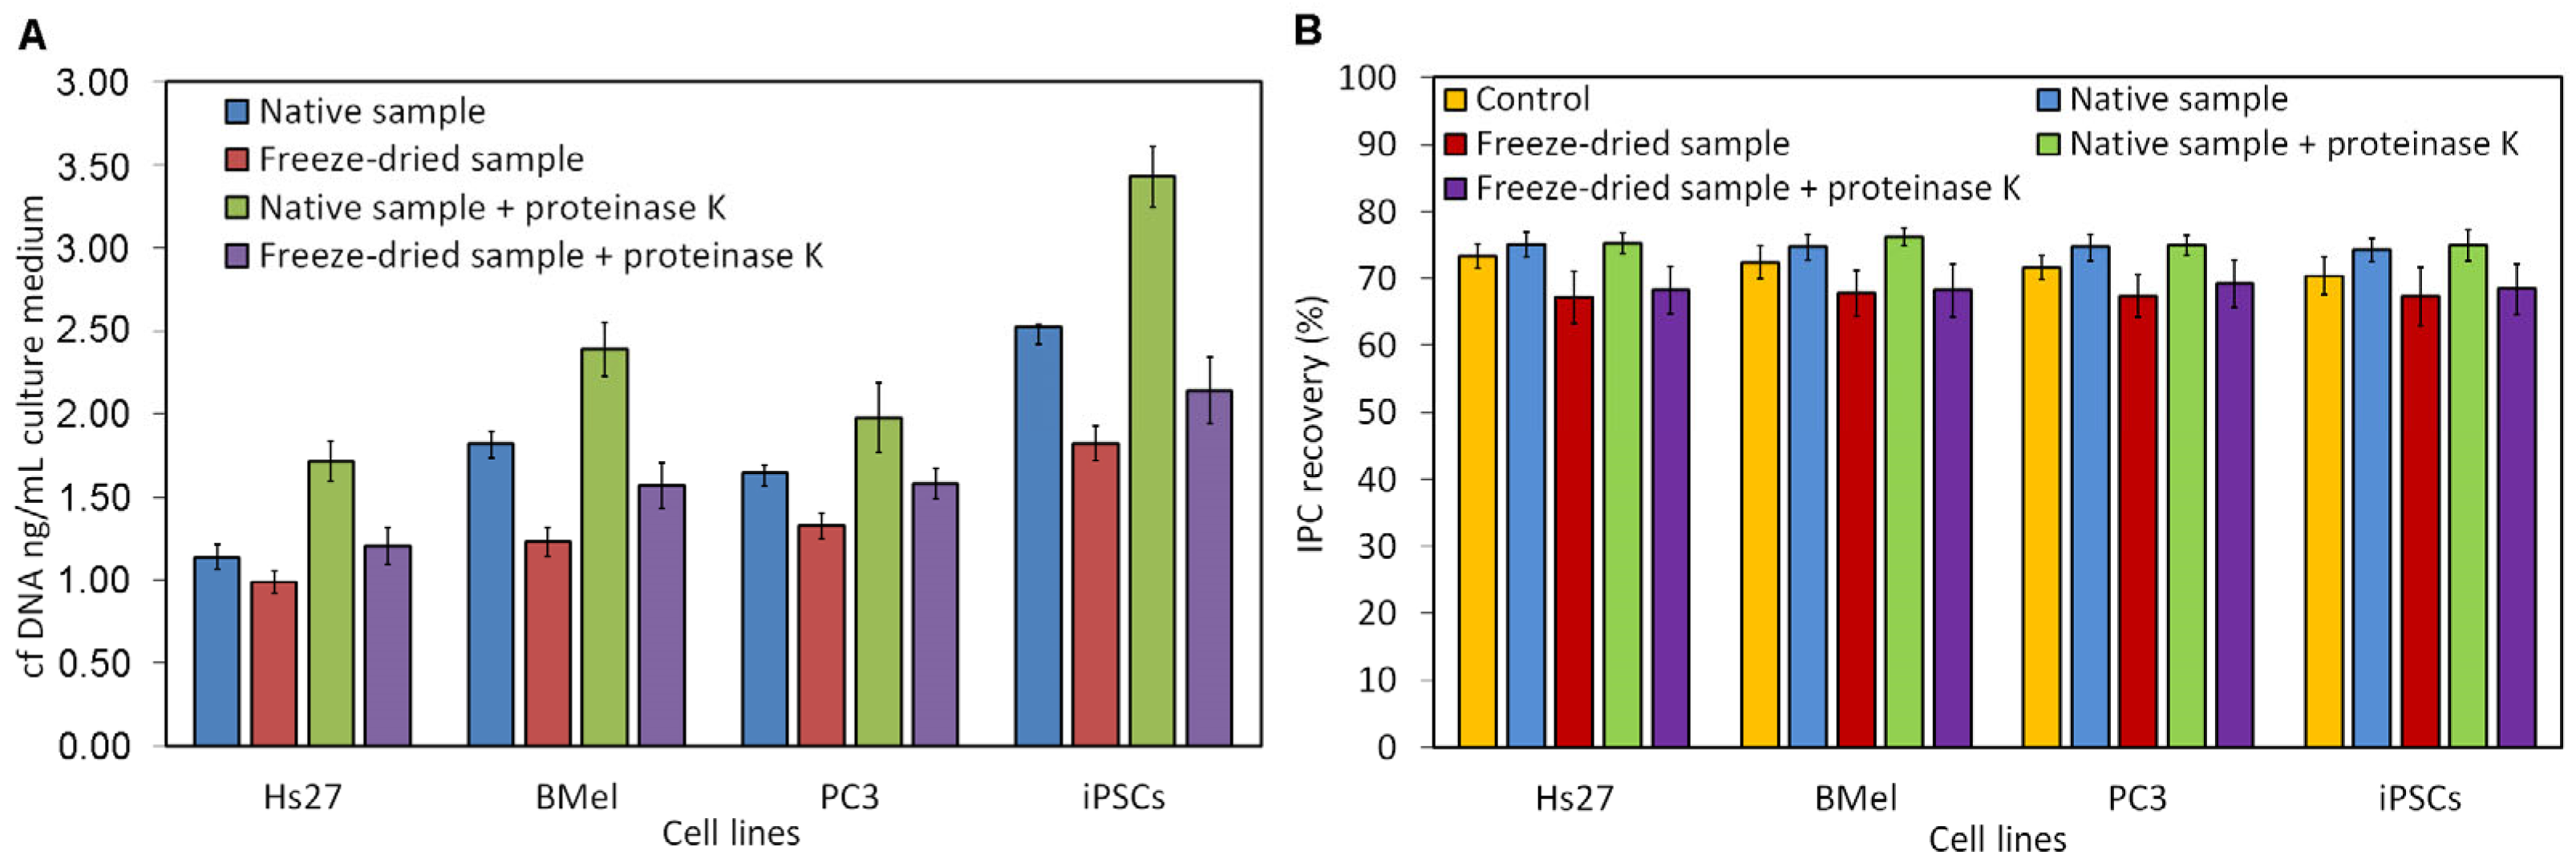
Figure 1. Optimization of cfDNA extraction. Panel (A) shows the concentration of extracted circulating cell-free DNA (cfDNA), expressed in ng/mL of culture medium, as measured by the Qubit® 4.0 Fluorometer (Thermo Fisher Scientific). Culture media (native) from normal human dermal fibroblasts (Hs27), human induced pluripotent stem cells (iPSCs), human melanoma cells (BMel), and human prostate adenocarcinoma cells (PC3) were collected after 24 h of growth and lyophilized at −40 °C using an SJIA-18N laboratory freeze-dryer (Ningbo SJIA Instrument Co., Ltd., China). For each condition, native (2 mL) and lyophilized (400 µL) samples were either treated or untreated with 200 µg/mL Proteinase K (Norgen, Birmingham, UK) and incubated for 20 min at 37 °C prior to cfDNA purification. cfDNA was extracted using the PureLink™ Quick Gel Extraction Kit (Invitrogen, Waltham, MA, USA) across all conditions (native, lyophilized, native + Proteinase K, lyophilized + Proteinase K). Panel (B) shows the recovery percentage (%) of the spiked IPC oligo across all cell lines and extraction conditions. Recovery rates were quantified by qPCR using FORW_IPC and Reverse_IPC primers. Data are presented as means ± SD (n = 3).
Dna 05 00041 g001
Figure 2. Quantification of cfDNA using Qubit and 18SrRNA gene amplification. The graph shows the concentration of cfDNA (expressed as ng/mL of culture medium) extracted from the Hs27, iPSC, BMel, and PC3 cell lines at different incubation times (4, 8, 24, and 48 h). cfDNA was isolated from culture supernatants using the PureLink™ Quick Gel Extraction Kit (Invitrogen), with prior Proteinase K pretreatment. Quantification was performed using the Qubit® 4.0 Fluorometer (Thermo Fisher Scientific) and through amplification of the 18SrRNA gene with the primers FORW_18SrRNA and REV_18SrRNA_61. Each concentration value represents a minimum of three biological replicates and three technical replicates. Data are presented as means ± SD (n = 3).
Dna 05 00041 g002
Figure 3. Quantification of cfDNA through amplification of human and bovine MT-CYB genes. The graph shows the cfDNA concentration (expressed as ng/mL of culture medium) extracted from the Hs27, iPSC, BMel, and PC3 cell lines at different incubation times (4, 8, 24, and 48 h). cfDNA was isolated from culture supernatants using the PureLink™ Quick Gel Extraction Kit (Invitrogen), with a prior Proteinase K pretreatment. Quantification was performed by amplifying the human and bovine MT-CYB genes using the primers FORW_CYB/REV_CYB_110 and FORW_CYB_Bovine/REV_CYB_Bovine, respectively. Each concentration value represents a minimum of three biological replicates and three technical replicates. Data are presented as mean ± SD (n = 3).
Dna 05 00041 g003
Figure 4. Q-score versus amplicon size. The graphs show the Q scores calculated across all cell lines (Hs27, iPSC, BMel, and PC3) for the human MT-CYB gene (A) and the D-loop region (B). The Q score represents the ratio of the copy number of the largest amplicon to that of the smallest. qPCR amplification of the MT-CYB gene and the D-loop region with specific primers FORW_CYTB, REV_CYTB_110, REV_CYTB_206, REV_CYTB_251, REV_CYTB_325, and FORW_D-loop; REV_D-loop_73, REV_D-loop_151, REV_D-loop_250, and REV_D-loop_392 yielded amplicons of varying sizes: 110, 206, 251, 325 bp for MT-CYB and 73, 151, 250, and 392 bp for the D-loop, respectively. Copy numbers of the different amplicons were determined using standard curves, as described in Section 2. The data are presented as mean ± SD (n = 3). Statistical significance was determined using Student’s t-test toward Q206/110 for the MT_CYB gene and Q151/73 for the D-loop region. ** p < 0.01.
Dna 05 00041 g004
Figure 5. Q-score versus cell lines. The graphs display the Q-scores calculated across all cell lines (Hs27, iPSC, BMel, and PC3) for the human MT-CYB gene (A) and the D-loop region (B). The Q-score is defined as the ratio of the copy number of the largest amplicon to that of the smallest. qPCR amplification of the MT-CYB gene and the D-loop region with specific primers FORW_CYTB, REV_CYTB_110, REV_CYTB_206, REV_CYTB_251, REV_CYTB_325, and FORW_D-loop; REV_D-loop_73, REV_D-loop_151, REV_D-loop_250, and REV_D-loop_392 yielded amplicons of varying sizes: 110, 206, 251, 325 bp for MT-CYB and 73, 151, 250, and 392 bp for the D-loop, respectively. Copy numbers of the different amplicons were determined using standard curves, as described in Section 2. Data are presented as mean ± SD (n = 3). Statistical significance was assessed using Student’s t-test, with comparisons made relative to the normal cell line Hs27. * p < 0.05.
Dna 05 00041 g005
Figure 6. λ Parameter versus cell lines. The figure shows the λ parameter calculated for the MT-CYB gene (A) and the D-loop region (B) at 24 h of growth in all analyzed cell lines (Hs27, iPSC, BMel, and PC3). qPCR amplification of the MT-CYB gene and the D-loop region with specific primers—FORW_CYTB, REV_CYTB_110, REV_CYTB_206, REV_CYTB_251, REV_CYTB_325, FORW_D-loop, REV_D-loop_73, REV_D-loop_151, REV_D-loop_250, and REV_D-loop_392—produced amplicons of different lengths: 110, 206, 251, and 325 bp for MT-CYB and 73, 151, 250, and 392 bp for the D-loop, respectively. The copy numbers of the various amplicons were determined using standard curves constructed as described in Section 2. By plotting the logarithm of the copy number against the fragment size, λ was obtained as the slope of the linear regression line. Data are presented as mean ± SD (n = 3). Statistical significance was assessed using Student’s t-test, with comparisons made relative to the normal cell line Hs27. * p < 0.05; ** p < 0.01; *** p < 0.001.
Dna 05 00041 g006
Table 1. Primers used in qPCR and PCR.
PrimesSequenza Primers 5′-3′Product (bp)
FORW_CYB_1091AACCATCGTTGTATTTCAACT1091
REV_CYB_1091ACTTGTCCAATGATGGTAAAAGG
FORW_CYBAACCGCCTTTTCATCAATCG
REV_CYB_110GTAGGAAGAGGCAGATAAAGAATATTGAG110
REV_CYB_206TGAAGGCTGTTGCTATAGTTGCA206
REV_CYB_251TGGCCCCTCAGAATGATATTTG251
REV_CYB_325GTAGCCTCCTCAGATTCATTGAACT325
FORW_HVR_807ATGTCTGCACAGCCGCTTTC807
REV_HVR_807TGTGTGTTCAGATATGTTAAAGCCA
FORW_D-loopGCCACAGCACTTAAACACATCTCT
REV_D-loop_73 TGAAATCTGGTTAGGCTGGTGTTAG73
REV_D-loop_151GTATGGGAGTGGGAGGGGA151
REV_D-loop_250GGGGGTGTCTTTGGGGT250
REV_D-loop_392TGGAACGGGGATGCTTG392
FORW_CYB_BovineCTACTGACACTCACATGAATTGG99
REV_CYB_BovineCACTAGGATGAGGAGAAAGTATAGG
FORW_18SrRNACGAACGTCTGCCCTATCAACTT61
REV_18SrRNA_61ACCCGTGGTCACCATGGTA
FORW_IPCCGCGAGATACACTGCCAGAA65
REV_IPCGACCACAGCCAGATTAAATTTACCA
OLIGO_IPC5′CGCGAGATACACTGCCAGAAATCCGCGTGATTACGAGTCGTGGTAAATTTAATCTGGCTGTGGTC3′
3′GCGCTCTATGTGACGGTCTTTAGGCGCACTAATGCTCAGCACCATTTAAATTAGACCGACACCAG5′
Disclaimer/Publisher’s Note: The statements, opinions and data contained in all publications are solely those of the individual author(s) and contributor(s) and not of MDPI and/or the editor(s). MDPI and/or the editor(s) disclaim responsibility for any injury to people or property resulting from any ideas, methods, instructions or products referred to in the content.