Abstract
The diverse phytochemical profile of olive leaves makes them an attractive feedstock for biomass utilization. The main objective of this study was to evaluate the phenolic content and antioxidant activity (AOA) of olive leaf extracts from four varieties cultivated in the Meknes region (Morocco) across two major collection periods: olive harvest (November) and pruning season (March). This study particularly focused on assessing how variety and season affect total phenolic compounds (TPC), ortho-diphenols (ODPC), total flavonoid content (TFC), and antioxidant activity (AOA). The results revealed that olive leaves collected in November exhibited the highest levels of TPC, ODPC, and AOA, while those from March were richer in TFC. Among the studied cultivars, Koroneiki showed the highest TPC and extraction yields in both November (72.08 ± 0.83 mg GAE/g DM; 42.61 ± 6.51%) and March (46.38 ± 0.83 mg GAE/g DM; 41.00 ± 1.84%). In contrast, Picual leaves displayed the highest antioxidant activity across both periods. The mineral profile of November leaves exhibited varietal specificities and a negative correlation between TPC and most nutrients except Fe, Cu, and Mn. These findings underscore the substantial impact of seasonal variation and cultivar differences on biochemicals, AOA, and minerals, and must be carefully considered for further valorization.
1. Introduction
Olive cultivation encompasses over 830,000 trees worldwide, covering more than 11 million hectares. Morocco alone accounts for over 1 million hectares of this area. Glob-ally, the olive industry produces approximately 2.97 million tons of table olives and 3.12 million tons of olive oil each year, with Spain remaining the leading producer. Morocco contributes around 160,000 tons annually, ranking sixth among the world’s top olive producing countries [1,2].
The olive tree is, therefore, an important food, economic, and financial resource in the Mediterranean region. Given its virtues and benefits to human health, olive cultivation has spread to many countries outside the Mediterranean [3,4], generating large quantities of by-products each year, which can have an environmental impact, but constitutes a very attractive potential source of income [5]. Among these by-products, the leaves constitute an important residue, with a quantity that can range from 1.5 to 3 tons/ha/year during annual pruning operations, and from 0.075 to 0.15 tons/ha/year in oil mills, during the olive harvest season [6]. Based on these data, Morocco alone can generate more than 2 million tons of olive leaf residue per year, which is a significant amount of biomass that is difficult to manage. Currently, these leaves are often used in animal feed or disposed of by burning or spreading on agricultural land, which contributes to greenhouse gas emissions and the resulting spread of diseases as well as the risk of fire [7,8].
In this context, efficient and sustainable use of these by-products and the establishment of new innovative technologies for their management are necessary and arouse growing interest. Such approaches aim not only to reduce environmental pollution and prevent the depletion of natural resources but also to enhance the income of farmers and stakeholders in the olive industry.
Several research and scientific studies have demonstrated the richness of olive leaves in bioactive compounds with high added value, including polyphenols [9,10]. In fact, three main groups of phenolic compounds have been identified in olive leaf extracts: simple phenols, secoiridoids, and flavonoids [11]. These polyphenols have been associated with a beneficial effect on human health, thanks to their antioxidant capacity, as well as their antihypertensive, hypoglycemic, hypocholesterolemic, cardioprotective, and anti-inflammatory effects [12,13,14,15]. Studies have also confirmed that dietary supplementation with oleuropein, the most abundant secoiridoid in olive leaf extract, can constitute a therapeutic strategy and support the prevention and treatment of obesity, which constitutes a major risk factor associated with a number of chronic diseases, including cardiovascular pathologies [16]. Otherwise, the content of these bioactive substances in olive leaves can vary depending on several agronomic parameters, notably the olive cultivar and the stage of the agronomic cycle (harvest season) [17].
In this context, the present study sought to assess the phenolic composition and an-tioxidant capacity of olive leaves from four major cultivars grown in Morocco (Arbequina, Koroneiki, Picual, and Picholine Marocaine) during both the olive harvest and pruning seasons, given the limited data available in national and international literature. Morover, the mineral profile of olive harvest leaves was analyzed to highlight potential varietal characteristics. To the best of our knowledge, this study provides the first nutritional characterization of Moroccan olive leaves from foreign varieties Arbequina, Koroneiki and Picual. Furthermore, little is known about the combined effects of cultivar and seasonal variation on phenolic-mineral interactions, making this investigation a valuable contribution to filling this knowledge gap.
2. Materials and Methods
2.1. Reagents and Standards
Folin-Ciocalteu reagent, ascorbic acid, commercial pure standards of gallic acid, caffeic acid, quercetin, and HPLC-grade methanol were purchased from Sigma-Aldrich Chemie GmbH, Steinheim am Albuch, Germany. Sodium carbonate (Na2CO3), Disodium Phosphate (Na2HPO4), monobasic sodium phosphate (NaH2PO4), and Sodium Molybdate (Na2MoO4) were purchased from Solvachim SARL, Casablanca, Morocco. Aluminum chloride (AlCl3) was purchased from Carlo Erba Reagents, Peypin, France, and 1,1-diphenyl-2-picrylhydrazyl (DPPH) was purchased from Tokyo Chemical Industry Co., Ltd. (TCI), Tokyo, Japan.
2.2. Raw Material and Environmental Conditions
This study focused on four olive cultivars cultivated in Morocco: the local Picholine Marocaine and three foreign varieties (Arbequina, Picual, and Koroneiki). Leaf samples were collected during the two main annual periods of residue generation, the olive harvest (November 2023) and the annual pruning (March 2024), from the experimental orchard of Agro-pôle Olivier ENA Meknes (Figure 1). All cultivars were grown under identical soil and climatic conditions. The agronomic and climatic parameters preceding sampling are summarized in Table 1 and Table 2, respectively.
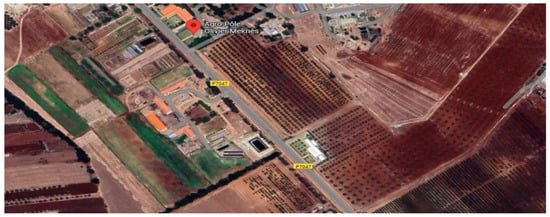
Figure 1.
Geographical localization site of cultivated olive trees used during this experiment latitude 33°50′20″ N, longitude 5°28′26″ W, altitude 631.94 m.

Table 1.
Age and density of plantation for the different cultivars.
Table 2.
Climatic conditions preceding the sampling (https://www.infoclimat.fr accessed on 10 July 2024).
To ensure uniform and representative leaf collection, a sampling plan was implemented following the guidelines of Martínez-Navarro et al. [18], which aligns with the principles used for foliar analysis. For each plot of the four cultivars, five representative healthy trees, labeled (1) to (5), were selected. To minimize potential influences of age and spatial orientation on phenolic analyses, from each tree, 30 healthy leaves were collected at each of the four cardinal directions (North, South, East, and West), comprising a mix of leaf age groups: 10 newly developed leaves from the current growing season, 10 one-year-old leaves, and 10 of the two-year-old leaves. This sampling method ensured a balanced representation of leaf ages and orientations. A total of 120 leaves were collected per tree (30 leaves × 4 directions), resulting in 600 leaves per cultivar. All collected leaves were air-dried at room temperature in the dark until a constant weight was achieved, then immediately stored in light-protected cardboard bags.
2.3. Extraction Process
Extraction was performed using ultrasound. First, the dried olive leaves were crushed in an electric grinder and passed through an 80 μm sieve until the maximum amount of material had passed through. The obtained powder (250 mg) was added to 1.25 mL of 80% methanol solution, which was vortexed for 1 min using an Autovortex Mixer SA2 (Stuart Scientific, Stone, Staffordshire, UK) followed by extraction in a Bioblock Scientific ultrasonic bath (Elma Schmidbauer GmbH, Singen, Germany, 35 kHz, 160 W) for 10 min at room temperature. The mixture was further centrifuged for 15 min at 4000 rpm using an Orto Alresa centrifuge (Álvarez Redondo S.A., Madrid, Spain), and the supernatant was collected and stored in the dark. Subsequently, 2.5 mL of the extraction solvent was added to the recovered precipitate, and the procedure was repeated twice. Ultimately, the three supernatants containing phenolic compounds were combined and diluted with 80% methanol to a total volume of 10 mL to form the final extract. All extractions were conducted in triplicate.
2.4. Extraction Yield
The extraction yield was determined by evaporating 1 mL of the extract in a glass tube until a completely dry extract was obtained after steaming. The yield was then calculated using the formula EY = ((T1 − T0) * (10/M0)) × 100, where T1 represents the mass of the tube with 1 mL of extract after complete solvent evaporation. T0 is the mass of the empty tube and M0 is the mass of the initially treated olive leaf powder. The extraction yields were related to the initial dry biomass and expressed as a percentage.
2.5. Total Phenolic Content (TPC)
The total phenolic content (TPC) was determined using the method described by Singleton [19] using the Folin-Ciocalteu colorimetric technique. In brief, 10 mL of Folin–Ciocalteu reagent (diluted 1/10) was added to 2 mL of the extract sample and diluted 1/10. After waiting for 1–8 min, 8 mL of Na2CO3 at 75 g/L was added, and the mixture was incubated in the dark for two hours at room temperature. All the samples were diluted to suitable concentrations for this analysis, and the absorbance was measured at 760 nm against a blank. The total phenolic content was expressed as mg gallic acid equivalent/g dry matter using a gallic acid calibration curve.
2.6. Total Flavonoid Content (TFC)
Total flavonoid content was determined by the aluminum chloride colorimetric assay [20]. Diluted extracts (1.5 mL) were mixed with 2% AlCl3 (1.5 mL), incubated for 30 min at room temperature, and absorbance was read at 430 nm. Results were expressed as mg quercetin equivalents per g dry matter using a quercetin calibration curve.
2.7. Ortho-Diphenol Content (ODPC)
Ortho-diphenols were also quantified using a colorimetric method according to Blekas et al. [21]. Briefly, 0.2 mL of extract, diluted to 1 mL, was mixed with 1 mL of 0.1 M phosphate buffer and 2 mL of 5% sodium molybdate. After standing for 15 min, absorbance was measured at 350 nm. Caffeic acid was used to construct the calibration curve.
2.8. Antioxidant Activity (AOA) by DPPH Scavenging Assay
The antioxidant activity was determined using the DPPH (1,1-diphenyl-2-picrylhydrazyl) radical scavenging assay, following the procedure of Lfitat et al. [22]. Various concentrations of the extracts and the standard antioxidant (ascorbic acid) were prepared. An aliquot of 0.2 mL of each solution was mixed with 1.5 mL of 0.004% methanolic DPPH solution and 1.3 mL of methanol. The mixtures were vortexed and incubated in the dark at room temperature for 30 min, and absorbance was measured at 517 nm against a methanol blank. The percentage of DPPH inhibition was calculated using the equation:
where A0 is the absorbance of the control at 30 min and A1 is the absorbance of the sample at 30 min.
Percentage inhibition of DPPH (%) = [(A0 − A1)/A0] × 100.
The control consisted of 1.5 mL of DPPH solution and 1.5 mL of methanol.
Results were expressed as IC50 values (half-maximal inhibitory concentration), representing the concentration required to scavenge 50% of the initial DPPH free radicals. IC50 values were calculated from the inhibition curve, with lower IC50 values indicating higher antioxidant activity.
2.9. Mineral Composition
In order to understand and elucidate possible relations between phenolics and other leaf compounds, and considering available resources, a characterization of the mineral composition was carried out on November leaves.
A 0.250 g quantity of dried olive leaf powder was added to 6 mL of nitric acid and placed in the mineralization equipment according to Barea-Álvarez et al. [23]. To eliminate the organic matter from the samples, the temperature was raised to 180 °C over 20 min and then maintained for an additional 20 min. At the end of the digestion, the mineralized liquid in the borosilicate tubes was collected and resuspended in 10 mL of Milli-Q water. Finally, mineral analysis was performed by ICP-OES spectroscopy (Optima 8300, PerkinElmer, Shelton, CT, USA). Results were expressed as g/kg dry matter (DM) for macronutrients and mg/kg DM for micronutrients.
2.10. Statistical Analysis
Statistical analysis was performed using R software version 4.5.0. First before performing statistical tests, the data collected for each parameter was tested for normality and homogeneity using Shapiro-Wilk and Levine’s tests. The comparison between the TPC, ODPC, TFC, IC50 and yield of each variety within the two seasons were performed using t-test, while comparison between varieties was made using One-Way ANOVA followed by Tukey’s test as post hoc. Mineral composition of olive varieties during November was also made using One-Way ANOVA followed by Tukey’s test and their correlation with TPC was tested using Pearson’s test. Interaction effect between seasons and varieties was made using Two-way ANOVA. All tests were performed at threshold of p < 0.05. PCA, LDA and Radar chart were made using the same used software.
3. Results
3.1. Seasonal Variation in the Biochemical Composition and Extract Yield of Olive Leaf Varieties
Figure 2 presents the main biochemical parameters measured. Total phenolic content (TPC) varied markedly among varieties and seasons, with generally higher values observed during the harvest season (Figure 2A). Significant seasonal differences in TPC were found for the Koroneiki, Picual, and Picholine Marocaine varieties (p < 0.0001), whereas Arbequina showed no significant variation (p > 0.05). Among the varieties, Koroneiki exhibited the highest TPC values (72.08 and 46.38 mg GAE/g DM during harvest and pruning seasons, respectively), while Arbequina recorded the lowest (46.02 and 46.25 mg GAE/g DM). Overall, both variety and season had a significant effect on TPC (p < 0.0001).
Concerning ortho-diphenolic compounds, the varieties exhibited varying ODPC levels depending on the season, with the difference between seasons being significant (p < 0.05) for all varieties, whereas a stronger difference was shown by Picholine Marocaine, where these compounds reached their peak in the harvest season (Figure 2B). Overall, all varieties exhibited higher ODPC values during the harvest season, except for Picual. Picholine Marocaine recorded the highest ODPC content (14.09 mg CAE/g DM), while Picual showed the lowest (9.40 mg CAE/g DM). During the pruning season, Picholine Marocaine again displayed the highest value (10.60 mg CAE/g DM), whereas Picual remained the lowest (9.87 mg CAE/g DM).
In contrast, total flavonoid content (TFC) was generally lower during the olive harvest season compared to the pruning season, when it reached its peak (Figure 2D). During the pruning season, Arbequina exhibited the highest TFC value (5.85 mg QE/g DM), whereas Picholine Marocaine showed the highest value during the harvest season (4.10 mg QE/g DM).
Regarding the half-inhibition concentration (IC50), stronger antioxidant activity was recorded during the olive harvest season, with lower values indicating higher antioxidant activity, and with Picual showing the strongest antioxidant activity (at 12.344 ppm) compared to the other varieties (Figure 2C). All varieties showed varying IC50 values depending on the season, with the differences being significant (p < 0.05).
The yield of the extract was influenced by the season of leaf collection (Figure 2E), with higher yields generally obtained during the olive harvest season. Significant seasonal differences were observed for Arbequina and Picholine Marocaine (p < 0.05), whereas no significant variation was detected for the other varieties (p > 0.05).
3.2. Interactive Effects of Olive Variety and Season of Collection on Biochemical Composition and Extract Yield
Figure 3 shows the variety-season interaction effects and their interrelation in affecting the content of the measured parameters and the yield of extraction. Overall, all measured parameters were influenced by the variety × season interaction, with most showing highly significant differences (p < 0.001). However, the yield did not respond to the indicated interaction, therefore, no significant difference was observed (p > 0.05). The interaction effect indicates that the olive harvest season modulates and promotes TPC and ODPC as well as antioxidant activity (IC50), whereas the pruning season affects and enhances TFC.

Figure 2.
Measured parameters of olive plant leaves including (A) total phenolic content (TPC), (B) ortho-diphenol content (ODPC), (C) half-inhibition concentration (IC50), (D) total flavonoid content (TFC), and (E) yield of extraction using 80% methanol as a solvent, DM refers to dry matter. Comparisons of the same parameter within each variety across different seasons were performed using a t-test at p < 0.05 and across varieties ANOVA One-Way was used. * indicates p < 0.05. ** means p < 0.01. and *** refers to p < 0.001 while ns indicates non-significant. in the case of no-significant difference the term ns was used.


Figure 3.
Interaction effect of seasons and varieties and their direct effect on the measured parameters. (A) total phenolic content (TPC), (B) ortho-diphenol content (ODPC), (C) half-inhibition concentration (IC50), (D) total flavonoid content (TFC), and (E) yield of extraction using 80% methanol as a solvent, DM refers to dry matter.

3.3. Principal Component Analyses (PCA) of Olive Varieties and Seasons and Their Association with the Measured Parameters
Principal component analysis (PCA) was used to investigate the differences in the biochemical characteristics of the olive leaf extracts of four olive varieties, namely, Arbequina, Koroneiki, Picual, and Picholine Marocaine (Figure 4). The investigation was undertaken using five major variables: TPC, ODPC, TFC, IC50, and Yield. PC1 and PC2 explained 80.9% of the total variance, with PC1 accounting for 51.4% and PC2 accounting for 29.6%. Suggesting that most of the variety differences were easily depicted in two dimensions. The PCA biplot generated a good discrimination between the varieties based on their chemical profiles. Koroneiki and Picual are on the right-hand side of the plot (positive PC1), which represents high TPC and Yield. Both Koroneiki and Picual varieties stood out for their high phenolic content and ex-tractability. These varieties were positioned at the lower end of PC2 (negative values), reflecting lower ODPC and IC50 values, indicative of strong antioxidant activity particularly in Picual, which exhibited the highest antioxidant activity across both seasons. In contrast, Arbequina appeared on the left side of PC1 (negative values), associated with higher TFC and IC50 but lower TPC.
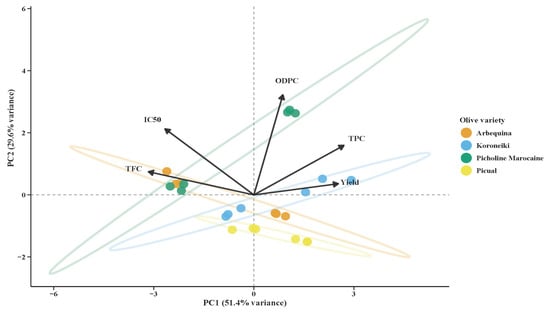
Figure 4.
Principal component analysis (PCA) of olive leaf biochemical traits by varieties. The first two principal components explain 51.4% and 29.6% of the total variance, respectively. Four olive varieties are represented: Arbequina (orange), Koroneiki (blue), Picholine Marocaine (green), and Picual (yellow), with individual samples shown as circles. Vectors indicate the contribution of chemical parameters to the principal components, including total flavonoid content (TFC), IC50 (antioxidant activity), ortho-diphenol compounds (ODPC), total phenolic compounds (TPC), and yield. The length and direction of each vector reflect the magnitude and direction of each variable’s influence on sample distribution. Ellipses represent 95% confidence intervals for each variety group.
Picholine Marocaine was linked to higher TFC and positioned further along PC2, reflecting elevated ODPC levels, a distinguishing characteristic from the other varieties.
Furthermore, Principal Component Analysis of olive leaf biochemical characteristics by season of collection (Figure 5) revealed a clear differentiation between the two harvest seasons, with varied chemical composition. Olive harvest samples were clustered on the positive side of PC1, with a high correlation between higher TPC and Yield. This indicates that the leaves harvested in the olive harvest season have a greater total phenolic content and more efficient extraction. These were compared to pruning season samples positioned closer towards the negative axis of PC1 and inclined towards TFC and IC50, indicating a greater flavonoid content but with lower antioxidant activity. The variable arrow direction and magnitude enlightened us regarding trait correlations. The yield and TPC were positively correlated and contributed the most to PC1, easily discriminating the olive harvest season group. ODPC showed a strong correlation with PC2, indicating seasonality in the levels of ortho-diphenols. IC50 and TFC were in the opposite direction to that of TPC, as predicted if the reduced phenolic content mirrored the reduced antioxidant activity. The tight clumping and non-overlapping ellipses around each season ensured consistent intra-seasonal profiles and strong inter-seasonal differences.
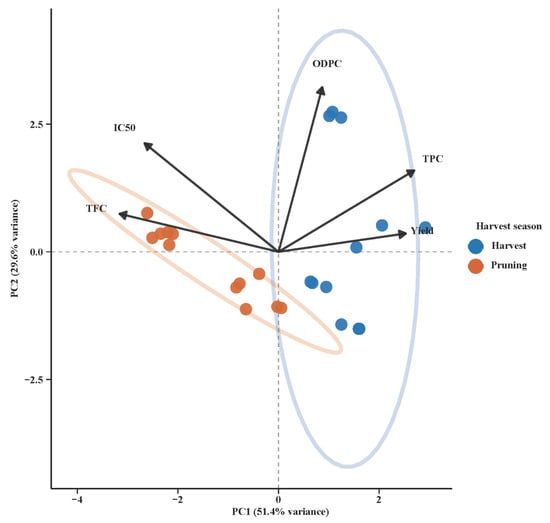
Figure 5.
PCA of olive leaf biochemical traits by sampling season. The first two principal components explain 51.4% and 29.6% of the total variance, respectively. Samples are grouped by harvest season: harvest period (blue) and pruning period (orange), with individual samples shown as circles. Vectors indicate the contribution of chemical parameters to the principal components, including total flavonoid content (TFC), IC50 (antioxidant activity), ortho-diphenol compounds (ODPC), total phenolic content (TPC), and yield. The length and direction of each vector reflect the magnitude and direction of each variable’s influence on sample distribution. Ellipses represent 95% confidence intervals for each seasonal group, showing clear separation between harvest and pruning periods along PC1.
3.4. Discrimination of Olive Leaf Samples by Variety and Harvest Season Using Linear Discriminant Analysis (LDA)
Linear discriminant analysis (LDA) was used to determine how well olive leaf biochemical traits (TPC, ODPC, TFC, IC50, and Yield) separated samples according to variety and harvesting season (Figure 6). The first two linear discriminants accounted for 91.8% of the total variance (LD1: 73.3%; LD2: 18.5%). providing excellent group separation. Good clustering patterns were observed for all four varieties: Koroneiki and Picual clustered on the negative axis of LD1, with high TPC and yield, whereas Picholine Marocaine and Arbequina occupied the positive axis, with greater variation in ODPC and TFC, respectively.
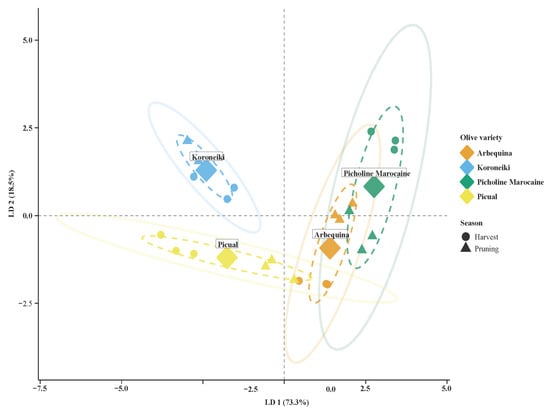
Figure 6.
Linear discriminant analysis (LDA) plot showing the separation of olive leaf samples according to variety and harvest season based on TPC, ODPC, TFC, IC50, and Yield. The first two linear discriminants explain 73.3% and 18.5% of the total variance, respectively. Four olive varieties are represented: Arbequina (orange), Koroneiki (blue), Picholine Marocaine (green), and Picual (yellow), with samples collected during harvest season (circles) and pruning season (triangles). Large diamonds indicate the centroid for each variety. Dashed ellipses represent 95% confidence intervals for each variety group, while solid ellipses show the overall distribution by season.
Seasonal variation was also evident within each variety, particularly in Arbequina and Picholine Marocaine, where the harvest and pruning seasons formed well-separated sub-clusters. These findings indicate that phenolic profiles are strongly influenced by seasonal conditions in certain cultivars. In contrast, Koroneiki exhibited minimal seasonal variation, suggesting greater biochemical stability. Overall, the LDA results highlight that both cultivar and harvest time are key determinants of the antioxidant and phenolic profiles of olive leaves, emphasizing their relevance for optimizing leaf utilization in functional applications.
3.5. Relationship Between Phenolic Content and Mineral Profile of Olive Leaves
3.5.1. Mineral Composition of Olive Leaf Varieties During Olive Harvest Season
The variety had a highly significant impact on all macro and micronutrients (p ≤ 0.001) (Table 3 and Table 4). Notably, Arbequina exhibited the highest levels of Phosphorus (P), Potassium (K), Magnesium (Mg), and Sulfure (S), with values of 2.68, 4.11, 1.11, and 0.3 g/kg DM, respectively. Picholine Marocaine ranked second for P, K, and S. with respective contents of 1.34, 3.69, and 0.26 g/kg DM, and had the lowest magnesium content at 0.95 g/kg DM. Koroneiki showed the lowest levels of P, K, and S with respective contents of 0.99, 2.86, and 0.19 g/kg DM, and a magnesium concentration of 1.1 g/kg DM. Calcium (Ca) content varied the most among the macronutrients across varieties, ranging from 13.09 g/kg DM in Picual, which had the highest content, to 9.45 g/kg DM in Picholine Marocaine, which had the lowest. Koroneiki and Arbequina had calcium contents of 12.17 and 12.93 g/kg DM, respectively. Picual also had the highest Nitrogen (N) content at 15.37 g/kg, followed by Arbequina, Koroneiki, and Picholine Marocaine, with respective contents of 15.1, 13.7, and 12.03 g/kg DM.
Table 3.
Macronutrients in olive leaves during olive harvest season.
Table 4.
Micronutrients in olive leaves during olive harvest season.
In terms of micronutrients (Table 4), Arbequina leaves excelled once again, the highest Boron content at 17.19 mg/kg DM, Picholine Marocaine had the highest Zinc (Zn) content at 12.03 mg/kg DM, followed by arbequina, koroneiki, and picual, with values of 10.99, 9.76, and 8.52 mg/kg DM, respectively. It also had the lowest Copper (Cu) and Manganese (Mn) contents, with values of 7.44 and 13.05 mg/kg DM, respectively. Koroneiki, on the other hand, exhibited the best Copper (Cu) and Manganese contents, with respective values of 29.48 and 24.98 mg/kg DM. For iron (Fe), Koroneiki again recorded the highest value (61.69 mg/kg DM), followed by Picholine Marocaine (57.16 mg/kg DM), Picual (48.46 mg/kg DM), and Arbequina (44.60 mg/kg DM).
3.5.2. Pearson Correlation Between Minerals and Total Phenolic Compounds
Pearson correlation analysis (Figure 7) revealed distinct patterns between TPC and mineral concentrations. Among the micronutrients, Fe showed the strongest positive correlation (r = 0.92), followed by Cu (r = 0.38) and Mn (r = 0.29), indicating their co-occurrence with phenolic compounds, whereas B exhibited a strong negative correlation (r = −0.92). Conversely, macronutrients exhibited strong negative correlations, particularly P (r = −0.91), S (r = −0.85), K (r = −0.73), and N (r = −0.65), while structural minerals Ca (r = −0.52) and Mg (r = −0.42) showed moderate inverse relationships. Zinc showed no significant linear correlation with TPC (r = −0.06), suggesting independent regulatory pathways. This correlation pattern highlights a metabolic dichotomy between anabolic minerals involved in primary metabolism (negative correlations) and catalytic micronutrients associated with secondary metabolite synthesis (positive correlations), reflecting fundamental resource allocation trade-offs in olive leaf biochemistry.
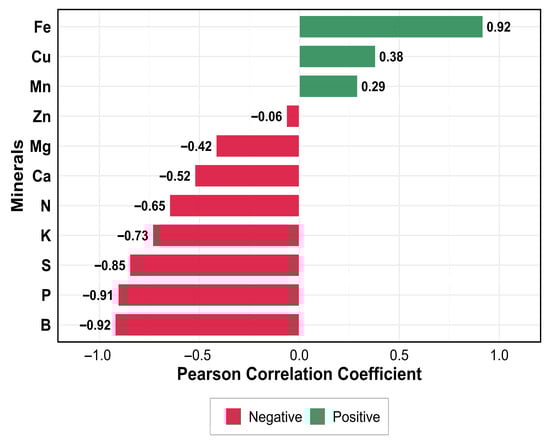
Figure 7.
Pearson correlation of minerals with the TPC.
3.5.3. Radar Chart of Minerals and TPC and Their Relationship Within Olive Varieties
Figure 8 presents radar plots illustrating normalized TPC and mineral profiles for four olive varieties. Each variety displayed a distinct chemical fingerprint. Koroneiki exhibited the most pronounced biochemical profile, with normalized values peaking for TPC, Cu, Mn, and Fe. This pattern indicates a strong co-accumulation of phenolics and micronutrients, potentially linked to enhanced oxidative stress responses or genotype-specific metabolic regulation.
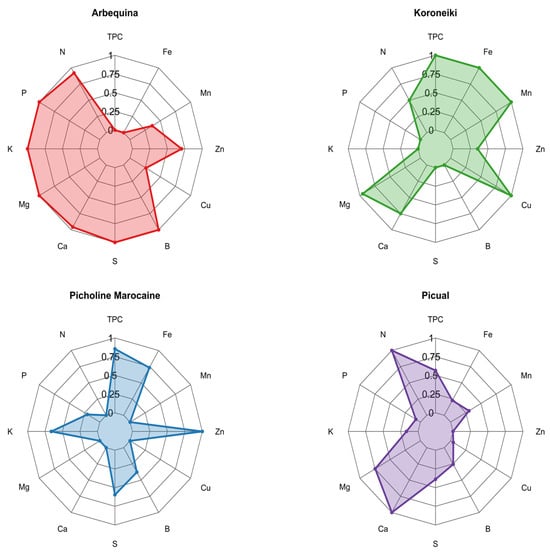
Figure 8.
Radar chart of TPC and mineral composition across olive varieties. Each plot displays the relative concentration (normalized scale 0-1) of mineral elements including nitrogen (N), iron (Fe), manganese (Mn), zinc (Zn), copper (Cu), boron (B), sulfur (S), calcium (Ca), magnesium (Mg), potassium (K), and phosphorus (P), along with TPC values. The four varieties shown are Arbequina (red), Koroneiki (green), Picholine Marocaine (blue), and Picual (purple). On the other hand, Arbequina revealed a contrasting profile, with maximum levels for nutrients such as P, K, S, and B, but the lowest TPC value. This suggests a metabolic prioritization toward primary nutrient assimilation over secondary metabolite synthesis. Picholine Marocaine demonstrated consistently high TPC (normalized ~0.9) alongside moderate to high levels of S, K, Fe and Zn suggesting a balanced profile that may contribute to both nutritional and antioxidant benefits. While, Picual showed intermediate values across most elements, but with a distinctive elevation in Ca, indicating a potential structural adaptation or varietal trait linked to cell wall stabilization.
4. Discussion
Olive leaves, being rich in phenolic compounds, can be utilized in the production of both medicinal and edible products. However, the phenolic content may vary depending on several factors. We observed that leaves collected in November (olive harvest season) contained significantly higher levels of phenolic compounds compared to those harvested in March (pruning season). These findings align with previous reports. For example, Fabbri et al. [24] demonstrated that phenolic compounds in olive leaves are more concentrated during the resting period (November–February), while their levels tend to decrease in spring (March–June). Similarly, Mitsopoulos et al. [25] reported that the total polyphenol content in Greek olive leaves of the Arbequina variety was approximately 17 mg/g FM in December, which was higher than that in April (14.5 mg/g FM). Martínez-Navarro et al. [6] demonstrated in their study on the variability of bioactive compounds in olive leaves throughout the agronomic cycle that aqueous extracts of olive leaves are generally richer in phenols of oleuropein, hydroxytyrosol, and verbascoside during the winter and spring seasons (December-June) than in autumn (September-December). This difference is likely due to the environmental conditions and how plants respond to them [11]. In November, cooler temperatures and shorter days may trigger the plant to produce more protective compounds such as phenolics. These compounds typically accumulate under abiotic stress conditions, including low temperatures and limited water availability, as part of the plant’s defense mechanisms [26,27].
Furthermore, unlike other phenolic compounds, flavonoids exhibited an inverse trend, showing a higher content in March than in November across all studied varieties. This can be explained by the increase in sunlight and UV radiation during early spring, which stimulates the production of flavonoids such as natural sunscreens. Unlike other phenolics that increase under cold or stress conditions, flavonoids respond more to light exposure [28,29]. In addition, these findings are consistent with those of Martínez-Navarro et al. [18], who reported a highly significant positive correlation between flavonoid content and precipitation while investigating the evolution of bioactive compounds in Arbequina olive leaves under different agronomic conditions. Furthermore, the relatively low concentrations of flavonoids observed in the present study may be associated with the high altitude of the sampling area (>500 m). This is in line with the observations of Zakraoui et al. [30], who found that Chetoui olive leaves collected from altitudes between 300 and 500 m and below 300 m exhibited higher flavonoid levels than those from altitudes exceeding 500 m.
Regarding ortho-diphenols, data on Moroccan olive leaves are scarce. Aouidi et al. [31] reported an ortho-diphenol content of 9.33 mg CAE/g DW in the methanolic extracts of Chemlal leaves harvested in June. Similarly, Ben Abdeljelil et al. [32] examined the same Tunisian Chemlal variety and found an ortho-diphenol content of 10.87 mg CAE/g FW in November, higher than the 9.27 mg CAE/g FW recorded in March which aligns with our findings.
Concerning the antioxidant activity of olive leaves, we found that IC50 varies from 12.34 to 25.02 ppm depending on the variety and harvest season. These values were less than those reported by Khelouf et al. [33], who reported that the IC50 of the studied varieties was between 30.22 and 87.94 ppm for ethanolic extracts of eight Tunisian and Algerian varieties. Also, Khaliq et al. [34] found that IC50 values were between 22.46 and 198 μg/mL for olive leaves in aqueous extracts of eight varieties grown in Pakistan. On the other hand, much higher values of 1380 and 1725 μg/mL for methanol and ethyl acetate extracts, respectively, were reported by Lfitat et al. [22], who studied the antioxidant activity of Picholine Marocaine olive leaves harvested in June in the region of Sefrou. However, Lins et al. [35] found a higher antioxidant activity with IC50 of 13.8 ppm for methanolic extracts of commercial olive leaves from Brazil. Moreover, Salah et al. [36] reported IC50 values ranging from 7.9 to 18.64 μg/mL for ethanolic extracts of olive leaves harvested in October for eight varieties grown in Tunisia, which aligns with the findings of the November extracts.
In addition, the study carried out by Mitsopoulos et al. [25] showed that Koroneiki has better antioxidant activity than Arbequina during the two years carried by the mentioned study, which is in perfect concordance with the results obtained by the present research. The good antioxidant activity of the studied olive leaves extracts can be attributed to the high content of phenolic compounds and their redox properties [37].
Multivariate analysis revealed that olive cultivar and harvest time greatly influence the biochemical composition of leaves. Through PCA, Koroneiki and Picual were identified as being rich in total phenolic content (TPC) and extraction yield, thus being good prospects for antioxidant-enriched extracts. Arbequina presented elevated flavonoid content (TFC) and IC50, revealing that elevated flavonoids do not always ensure greater antioxidant capacity. Picholine Marocaine divided along PC2, was marked by high orthodiphenol content (ODPC), mirroring its unusual phenolic profile. Seasonal effects were also detected. Samples collected during the olive harvest season clustered with higher TPC and extract yield, whereas those from the pruning season showed elevated TFC and IC50 values, reflecting clear seasonal shifts in phenolic composition and antioxidant potential. Notably, Koroneiki demonstrated remarkable biochemical stability across seasons, which is advantageous for applications requiring consistent bioactive content. The LDA further confirmed these trends, showing clear discrimination between both varieties and seasons, and revealing partial overlap between Picholine Marocaine and Arbequina, characterized by their higher flavonoid content but lower antioxidant activity.
The distinct chemical fingerprints revealed by radar chart analysis demonstrate variety specific metabolic strategies. The strong co-occurrence of TPC with copper, manganese, and especially iron in Koroneiki suggests these micronutrients play crucial roles in phenolic biosynthesis or stability, as copper serves as a cofactor for polyphenol oxidase while iron has an essential role in the biological redox systems of the plants [38], and is involved as a vital component of many enzymes that play an important role in plant physiological and biochemical processes [39].
Conversely, K, P, N, S, and B were negatively correlated with TPC, reflecting a potential growth-defense trade-off, whereby nutrient-driven growth may limit secondary metabolite accumulation. Under nutrient-rich conditions, plants tend to allocate more resources to primary metabolism, reducing the synthesis of defensive compounds such as phenolics [40,41]. Pasković et al. [42] similarly demonstrated that olive trees with higher macronutrient availability exhibit lower phenolic levels, supporting the notion that nutrient sufficiency enhances growth-related processes at the expense of secondary metabolism. In contrast, potassium deficiency restricts sucrose translocation from source to sink organs, leading to carbohydrate accumulation in leaves and an increased carbon supply for secondary metabolite biosynthesis [43]. Likewise, nitrogen deficiency reduces protein synthesis and growth, thereby increasing the availability of phenylalanine, a key precursor in the phenylpropanoid pathway, for the biosynthesis of phenolic compounds. According to Ritter and Schulz [44], the enhanced accumulation of phenolics under nitrogen limitation may be attributed to the stimulation of phenylalanine ammonia-lyase (PAL, EC 4.3.1.5) activity.
Distinct varietal responses also emerged. Arbequina displayed a nutrient profile indicative of preferential resource allocation toward primary metabolism (high N, P, K), favoring growth and energy production rather than phenolic defense, which may represent an alternative evolutionary strategy. In contrast, Koroneiki exhibited a synergistic relationship between phenolic content and micronutrients, making it particularly suitable for the production of high-antioxidant olive leaf extracts. Picholine Marocaine showed an intermediate behavior, offering a balanced compromise between yield and bioactive potential. These variety-specific nutrient-phenolic interactions have practical implications for product development and targeted fertilization strategies. Additionally, mineral composition should be considered in terms of bioavailability, as elements such as iron and copper can act as pro-oxidants, potentially affecting phenolic stability during processing. While these variety-specific patterns likely reflect genetic programming of uptake and biosynthetic pathways, the relationships warrant validation through larger sample sizes and statistical analysis, as environmental factors including soil characteristics, growing conditions, and harvest timing could influence the observed associations.
These findings underscore the importance of adjusting both variety selection and harvesting period with a view to target functional properties of olive leaf extracts.
5. Conclusions
The current study highlights that both olive cultivar and harvest period significantly affect the phenolic composition and antioxidant activity of olive leaf extracts. Multivariate statistical approaches, including PCA, LDA, and radar analysis, proved effective in differentiating varieties based on biochemical parameters such as TPC, TFC, ODPC, IC50, extract yield, and mineral content. Among the tested cultivars, Koroneiki and Picual exhibited notably high phenolic content and strong antioxidant activity. In contrast, Arbequina, although lower in polyphenols, was rich in macronutrients, while Picholine Marocaine displayed a unique profile with high levels of orthodiphenols and zinc. Seasonal variations impacted Arbequina and Picholine Marocaine more strongly, whereas Koroneiki maintained relatively stable biochemical characteristics over the two seasons. These findings offer important guidance for selecting olive cultivars and harvest timing to maximize the functional value of olive leaf by-products for nutraceutical or pharmaceutical applications.
Author Contributions
Conceptualization, N.O. and S.A.; methodology, S.A., I.J.I., S.R. and T.E.K.; software, S.A., M.D. and E.M.B.; validation, I.J.I., S.R., N.O. and M.D.; formal analysis, F.M. and E.M.B.; investigation, S.A.; resources, I.J.I., S.R., N.O. and T.E.K., data curation, S.A.; writing—original draft preparation, S.A.; writing—review and editing, S.A., I.J.I., S.R., N.O., M.D., T.E.K., F.M. and E.M.B.; visualization, S.A. and E.M.B.; supervision, I.J.I., S.R. and N.O.; project administration, I.J.I., S.R. and S.A.; funding acquisition, no funding has been acquired. All authors have read and agreed to the published version of the manuscript.
Funding
This research received no external funding.
Institutional Review Board Statement
Not applicable.
Informed Consent Statement
Not applicable.
Data Availability Statement
The original contributions presented in this study are included in the article. Further inquiries can be directed to the corresponding author.
Conflicts of Interest
The authors declare no conflicts of interest.
References
- International Olive Council. World Market of Olive Oil and Table Olives. 2024. Available online: https://www.internationaloliveoil.org/ (accessed on 31 March 2025).
- Ministère de L’agriculture. Filière Oléicole. 2019. Available online: https://www.agriculture.gov.ma/ (accessed on 28 July 2024).
- Besnard, G.; Terral, J.F.; Cornille, A. On the origins and domestication of the olive: A review and perspectives. Ann. Bot. 2018, 121, 385–403. [Google Scholar] [CrossRef] [PubMed]
- Marques, P.; Pádua, L.; Sousa, J.J.; Fernandes-Silva, A. Advancements in Remote Sensing Imagery Applications for Precision Management in Olive Growing: A Systematic Review. Remote Sens. 2024, 16, 1324. [Google Scholar] [CrossRef]
- Enaime, G.; Dababat, S.; Wichern, M.; Lübken, M. Olive mill wastes: From wastes to resources. Environ. Sci. Pollut. Res. 2024, 31, 20853–20880. [Google Scholar] [CrossRef]
- Martínez-Navarro, M.E.; Cebrián-Tarancón, C.; Alonso, G.L.; Salinas, M.R. Determination of the Variability of Bioactive Compounds and Minerals in Olive Leaf along an Agronomic Cycle. Agronomy 2021, 11, 2447. [Google Scholar] [CrossRef]
- Berbel, J.; Posadillo, A. Review and Analysis of Alternatives for the Valorisation of Agro-Industrial Olive Oil By-Products. Sustainability 2018, 10, 237. [Google Scholar] [CrossRef]
- Ammar, H.; Kholif, A.E.; Adegbeye, M.J.; Anele, U.Y.; Morsy, T.A.; Abdo, M.M.; Gouda, G.A.; Azzaz, H.H.; Ghzayel, S.; Zoabi, H.; et al. Optimizing Olive (Olea europaea) Leaves as a Sustainable Ruminant Feed: Effects of Chemical Treatments on Nutritional Value and Greenhouse Gas Emissions. Animals 2025, 15, 705. [Google Scholar] [CrossRef]
- Kermanshah, Z.; Samadanifard, H.; Moghaddam, O.M.; Hejrati, A. Olive leaf and its various health-benefitting effects: A review study. Pak. J. Med. Health Sci. 2020, 14, 1301–1312. [Google Scholar]
- Tylewicz, U.; Nowacka, M.; Martín-García, B.; Wiktor, A.; Gómez Caravaca, A.M. 5—Target sources of polyphenols in different food products and their processing by-products. In Polyphenols: Properties, Recovery, and Applications; Galanakis, C.M., Ed.; Woodhead Publishing: Cambridge, UK, 2018; pp. 135–175. [Google Scholar] [CrossRef]
- Talhaoui, N.; Taamalli, A.; Gómez-Caravaca, A.M.; Fernández-Gutiérrez, A.; Segura-Carretero, A. Phenolic compounds in olive leaves: Analytical determination, biotic and abiotic influence, and health benefits. Food Res. Int. 2015, 77, 92–108. [Google Scholar] [CrossRef]
- Zeitoun, A.A.; Abd-Rabou, H.S.; El Enshasy, H.A.; Dailin, D.J.; Zeitoun, M.A.A.; El-Sohaimy, S.A. Antioxidant and Anti-Diabetic Properties of Olive (Olea europaea) Leaf Extracts: In Vitro and In Vivo Evaluation. Antioxidants 2023, 12, 1275. [Google Scholar] [CrossRef]
- Razmpoosh, E.; Abdollahi, S.; Mousavirad, M.; Clark, C.C.T.; Soltani, S. The effects of olive leaf extract on cardiovascular risk factors in the general adult population: A systematic review and meta-analysis of randomized controlled trials. Diabetol. Metab. Syndr. 2022, 14, 151. [Google Scholar] [CrossRef]
- Mizutani, D.; Onuma, T.; Tanabe, K.; Kojima, A.; Uematsu, K.; Nakashima, D.; Doi, T.; Enomoto, Y.; Matsushima-Nishiwaki, R.; Tokuda, H.; et al. Olive polyphenol reduces the collagen-elicited release of phosphorylated HSP27 from human platelets. Biosci. Biotechnol. Biochem. 2019, 84, 536–543. [Google Scholar] [CrossRef] [PubMed]
- Vogel, P.; Machado, I.K.; Garavaglia, J.; Zani, V.T.; de Souza, D.; Dal Bosco, S.M. Polyphenols benefits of olive leaf (Olea europaea L) to human health. Nutr. Hosp. 2015, 31, 1427–1433. [Google Scholar]
- Mikami, T.; Kim, J.; Park, J.; Lee, H.; Soltani, S.; Yaicharoen, P.; Suidasari, S.; Yokozawa, M.; Yamauchi, K. Olive leaf extract prevents obesity, cognitive decline, and depression and improves exercise capacity in mice. Sci. Rep. 2021, 11, 12495. [Google Scholar] [CrossRef]
- Lorini, A.; Aranha, B.C.; Antunes, B.D.F.; Otero, D.M.; Jacques, A.C.; Zambiazi, R.C. Metabolic profile of olive leaves of different cultivars and collection times. Food Chem. 2021, 345, 128758. [Google Scholar] [CrossRef]
- Martínez-Navarro, M.E.; Cebrián-Tarancón, C.; Salinas, M.R.; Alonso, G.L. Evolution of Oleuropein and Other Bioactive Compounds in Arbequina Olive Leaves under Different Agronomic Conditions. Horticulturae 2022, 8, 530. [Google Scholar] [CrossRef]
- Singleton, V.L. Lamuela-Raventos: Analysis of total phenoles and other oxidation substartes and antioxidants by means of folin-ciocalteu reagent. Methods Enzymol. 1999, 299, 152. [Google Scholar]
- Djeridane, A.; Yousfi, M.; Nadjemi, B.; Boutassouna, D.; Stocker, P.; Vidal, N. Antioxidant activity of some algerian medicinal plants extracts containing phenolic compounds. Food Chem. 2006, 97, 654–660. [Google Scholar] [CrossRef]
- Blekas, G.; Psomiadou, E.; Tsimidou, M.; Boskou, D. On the importance of total polar phenols to monitor the stability of Greek virgin olive oil. Eur. J. Lipid Sci. Technol. 2002, 104, 340–346. [Google Scholar] [CrossRef]
- Lfitat, A.; Zejli, H.; Bousraf, F.Z.; Bousselham, A.; El Atki, Y.; Gourch, A.; Lyoussi, B.; Abdellaoui, A. Comparative assessment of total phenolics content and in vitro antioxidant capacity variations of macerated leaf extracts of Olea europaea L. and Argania spinosa (L.) Skeels. Mater. Today Proc. 2021, 45, 7271–7277. [Google Scholar] [CrossRef]
- Barea-Álvarez, M.; Delgado-Andrade, C.; Haro, A.; Olalla, M.; Seiquer, I.; Rufián-Henares, J.Á. Subtropical fruits grown in Spain and elsewhere: A comparison of mineral profiles. J. Food Compos. Anal. 2016, 48, 34–40. [Google Scholar] [CrossRef]
- Fabbri, A.; Galaverna, G.; Ganino, T. Polyphenol composition of olive leaves with regard to cultivar, time of collection and shoot type. Acta Hortic. 2008, 791, 95–102. [Google Scholar] [CrossRef]
- Mitsopoulos, G.; Papageorgiou, V.; Komaitis, M.; Hagidimitriou, M. Phenolic Profile of Leaves and Drupes of Ten Olive Varieties. Not. Bot. Horti Agrobot. Cluj-Napoca 2016, 44, 162–166. [Google Scholar] [CrossRef][Green Version]
- Ortega-García, F.; Peragón, J. The response of phenylalanine ammonia-lyase, polyphenol oxidase and phenols to cold stress in the olive tree (Olea europaea L. cv. Picual). J. Sci. Food Agric. 2009, 89, 1565–1573. [Google Scholar] [CrossRef]
- Yang, L.; Wen, K.S.; Ruan, X.; Zhao, Y.X.; Wei, F.; Wang, Q. Response of Plant Secondary Metabolites to Environmental Factors. Molecules 2018, 23, 762. [Google Scholar] [CrossRef]
- Miao, N.; Yun, C.; Shi, Y.; Gao, Y.; Wu, S.; Zhang, Z.; Han, S.; Wang, H.; Wang, W. Enhancement of flavonoid synthesis and antioxidant activity in Scutellaria baicalensis aerial parts by UV-A radiation. Ind. Crops Prod. 2022, 187, 115532. [Google Scholar] [CrossRef]
- Tian, X.; Hu, M.; Yang, J.; Yin, Y.; Fang, W. Ultraviolet-B Radiation Stimulates Flavonoid Biosynthesis and Antioxidant Systems in Buckwheat Sprouts. Foods 2024, 13, 3650. [Google Scholar] [CrossRef]
- Zakraoui, M.; Hannachi, H.; Pasković, I.; Vidović, N.; Pasković, M.P.; Palčić, I.; Major, N.; Ban, S.G.; Hamrouni, L. Effect of Geographical Location on the Phenolic and Mineral Composition of Chetoui Olive Leaves. Foods 2023, 12, 2565. [Google Scholar] [CrossRef]
- Aouidi, F.; Dupuy, N.; Artaud, J.; Roussos, S.; Msallem, M.; Gaime, I.P.; Hamdi, M. Rapid quantitative determination of oleuropein in olive leaves (Olea europaea) using mid-infrared spectroscopy combined with chemometric analyses. Ind. Crops Prod. 2012, 37, 292–297. [Google Scholar] [CrossRef]
- Ben Abdeljelil, Z.; Tekaya, M.; Mechri, B.; Flamini, G.; Hammami, M. Changes in volatiles of olive tree Olea europaea according to season and foliar fertilization. Int. J. Agric. Biol. 2017, 19, 1633–1639. [Google Scholar] [CrossRef]
- Khelouf, I.; Karoui, I.J.; Lakoud, A.; Hammami, M.; Abderrabba, M. Comparative chemical composition and antioxidant activity of olive leaves Olea europaea L. of Tunisian and Algerian varieties. Heliyon 2023, 9, e22217. [Google Scholar] [CrossRef] [PubMed]
- Khaliq, A.; Sabir, S.M.; Ahmad, S.D.; Boligon, A.A.; Athayde, M.L.; Jabbar, A.; Qamar, I.; Khan, A. Antioxidant activities and phenolic composition of Olive (Olea europaea) leaves. J. Appl. Bot. Food Qual. 2015, 88, 16–21. [Google Scholar]
- Lins, P.G.; Pugine, S.M.P.; Scatolini, A.M.; de Melo, M.P. In vitro antioxidant activity of olive leaf extract (Olea europaea L.) and its protective effect on oxidative damage in human erythrocytes. Heliyon 2018, 4, e00805. [Google Scholar] [CrossRef]
- Salah, M.B.; Abdelmelek, H.; Abderraba, M. Study of phenolic composition and biological activities assessment of olive leaves from different varieties grown in Tunisia. Med. Chem. 2012, 2, 107–111. [Google Scholar]
- Belščak-Cvitanović, A.; Durgo, K.; Huđek, A.; Bačun-Družina, V.; Komes, D. 1—Overview of polyphenols and their properties. In Polyphenols: Properties, Recovery, and Applications; Galanakis, C.M., Ed.; Woodhead Publishing: Cambridge, UK, 2018; pp. 3–44. [Google Scholar] [CrossRef]
- Asad, A.; Rafique, R. Effect of zinc, copper, iron, manganese and boron on the yield and yield components of wheat crop in Tehsil Peshawar. Pak. J. Biol. Sci. 2000, 3, 1615–1620. [Google Scholar] [CrossRef]
- Rout, G.R.; Sahoo, S. Role of iron in plant growth and metabolism. Rev. Agric. Sci. 2015, 3, 1–24. [Google Scholar] [CrossRef]
- Castrillo, G.; Teixeira, P.J.P.L.; Paredes, S.H.; Law, T.F.; De Lorenzo, L.; Feltcher, M.E.; Finkel, O.M.; Breakfield, N.W.; Mieczkowski, P.; Jones, C.D.; et al. Root microbiota drive direct integration of phosphate stress and immunity. Nature 2017, 543, 513–518. [Google Scholar] [CrossRef] [PubMed]
- Shan, L.; Oduor, A.M.O.; Huang, W.; Liu, Y. Nutrient enrichment promotes invasion success of alien plants via increased growth and suppression of chemical defenses. Ecol. Appl. 2024, 34, e2791. [Google Scholar] [CrossRef] [PubMed]
- Pasković, I.; Franić, M.; Chatzistathis, T.; Pongrac, P.; Žurga, P.; Germek, V.M.; Palčić, I.; Ban, S.G.; Zakraoui, M.; Marcelić, Š.; et al. Optimising Olive Leaf Phenolic Compounds: Cultivar and Temporal Interactions. Plants 2025, 14, 2789. [Google Scholar] [CrossRef] [PubMed]
- Gerardeaux, E.; Jordan-Meille, L.; Constantin, J.; Pellerin, S.; Dingkuhn, M. Changes in plant morphology and dry matter partitioning caused by potassium deficiency in Gossypium hirsutum (L.). Environ. Exp. Bot. 2010, 67, 451–459. [Google Scholar] [CrossRef]
- Ritter, H.; Schulz, G.E. Structural Basis for the Entrance into the Phenylpropanoid Metabolism Catalyzed by Phenylalanine Ammonia-Lyase. Plant Cell 2004, 16, 3426–3436. [Google Scholar] [CrossRef]


Disclaimer/Publisher’s Note: The statements, opinions and data contained in all publications are solely those of the individual author(s) and contributor(s) and not of MDPI and/or the editor(s). MDPI and/or the editor(s) disclaim responsibility for any injury to people or property resulting from any ideas, methods, instructions or products referred to in the content. |
© 2025 by the authors. Licensee MDPI, Basel, Switzerland. This article is an open access article distributed under the terms and conditions of the Creative Commons Attribution (CC BY) license (https://creativecommons.org/licenses/by/4.0/).