Abstract
We investigated the application of an adsorbent fabricated from satsuma mandarin peel biomass using coating with poly(glycidyl methacrylate) followed by sequential treatment with hydroxylamine and hydrochloric acid for the remediation of hexavalent chromium-polluted water. The adsorbent was characterized by Fourier transform infrared spectroscopy (FTIR), thermogravimetric analysis (TGA), scanning electron microscopy (SEM), and energy-dispersive X-ray spectroscopy (EDS). Batch adsorption experiments were conducted wherein initial solution pH, initial chromium concentration, contact time, and temperature were varied. The adsorption equilibrium experimental data were well simulated by the Langmuir and Jovanovic models, pointing toward the formation of a monolayer of adsorbed chromium ions. The total chromium adsorption capacity of the functionalized satsuma mandarin peel adsorbent reached 219.28 mg g−1 at initial pH 1.4 and 60 °C, markedly higher than 110.23 mg g−1 at 30 °C. Where Cr(VI) was the sole chromium oxidation state in the initial solutions synthesized from potassium dichromate, the presence of Cr(III) ions in the final solutions confirmed Cr(VI) reduction. The results of this study show that the functionalized satsuma mandarin peel biomass is a potential candidate for use in the removal of hexavalent chromium from aqueous solution through reduction-coupled adsorption.
1. Introduction
Recent studies have highlighted the contamination of surface and groundwater resources by hexavalent chromium, Cr(VI), largely due to exposure of chromite ore processing residues to leaching by rain, industrial spillages, and leakages together with improper waste disposal practices [1,2,3,4,5]. The data from these studies emphasize the need for continued research in the field of contaminated water remediation, with particular focus on treatment of effluents from industrial sources.
Besides adsorption, several techniques that have been used for the decontamination of Cr(VI)-bearing wastewaters include electrocoagulation [6], electrodialysis [7], electrodeionization [8], membrane filtration [9], ion exchange [10], chemical reduction [11], electrochemical reduction [12], and microbial reduction [13]. Nevertheless, adsorption onto plant-based lignocellulosic materials remains a viable option for Cr(VI) removal largely due to the ready availability of a wide variety of wastes generated in the agricultural industry. Moreover, adsorption is preferred for the simplicity associated with setup and operation of the water treatment equipment.
Satsuma mandarin peels (SMP) are composed of pectin (34.0%), cellulose (25.1%), soluble extracts (23.1%), hemicellulose (10.2%), lignin (4.3%), and ash (3.3%) [14]. Given the water solubility of pectin, 57.1% of SMP, being pectin and extracts, is soluble in water. Therefore, the application of SMP in its natural state would lead to the release of the organic materials into treated water. Even with facile pretreatment of the SMP to remove water soluble components prior to use, the residual cellulose, hemicellulose, and lignin would still be plagued by problems of poor adsorption capacity. For instance, studies that used groundnut husk, banana peel, cranberry kernel shell, rosehip seed shell, and mosambi peel as Cr(VI) adsorbent reported low adsorption capacities of 2.4 mg g−1, 10.4 mg g−1, 6.8 mg g−1, 15.2 mg g−1, 26.1 mg g−1, respectively [15,16,17]. Preferred structures of adsorbent targeted for the sequestration of anionic species from aqueous solution are cationic functional groups, which are typically nonexistent in the lignin, cellulose, and hemicellulose found in natural plant-based adsorbents. By introducing cationic functional groups based on protonated or quaternary amines, amine modification of polymers grafted onto lignocellulosic materials has led to significant augmentation of adsorption capacity, making polymer grafting followed by amine modification a worthwhile approach to delve into [18,19,20].
In a recent study, Cr(VI) removal was achieved by chromate ion sequestration through electrostatic interaction with protonated amide groups followed by redox reaction with nearby hydroxymethyl groups to yield ions of trivalent chromium, Cr(III), and carboxyl groups [21]. Therefore, the addition of amines to grafted epoxy moieties, which results in vicinal amino alcohols [22], seems appealing for the synthesis of adsorbents for Cr(VI) removal given the amenability of amine and hydroxyl groups to protonation and oxidation, respectively. However, adsorbent modification by grafting of epoxy-bearing species succeeded by functionalization with an amine reagent has received scant attention. The present study adopted an approach involving the graft polymerization of glycidyl methacrylate onto the surfaces of satsuma mandarin (Citrus unshiu) peel biomass particles followed by functionalization with hydroxylamine and cationization using hydrochloric acid. In doing so, the study provides insights into the engineering of high capacity Cr(VI) adsorbent from satsuma mandarin peel biomass. Batch adsorption experiments were conducted to assess the efficacy of the fabricated adsorbent in Cr(VI) removal. Experimental data were analyzed by simulation using reaction kinetic, adsorption equilibrium isotherm, and thermodynamic model equations.
2. Materials and Methods
2.1. Adsorbent Fabrication
Satsuma mandarin peels were obtained from fruits purchased at a local market in Vanderbijlpark, Gauteng, South Africa. The fruits were washed under running tap water and their peels were air-dried, initially under sunlight and finally in an oven, to a constant weight at 80 °C. The dried peels were milled and then sieved, with particles in the 425–595 μm size range being selected for use. Synthesis of the functionalized SMP, which culminated in an illustration of the tentative structure of the protonated amine polymer, is depicted in Scheme 1. Specifically, a suspension comprising 75 g of SMP, 450 mL of acetone (99.8%, Associated Chemical Enterprises, Johannesburg, South Africa) and 900 mL of distilled water was brought to a boil under constant magnetic stirring at 1000 rpm. Thereafter, 3 g of benzoyl peroxide (BPO, 98%, Merck, Johannesburg, South Africa) was added, followed by 150 mL of glycidyl methacrylate (GMA, 97%, Merck, Johannesburg, South Africa) dropwise, and the reaction mixture was refluxed at 70 °C for 2 h. Next, 300 mL of an aqueous solution containing 80 g (2 mol) of sodium hydroxide (NaOH, 99%, Merck, Johannesburg, South Africa) and 139 g (2 mol) of hydroxylammonium chloride (NH2OH.HCl, 98%, Rochelle Chemicals, Johannesburg, South Africa) was added dropwise, and refluxing at 70 °C was continued for 8 h. Subsequently, the bulk of the fluid in the reaction mixture was drained over a sieve and the residue was washed under jets of pressurized water until the filtrate was colorless. The washed residue was suspended and stirred for 2 h in 1000 mL of 1 M hydrochloric acid (HCl) previously prepared by diluting 98.2 mL of 32% HCl (Associated Chemical Enterprises, Johannesburg, South Africa) with distilled water. The protonated amine functionalized biomass obtained after stirring in HCl, designated PAF-SMP, was washed several times in distilled water, wet-sieved using distilled water, and then dried to constant weight at 80 °C. The fraction with particles in the 425–177 μm size range was used as the adsorbent.
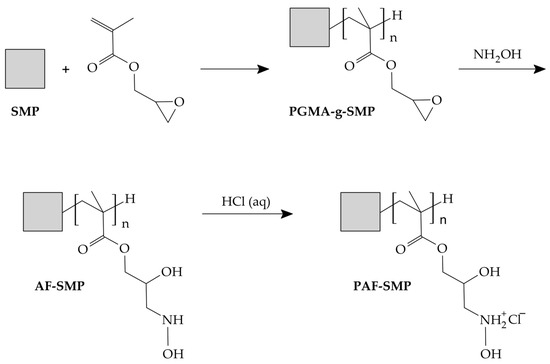
Scheme 1.
Proposed pathway for fabrication of protonated amine functionalized satsuma mandarin peel biomass.
2.2. Physicochemical Characterization of Adsorbent and Parent Biomass
Functional group analysis was conducted by Fourier transform infrared (FTIR) spectroscopy using a Cary 630 FTIR spectrophotometer (Agilent Technologies, Santa Clara, CA, USA) equipped with an attenuated total reflection unit with a diamond crystal. Spectral data were collected within the 650–3750 cm−1 range using a resolution of 16 cm−1. Thermal analysis was carried out by thermogravimetric analysis (TGA) on a Discovery TGA 5500 system (TA Instruments, New Castle, DE, USA). Samples were heated under nitrogen flow, initially from ambient temperature to 40 °C at 5 °C min−1 then held at 40 °C for 10 min prior to heating to 760 °C at 5 °C min−1. Derivative thermogravimetric (DTG) data was computed by differentiation of the function relating residual mass and pyrolysis time. Morphological and elemental analyses were accomplished by scanning electron microscopy (SEM) and energy-dispersive X-ray spectroscopy (EDS), respectively. Prior to examination under a JSM-IT300 microscope (Jeol, Akishima, Japan), samples were coated with a layer of gold on a Q150R sputter coater (Quorum Technologies, East Essesx, UK). EDS data was collected using a connected X-MaxN detector (Oxford Instruments, Abingdon, UK).
2.3. Adsorbent Performance Testing
Stock Cr(VI) solution was prepared by dissolving potassium dichromate (K2Cr2O7, 99%, Merck, Johannesburg, South Africa) in distilled water. Acidified working Cr(VI) solutions of desired Cr(VI) concentration were prepared by addition of 32% HCl to aliquots of stock Cr(VI) solution and dilution with distilled water. Where appropriate, the pH of the working Cr(VI) solution was further adjusted by dropwise addition of 10% (w/v) aqueous NaOH solution. In a typical experiment, PAF-SMP was suspended and agitated in working Cr(VI) solution for the required time prior to retrieval of the supernatant and analysis for the determination of Cr(VI) and total Cr concentration. All adsorption experiments were conducted in duplicate, and the reported results are mean values. Standard deviations of each duplicate are depicted as error bars on the corresponding graphs.
2.3.1. Preliminary pH Selection Tests
Fifty milliliters of working Cr(VI) solution was placed in a flask and magnetically stirred at 30 °C during the entire period of the experiment. Thereafter, 500 mg of PAF-SMP was added and 100 μL samples of the solution were intermittently drawn. The concentration of Cr(VI) in each sample, designated Ct (mg L−1) where the subscript t (min) represents the lapse of time between when the adsorbent was added and a sample was drawn, was determined by colorimetry after chromogenation with a solution of 1,5-diphenylcarbazide (Industrial Analytical (Pty) Ltd., Johannesburg, South Africa) acidified with nitric acid (55%, Rochelle Chemicals, Johannesburg, South Africa). The integrated rate equation for pseudo-nth order (PNO) reactions, expressed as Equation (1), was fitted to the experimental data relating Ct to t for computation of the equation parameters. Afterwards, the differential equation, given by Equation (2), was used for calculation of the rate of Cr(VI) removal, designated vt (mg L−1 min−1).
where C0,PNO (mg L−1) is the initial solution concentration as predicted by the pseudo-nth order equation, kPNO (Ln−1 mg1−n min−1) denotes the rate constant of the pseudo-nth order equation and n (unitless) represents the order of the reaction, respectively.
2.3.2. Adsorption Equilibria and Thermodynamics Tests
Fifty milligrams of PAF-SMP were added to 50 mL of each pH 1.4-adjusted working Cr(VI) solution of a particular Cr(VI) concentration. Different batches of the suspensions were shaken at 180 rpm in an incubated orbital shaker maintained at a specific temperature for 24 h. Thereafter, the adsorbent was separated from the residual solution by centrifugation and decantation. Samples of each initial and residual solution were taken for determination of Cr(VI) concentration, CCr(VI) (mg L−1), by colorimetry at a wavelength of 542 nm on a SpectraMax ABS Plus ultraviolet–visible (UV–Vis) spectrophotometer (Molecular Devices, San Jose, CA, USA) using acidified 1,5-diphenylcarbazide solution as the chromogenic agent [23], and for determination of total Cr concentration, CTotCr (mg L−1), by inductively–coupled plasma optical emission spectrometry (ICP–OES) on an Agilent 700 ICP optical emission spectrometer (Agilent Technologies, Santa Clara, CA, USA). The concentration of Cr(III), CCr(III) (mg L−1), in the residual solutions was computed by subtraction of the concentration of Cr(VI) from that of total chromium [Equation (3)]. The quantity of chromium adsorbed at equilibrium, qe (mg g−1), was calculated using Equation (4). The equations of the Langmuir, Freundlich, and Jovanovic models, expressed as Equation (5), Equation (6) and Equation (7), respectively, were fitted to the experimental data relating the quantities of total chromium in the solution and on the adsorbent at adsorption equilibrium.
where CTotCr,0 (mg L−1) and Ce,TotCr,e (mg L−1) represent the concentration of total Cr in the initial solution and in the residual solution prevailing at adsorption equilibrium, respectively, V (L) denotes the volume of the solution, and m (g) is the mass of the adsorbent; qmaxL (mg g−1) represents the Langmuir maximum adsorbent loading and KL (L mg−1) is the Langmuir isotherm constant [24]; KF (mg g−1 Ln mg−n) and nF (unitless) are Freundlich isotherm constants that relate to adsorption capacity and intensity of adsorption, respectively [25]; qmaxJ (mg g−1) denotes the Jovanovic maximum adsorbent loading and KJ (L mg−1) is the Jovanovic isotherm constant [26].
Based on the assumption that HCrO4− ions were the model adsorbate species contained in the Cr(VI) solutions, values of the standard equilibrium constant, K° (unitless), for adsorption onto the PAF-SMP were calculated using Equation (8) expressed as:
where K (L mg−1) is the isotherm constant of the best-fitting isotherm model, Mr(HCrO4−) (117 mg mmol−1) represents the molar mass of the HCrO4− ions, and MH2O (55,500 mmol L−1) denotes the molar concentration of pure water [27]. Thereafter, K° was plotted against incubation temperature, T (K), and values of the standard enthalpy change in adsorption, ΔH° (kJ mol−1) and standard entropy change in adsorption, ΔS° (kJ mol−1) were calculated by fitting the van’t Hoff equation [Equation (9)] to the experimental data. Values of the standard Gibbs free energy change in adsorption, ΔG° (kJ mol−1), were also calculated using values of K° according to Equation (10).
where R (0.008314 kJ mol−1 K−1) is the molar gas constant and T (K) is as defined earlier.
2.3.3. Model Equation Fitting
For each reaction kinetic and adsorption isotherm model, an array of values of the dependent variable were calculated by substitution of the corresponding values of the dependent variable and initial values of the model equation parameters into the model equation. Thereafter, the mean squared error (MSE) statistic was computed in accordance with Equation (11). Using the Solver add-in of Microsoft Excel, the value of MSE was then minimized by an iterative process involving variation in the model equation parameters. The corresponding values of the chi-square (χ2) statistic and the coefficient of determination (R2) were then calculated using Equations (12) and (13), respectively.
where xi,expt represents the measured or experimentally determined values of the dependent variable, xi,mod is the model-predicted value of the dependent variable, xave,expt is the average of the experimentally determined quantities of the dependent variable, N is the number of measurements in the experimental data set, and P is the number of parameters in the particular model equation.
3. Results and Discussion
3.1. Physicochemical Properties of Fabricated Adsorbent
Figure 1 presents the FTIR spectra of SMP, PAF-SMP, and spent PAF-SMP. In Figure 1a, the spectrum of the adsorbent, PAF-SMP, is overlaid with that of its parent biomass, SMP, to illustrate the effects of the three-step adsorbent fabrication process depicted in Scheme 1. As a result of adsorbent fabrication, the SMP spectral peak at 1615.8 cm−1, corresponding to C=C stretch vibrations in olefinic sections of lignin [28], disappeared. The disappearance of the C=C stretch vibration peak illustrates participation of the olefinic lignin sections in the addition polymerization reactions involved in the initial poly(glycidyl methacrylate) (PGMA) grafting step. The involvement of lignin C=C bonds in PGMA grafting, which is accompanied by a change in the state of carbon atom hybridization from sp2 to sp3, is confirmed by signal attenuation at 2855.1 cm−1 and 2924.1 cm−1, assigned to C-H stretching vibrations. Signal amplifications responsible for the PAF-SMP spectral bands peaking at 3332.2 cm−1, 1716.4 cm−1, 1444.3 cm−1, 1254.2 cm−1, 1149.9 cm−1, 1053.0 cm−1, and 747.3 cm−1, ascribed to O-H stretching, C=O stretching, C-O-H bending, C-O stretching, C-O stretching, C-O stretching, and -CH2- rocking vibrations, respectively [29,30], attested to the presence of hydroxyl, ester, methyl, and methylene groups that are typical of PGMA chains with opened epoxy rings. In particular, the peak at 3332.2 cm−1, which depicts a shift from the SMP spectral peak at 3289.4 cm−1, corroborates the augmentation of the hydroxyl functional groups by the ring-opening reaction with hydroxylamine during the penultimate stage of adsorbent fabrication.
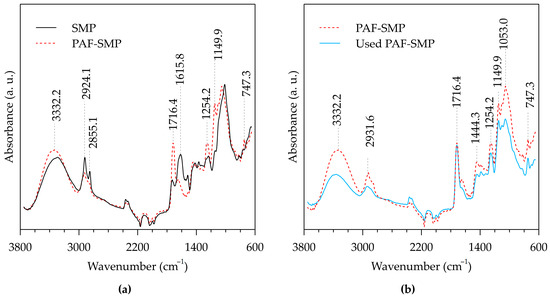
Figure 1.
FTIR spectra of SMP, PAF-SMP, and used PAF-SMP from the standpoint of (a) adsorbent fabrication, and (b) adsorbent application in aqueous Cr(VI) removal.
Figure 1b compares the spectra of fresh and used PAF-SMP to depict the effects of adsorbent application in aqueous Cr(VI) removal. The adsorption process caused signal weakening for the peaks at 1254.2 cm−1, 1149.9 cm−1 and 1053.0 cm−1, connected to C-O; at 2924.1 cm−1, related to C-H; and at 3332.2 cm−1 and 1444.3 cm−1, associated with O-H. Given that each -CHOH- moiety present on the side chains of the grafted PGMA backbone possesses one C-O, one C-H, and one O-H bond, the aforementioned signal attenuations indicated the consumption of -CHOH-, accompanied by Cr(VI) reduction in accordance with Equation (14).
The SEM micrographs of SMP and PAF-SMP are presented in Figure 2. The low-magnification micrographs display a rugose structure for both SMP (Figure 2a) and PAF-SMP (Figure 2d). The SMP micrograph depicts several pit-like structures surrounded by cavities that yield numerous, relatively large pores. In contrast, the micrograph of PAF-SMP shows a structure with fewer, smaller pores, indicating pore-filling and a consequent decrease in porosity due to the formation of a PGMA layer on the adsorbent surfaces. The high-magnification micrograph of SMP (Figure 2b) displays undulated surfaces and sharp edges on the rims of the pit-like structures, whereas the surfaces of the PAF-SMP (Figure 2e) appear to be smooth, and the edges on the rims of the pit-like structures are curved. The changes in texture of both the surfaces and the pit-like structure rims confirmed the deposition of a thin layer of PGMA on the SMP surface.

Figure 2.
(a) Low and (b) high magnification SEM micrographs of SMP; (c) EDS spectrum of SMP; (d) low and (e) high magnification SEM micrographs of PAF-SMP; (f) EDS spectrum of PAF-SMP.
Apart from the peak around 2.13 keV, which is attributed to the sputter-coated gold, the EDS spectra of SMP (Figure 2c) exhibited dominant peaks at 0.28 keV and 0.52 keV, which are assigned to carbon and oxygen of the carbohydrates (cellulose and hemicelluloses) exposed on the material’s surface. The spectrum of SMP showed minor peaks at 3.32 and 3.69 keV, which indicate the presence of potassium (K) and calcium (Ca), respectively. The K and Ca formed part of the mineral constituents of the SMP [31]. Coating of the SMP with PGMA masked the mineral constituents resulting in absence of the K- and Ca-ascribed peaks on the PAF-SMP spectrum (Figure 2f). The PAF-SMP spectral peaks at 0.27 keV and 0.52 keV, which resemble those of on the SMP spectrum, are therefore attributed to carbon and oxygen atoms of the coated PGMA layer. The uptake of chloride ions, which electrostatically interacted with the protonated hydroxyl amine moieties of the adsorbent surface, was signified by appearance of the moderately intense peak at 2.63 keV.
The mass loss and mass loss rate curves for the thermogravimetric analysis of SMP and PAF-SMP, presented in Figure 3, show three stages of mass loss. The first stage, which corresponds to moisture evaporation within the 40–150 °C interval, resulted in mass loss of only 1.6% for PAF-SMP in comparison to 4.9% for SMP. The impervious layer of PGMA deposited on the PAF-SMP surface prevented the evaporation of water adhering to the surfaces of the plant material beneath the PGMA layer, hence the lower mass loss recorded for PAF-SMP. The second stage, marked by accelerated mass loss due to the decomposition of the polymeric lignocellulosic components. By the end of the second stage, all the hemicelluloses and celluloses would have been decomposed and some of the residue comprises yet to be decomposed lignin. The third stage entails sustained degradation of lignin [32]. It can be envisaged from the mass loss curves (Figure 3a) that the onset temperature of the second stage was higher for degradation of PAF-SMP than for SMP, indicating an apparent increase in thermal stability by PGMA grafting followed by modification with hydroxylamine and hydrochloric acid. The corresponding mass loss rate curve of the SMP displays two peaks at 223.2 °C and 323.2 °C that are ascribed to the decomposition of hemicellulose and cellulose, respectively. The mass loss rate curve of PAF-SMP also features consecutive peaks, albeit at the higher temperatures of 292.1 °C and 392.9 °C (Figure 3b). Interestingly, the absolute difference between the temperatures of the consecutive peaks of the mass loss rate curve of SMP and PAF-SMP is 100.0 °C and 100.8 °C, respectively. This similarity suggests that comparable amounts of thermal energy are required for hemicellulose and cellulose decomposition in SMP and PAF-SMP, which implies similarity of the thermal stabilities of the hemicellulose and cellulose in SMP and PAF-SMP. In turn, comparable thermal stabilities of the hemicellulose and cellulose signify that lignin was the sole provider of the reaction sites for PGMA grafted. In other words, neither hemicellulose nor cellulose were involved in PGMA grafting and, owing to the impervious nature of the PGMA layer, subsequent modification agents did not reach the internal part of the PGMA grafted SMP particles for reaction with the carbohydrates.
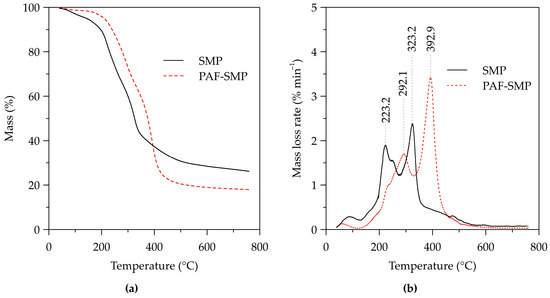
Figure 3.
Thermogravimetric analysis curves of SMP and PAF-SMP: (a) Mass loss and (b) mass loss rate curves.
3.2. Adsorption Studies
3.2.1. Initial Solution pH Selection
The kinetic plots of Ct versus t for the treatment of solutions with initial pH of 1.4, 2.7, 3.9, 4.9, 6.3, and 7.4 with PAF-SMP are displayed in Figure 4a, which also shows the fitted curves corresponding to pseudo-nth order kinetics. The parameters and error statistics of the fitted equations are summarized in Table 1. It is clear that the equation for pseudo-nth order reaction kinetics provided good fit to the experimental data and could be used for computation of the rate of Cr(VI) removal at any time during the experiment. Variations in the computed rates of removal with contact time are presented in Figure 4b.
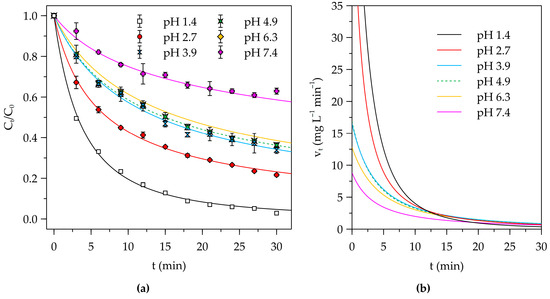
Figure 4.
(a) Kinetic plots of residual fraction of Cr(VI) concentration as a function of contact time with fitted curves corresponding to the PNO kinetic equation for PAF-SMP-treated solutions of different initial pH. (b) Variation in fitted PNO model-derived rates of Cr(VI) removal. (Fixed experimental conditions: V = 50 mL, m = 500 mg, T = 25 °C).

Table 1.
Parameters and error statistics of fitted pseudo-nth order reaction kinetic equation for PAF-SMP-mediated Cr(VI) removal from solutions of different initial pH.
Cr(VI) removal from the pH 1.4 solution, which is associated with the highest rate constant of the pseudo-nth order equation (Table 1), the lowest residual fraction of Cr(VI) of 0.029 at the end of the 30 min experiment (Figure 4a), and the highest rates of Cr(VI) removal throughout the initial 10 min phase (Figure 4b), was most effective. In the strongly acidic conditions of the pH 1.4 solution, firstly, the PAF-SMP retained its protonated nature featuring an extensive distribution of terminal hydroxylammonium (-RNH2OH+) groups on the side chains of the grafted polymeric layer. The protonated surface thus had a high affinity for hydrogen chromate (HCrO4−) and dichromate (Cr2O72−) ions in the solution. Secondly, the high concentration of hydronium (H3O+) ions resulted in conversion of a fraction of the HCrO4− and Cr2O72− ions into molecular chromic acid (H2CrO4) according to Equations (15) and (16), respectively. The in situ production of H2CrO4 provided an additional pathway for Cr(VI) removal involving the formation of chromate esters, largely using the hydroxyl groups of the carbons occupying the alpha position relative to the protonated amine-bearing carbon. Thirdly, the formation chromate esters initiated a series of redox reactions in which Cr(VI) is reduced the Cr(III) as exemplified by Equation (17). What is more, the strong acidity of the pH 1.4 solution provided for the high demand for H3O+ ions for the redox reactions.
The efficiency of Cr(VI) removal decreased with increase in pH. For instance, the initial removal rate fell markedly from the highest value of 33.29 mg L−1 min−1 recorded for the pH 1.4 solution to 21.24 mg L−1 min−1 for the pH 2.7 solution then to 10.30 mg L−1 min−1 for the pH 3.9, before continuing to decrease subtly to 10.22 mg L−1 min−1 for the pH 4.9 solution and then to 8.44 mg L−1 min−1 and 5.49 mg L−1 min−1 computed for the pH 6.3 and 7.4 solution, respectively. The decrease in acidity led to less provision of H3O+ ions for the redox reactions, and deprotonation of -RNH2OH+ groups, rendering them ineffective in electrostatic interaction with the Cr(VI) anions in solution. Moreover, the dwindling concentration of H3O+ ions tended to limit the in situ production of the chromic acid, thus limiting the efficacy adsorption via chromate ester formation. The initial solution pH of 1.4 was selected for all subsequent experiments.
3.2.2. Effects of Temperature and Initial Adsorbate Concentration on Chromium Speciation in Residual Solution
Figure 5 compares the relative abundances of the Cr(VI) and Cr(III) ions in the batches of the solutions existing after attainment of adsorption equilibrium (henceforth referred to as the equilibrium solutions). Given that the sole chromium source in the initial solutions was K2Cr2O7, the emergence of Cr(III) in the equilibrium solutions confirmed the formation of Cr(III) ions by Cr(VI) reduction in the adsorbed phase, as alluded to earlier. In each batch of equilibrium solutions, Cr(VI) became increasingly abundant as the concentration of the initial solution increased. These outcomes were anticipated because, as the surfaces of the PAF-SMP were occupied by progressively larger quantities of the Cr(VI), there were fewer numbers of available adsorption sites and the point of saturation was approached. Consequently, more and more Cr(VI) ions remained in solution as initial solution concentration was increased. Progressive increase in the abundance of Cr(VI) ions innately led to a progressive decrease in the abundance of Cr(III) ions.
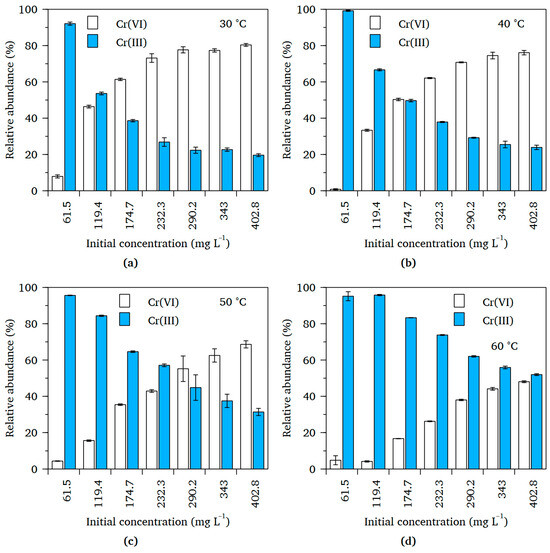
Figure 5.
Comparison of relative abundances of Cr(VI) and Cr(III) ions in the equilibrium solutions obtained at different temperatures for chromium uptake from Cr(VI) solution by PAF-SMP: (a) 30 °C, (b) 40 °C, (c) 50 °C and (d) 60 °C. (Fixed experimental conditions: Initial pH = 1.4, V = 50 mL, m = 50 mg, t = 24 h).
Changes in both the initial Cr(VI) solution and the incubation temperature also influenced the number of equilibrium solutions that had Cr(III) ions as the predominant Cr species in solution. In each of the batches incubated at 30 and 40 °C, only the two equilibrium solutions corresponding to the initial solutions of the least Cr(VI) concentration, that is 61.5 mg L−1 and 119.4 mg L−1, had more Cr(III) than Cr(VI) ions. When the temperature was increased to 50 °C, two more equilibrium solutions had a higher proportion of Cr(III) ions. Incubation of the working solutions at 60 °C yielded equilibrium solutions containing more Cr(III) than Cr(VI) ions in all instances. The increase in numbers of solutions with Cr(III) ions as the predominant Cr species indicates an increase in the extent of Cr(VI) reduction with increase in incubation temperature. This suggests that the reduction-coupled Cr(VI) adsorption process was endothermic.
3.2.3. Isotherms and Thermodynamics
Figure 6a shows the isotherms for chromium adsorption onto PAF-SMP following contact with Cr(VI) solutions of different initial concentration. Increasing the incubation temperature resulted in a sharp rise in the quantities of chromium adsorbed at equilibrium and, ultimately, higher maximum adsorbent loading values. Analysis of the isotherm data using the Langmuir, Freundlich, and Jovanovic models yielded the fitted curves displayed in Figure 6b–e. The values of the computed parameters and statistics for the fitted curves are presented in Table 2. The equations of both the Langmuir and Jovanovic models, which were linked to high R2 values in the 0.9898–0.9960 range in comparison to 0.95534–0.9814 recorded for the Freundlich model, provided good fit to the experimental data. Compliance of the experimental data with the Langmuir and Jovanovic models suggested that the adsorbed chromium species tended to form a single layer on the PAF-SMP surfaces; the active sites on the adsorbent surfaces had similar interactions with the chromium species; and the chromium species in the adsorbed layer had minimal interactions amongst each other. The relatively poor fitting of the Freundlich isotherm model equation implied a lack of heterogeneity of the PAF-SMP surfaces in addition to the absence of multi-layer adsorption featuring interactions amongst the adsorbed chromium species.
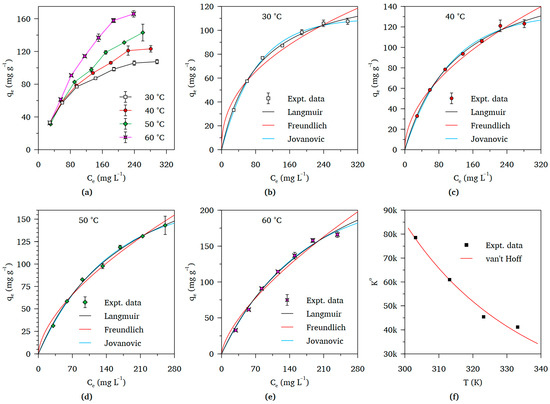
Figure 6.
Adsorption and thermodynamic plots for chromium uptake from Cr(VI) solution by PAF-SMP: (a) Collated isotherm plots for equilibria established at different temperatures; Individual isotherms plots with fitted curves of Langmuir, Freundlich, and Jovanovic models equations: (b) 30 °C, (c) 40 °C, (d) 50 °C, and (e) 60 °C; (f) Non-linear van’t Hoff thermodynamic plot (Fixed experimental conditions: Initial pH = 1.4, V = 50 mL, m = 50 mg, t = 24 h).
Table 2.
Parameters and error statistics of fitted equilibrium isotherm model equations for chromium adsorption from Cr(VI) solution onto PAF-SMP.
In all but one instance, the R2 values for were higher for the fitted equation of the Jovanovic than the Langmiur model. However, in the single instance corresponding to 40 °C where the Jovanovic model equation fitting procedure yielded a lesser value of R2, only a very small difference existed. Accordingly, the Jovanovic maximum adsorbent loading values corresponding to each incubation temperature were regarded as the adsorption capacities of the PAF-SMP.
Values of K° and ΔG° calculated using the Jovanovic isotherm model, together with those of the ΔH° and ΔS° computed by fitting the van’t Hoff equation to the plot of K° versus T (Figure 6f), are presented in Table 3. All computed values of the standard Gibbs free energy change were negative, indicating the spontaneity of the process of chromium adsorption onto PAF-SMP. The negative value of the standard enthalpy change signified that the adsorption process is exothermic or energy-releasing, whereas the positive value of the standard entropy change indicates increased randomness or disorder of Cr(VI)1ions in the liquid film surrounding the PAF-SMP particles relative to the bulk solution [33].
Table 3.
Computed values of thermodynamic parameters of chromium adsorption from Cr(VI) solution onto PAF-SMP.
Substitution of K° from Equation (10) into Equation (11) yields the relationship between standard Gibbs free energy change and entropy change in adsorption given by Equation (18).
As can be envisaged from Table 3, each temperature-dependent entropy term of Equation (18), represented by −TΔS°, was substantially less negative that the corresponding enthalpy term in all instances. Therefore, it can be noted that the contribution of enthalpy change to spontaneity of the adsorption process outweighs that of entropy change and that the adsorption process is enthalpy-driven.
3.2.4. Comparison of PAF-SMP with Other Polymer Grafted Cr(VI) Adsorbents
Anirudhan et al. [33] reported the grafting of poly(glycidyl methacrylate) onto cellulose followed by modification with quaternary amines and was established the Cr(VI) adsorption capacity to be 123.60 mg g−1 at 30 °C. This adsorption capacity is comparable to the value of 110.23 mg g−1 for PAF-SMP, also determined at 30 °C. However, it is worthwhile to note that the determination of the adsorption capacity of the quaternary amine-modified adsorbent was based on qe values computed using concentrations of Cr(VI) that were determined using the 1,5-diphenylcarbazide-based colorimetric method. Such an approach is rooted in the assumption that the adsorption process is unaccompanied by Cr(VI) reduction. Following Cr(VI) reduction in the adsorbed phase, the desorption of nascent Cr(III) ions, which are unrecognized by colorimetry, would yield understated, hence unrepresentative, values of the residual chromium in the aqueous phase upon analysis. Ultimately, overstated values of the quantities retained by the adsorbent, hence exaggerated adsorption capacity, would be recorded.
Table 4 compares the adsorption capacities of the PAF-SMP for chromium uptake from Cr(VI) solution with those of other ligand-grafted adsorbents that are reported in the literature. The PAF-SMP ranks tenth amongst the thirteen listed polymer grafted adsorbents. Although the adsorption capacity of the PAF-SMP is 4.5 times smaller than that of the highest ranked acrylamide-grafted Camellia oleifera shell adsorbent, it is 12 times greater than the capacity of the lowest ranked adsorbent. Moreover, some of the slightly higher ranking adsorbents, including hyperbranched polyamide grafted corncob [34], have possibly exaggerated adsorption capacities owing to computation using Cr(VI) concentration. In addition, the fabrication of some adsorbents involved processes that were laborious [33], chemical intensive, or both [35]. Therefore, PAF-SMP can be considered a competitive adsorbent for the treatment of Cr(VI)-polluted water.
Table 4.
Comparison of the Cr(VI) adsorption capacity of PAF-SMP with polymer-grafted adsorbents derived from lignocellulosic biomass.
4. Conclusions
Graft copolymerization of glycidyl methacrylate followed by amination and protonation with hydroxylamine and hydrochloric acid, respectively, was used successfully to functionalize the surfaces of the satsuma mandarin peel biomass for Cr(VI) removal from aqueous solution. It is established that the removal of the Cr(VI) is coupled with Cr(VI) to Cr(III) reduction as evidenced by the presence of Cr(III) ions in the final solutions. The rate of Cr(VI) removal is amplified at low solution pH owing to the ready availability of hydronium ions for redox reactions with oxidizing functional groups on the adsorbent surfaces. The total chromium adsorption isotherms are adequately simulated by the equation of the Jovanovic model. The maximum adsorption capacity of the adsorbent is cc and increases to 133.25 c, 169.52 mg g−1 and 219.28 mg g−1, with an increase in operating temperature to 40 °C, 50 cc and 60 °C, respectively. These results can transform how the crafting of conditions for the application of the adsorbent on real-world water samples can be approached. The scope for further research in real-world applications can be widened to include (1) adsorbent regeneration studies with thorough characterization of the regenerated adsorbent and (2) scale-up for industrial use.
Author Contributions
Conceptualization, M.M.; investigation, M.M.; resources, V.E.P.; writing—original draft preparation, M.M.; writing—review and editing, M.M. and V.E.P.; funding acquisition, V.E.P. All authors have read and agreed to the published version of the manuscript.
Funding
This work was supported by the National Research Foundation (NRF) of South Africa through the South Africa/France Protea Grant (No: 150491) and the University of South Africa.
Institutional Review Board Statement
Not applicable.
Informed Consent Statement
Not applicable.
Data Availability Statement
The datasets generated during this study are available from the corresponding author on reasonable request.
Acknowledgments
Lebohang Elton Ramono is acknowledged for his valuable contributions in the laboratory.
Conflicts of Interest
The authors declare no conflict of interest.
References
- Loock, M.M.; Beukes, J.P.; van Zyl, P.G. A Survey of Cr(VI) Contamination of Surface Water in the Proximity of Ferrochromium Smelters in South Africa. Water SA 2014, 40, 709–716. [Google Scholar] [CrossRef]
- Izbicki, J.A.; Wright, M.T.; Seymour, W.A.; McCleskey, R.B.; Fram, M.S.; Belitz, K.; Esser, B.K. Cr(VI) Occurrence and Geochemistry in Water from Public-Supply Wells in California. Appl. Geochem. 2015, 63, 203–217. [Google Scholar] [CrossRef]
- Tumolo, M.; Ancona, V.; De Paola, D.; Losacco, D.; Campanale, C.; Massarelli, C.; Uricchio, V.F. Chromium Pollution in European Water, Sources, Health Risk, and Remediation Strategies: An Overview. Int. J. Environ. Res. Public Health 2020, 17, 5438. [Google Scholar] [CrossRef] [PubMed]
- Eliopoulos, I.-P.D.; Eliopoulos, G.D.; Economou-Eliopoulos, M. The Cr(VI) Stability in Contaminated Coastal Groundwater: Salinity as a Driving Force. Minerals 2021, 11, 160. [Google Scholar] [CrossRef]
- Sedlazeck, K.P.; Vollprecht, D.; MUller, P.; Mischitz, R.; GierE, R. Impact of an In-Situ Cr(VI)-Contaminated Site Remediation on the Groundwater. Environ. Sci. Pollut. Res. 2020, 27, 14465–14475. [Google Scholar] [CrossRef]
- Sharma, D.; Chaudhari, P.K.; Prajapati, A.K. Removal of Chromium (VI) and Lead from Electroplating Effluent Using Electrocoagulation. Sep. Sci. Technol. 2020, 55, 321–331. [Google Scholar] [CrossRef]
- dos Santos, C.S.L.; Reis, M.H.M.; Cardoso, V.L.; de Resende, M.M. Electrodialysis for Removal of Chromium (VI) from Effluent: Analysis of Concentrated Solution Saturation. J. Environ. Chem. Eng. 2019, 7, 103380. [Google Scholar] [CrossRef]
- Jin, Q.; Yao, W.; Chen, X. Removal of Cr(Vi) from Wastewater by Simplified Electrodeionization. Desalination Water Treat. 2020, 183, 301–306. [Google Scholar] [CrossRef]
- Shao, M.; Li, Y.; Meng, L.; Guo, J.; Gao, Y.; Liu, Y.; Huang, M. Simultaneous Removal of Antimony, Chromium and Aniline by Forward Osmosis Membrane: Preparation, Performance and Mechanism. Desalination 2021, 520, 115363. [Google Scholar] [CrossRef]
- Thiripelu, P.; Manjunathan, J.; Revathi, M.; Ramasamy, P. Removal of Hexavalent Chromium from Electroplating Wastewater by Ion-Exchange in Presence of Ni(II) and Zn(II) Ions. J. Water Process Eng. 2024, 58, 104815. [Google Scholar] [CrossRef]
- Roman-Abarca, M.E.; Kar, T.; Casales-Diaz, M.; Ramos-Hernandez, J.J.; Godavarthi, S.; Bogireddy, N.K.R.; Norena, H.A.S.; Kesarla, M.K. Effective Photocatalytic Chromium (VI) Detoxification with Metal-Free Heterojunction Based on g-C3N5 and ZIF-8 Carbon under Visible Light. Environ. Res. 2025, 275, 121424. [Google Scholar] [CrossRef] [PubMed]
- Yang, X.; Xiong, J.; Cao, L.; Zhang, Y.; Wu, P.; Shi, Y.; Zhang, H.; Pi, K.; Qiu, G. One-Step Electrochemical Reduction and Precipitation Removal of Cr(VI) in Acid Wastewaters Using Amidoxime-Functionalized Carbon Felt. Desalination 2025, 593, 118257. [Google Scholar] [CrossRef]
- Huang, X.-N.; Min, D.; Liu, D.-F.; Cheng, L.; Qian, C.; Li, W.-W.; Yu, H.-Q. Formation Mechanism of Organo-Chromium (III) Complexes from Bioreduction of Chromium (VI) by Aeromonas Hydrophila. Environ. Int. 2019, 129, 86–94. [Google Scholar] [CrossRef]
- Kim, B.-S.; Kim, Y.-M.; Jae, J.; Watanabe, C.; Kim, S.; Jung, S.-C.; Kim, S.C.; Park, Y.-K. Pyrolysis and Catalytic Upgrading of Citrus Unshiu Peel. Bioresour. Technol. 2015, 194, 312–319. [Google Scholar] [CrossRef]
- Bayuo, J.; Abukari, M.A.; Pelig-Ba, K.B. Optimization Using Central Composite Design (CCD) of Response Surface Methodology (RSM) for Biosorption of Hexavalent Chromium from Aqueous Media. Appl. Water Sci. 2020, 10, 135. [Google Scholar] [CrossRef]
- Mondal, N.K.; Basu, S.; Sen, K.; Debnath, P. Potentiality of Mosambi (Citrus Limetta) Peel Dust toward Removal of Cr(VI) from Aqueous Solution: An Optimization Study. Appl. Water Sci. 2019, 9, 116. [Google Scholar] [CrossRef]
- Parlayici, Ş.; Pehlivan, E. Comparative Study of Cr(VI) Removal by Bio-Waste Adsorbents: Equilibrium, Kinetics, and Thermodynamic. J. Anal. Sci. Technol. 2019, 10, 15. [Google Scholar] [CrossRef]
- Park, S.-H.; Shin, S.S.; Park, C.H.; Jeon, S.; Gwon, J.; Lee, S.-Y.; Kim, S.-J.; Kim, H.-J.; Lee, J.-H. Poly(Acryloyl Hydrazide)-Grafted Cellulose Nanocrystal Adsorbents with an Excellent Cr(VI) Adsorption Capacity. J. Hazard. Mater. 2020, 394, 122512. [Google Scholar] [CrossRef]
- Yu, T.; Liu, S.; Xu, M.; Peng, J.; Li, J.; Zhai, M. Synthesis of Novel Aminated Cellulose Microsphere Adsorbent for Efficient Cr(VI) Removal. Radiat. Phys. Chem. 2016, 125, 94–101. [Google Scholar] [CrossRef]
- Anirudhan, T.S.; Fernandez, N.B.; Mullassery, M.D. Adsorptive Removal of As(III) and As(V) from Water and Wastewaters Using an Anion Exchanger Derived from Polymer-Grafted Banana Stem. Toxicol. Environ. Chem. 2012, 99, 37–41. [Google Scholar] [CrossRef]
- Zhao, B.; Gao, B.; Shi, H.; Xue, Y.; Chen, N.; Xu, H.; Xing, Y.; Zhao, X.; Ma, B.; Liu, J.; et al. In Situ Removal of Cr6+ with an Intelligent Adsorbent: Microwave Synthesis, Interface Adsorption, Thermodynamics, Mechanism and Self-Regeneration. J. Environ. Chem. Eng. 2024, 12, 112045. [Google Scholar] [CrossRef]
- Waly, A.I.; Khedr, M.A.; Ali, H.M.; Ahmed, I.M. Application of Amino-Functionalized Cellulose-Poly(Glycidyl Methacrylate) Graft Copolymer (AM-Cell-g-PGMA)Adsorbent for Dyes Removal from Wastewater. Clean. Eng. Technol. 2022, 6, 100374. [Google Scholar] [CrossRef]
- Lace, A.; Ryan, D.; Bowkett, M.; Cleary, J. Chromium Monitoring in Water by Colorimetry Using Optimised 1,5-Diphenylcarbazide Method. Int. J. Environ. Res. Public Health 2019, 16, 1803. [Google Scholar] [CrossRef]
- Langmuir, I. The Constitution and Fundamental Properties of Solids and Liquids. Part I. Solids. J. Am. Chem. Soc. 1916, 38, 2221–2295. [Google Scholar] [CrossRef]
- Freundlich, H. About Adsorption in Solution. J. Phys. Chem. 1907, 57, 385–470. [Google Scholar]
- Jovanovic, D.S. Physical Adsorption of Gases I: Isotherms for Monolayer and Multilayer Adsorption. Kolloid-Z. Z. Polym. 1969, 235, 1203–1213. [Google Scholar] [CrossRef]
- Zhou, X.; Zhou, X. The Unit Problem in the Thermodynamic Calculation of Adsorption Using the Langmuir Equation. Chem. Eng. Commun. 2014, 201, 1459–1467. [Google Scholar] [CrossRef]
- Apaydın Varol, E.; Mutlu, Ü. TGA-FTIR Analysis of Biomass Samples Based on the Thermal Decomposition Behavior of Hemicellulose, Cellulose, and Lignin. Energies 2023, 16, 3674. [Google Scholar] [CrossRef]
- Barsbay, M.; Guven, O.; Kodama, Y. Amine Functionalization of Cellulose Surface Grafted with Glycidyl Methacrylate by γ-Initiated RAFT Polymerization. Radiat. Phys. Chem. 2016, 124, 140–144. [Google Scholar] [CrossRef]
- Bashiri, S.; Ghobadian, B.; Soufi, M.D.; Gorjian, S. Chemical Modification of Sunflower Waste Cooking Oil for Biolubricant Production through Epoxidation Reaction. Mater. Sci. Energy Technol. 2021, 4, 119–127. [Google Scholar] [CrossRef]
- Czech, A.; Zarycka, E.; Yanovych, D.; Zasadna, Z.; Grzegorczyk, I.; Kłys, S. Mineral Content of the Pulp and Peel of Various Citrus Fruit Cultivars. Biol. Trace Elem. Res. 2020, 193, 555–563. [Google Scholar] [CrossRef] [PubMed]
- El-Sayed, S.A.; Khass, T.M.; Mostafa, M.E. Thermal Degradation Behaviour and Chemical Kinetic Characteristics of Biomass Pyrolysis Using TG/DTG/DTA Techniques. Biomass Convers. Biorefinery 2024, 14, 17779–17803. [Google Scholar] [CrossRef]
- Hua, S.H.; Jampang, A.O.A.; Din, A.T.M. Adsorption Isotherms, Kinetics, and Thermodynamics of Au(III) on Chitosan/Palm Kernel Fatty Acid Distillate/Magnetite Nanocomposites. Int. J. Biol. Macromol. 2025, 304, 140913. [Google Scholar]
- Anirudhan, T.S.; Nima, J.; Divya, P.L. Adsorption of Chromium(VI) from Aqueous Solutions by Glycidylmethacrylate- Grafted-Densified Cellulose with Quaternary Ammonium Groups. Appl. Surf. Sci. 2013, 279, 441–449. [Google Scholar] [CrossRef]
- Lin, H.; Han, S.; Dong, Y.; He, Y. The Surface Characteristics of Hyperbranched Polyamide Modified Corncob and Its Adsorption Property for Cr(VI). Appl. Surf. Sci. 2017, 412, 152–159. [Google Scholar] [CrossRef]
- Wen, X.; Sun, N.; Yan, C.; Zhou, S.; Pang, T. Rapid Removal of Cr(VI) Ions by Densely Grafted Corn Stalk Fibers: High Adsorption Capacity and Excellent Recyclable Property. J. Taiwan Inst. Chem. Eng. 2018, 89, 95–104. [Google Scholar] [CrossRef]
- Suksabye, P.; Thiravetyan, P. Cr(VI) Adsorption from Electroplating Plating Wastewater by Chemically Modified Coir Pith. J. Environ. Manag. 2012, 102, 1–8. [Google Scholar] [CrossRef]
- Ntuli, T.D.; Pakade, V.E. Hexavalent Chromium Removal by Polyacrylic Acid-Grafted Macadamia Nutshell Powder through Adsorption-Reduction Mechanism: Adsorption Isotherms, Kinetics and Thermodynamics. Chem. Eng. Commun. 2020, 207, 279–294. [Google Scholar] [CrossRef]
- Ali, A.; Saeed, K.; Mabood, F. Removal of Chromium (VI) from Aqueous Medium Using Chemically Modified Banana Peels as Efficient Low-Cost Adsorbent. Alex. Eng. J. 2016, 55, 2933–2942. [Google Scholar] [CrossRef]
- Deng, J.; Liu, Y.; Li, H.; Huang, Z.; Qin, X.; Huang, J.; Zhang, X.; Li, X.; Lu, Q. A Novel Biochar-Copolymer Composite for Rapid Cr(VI) Removal: Adsorption-Reduction Performance and Mechanism. Sep. Purif. Technol. 2022, 295, 121275. [Google Scholar] [CrossRef]
- Li, W.; Yuan, H.; Wang, P.; Zhai, S.; Ma, J.; Wang, Y.; Xiao, J.; Shen, Y.; Guo, H. Amidoxime-Functionalized Corn Straw for Efficient Cr(VI) Adsorption from Water: Waste Utilization, Affinity Character and DFT Simulation. Colloids Surf. A Physchem. Eng. Asp. 2024, 689, 133631. [Google Scholar] [CrossRef]
- Lin, C.; Luo, W.; Luo, T.; Zhou, Q.; Li, H.; Jing, L. A Study on Adsorption of Cr(VI) by Modified Rice Straw: Characteristics, Performances and Mechanism. J. Clean. Prod. 2018, 196, 626–634. [Google Scholar] [CrossRef]
- Anirudhan, T.S.; Rijith, S.; Das Bringle, C. Iron(III) Complex of an Amino-Functionalized Poly(Acrylamide)-Grafted Lignocellulosic Residue as a Potential Adsorbent for the Removal of Chromium(VI) from Water and Industry Effluents. J. Polym. Res. 2010, 17, 289–299. [Google Scholar] [CrossRef]
- Zhou, Y.; Jin, Q.; Zhu, T.; Ma, T.; Hu, X. Removal of Chromium (VI) from Aqueous Solution by Cellulose Modified with D-Glucose. Sep. Sci. Technol. 2012, 47, 157–165. [Google Scholar] [CrossRef]
Disclaimer/Publisher’s Note: The statements, opinions and data contained in all publications are solely those of the individual author(s) and contributor(s) and not of MDPI and/or the editor(s). MDPI and/or the editor(s) disclaim responsibility for any injury to people or property resulting from any ideas, methods, instructions or products referred to in the content. |
© 2025 by the authors. Licensee MDPI, Basel, Switzerland. This article is an open access article distributed under the terms and conditions of the Creative Commons Attribution (CC BY) license (https://creativecommons.org/licenses/by/4.0/).