Abstract
Conservation Voltage Reduction (CVR) is a potential energy management approach for increasing computer system energy efficiency. This study uniquely contributes to the field by thoroughly investigating the impact of CVR on computing devices, filling a significant gap in the existing literature. The research employs a novel experimental approach, considering the temporal variations in energy use behavior, and presents a comprehensive benchmark analysis of desktop PCs and laptops. Notable gains in processing efficiency are observed, with specific instances such as Desktop 1’s 1.53% Single-Core performance improvement and Desktop 3’s 3.19% total performance boost. Despite variations, the thermal performance of CVR-equipped devices, particularly Desktop 3 and Laptop 3, consistently demonstrates lower temperatures, indicating thermal management enhanced by 3.19% and 1.35%, respectively. Additionally, the study introduces the CVR Performance Enhancement Ratio (%), providing a unique metric for evaluating the trade-offs between energy efficiency and system performance. This research highlights the dual impact of CVR on thermal and computational elements, emphasizing its broad advantages. Integrating CVR emerges as a viable strategy for developing more durable, efficient, and sustainable computing devices, setting the stage for advancements in voltage regulation.
1. Introduction
The quest of utility operators for energy efficiency and sustainability has greatly heightened the interest in understanding the load characteristics and power consumption behavior of electronic devices, making it a critical area of study.Voltage regulation of the Distribution Network is a control approach used to keep the voltage of the Distribution Network within a specific range [1]. Because of the world’s current energy crisis, energy conservation has become critical. The CVR strategy is widely used in the power grid system to handle such emergencies and minimize peak hour electricity demand [2]. The work of [3] contributes significantly to the understanding of CVR dynamics in the context of power systems with PE-based components, paving the way for further research in this evolving field. Energy conservation is critical to the industrial and economic development of nations all over the world [4,5]. Energy conservation and planning are becoming increasingly important as the economic and worldwide environmental implications of energy consumption rise [6]. In the context of load parameter estimation and energy management, recent advancements in Energy Internet (EI) systems are exemplified by the work of [7]. The study introduces a bottom-up EI architecture employing data-driven dynamical control and deep reinforcement learning (DRL) techniques, with integrated curriculum learning (CL) for enhanced efficiency. Through simulations, the approach showcased a substantial reduction in overall generation costs by 7.1% and 37%, surpassing traditional methods like proportional integral and optimal power flow [7].
Electronic office equipment accounts for the majority of power consumption from service and tertiary end users [8]. Understanding the consumption behavior of computing devices is critical for the development of active load management techniques for such systems [9]. Consumer energy consumption is expanding at a fast pace, and it is predicted to quadruple by 2030. As a result, various research on practical strategies for managing energy supply and demand have been performed [10,11,12]. Office equipment is now thought to be the end-use of electrical energy in the commercial sector which is rising at the highest [13].
In the context of the escalating integration of renewable energy sources, it is essential to consider the implications for power quality and adherence to grid codes. The authors of [14] underlined the critical significance of power quality in maintaining efficiency, limiting excessive heating, and protecting assets connected to the electrical grid; they emphasized the possible consequences associated with poor power quality. The authors of [15] discussed the challenges and issues related to grid codes, power quality, and stability during contingencies. Power quality concerns may include voltage fluctuations, harmonic distortions, and frequency variations, all of which can affect the overall performance of the electrical grid [16]. The authors of [16] explicitly delved into the national grid codes that govern the operation and integration of power sources into Pakistan’s electrical grid. Grid codes are regulatory frameworks that set standards and guidelines for the performance, safety, and reliability of power systems; meanwhile, the primary focus remains on investigating the impact of CVR on computing system performance and recognition of the broader significance of power quality and grid codes in the evolving energy landscape is integral. Specifically, CVR, as a technique optimizing voltage levels, plays a crucial role in enhancing overall power quality and aligning with evolving grid code requirements.
1.1. Related Works and Research Gaps
Due to their widespread usage in homes and workplaces, personal computing devices like desktop PCs and laptops considerably contribute to total energy consumption. CVR implementation can potentially reduce the energy consumption of computational devices by intelligent reduction in terminal voltage. The authors of [17] provided a probabilistic technique for evaluating capabilities while accounting for uncertainties in renewable generation and system loads, exposing the impact of non-Gaussian solar PV and wind penetration on CVR capabilities. Using technology, ref. [18] provided a real-time power smoothing control technique for distribution systems with significant PV penetration. Its efficiency is demonstrated by modeling and field findings in China. To reduce substation demand, the authors of [19] proposed a method that combines distributed generation, var optimization, and CVR. The best location for the DG and shunt capacitor is determined using the GWO approach. Despite the clear potential of CVR to significantly reduce energy consumption, a key unanswered concern is the impact of CVR on the computational performance of personal computing devices. Previous studies have concentrated on energy management approaches and their possible influence on computer systems [20,21,22]. It is critical to reduce energy usage while preserving or even improving system performance. The thermodynamic approach proposed in [23] provides a comprehensive method for evaluating energy performance in IT servers and data centers. It is crucial to note that the authors of [23] did not include an investigation into CVR.This study, on the other hand, extensively explores the experimental impact of CVR on performance metrics and energy efficiency in computer systems. Traditional energy performance metrics, such as energy usage intensity, have been used to assess energy efficiency [24,25,26]; however, they may not completely represent the temporal variations in energy use behavior. As a result, more comprehensive performance measurements that reflect not just overall energy usage but also the temporal elements of energy use are required. The authors of [27] emphasized the innovative approach of load-shape benchmarking, which refers to a method of assessing and comparing the patterns of energy consumption to enable easy access to low-cost tools for energy efficiency and understanding energy use behaviors in commercial buildings.
Different performance metrics can be used to analyze the performance of personal computing devices. The authors of [28] discussed measuring average normalized turnaround time and system throughput for thorough benchmarking when evaluating multi-program workload performance on multi-threaded hardware. In practice, running benchmarks to completion, especially in simulation setups, can be time-consuming and impractical. Full benchmark execution may take weeks, even on the fastest simulators and hardware. To address this, academics frequently employ sampling simulation, which involves running just representative units with a limited number of simulation points, or simply a single simulation point per benchmark [29,30,31,32]. The authors of [33] presented a novel approach for improved power quality disturbance detection by analyzing key factors, including wavelet analysis and disturbance features, and employing various wavelet transforms to enhance parameter selection and accuracy. In addition to demonstrating that higher motor efficiency, particularly in smaller machines, lowers iron-core losses, the authors of [34] validated the energy-saving potential of CVR for refrigeration loads (RLs) and presented a criterion for evaluating CVR efficacy. This study aims to fill gaps in earlier research by presenting a unique approach for benchmarking the performance of computing systems under CVR deployment. There are some existing studies analyzing the CVR impact on buildings using performance metrics, but similar studies are lacking for computational devices.
1.2. Contributions
The primary objectives of this research are to investigate the behavior of desktop and laptop computers under varying voltage conditions. The study employs a Variac to test devices at different voltage settings, evaluating their energy efficiency, load behavior, power consumption, performance metrics, and thermal characteristics in response to voltage variations. Additionally, the research explores the potential benefits of implementing CVR strategies for improving energy efficiency.
The specific contributions of this study are as follows:
- Developed a novel experimental approach to benchmark the performance of computing systems under CVR deployment, considering the temporal variations in energy use behavior.
- Presented a comprehensive benchmark analysis of desktop PCs and laptops, assessing performance metrics like Single-Core and Multi-Core Scores under different voltage settings with a focus on CVR implementation.
- Investigated the thermal performance of computing systems under various CVR scenarios, providing novel insights into the impact of CVR on heat dissipation from the computing devices. This aspect has not been extensively discussed in the existing literature, marking it as a distinct and valuable contribution.
- Introduced and defined the CVR Performance Enhancement Ratio (%), a novel metric for systematically evaluating and quantifying the impact of CVR on the performance efficiency of computing systems. This ratio offers a unique perspective on the trade-offs between energy efficiency and system performance, contributing to the body of knowledge on sustainable computing practices.
The study’s findings provide vital information for customers, manufacturers, and legislators to make educated judgments about energy-efficient computing technologies. The study might pave the way for sustainable and energy-conscious computing practices, leading to considerable energy savings, by establishing the appropriate voltage levels and examining the possible advantages of CVR.
2. Conservation Voltage Reduction
Due to the growing concern about environmental sustainability and rising energy prices, energy-efficient computing has emerged as a crucial component of contemporary technology. Optimizing the energy use of personal computing devices, such as desktop PCs and laptops, is crucial in lowering the overall carbon footprint, since they are now so common in our everyday lives. The ideas of energy-efficient computing will be covered in this section, along with power-saving techniques and the importance of reducing energy consumption in computer hardware. CVR strategies are important in modern power systems because they are an effective way to optimize energy usage and improve overall system efficiency. CVR entails lowering voltage levels in power Distribution Networks, resulting in energy savings without sacrificing electrical service performance or quality. Given the growing emphasis on environmental responsibility, incorporating CVR methodologies into personal computing activities has the potential to promote not only energy conservation but also alignment of technology with the broader aims of sustainable development. Our primary focus centers on how CVR techniques can be applied in personal computer settings to achieve energy savings without compromising device performance.
2.1. CVR Factor
The CVR factor, , is crucial in quantifying the resulting energy savings achieved by reducing voltage levels in the Distribution Network.
where is the percentage of the voltage change, and is the percentage energy saved. represents the CVR in terms of Energy saved [35]. In terms of active power demand reduction, is represented as:
Here, is the percentage variation of the active demand load and represents active power demand reduction by CVR implementation [36].
2.2. Performance Metric of a Single-Core System
A performance metric, more precisely the “Single-Core Score” of the Geekbench [37] program, is a numerical depiction of the Central processing unit’s (CPU) competence and efficiency when carrying out tasks that need a single processing core in a computer system. This score, which is produced by Geekbench using standard tests, measures how well the system performs across a variety of workloads that are performed in single threads and gives an indication of how well it can handle activities that are not optimized for parallel processing. The Single-Core Score is a performance indicator that helps users and stakeholders evaluate the computing capacity of each individual core in a system. It provides useful data for a range of workloads and applications that primarily employ a single processing core.
2.3. Performance Metric of a Multi-Core System
A performance metrics for Multi-Core systems is a numerical measure that measures the collective processing efficiency of a computer system’s CPU across several cores, as represented by the “Multi-Core Score” in the context of tools like Geekbench [37]. This measure is developed from standardized tests that evaluate the system’s performance in parallel workloads, demonstrating its ability to execute tasks across several processor cores at the same time. The Multi-Core Score is a comprehensive performance metric that provides information about the system’s overall multitasking capabilities as well as its efficacy in handling workloads that benefit from parallel processing. It provides a quantifiable benchmark for analyzing the system’s capacity to distribute and manage computational workloads over several cores at the same time, providing vital information for optimizing Multi-Core architecture performance.
2.4. CVR Performance Enhancement Ratio
The CVR Performance Enhancement Ratio (CVR PER) is a new metric proposed in this study to assess the relative impact of CVR on a system’s performance efficiency. This ratio is stated as a percentage and is determined by comparing the performance metric obtained with CVR to the performance metric obtained without CVR, offering vital insight into CVR’s efficacy in impacting total system performance.
where represents the measured performance metric of the system under consideration when CVR is deployed. and signifies the measured performance metric of the system without the application of CVR.
The formula proposed in this research, denoted as the CVR PER, serves as a novel metric aimed at evaluating the influence of CVR on the performance efficiency of a system. It is computed by scaling the ratio of the performance metric obtained with CVR to the performance metric obtained without CVR by 100, and it is expressed as a percentage.
This novel formula is highly relevant to the field of energy-efficient systems, especially those that use CVR techniques. Researchers and practitioners can use the formula to systematically evaluate and quantify the increase or decrease in performance efficiency that happens as a result of using CVR. Through an analysis of the performance metric both with and without CVR, this formula offers important information about how well CVR contributes to total system performance. The CVR PER (%) holds importance as it provides information to researchers, engineers, and decision-makers regarding the trade-offs between system performance and energy conservation measures like CVR. It serves as a powerful tool for evaluating the holistic impact of CVR on a system, considering both energy consumption and performance metrics. By balancing energy conservation with preserving or even improving system performance, these data can help optimize energy-efficient systems. As a result, the formula advances knowledge about and application of high-performance, sustainable computing systems across a range of industries.
3. Experimental Setup and Methodology
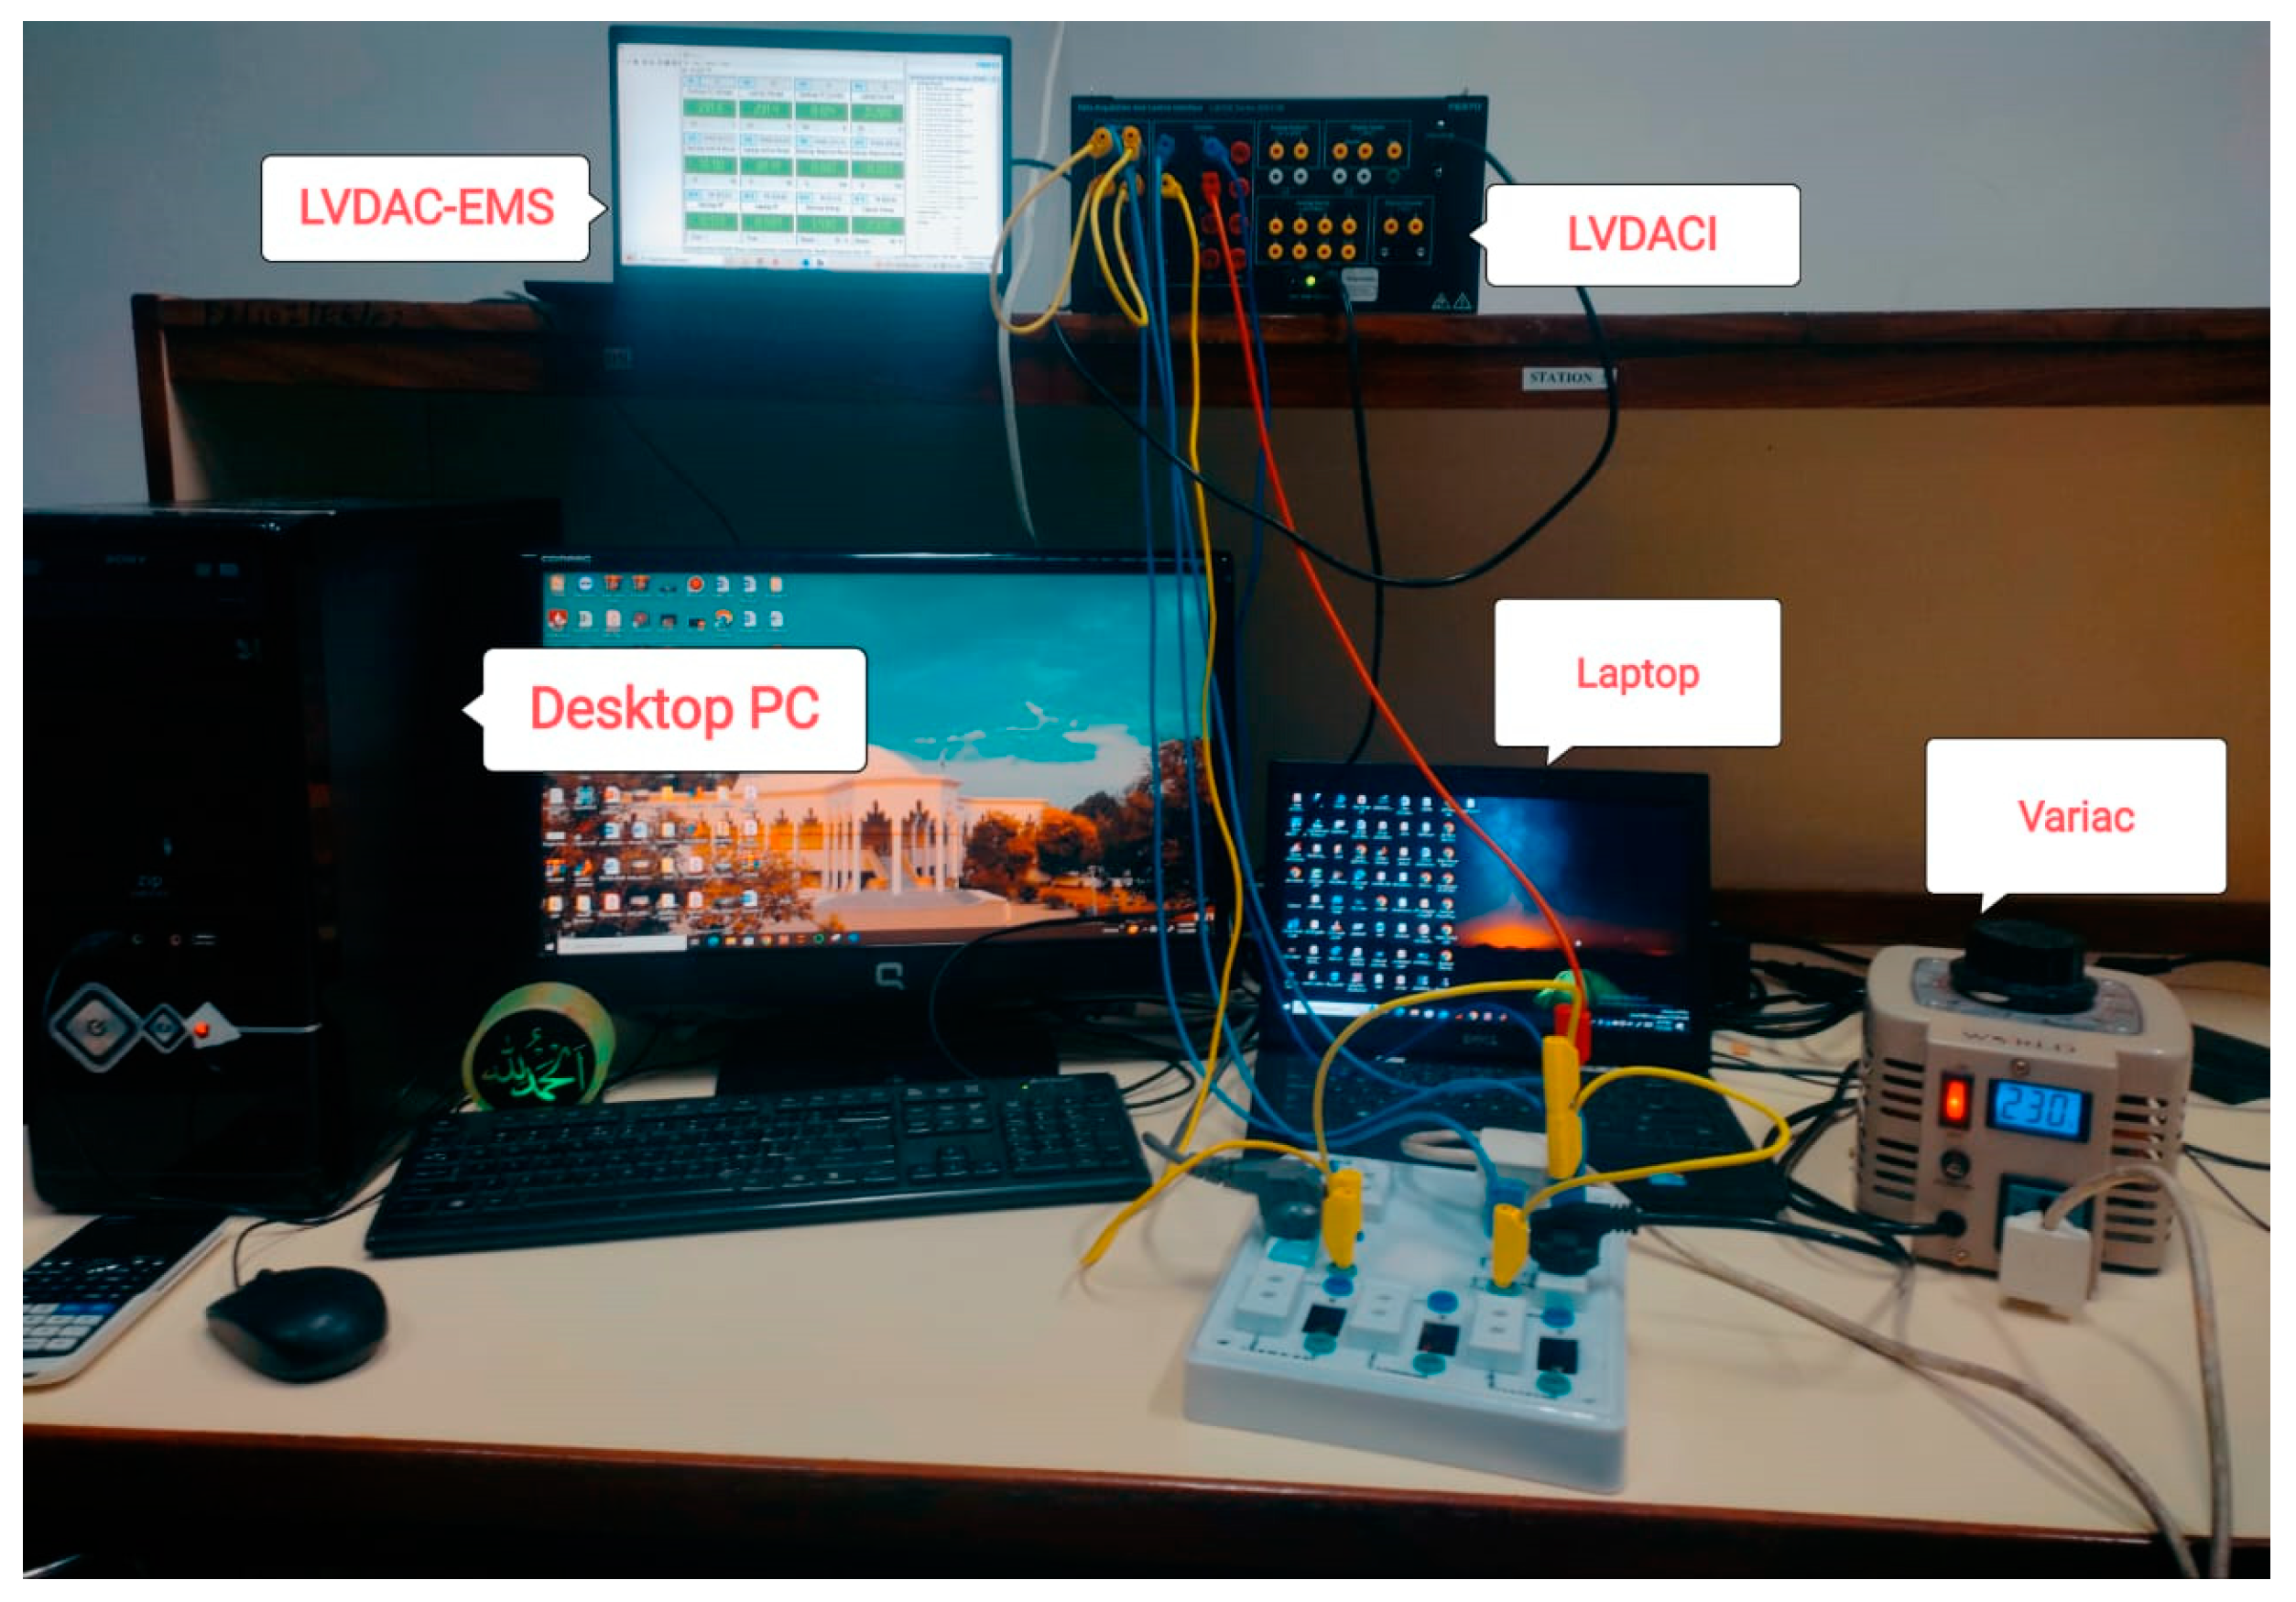
The experimental setup was meticulously designed to assess the performance of various desktops and laptops under different voltage conditions as shown in Figure 1. A Variac with a 1 kVA rating served as the primary component for adjusting the supply voltage, ranging from 230 V to 200 V in precise 5 V increments. This setup aimed to simulate varying voltage scenarios to analyze device performance under different power conditions.
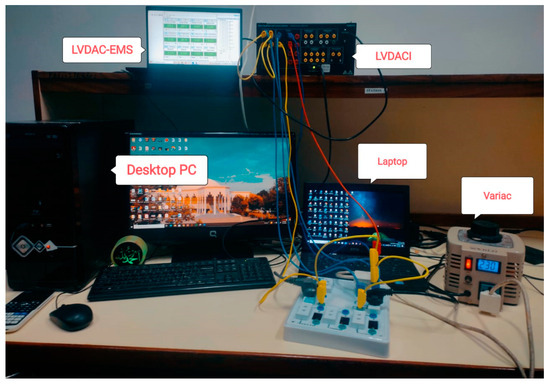
Figure 1.
Experimental Setup at GIKI Power Distribution Research Lab.
To capture essential data, including voltage, current, and power, we employed the Lab Volt Data Acquisition and Control Interface (LVDACI) [38] in conjunction with the LVDAC EMS Version 3.22 software. This combination facilitated accurate and real-time data recording throughout the experimental process.
3.1. Validation Procedures
Ensuring the accuracy and reliability of our measurements was paramount. Calibration checks were regularly performed on the LVDACI to maintain precise measurements. The instruments used in the experiment were selected for their high accuracy, contributing to the overall reliability of the data collected.
3.2. Accuracy and Repeatability
The accuracy of our measurements was influenced by the precision of the instruments used. To address repeatability concerns, each device underwent five individual tests, and the results from repeated measurements were consistently reproducible. This demonstrated the stability and reliability of our experimental setup.
3.3. Number of Tests Conducted
In total, six devices—tabulated in Table 1—were subjected to a comprehensive testing regime. Each device underwent five individual tests of repeating measurements on each voltage level, and within each test, we conducted 15 performance metric assessments tabulated in Table 2. These assessments covered scenarios both with and without CVR. Therefore, the total number of tests for each device equated to performance metric tests per individual test, resulting in 300 tests per device. Considering the fact that the study involved six devices, the cumulative number of tests conducted for all devices was , totaling 1800 tests.

Table 1.
Description of devices under test.
Table 2.
Benchmark tests from Geekbench.
These rigorous validation measures and the extensive testing protocol contribute to the transparency, rigor, and validity of our experimental study, ensuring the reliability of the obtained results.
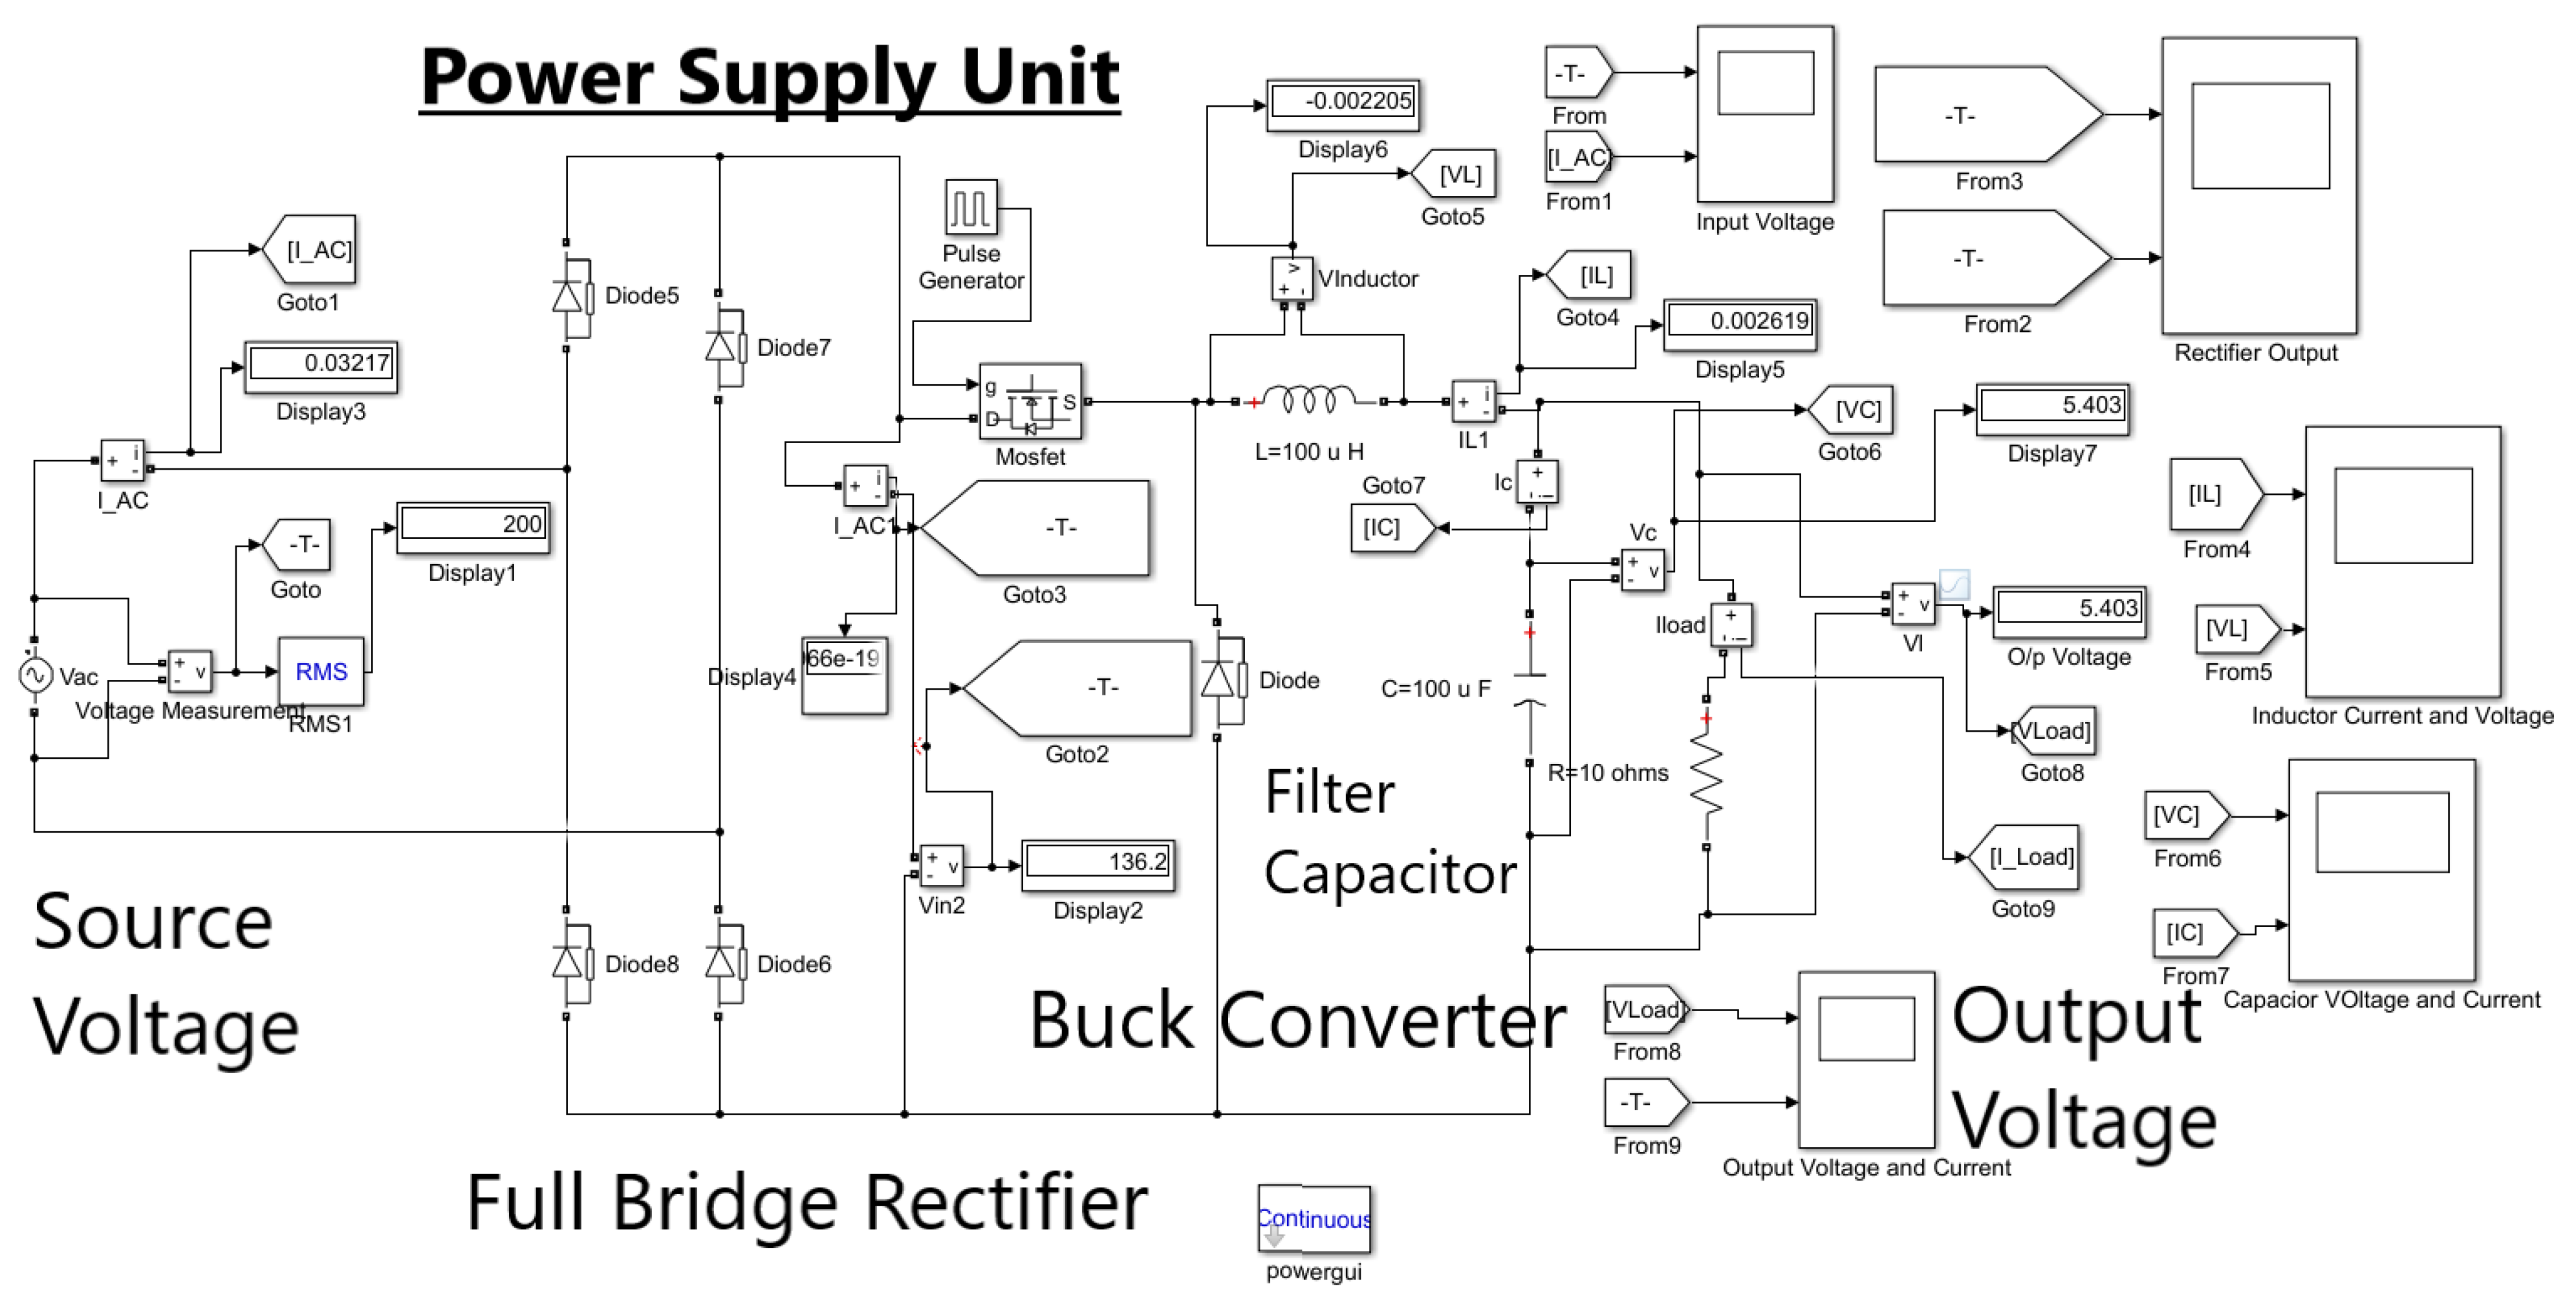
3.4. Power Supply Unit (PSU) Analysis
The Power Supply Unit (PSU) is a critical component in computing devices, responsible for converting electrical energy from the mains input into a stable and regulated form suitable for powering internal components. In the context of CVR, understanding the behavior of the PSU becomes paramount, as fluctuations in input voltage may impact the overall energy efficiency and performance of computing systems.
Simulink Model of PSU Operation
A comprehensive Simulink model was created to examine the effect of CVR on PSU functioning shown in Figure 2. A full bridge rectifier, buck converter for voltage control, AC voltage supply, and a load that represents desktop and laptop computers are some of the components that are included in the model. This simulation sheds light on how different input voltages affect the PSU and how that affects the output.
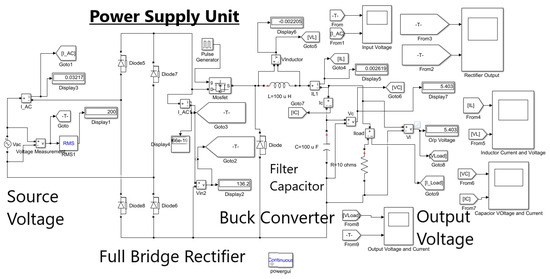
Figure 2.
Power Supply unit circuit simulation in MATLAB SIMULINK.
3.5. Description of Desktop PCs and Laptops Specifications
In this study, the effects of CVR on the performance of a different Desktop PCs and a Laptops were examined. To evaluate the Single-Core and Multi-Core performances of all devices, tests, and benchmarks were performed. The study provided important insights into CVR’s performance under various circumstances by examining its impacts at voltage levels ranging from 230 V to 200 V. Table 1 provides detailed information about all the systems under examination.
3.6. LVDACI and Variac Integration for Variable Voltage Conditions
A flexible data acquisition and control interface from Festo [38], the LVDACI, offers accurate measurement of voltage, current, active and reactive powers, power factor, and energy up with to 4 loads connected at a time. The output voltage that is delivered to the devices may be changed using the 1 kVA Variac, a variable auto-transformer. Variac ranges between 0 and 250 V are well suited here for providing variable voltage to loads and for the analysis of CVR. A connection board with banana sockets is specially designed to connect loads and Variac with LVDACI considering safety precautions. A complete set of modern computer-based instruments for measuring, viewing, analyzing, and manipulating electrical characteristics is provided through the collaboration of the LVDACI and LVDAC-EMS. The LVDACI and LVDAC-EMS both provide manual and timed data recording. The gathered information can be exported into a spreadsheet program and can be used for analysis purposes. The functionality of LVDACI and LVDAC-EMS is clearly described in [38].
4. Task Execution and Data Collection for Benchmarking
A series of controlled tests were carried out to study the load characteristics, power consumption, and performance metrics of the desktop PCs and laptops under varied voltage settings. Section 3 described the experimental setup, which included the integration of LVDACI and Variac for voltage control. This section describes the tasks carried out during the experiments as well as the data-gathering processes.
4.1. Tasks
A variety of activities were performed to evaluate the performance of the desktop PCs and laptops, reflecting both computationally intensive and real-world application settings. The activities were deliberately chosen to test various hardware components such as the CPU, GPU, and memory under varying voltage settings.
4.1.1. CPU-Intensive Work
Using synthetic benchmarks and computational simulations, a CPU-intensive work was created. To fully leverage the CPU’s processing power, this activity required completing complicated mathematical computations and algorithms.
4.1.2. Graphics-Intensive Work
A graphics-intensive work was run to stress the GPU and evaluate graphical performance. Running graphics benchmarks and 3D rendering apps was part of this work.
4.1.3. Multitasking Scenario
A multitasking scenario was created to imitate real-world usage in which numerous apps, such as online surfing, video playing, and document editing, were run concurrently.
4.2. Data Gathering
Data were collected concurrently with job execution to gather important performance indicators and power consumption values.
4.2.1. Power Consumption
The inbuilt LVDAC and digital power meter were used to measure the power consumption of the desktop PC and laptop at each voltage level. The data were taken at regular intervals throughout the task execution to provide a detailed power usage profile.
4.2.2. Performance Metrics
Using appropriate benchmarking tools, performance measurements such as CPU load, GPU utilization, frame rates, reaction times, and data transfer rates were recorded. These measures were critical in determining the responsiveness and efficiency of the devices under varied voltage situations. In this work, performance metrics are computed using Geekbench, a benchmarking tool for performance metrics.
4.2.3. Thermal Behavior
In this experiment, the thermal behavior of the system was analyzed to understand how the temperature of the CPU varies under different conditions. Temperature measurements were taken using the software named CPUID HWmonitor Version 1.51.0. CPUID HWmonitor is a well-known piece of software that allows the real-time monitoring of several hardware metrics, such as CPU temperature, voltage, and fan speed [39]. It has an intuitive user interface and enables users to monitor temperature changes as the device runs. Regularly throughout carrying out various duties on both the desktop PC and the laptop, the temperature data were recorded. The measurements were utilized to examine each system’s thermal performance under different load scenarios.
4.3. Performance Benchmarking with Geekbench
A popular benchmarking tool for assessing the performance of computers and mobile devices is Geekbench [37]. It assesses the performance of Single-Core and Multi-Core processors, providing important information regarding computing capabilities. Geekbench is used in an experimental setup to assess desktop and laptop performance in various scenarios. The software, which has a user-friendly interface and thorough reporting, is developed by Primate Labs. Geekbench supports several different operating systems, making it possible to benchmark both Windows-based desktop computers and Mac laptops. Geekbench was run numerous times on each system to guarantee statistical significance and dependability. The performance disparities between the each system under various settings, such as (CVR), were then analyzed using the mean scores. Benchmark tests that were used for this study using Geekbench are summarized in Table 2.
4.3.1. Single-Core Score
This is an aggregated metric derived from Geekbench overall scores. This score assesses the system’s capability to execute operations outlined in Table 2 utilizing the processing power of a Single-Core. The Single-Core Score offers valuable insights into the system’s efficiency when handling tasks that rely on individual processing units, providing a detailed perspective on its core-level performance.
4.3.2. Multi-Core Score
This is another crucial metric derived from Geekbench overall scores. Unlike the Single-Core Score, the Multi-Core Score evaluates the system’s performance when leveraging the combined processing power of multiple cores. This metric holds significance in assessing the system’s efficiency in scenarios demanding parallel processing and multitasking capabilities, offering a comprehensive view of its overall performance.
5. Results and Analysis
This section presents the benchmarking and CVR impact results. First, the power consumption analysis results are presented, followed by the CVR analysis.
5.1. Power Consumption Analysis
Table 3 investigates the power consumption patterns of Desktop PCs and Laptops at various voltage levels, providing a look into how these devices respond to CVR scenarios. As the voltage drops from 230 V to 200 V, both desktop PCs and laptops reduce active power usage, complying with energy-saving principles. Notably, laptops appear to be more sensitive to voltage variations than desktop PCs. The differences in power consumption amongst devices at the same voltage level highlight the importance of hardware configurations and device-specific considerations. These findings emphasize the potential energy-saving benefits of purposeful voltage reduction, highlighting the importance of proper voltage levels and device selection in energy-efficient applications. Consistent measurements across numerous devices at each voltage level add to the study’s dependability, giving useful insights for CVR research and energy-efficient computation.
Table 3.
Power consumption of desktop and laptop.
5.2. CVR Analysis
CVR factors for all desktop PCs and laptops are calculated using the given power consumption data from Table 3 and utilizing Equation (2). The CVR Factors Table 4 helps in determining the ideal voltage for energy savings for each device in addition to illuminating the complex link between voltage changes and power consumption. Interestingly, desktop PCs show negative CVR factors at 225 V, indicating that power usage increases as voltage decreases. Nevertheless, each device has a different specific magnitude of these parameters. Desktop 2, for example, shows a significant negative CVR factor of −0.37, indicating a significant rise in power usage at this voltage. Laptops, on the other hand, constantly display positive CVR factors, highlighting their more energy-efficient reaction. With a noteworthy CVR factor of 3.97 at 225 V, Laptop 1 stands out remarkably, demonstrating its effectiveness in striking a balance between performance and energy conservation. Making the switch to 220 V, for desktop PCs, the complex relationship between voltage decrease and power usage becomes more evident. In this case, Desktop 1 displays an energy-efficient behavior with a positive CVR value of 0.29. Nevertheless, Desktop 3 shows a negative value of −0.53, indicating that power usage at this voltage can rise. Conversely, laptops continuously maintain good CVR values, demonstrating their energy-efficient nature. For example, Laptop 3 has a noteworthy CVR factor of 1.26 at 220 V, which indicates optimal power utilization. This detailed analysis emphasizes that each device’s ideal voltage for energy savings is shown by the voltage at which the CVR factor is maximum. As a result, many devices may have unique ideal voltage levels, highlighting the significance of taking device-specific factors into account in order to achieve energy economy without sacrificing functionality.
Table 4.
CVR factors for desktop and laptop.
5.3. Performance Benchmarking of Computing Devices with and without CVR
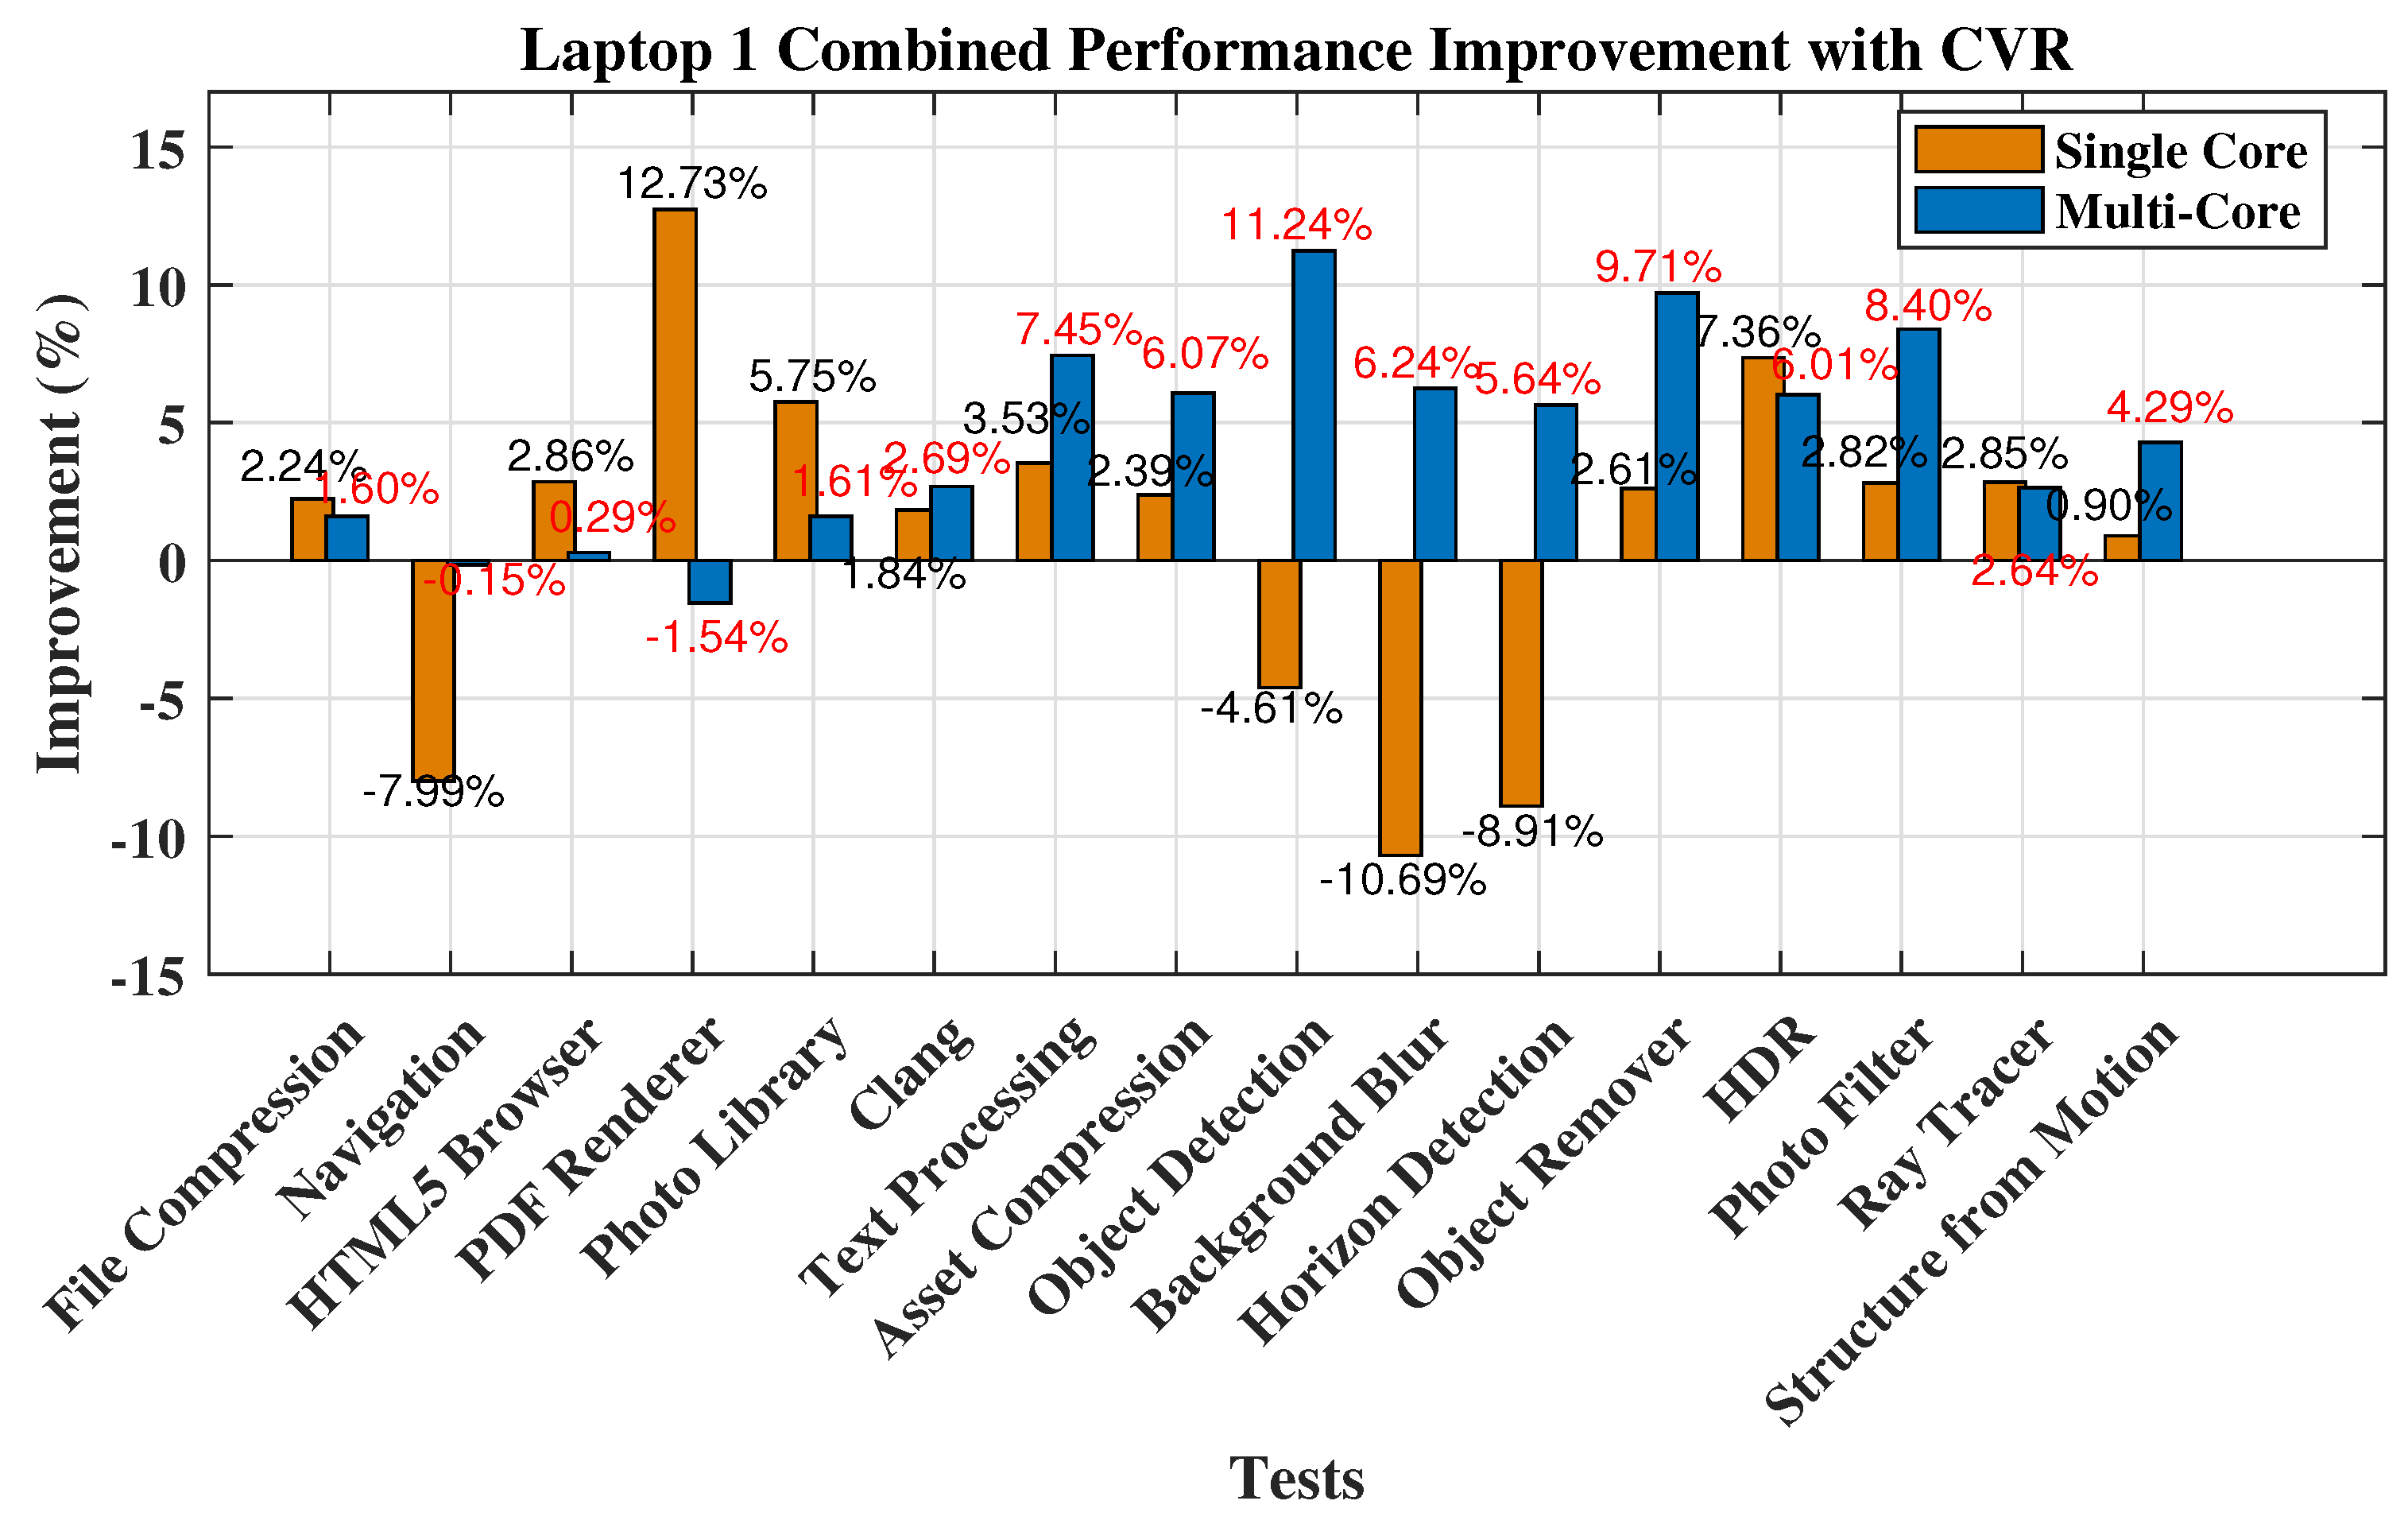
The performance benchmarking results presented in Table 5 provide a detailed examination of Laptop 1’s computational capabilities under varying scenarios with and without CVR. Across a spectrum of tests encompassing diverse computing tasks, including file compression, navigation, HTML5 browser operations, and more, the table captures the Single-Core and Multi-Core performance metrics. The term “improvement” in the table refers to the percentage change in performance metrics under the influence of CVR, as detailed in the CVR Performance Enhancement Ratio formula (Equation (3))—previously discussed. Overall, the analysis reveals nuanced performance variations. Notably, there is a 1.34% improvement in the overall score for Single-Core tasks with CVR, while Multi-Core tasks show a more substantial 4.27% enhancement. Specific tasks, such as file compression, text processing, and object removal, demonstrate varied impacts, with some tasks showcasing improvements and others experiencing slight performance decrements. These findings underscore the importance of considering specific computing tasks and metrics when evaluating the impact of CVR on device performance. Figure 3 shows that the overall positive trend in both Single-Core and Multi-Core performance metrics. These results suggests that CVR can be strategically employed to achieve energy efficiency without compromising computational capabilities.
Table 5.
Performance of Laptop 1 without CVR vs. with CVR.

Figure 3.
Performance Improvement for Laptop 1.
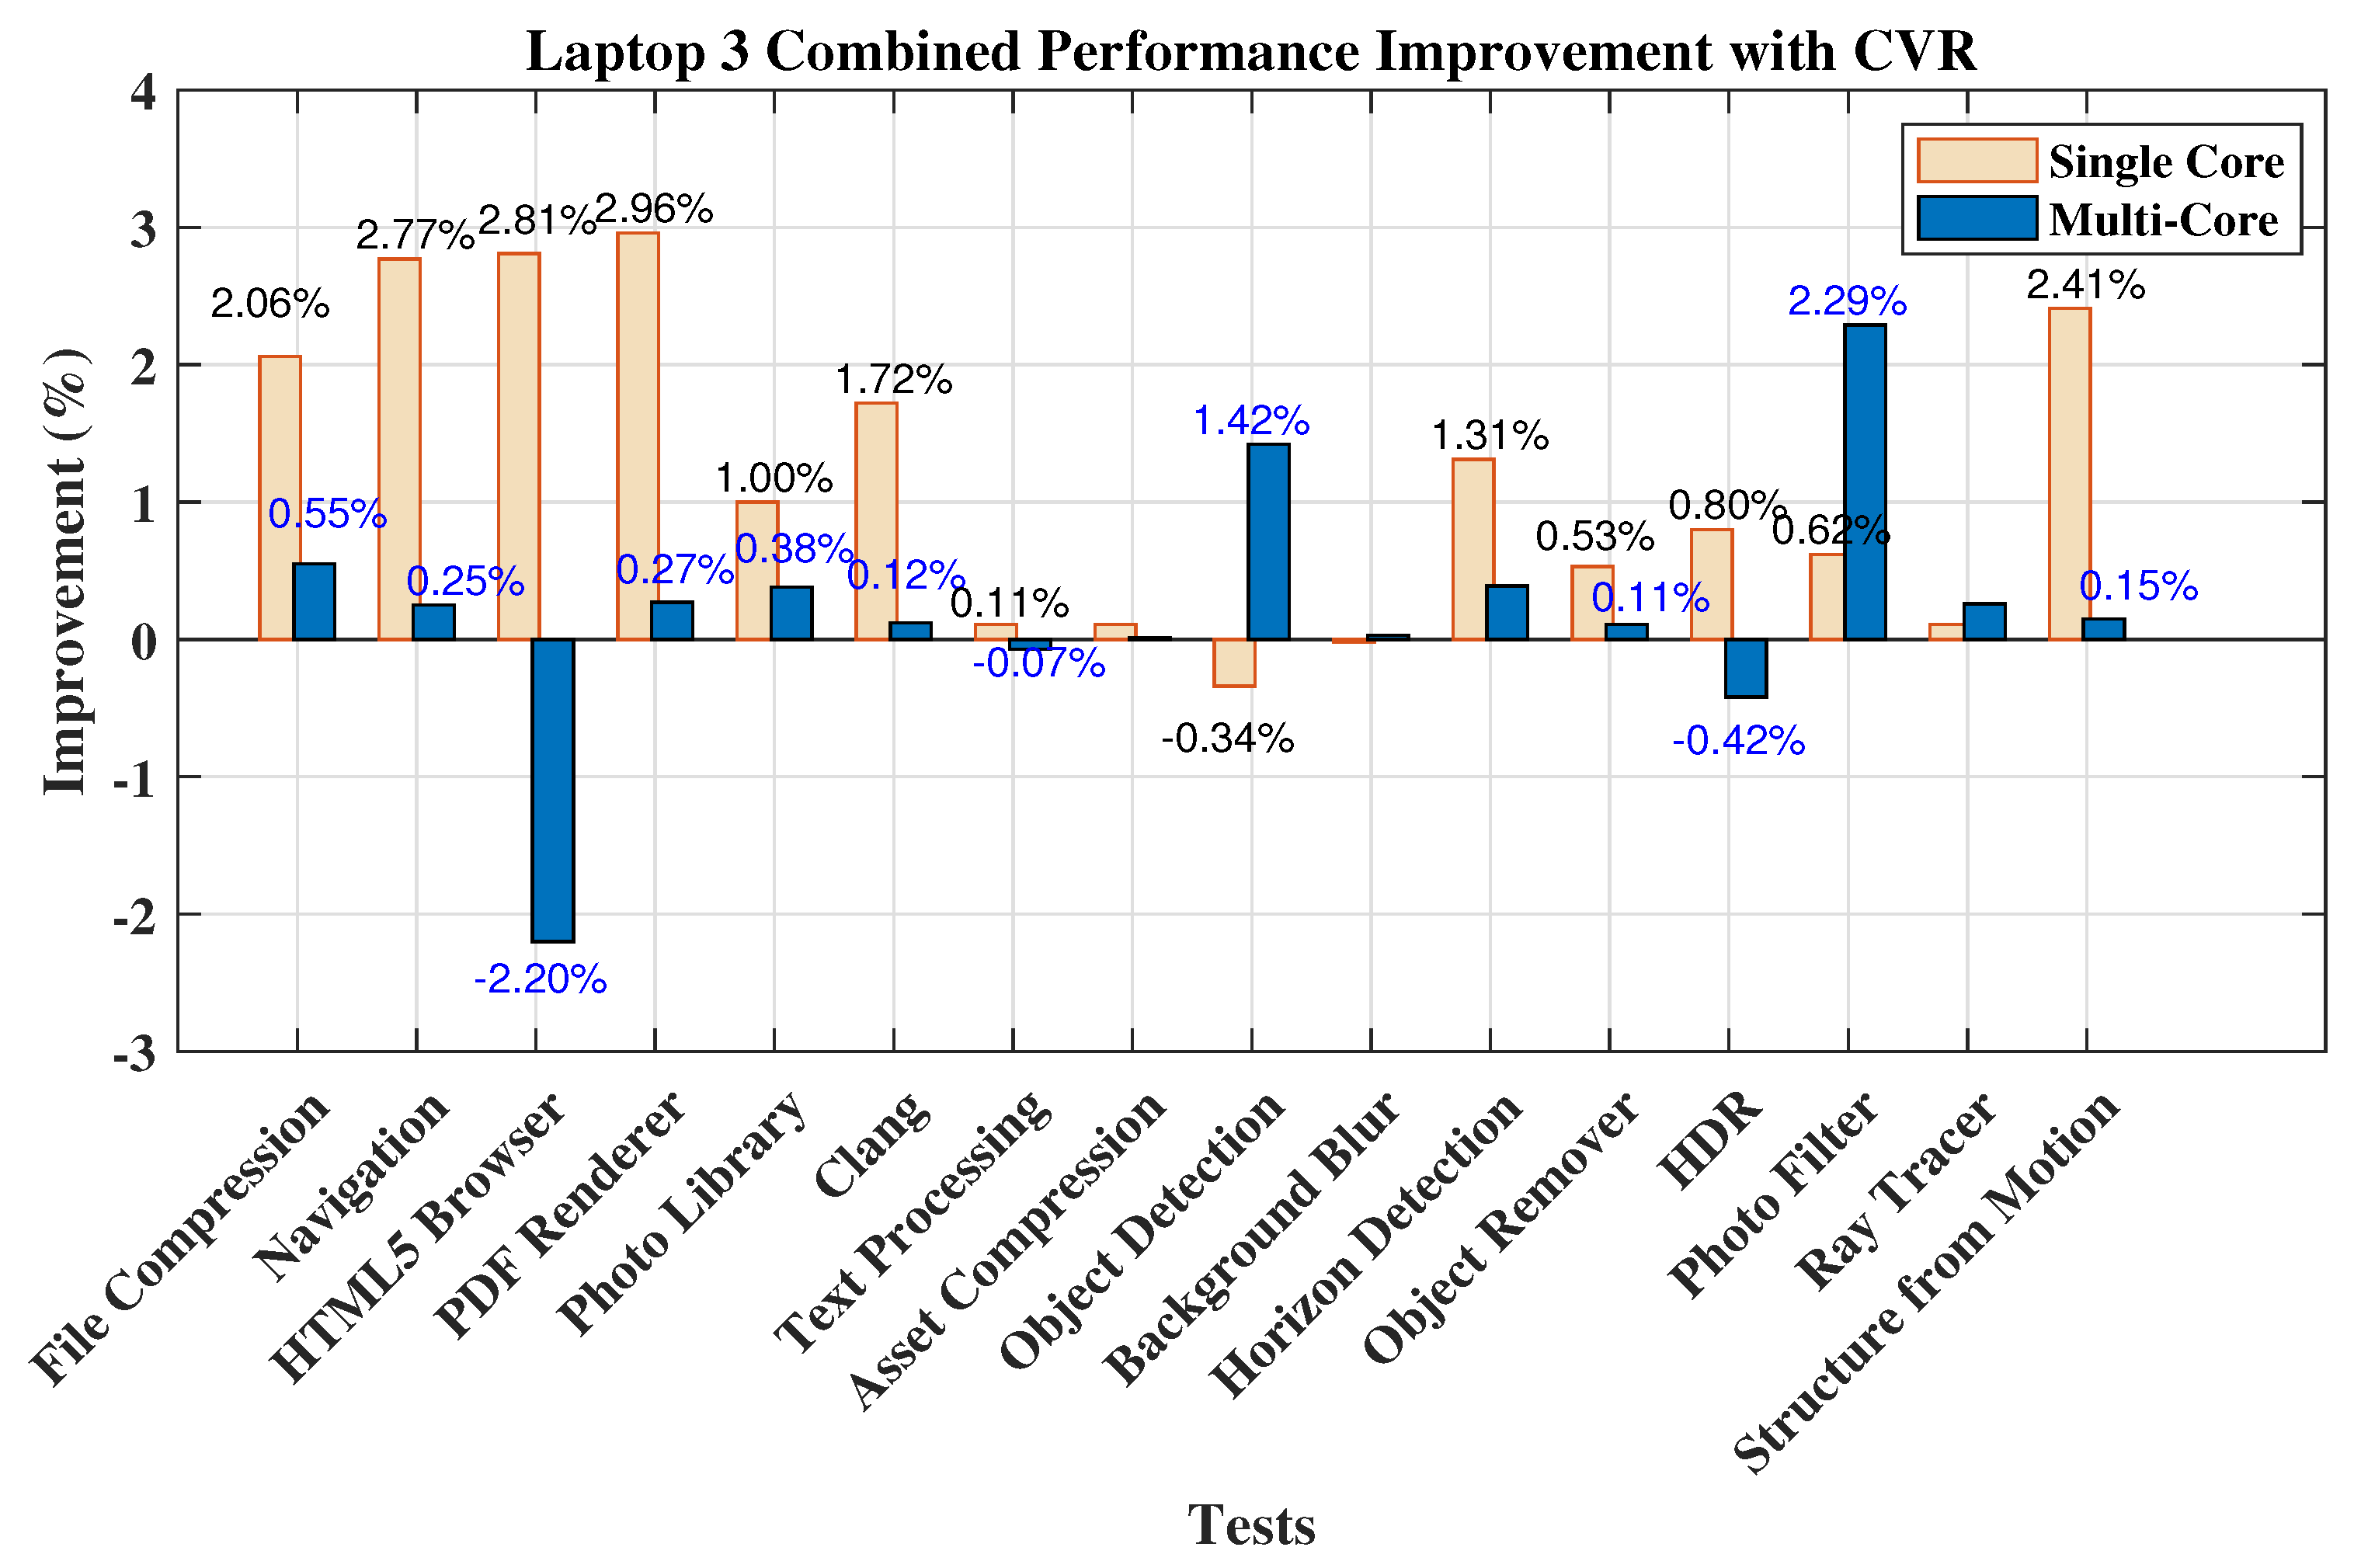
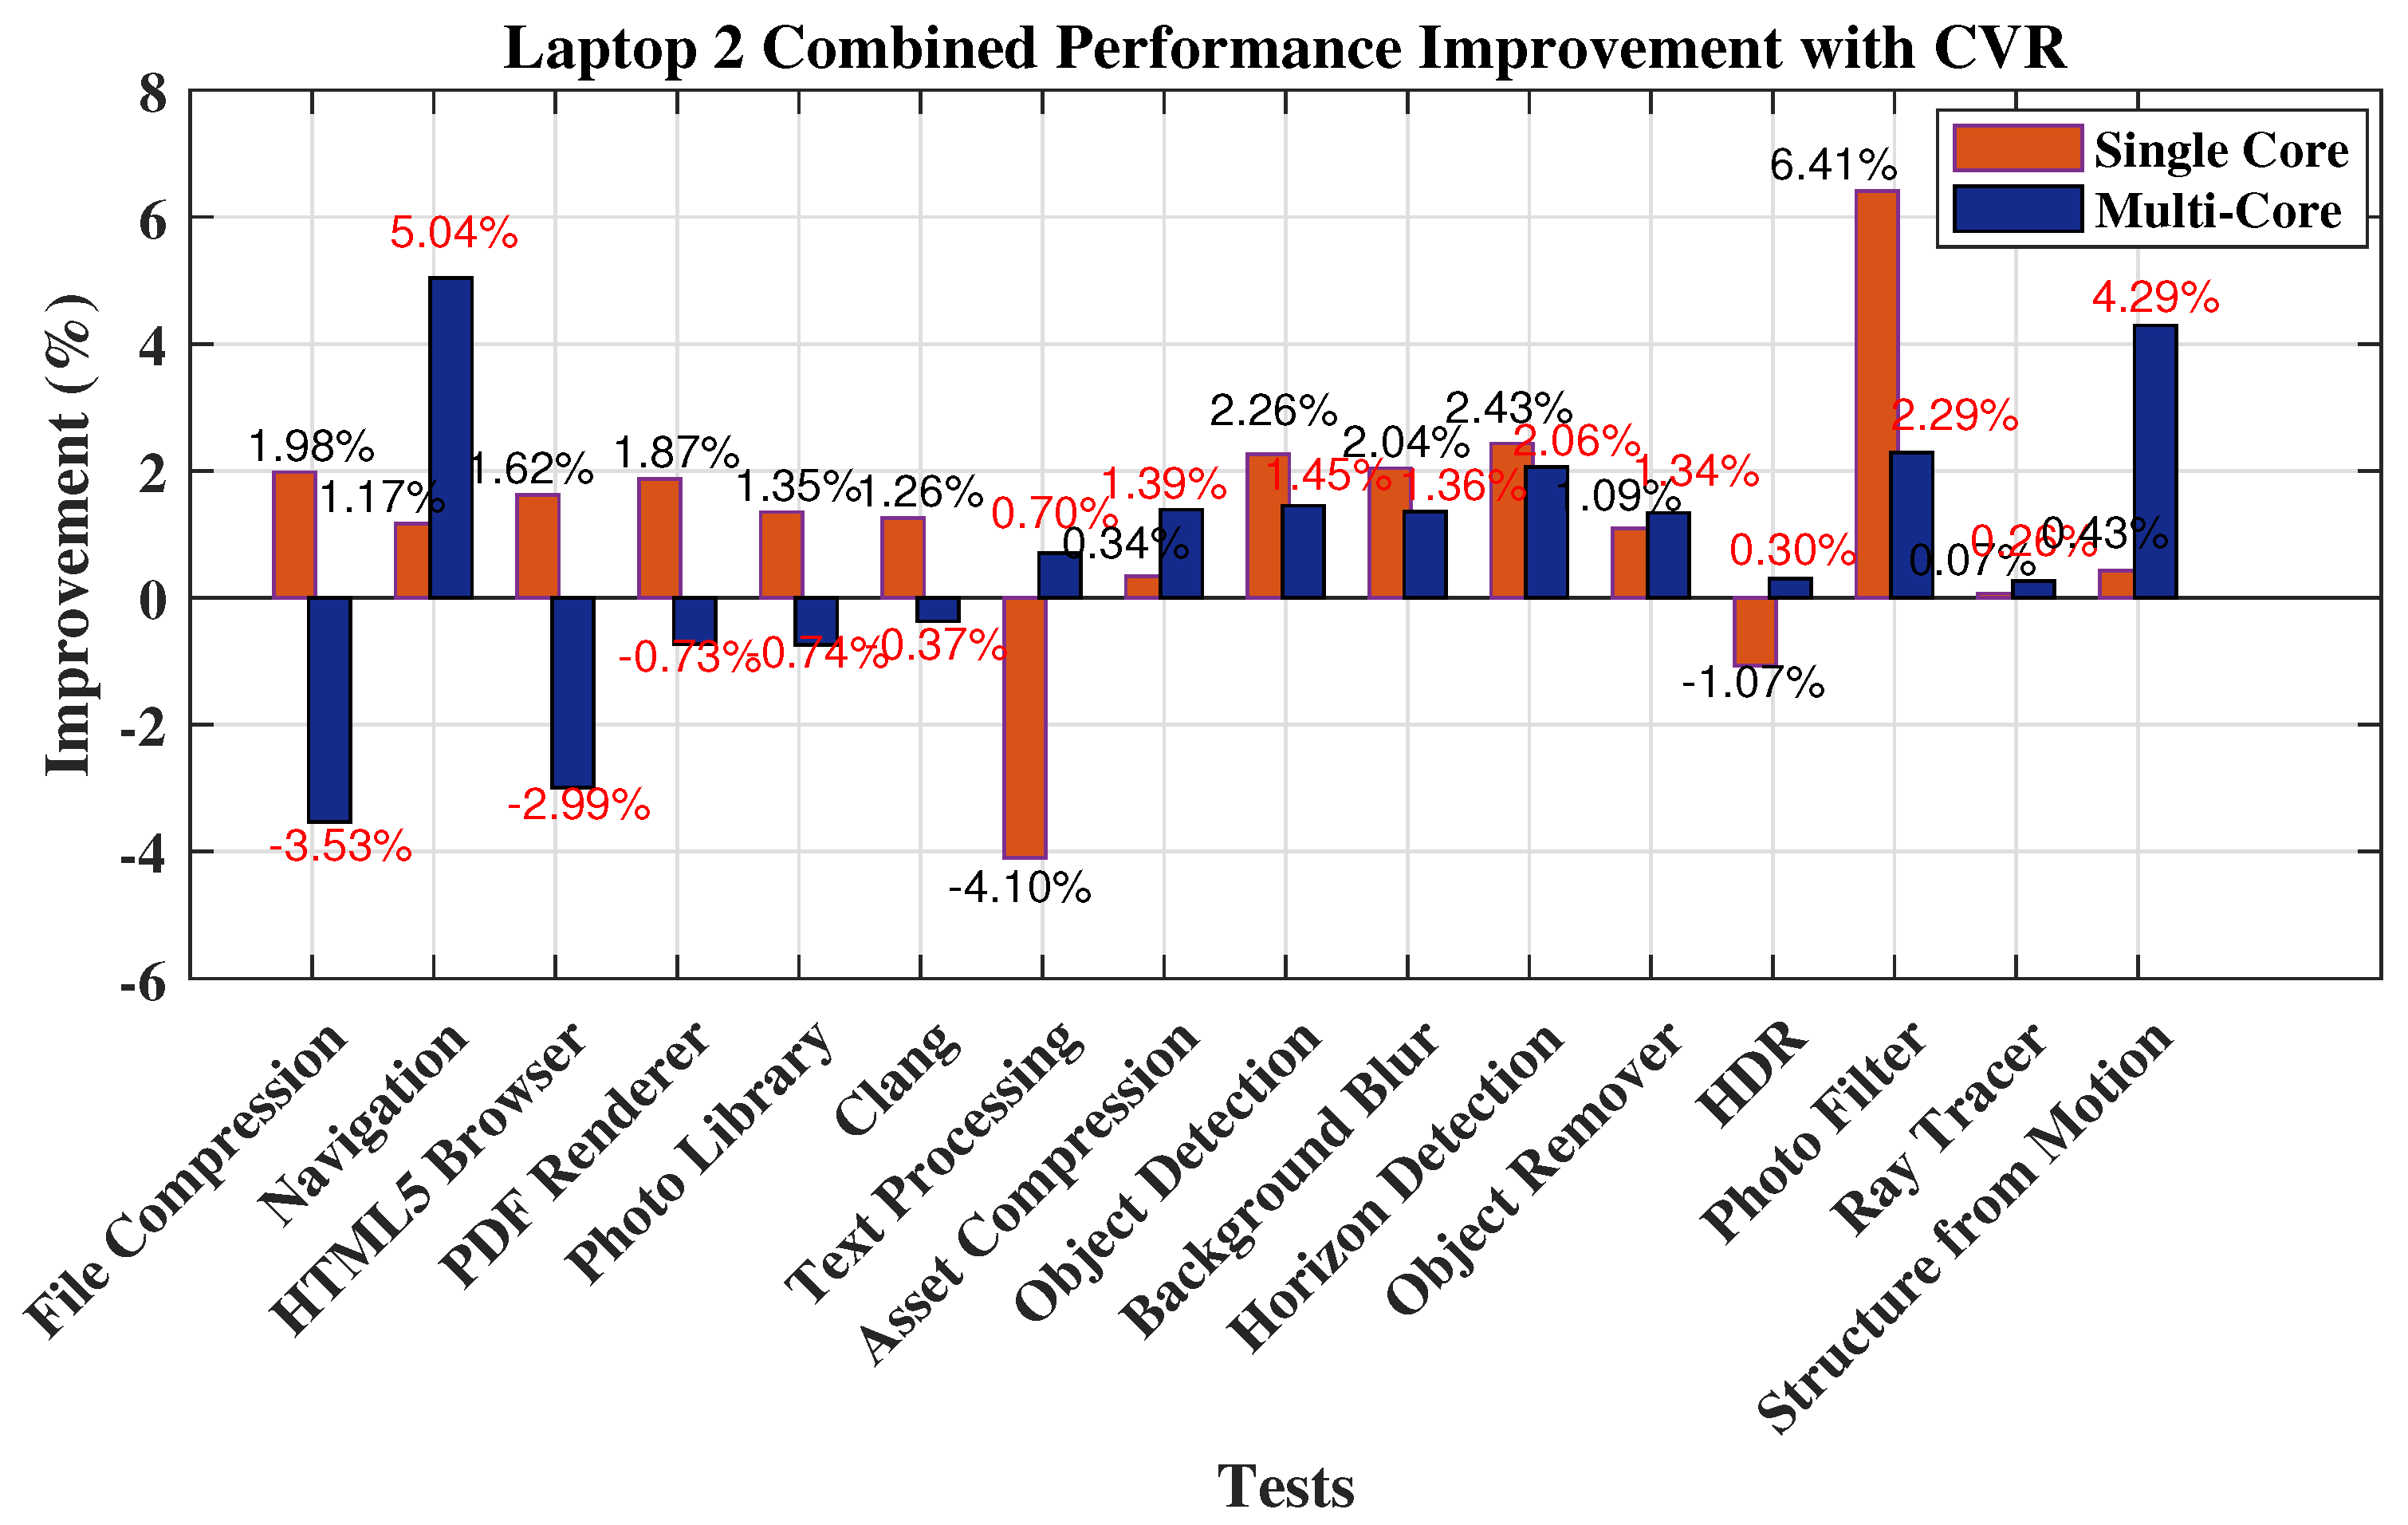
Table 5, Table 6, Table 7, Table 8, Table 9 and Table 10 offer more in-depth insights into the performance dynamics of particular devices. The Single-Core improvements that have been found for laptops vary from 1.09% to 4.27%, with Laptop 3 demonstrating the greatest improvement as shown in Figure 4. Performance variations in Multi-Core scenarios are negligible, ranging from −0.14% to 1.29%. Laptop 2 continues to increase its Single-Core performance while experiencing a minor drop in Multi-Core performance.
Table 6.
Performance of Laptop 2 without CVR vs. with CVR.
Table 7.
Performance of Laptop 3 without CVR vs. with CVR.
Table 8.
Performance of Desktop 1 without CVR vs. with CVR.
Table 9.
Performance of Desktop 2 without CVR vs. with CVR.
Table 10.
Performance of Desktop 3 without CVR vs. with CVR.

Figure 4.
Performance improvement for Laptop 3.
With CVR, Laptop 2 shows a little improvement in several Single- and Multi-Core performance tests. For Single-Core jobs, there is a slight overall improvement of 1.09%; however, for Multi-Core workloads, there is very little difference, at 0.14%. The performance improvements are visibly represented in the accompanying Figure 5, which emphasizes the slight impact of CVR on Laptop 2’s total score.
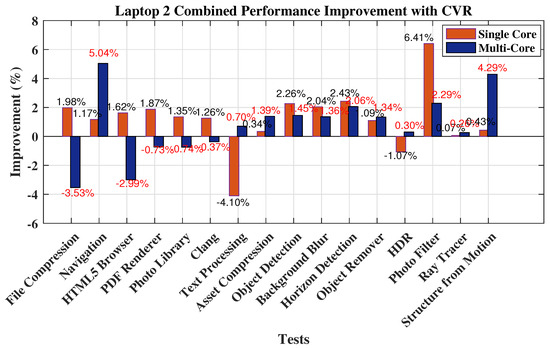
Figure 5.
Performance improvement for Laptop 2.
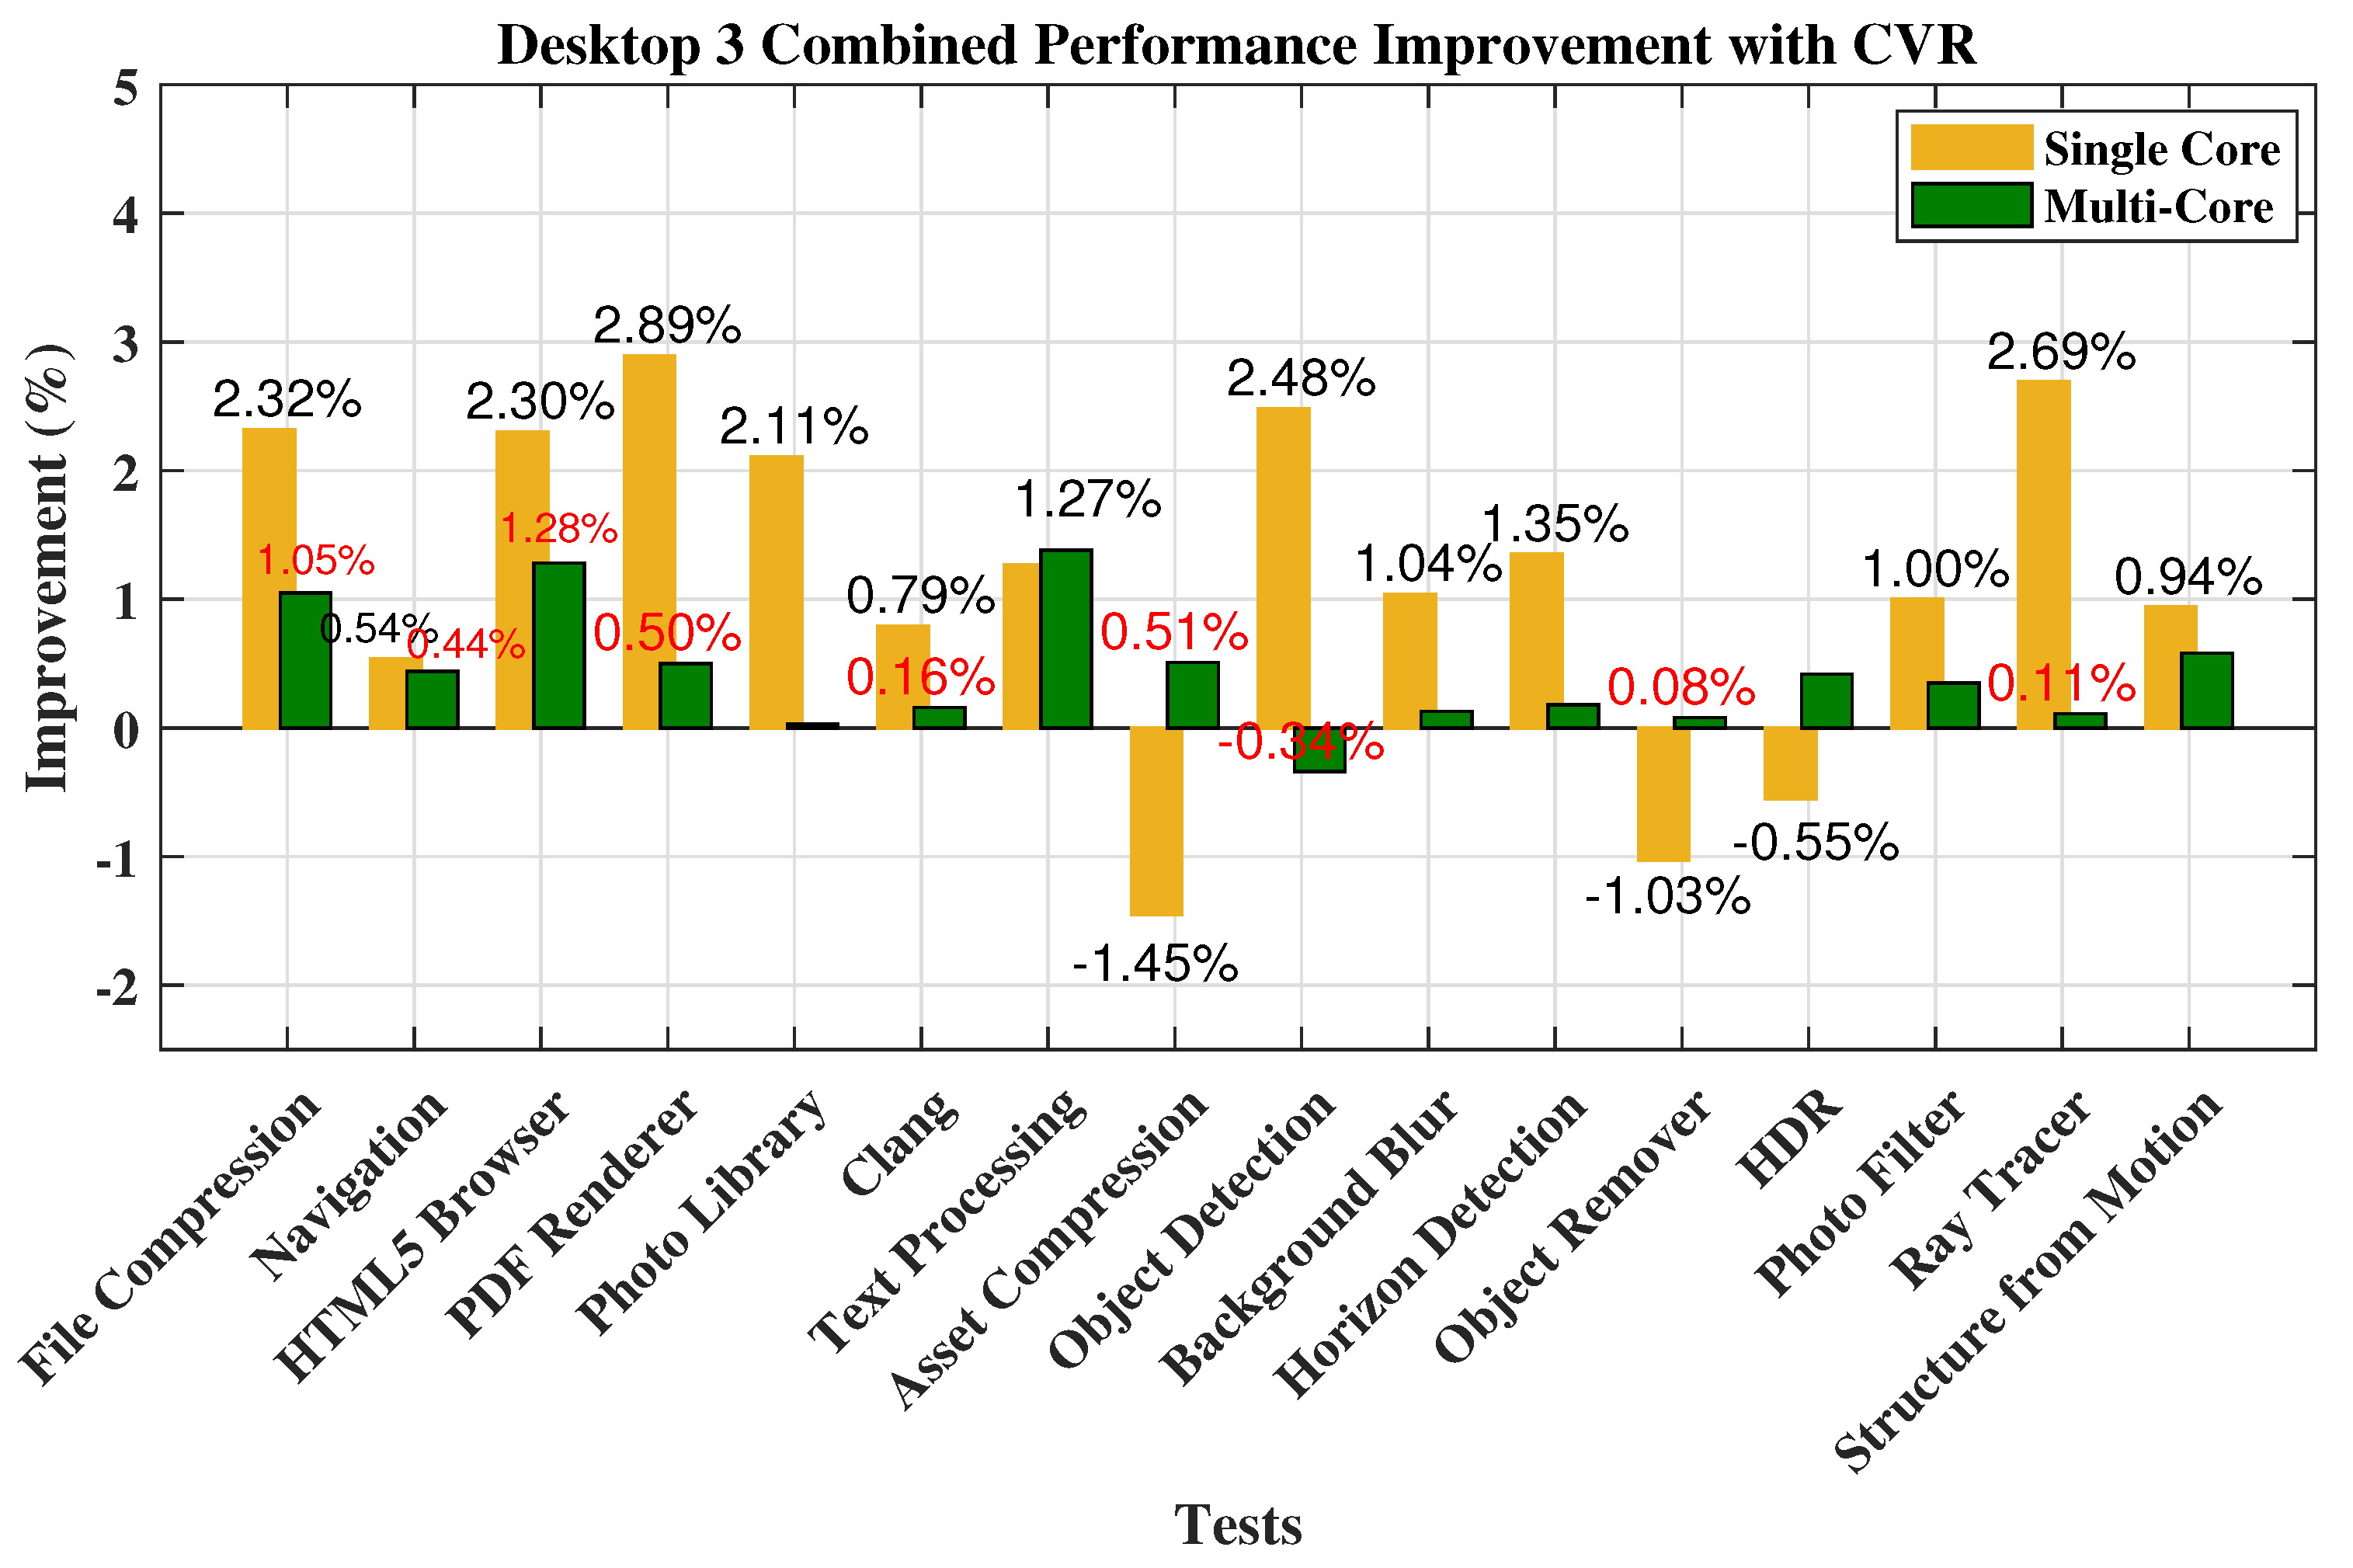
Notably, Desktops 1 in Figure 6 and Desktop 3 in Figure 7 exhibit notable Multi-Core improvements of 8.06% and 1.35%, respectively, whilst Desktop 2 has a more evenly distributed improvement of 4.59% and 1.29% in both Single and Multi-Core cases as shown in Figure 8. The results point to the necessity for device-specific energy optimization techniques since they imply that the effects of CVR differ throughout devices.
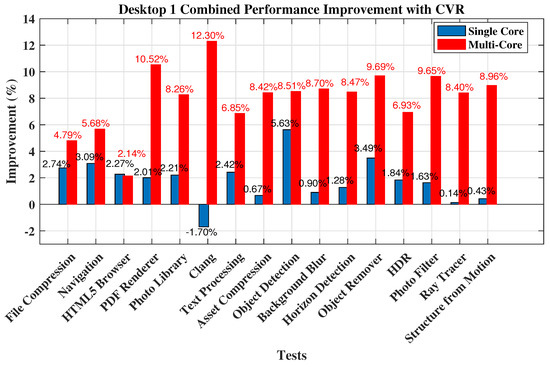
Figure 6.
Performance improvement for Desktop 1.

Figure 7.
Performance improvement for Desktop 3.
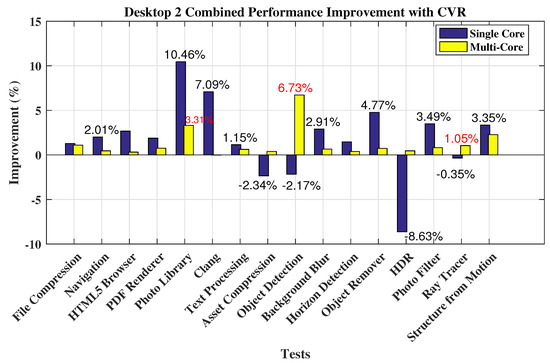
Figure 8.
Performance improvement for Desktop 2.
Additionally, the experiments that show negative improvements—like HDR in Desktop 2 and Object Remover in Laptop 3—highlight how crucial it is to take into account a variety of workloads and potential trade-offs when putting CVR solutions into practice. The study promotes a sophisticated approach to sustainable computing by offering insightful information about how to customize energy-saving strategies for certain devices and workloads.
The results of CVR on Desktop 1 as shown in Figure 6 are not all the same. For example, while Clang (−1.70%) shows a fall, file compression (2.74%), and navigation (3.09%) show improvements. The significant increases observed in Multi-Core activities, such as object removal and background blur (8.70% and 9.69%, respectively), highlight the influence of CVR on overall performance.
Table 8 shows Desktop 1’s performance in various tests both with and without CVR. Tasks like file compression (4.79%) and navigation (5.68%) show notable gains, adding up to an overall 1.51% rise in Single-Core performance and 8.06% increase in Multi-Core performance score. Figure 6 shows notable improvement of 12.30% in Multi-Core performance is observed in resource-intensive tasks such as Clang compilation, where the influence of CVR is especially noticeable. These results imply that CVR enhances Desktop 1’s total computational power, particularly in situations that call for parallel processing.
The detailed performance metrics for Desktop 2 can be found in Table 9, while the corresponding performance improvement chart is illustrated in Figure 8. A notable 4.59% improvement in total performance is shown by Desktop 2 with CVR, which is mostly driven by gains in resource-intensive operations such as Clang compilation. Although there are some Single-Core performance losses in some activities, CVR improves the device’s computational power.
Performance Enhancement Ratio Analysis
A more complex view of how CVR affects desktop and laptop performance may be seen in the Performance Enhancement Ratio (PER) Table 11. Notable differences are seen between devices and performance indicators. Desktop 1 shows that CVR improves performance by 1.53% for Single-Core and 8.76% for Multi-Core, demonstrating its beneficial effects on a range of configurations. Comparable patterns are shown for Desktops 2 and 3, emphasizing the variable but generally advantageous effect of CVR on performance indicators. Additionally, laptops display device-specific reactions. For example, Laptop 1 shows a significant 4.27% boost in Multi-Core performance and a 1.34% rise in Single-Core performance. Laptop 3 also shows a 4.12% increase in Single-Core and a 0.81% increase in Multi-Core performance. These results highlight how CVR’s impact on performance varies depending on the device and configuration, offering insightful advice on how to maximize energy conservation without sacrificing computational power on a wide variety of computing systems.
Table 11.
Performance Enhancement Ratio for all systems.
The performance evaluation of Desktop 3, detailed in Table 10, demonstrates a 3.19% improvement in Single-Core performance and a 1.35% enhancement in Multi-Core performance with CVR. Figure 7 visually illustrates the performance improvement for Desktop 3, highlighting the overall positive impact of CVR across various tests.
5.4. Power Supply Unit (PSU) Measurements Analysis
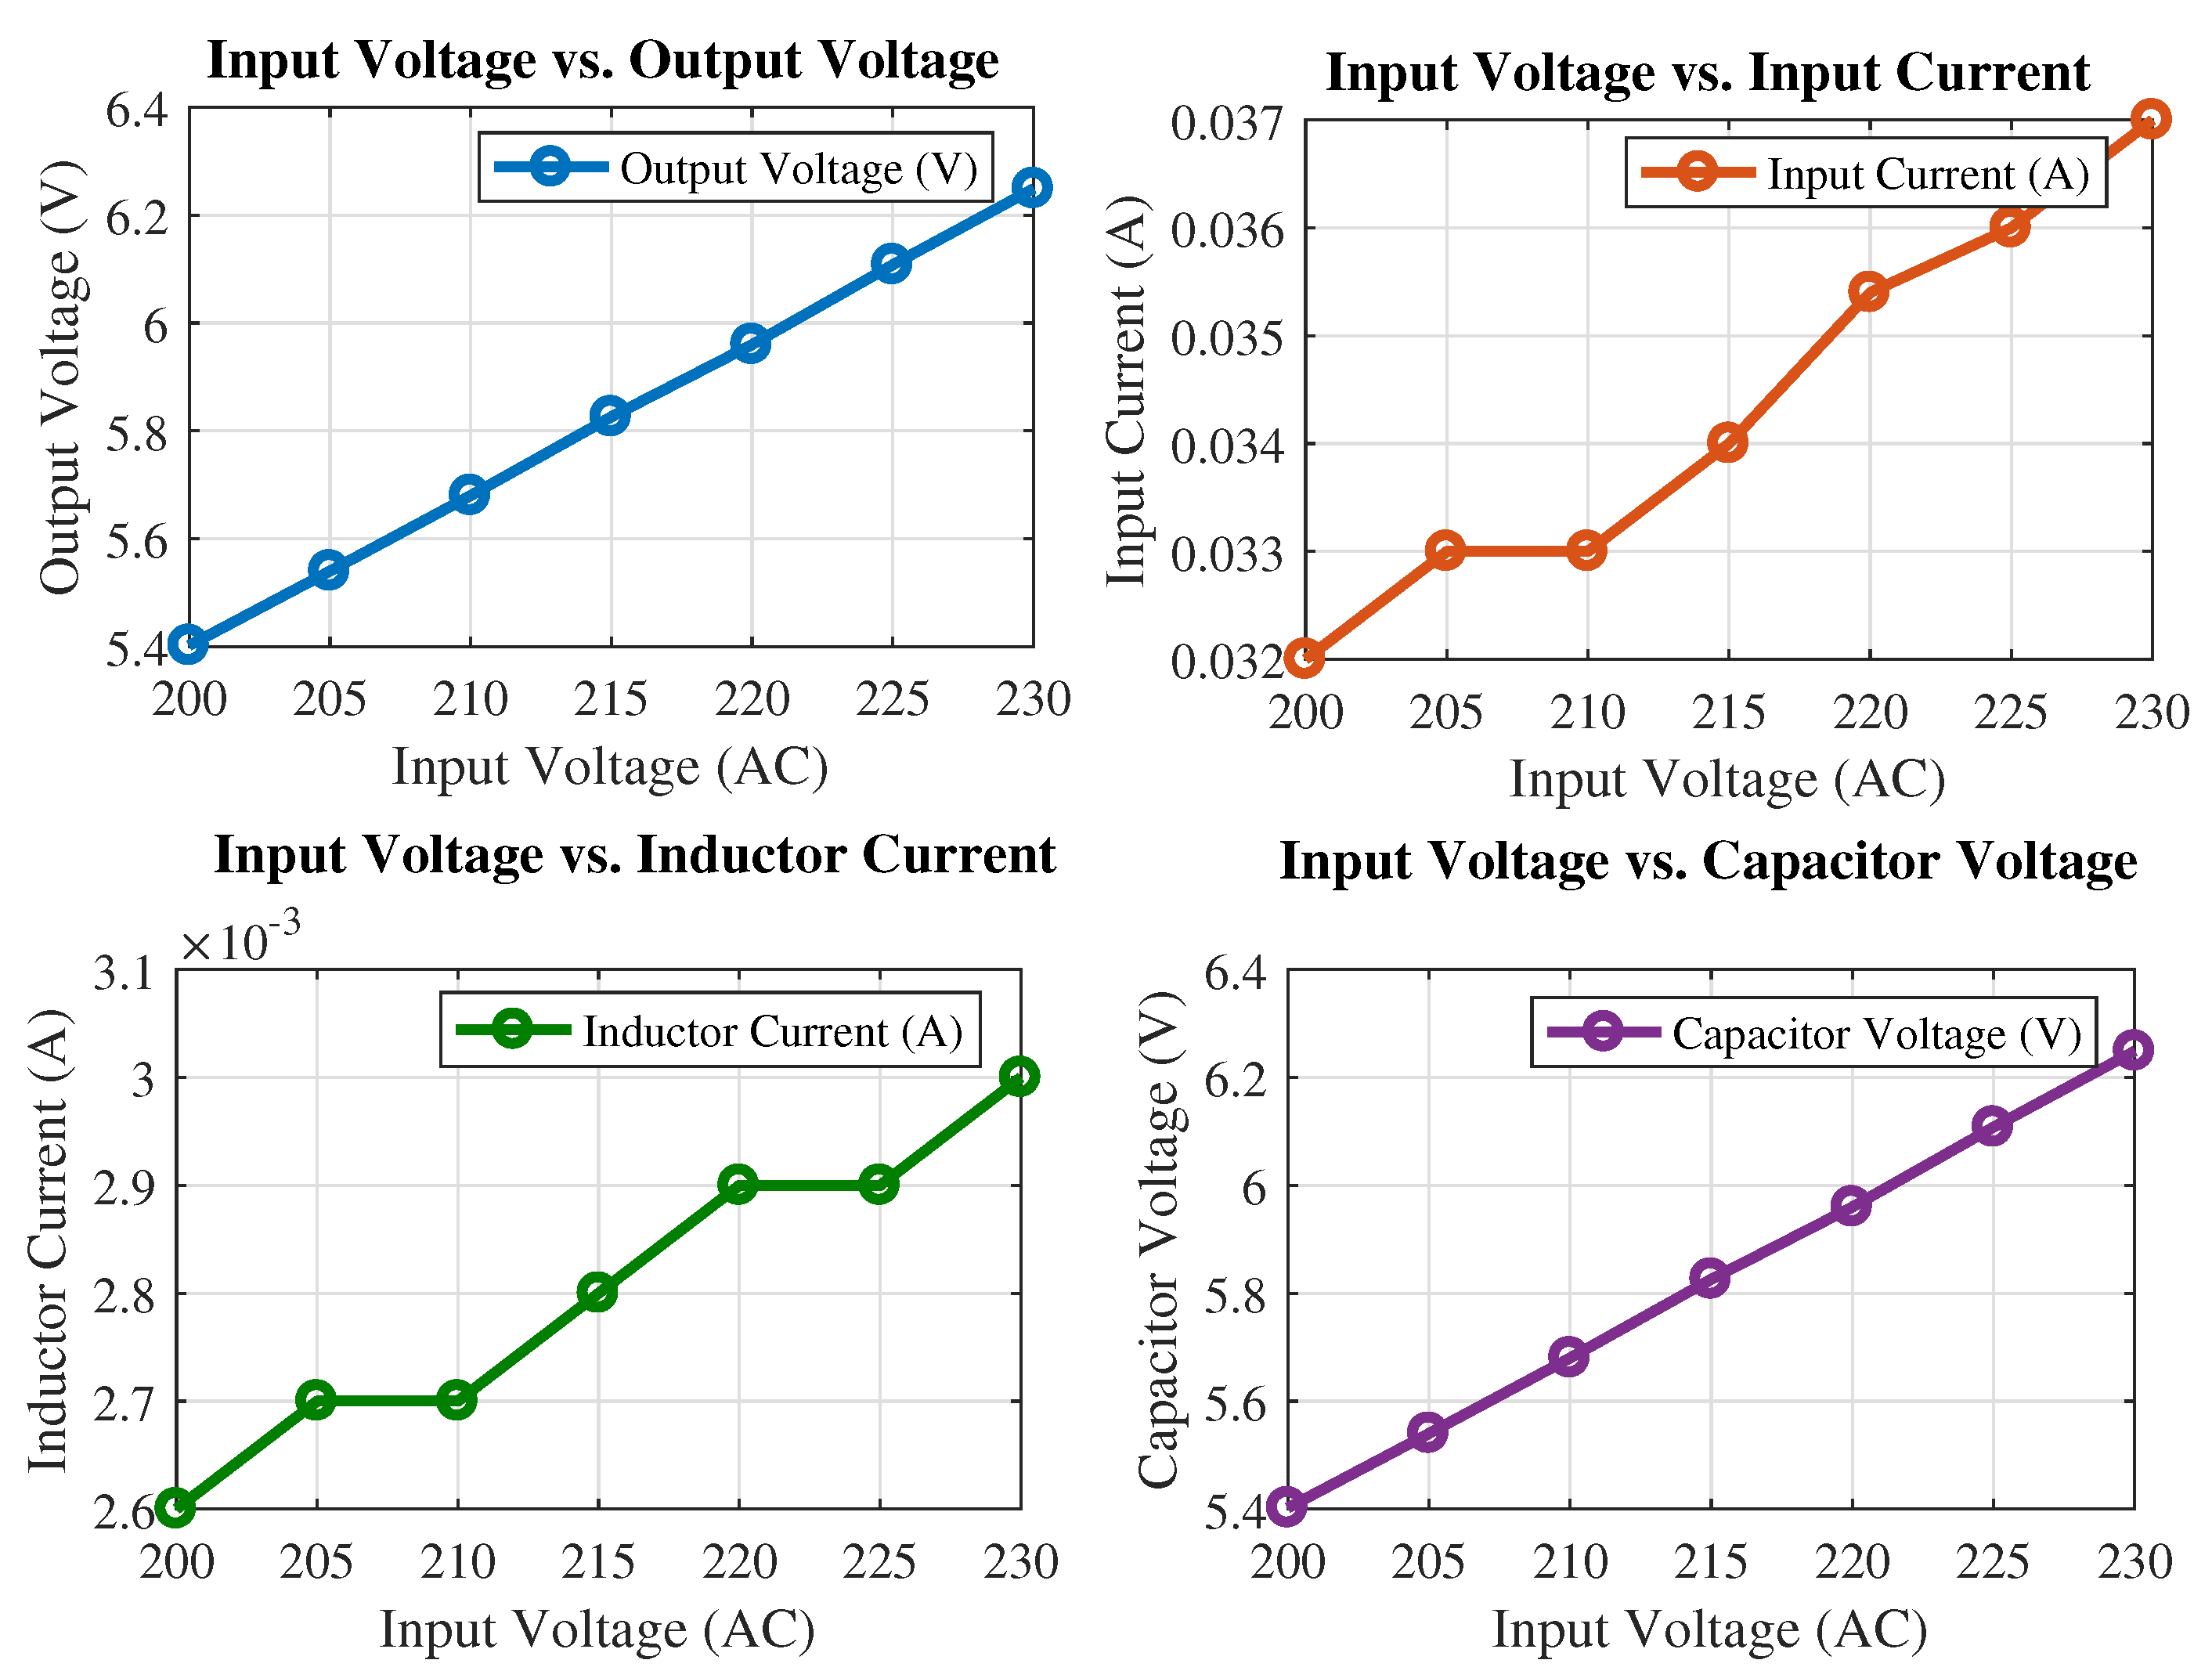
Significant insights into the behavior of the PSU within the context of CVR can be gained from the examination of the PSU measurements, as shown in Table 12 and Figure 9. Interestingly, the input current decreases in proportion to the decrease in input voltage, indicating that the PSU is flexible with different input circumstances. This pattern is reflected in the dynamics of the inductor and capacitor, demonstrating how sensitive the PSU is to variations in input voltage. The output voltage and current likewise show proportionate drops, highlighting the PSU’s ability to stay stable even with fluctuating input voltages. In Figure 9, the diverse relationships between input voltage and various parameters reveal intriguing insights into the power supply unit’s behavior. The linear correlation between input voltage and output voltage signifies a stable operational region, suggesting a proportional response. Conversely, the wired relationship between input voltage and input current hints at the intricate interplay of components influenced by voltage fluctuations. Non-linear trends observed in plots like input voltage vs. output current underscore the system’s nuanced behavior, possibly involving threshold effects or transitions between operational modes. The presence of abrupt points in the plots may indicate critical thresholds or trigger points for specific mechanisms, warranting further investigation. These characteristics play a pivotal role in understanding the power supply unit’s performance, stability, and reliability under varying input conditions.
Table 12.
Power supply unit results.

Figure 9.
Power supply unit results.
These results imply that the PSU has qualities that make it suitable for implementing CVR, providing chances for energy-efficient computing techniques and possible advancements in thermal management. The PSU’s observed adaptability serves as a basis for optimization techniques to boost energy efficiency without sacrificing system stability.
5.5. Thermal Performance Analysis under Variable Voltage Conditions
Table 13 provides comprehensive information regarding the thermal behavior of Desktops 1, 2, and 3 and Laptops 1, 2, and 3 at different voltage levels. Interestingly, compared to Desktops 1 and 2, Desktop 3 continuously maintains lower temperatures throughout a range of voltage levels, suggesting a more effective thermal design. Laptop 3 had the lowest temperatures of all the computers, especially when the voltage is reduced, demonstrating excellent thermal control. The effect of CVR on thermal performance is an interesting finding. Data analysis indicates that devices with CVR, including the Desktop 3 and Laptop 3, have better thermal efficiency. Over a range of voltage settings, the temperatures measured for Desktop 3 and Laptop 3 are noticeably lower than those of their counterparts (Desktops 1 and 2, and Laptops 1 and 2, respectively). This demonstrates how CVR can improve thermal performance, resulting in more ideal operating temperatures and possibly extending the lifespan of devices.These new results highlight the significance of CVR in obtaining improved thermal efficiency as well as higher computing performance, as was previously mentioned. The use of CVR technology is a viable path for optimizing devices, providing a comprehensive method to enhance both computational efficiency and thermal properties.
Table 13.
Thermal performances of desktop and laptop.
6. Conclusions
Our thorough investigation into the effects of (CVR) on computing equipment offers insightful information on the two aspects of computational and thermal performance. Notable gains with CVR implementation are revealed by the analysis of CVR parameters, including Single-Core and Multi-Core performances across various devices (Desktops 1, 2, and 3 and Laptops 1, 2, and 3). Superior computational efficiency is a consistent feature of Desktop 3, and the overall performance enhancement ratio (PER) highlights the beneficial effects of CVR on Single-Core and Multi-Core processes. All these results highlight the comprehensive advantages of CVR, which include increased computing speed and improved thermal performance. A key component of device optimization is the conservation voltage reduction strategy, which provides a synergistic solution for increased computing efficiency and better thermal management. The integration of CVR stands out as a potential path in the ever-evolving field of computing technology, opening the door to more durable, effective, and sustainable computing equipment. This study establishes a solid foundation for further investigation and creativity in the field of computing technology, paving the way for future developments in voltage regulation techniques.
Author Contributions
M.A. (Muhammad Ayaz): conceptualization, methodology, writing—original draft preparation. S.M.H.R.: supervision, conceptualization, methodology, writing—review and editing. M.A. (Muhammad Akbar): supervision, writing—review and editing. All authors have read and agreed to the published version of the manuscript.
Funding
This research received no external funding.
Data Availability Statement
For benchmarking purposes, we utilized Geekbench, and the data supporting the reported results can be accessed through the official Geekbench website (https://www.geekbench.com/ (accessed on 25 December 2023). Additionally, LVDAC (LabVolt Data Acquisition and Control by Festo) was employed in our study. Data generated or analyzed using LVDAC can be made available upon request due to privacy and ethical considerations. Please contact the corresponding author for further details.
Conflicts of Interest
The authors declare no conflict of interest.
References
- Nourollahi, R.; Salyani, P.; Zare, K.; Mohammadi-Ivatloo, B.; Abdul-Malek, Z. Peak-Load Management of Distribution Network Using Conservation Voltage Reduction and Dynamic Thermal Rating. Sustainability 2022, 14, 11569. [Google Scholar] [CrossRef]
- Rahman, M.M.; Saha, S.; Majumder, M.Z.H.; Suki, T.T.; Rahman, M.H.; Akter, F.; Haque, M.A.S.; Hossain, M.K. Energy Conservation of Smart Grid System Using Voltage Reduction Technique and Its Challenges. Sustainability 2022, 9, 924–938. [Google Scholar]
- Gorjian, A.; Eskandari, M.; Moradi, M.H. Conservation Voltage Reduction in Modern Power Systems: Applications, Implementation, Quantification, and AI-Assisted Techniques. Energies 2023, 16, 2502. [Google Scholar] [CrossRef]
- Moradzadeh, A.; Sadeghian, O.; Pourhossein, K.; Mohammadi-Ivatloo, B.; Anvari-Moghaddam, A. Improving residential load disaggregation for sustainable development of energy via principal component analysis. Sustainability 2020, 12, 3158. [Google Scholar] [CrossRef]
- Anvari-Moghaddam, A.; Mohammadi-Ivatloo, B.; Asadi, S.; Larsen, K.G.; Shahidehpour, M. Sustainable Energy Systems Planning, Integration, and Management. Appl. Sci. 2019, 9, 4451. [Google Scholar] [CrossRef]
- Liu, Y.; Wang, X.; Zhao, L.; Liu, Y. Admittance-based load signature construction for non-intrusive appliance load monitoring. Energy Build. 2018, 171, 209–219. [Google Scholar] [CrossRef]
- Hua, H.; Qin, Z.; Dong, N.; Qin, Y.; Ye, M.; Wang, Z.; Chen, X.; Cao, J. Data-Driven Dynamical Control for Bottom-up Energy Internet System. IEEE Trans. Sustain. Energy 2022, 13, 315–327. [Google Scholar] [CrossRef]
- Lamedica, R.; Sorbillo, C.; Prudenzi, A. The continuous harmonic monitoring of single-phase electronic appliances: Desktop PC and printers. In Proceedings of the Ninth International Conference on Harmonics and Quality of Power. Proceedings (Cat. No. 00EX441), Orlando, FL, USA, 1–4 October 2000; Volume 2, pp. 697–702. [Google Scholar]
- 61000-3; Electromagnetic Compatibility. Part 3: Limits-Section 2: Limits for harmonic Current Emissions (Equipment Input Current < 16 A per Phase). IEC Standard: Newark, DE, USA, 1995.
- Nazari-Heris, M.; Mirzaei, M.A.; Mohammadi-Ivatloo, B.; Marzband, M.; Asadi, S. Economic-environmental effect of power to gas technology in coupled electricity and gas systems with price-responsive shiftable loads. J. Clean. Prod. 2020, 244, 118769. [Google Scholar] [CrossRef]
- Miyasawa, A.; Fujimoto, Y.; Hayashi, Y. Energy disaggregation based on smart metering data via semi-binary non-negative matrix factorization. Energy Build. 2019, 183, 547–558. [Google Scholar] [CrossRef]
- Bascetin, A.; Adiguzel, D.; Lü, S.T.; Karadogan, A.; Caglayan, M. The control of energy consumption and the investigation of CO2 emissions in the production of aggregate. Gazi Univ. J. Sci. 2011, 24, 647–656. [Google Scholar]
- Piette, M.; Eto, J.; Harris, J. Office Equipment Energy Use and Trends; LBNL Report #: LBL-31308; Lawrence Berkeley National Laboratory: Berkeley, CA, USA, 1991. [Google Scholar]
- National Grid Electricity System Operator. Power Quality in the GB Transmission Network: A System Operability Framework Document; National Grid Electricity System Operator: London, UK, 2023; Available online: https://www.nationalgrideso.com/document/277891/download (accessed on 28 December 2023).
- Mohod, S.W.; Aware, M.V. Power quality and grid code issues in wind energy conversion system. In An Update on Power Quality; IntechOpen: London, UK, 2013; pp. 21–36. [Google Scholar]
- Saqib, M.A.; Saleem, A.Z. Power-quality issues and the need for reactive-power compensation in the grid integration of wind power. Renew. Sustain. Energy Rev. 2015, 43, 51–64. [Google Scholar] [CrossRef]
- Rahman, M.T.; Hasan, K.N.; Sokolowski, P.; Mokhlis, H. Probabilistic Assessment of Conservation Voltage Reduction Using Static Load Model Parameter in the Presence of Uncertainties. IEEE Trans. Ind. Appl. 2023, 59, 2675–2685. [Google Scholar] [CrossRef]
- Xu, J.; Xie, B.; Liao, S.; Ke, D.; Sun, Y.; Jiang, X.; Yu, J. CVR-Based Real-Time Power Fluctuation Smoothing Control for Distribution Systems With High Penetration of PV and Experimental Demonstration. IEEE Trans. Smart Grid 2022, 13, 3619–3635. [Google Scholar] [CrossRef]
- Lakra, N.S.; Bag, B. Substation Demand Reduction using Combined Approach of CVR, VAr Optimization and Distributed Generation. In Proceedings of the 2022 Second International Conference on Advances in Electrical, Computing, Communication and Sustainable Technologies (ICAECT), Bhilai, India, 21–22 April 2022; pp. 1–6. [Google Scholar]
- Farkas, K.I.; Flinn, J.; Back, G.; Grunwald, D.; Anderson, J.M. Quantifying the energy consumption of a pocket computer and a Java virtual machine. In Proceedings of the 2000 ACM SIGMETRICS International Conference on Measurement and Modeling of Computer Systems, Santa Clara, CA, USA, 18–21 June 2000; pp. 252–263. [Google Scholar]
- Niewiadomska-Szynkiewicz, E.; Sikora, A.; Arabas, P.; Kołodziej, J. Control system for reducing energy consumption in backbone computer network. Concurr. Comput. Pract. Exp. 2013, 25, 1738–1754. [Google Scholar] [CrossRef]
- Lorch, J.R. A Complete Picture of the Energy Consumption of a Portable Computer. Master’s Thesis, University of California at Berkeley, Berkeley, CA, USA, 1995. [Google Scholar]
- Beitelmal, A.H.; Fabris, D. Servers and data centers energy performance metrics. Energy Build. 2014, 80, 562–569. [Google Scholar] [CrossRef]
- Zaim, O.; Gazel, T.U.; Akkemik, K.A. Measuring energy intensity in Japan: A new method. Eur. J. Oper. Res. 2017, 258, 778–789. [Google Scholar] [CrossRef]
- Hasanbeigi, A.; Hasanabadi, A.; Abdorrazaghi, M. Comparison analysis of energy intensity for five major sub-sectors of the textile industry in Iran. J. Clean. Prod. 2012, 23, 186–194. [Google Scholar] [CrossRef]
- Ahi, P.; Searcy, C.; Jaber, M.Y. Energy-related performance measures employed in sustainable supply chains: A bibliometric analysis. Sustain. Prod. Consum. 2016, 7, 1–15. [Google Scholar] [CrossRef]
- Luo, X.; Hong, T.; Chen, Y.; Piette, M.A. Electric load shape benchmarking for small- and medium-sized commercial buildings. Appl. Energy 2017, 204, 715–725. [Google Scholar] [CrossRef]
- Eyerman, S.; Eeckhout, L. System-level performance metrics for multiprogram workloads. IEEE Micro 2008, 28, 42–53. [Google Scholar] [CrossRef]
- Sherwood, T.; Perelman, E.; Hamerly, G.; Calder, B. Automatically characterizing large scale program behavior. ACM SIGPLAN Not. 2002, 37, 45–57. [Google Scholar] [CrossRef]
- Conte, T.M.; Hirsch, M.A.; Menezes, K.N. Reducing state loss for effective trace sampling of superscalar processors. In Proceedings of the International Conference on Computer Design (VLSI in Computers and Processors), Austin, TX, USA, 7–9 October 1996; pp. 468–477. [Google Scholar]
- Wunderlich, R.E.; Wenisch, T.F.; Falsafi, B.; Hoe, J.C. Smarts: Accelerating microarchitecture simulation via rigorous statistical sampling. In Proceedings of the 30th Annual International Symposium on Computer Architecture, San Diego, CA, USA, 9–11 June 2003; pp. 84–97. [Google Scholar]
- Yi, J.J.; Kodakara, S.V.; Sendag, R.; Lilja, D.J.; Hawkins, M.D. Characterizing and comparing prevailing simulation techniques. In Proceedings of the 11th International Symposium on High-Performance Computer Architecture, San Francisco, CA, USA, 12–16 February 2005; pp. 266–277. [Google Scholar]
- Yang, Z.; Hua, H.; Cao, J. A novel multiple impact factors based accuracy analysis approach for power quality disturbance detection. CSEE J. Power Energy Syst. 2020, 9, 88–99. [Google Scholar]
- Behzadirafi, S.; Malallah, Y.; Qaseer, L.; de León, F. Theoretical and Experimental Verification of CVR Energy Savings for Refrigeration Loads. IEEE Trans. Power Deliv. 2023, 38, 2489–2499. [Google Scholar] [CrossRef]
- Wang, Z.; Wang, J. Review on Implementation and Assessment of Conservation Voltage Reduction. IEEE Trans. Power Syst. 2014, 29, 1306–1315. [Google Scholar] [CrossRef]
- El-Shahat, A.; Haddad, R.J.; Alba-Flores, R.; Rios, F.; Helton, Z. Conservation Voltage Reduction Case Study. IEEE Access 2020, 8, 55383–55397. [Google Scholar] [CrossRef]
- Primate Labs. Geekbench. Available online: https://www.geekbench.com/ (accessed on 28 July 2023).
- Labvolt by Festo. Available online: https://labvolt.festo.com/ (accessed on 1 August 2023).
- CPUID HWMonitor. Available online: https://www.cpuid.com/softwares/hwmonitor.html (accessed on 28 July 2023).


Disclaimer/Publisher’s Note: The statements, opinions and data contained in all publications are solely those of the individual author(s) and contributor(s) and not of MDPI and/or the editor(s). MDPI and/or the editor(s) disclaim responsibility for any injury to people or property resulting from any ideas, methods, instructions or products referred to in the content. |
© 2024 by the authors. Licensee MDPI, Basel, Switzerland. This article is an open access article distributed under the terms and conditions of the Creative Commons Attribution (CC BY) license (https://creativecommons.org/licenses/by/4.0/).