Abstract
Fe-oxyhydroxides can incorporate toxic metals during the formation of mineral phases in soils and sediments, thereby potentially altering the environmental reactivity of metals and impacting the microbial communities. In this study, isothermal microcalorimetry has been used to monitor the metabolic activity of Pseudomonas putida KT2440 exposed to pure ferrihydrite and to Pb-, Cd-, and As-bearing ferrihydrites under oxygen-limited conditions. Calorimetric measurements of the integral heat released during the exponential growth were combined with the analysis of dissolved iron and heavy metals, as well as the glucose uptake, to understand how heavy metal incorporation modifies mineral reactivity and microbial heat output. Pure ferrihydrite decreased the integral heat by about 45%, primarily due to glucose and phosphate depletion, Fe(III) leaching, and mineral–cell aggregation. Heavy metal dopants were found to modulate nutrient availability, surface charge, and Fe solubilization, which, in turn, influenced the integral heat. Pb-Fh generated the highest ferrihydrite dissolution and metabolic heat, with a maximum effect at intermediate substitution levels. As-Fh induced moderate Fe release and metabolic activity, consistent with the enhanced phosphate sorption and lowered surface charge. Cd-bearing Fh showed minimal reactivity and yielded the lowest heat output. Microcalorimetry was proven useful for unraveling microbe–mineral interactions in complex contaminated environments.
1. Introduction
Human activities have substantially increased the concentrations of heavy metals in soils. In the case of cadmium, lead, and arsenic, these concentrations often exceed the safety thresholds established by the European Union (EU) and the World Health Organization (WHO) [1,2]. Such elements, classified as priority pollutants by international environmental protection agencies, pose a significant concern due to their persistence, bioaccumulation, and toxicity. In particular, elevated pollution levels in soils present a serious threat to soil microbial communities, which are essential for ecosystem functioning, nutrient cycling, and overall resilience [3,4].
During the formation of mineral soil phases, heavy metals can be immobilized through incorporation into newly formed minerals [5]. Iron oxides, in particular, play a central role in this process due to their high specific surface area, porosity, and chemical reactivity [6]. As a result, they strongly influence the speciation and fate of elements in soils and sediments. Among them, ferrihydrite (Fh), a poorly crystalline and highly reactive Fe-oxyhydroxide [7], is particularly prevalent in soils and sediments and has been shown to incorporate significant amounts of heavy metals during its formation [8]. However, the impact of such incorporation on microbial activity remains largely unexplored.
The toxic effects of heavy metals on soil bacteria have traditionally been investigated using various analytical procedures, including optical density, colony-forming unit (CFU) counts, respirometry (O2 and CO2), enzymatic activity measurements (e.g., dehydrogenase activity), and biomass or protein quantification [9]. A key parameter often derived from such experiments is the half-maximal inhibitory concentration (IC50), which provides a quantitative measure of metal toxicity. Reported IC50 values for free Pb(II) and Cd(II) species present in the growth media of aerobic bacteria typically ranged between 3 and 7 mg∙L−1, depending on the microbial species and experimental conditions [10]. The effect of soil particles, and especially that of nanoparticles, has also been reported in several papers. For example, the 6–9 nm size Fe3O4 nanoparticles showed minimum inhibitory concentrations of 32 µg∙mL−1 for S. marcescens, 64 µg∙mL−1 for E. coli, and 128 µg∙mL−1 for P. aeruginosa, while other studies reported values around 250 µg∙mL−1 for E. coli under different synthesis and dispersion conditions [11,12]. In soil microbial communities, iron oxides nanoparticles rarely yielded a single IC50 value. Instead, they induced shifts in bacterial composition and enzymatic activities (e.g., dehydrogenase, urease, phosphatase), often stimulating activity at low concentrations and inhibiting it at higher ones [13]. Overall, IC50 values obtained for iron oxide particles typically spanned from a few tens to over a thousand µg∙mL−1, underscoring the strong dependence on particle size, aggregation, and surface chemistry [14]. These findings emphasized the need for standardized characterization (e.g., mean size, zeta potential, crystalline phase, soil properties) to enable robust comparisons and ecological relevance [15].
Microcalorimetry has been also applied to investigate the impact of heavy metals and mineral nanoparticles on microbial growth and metabolism [16]. Several studies have demonstrated the sensitivity of microcalorimetry in detecting the inhibitory effects of heavy metals on bacterial cultures. Studies with E. coli [17] and Pseudomonas species [18], for instance, revealed clear toxicity hierarchies based on heat-flow responses and metabolic enthalpy, while soil microcosm experiments similarly produced consistent metal-toxicity rankings across multiple contaminants [17]. Beyond heavy metals, ferrihydrite was shown to inhibit thermophilic methanogenic communities, reducing methane production, while also acting as a selective electron acceptor in the enrichment of iron-reducing bacteria [19].
Microcalorimetry potentially offers an advantage over classical methods, especially in complex media. For example, optical density measurements are often biased by light scattering or absorption in the presence of nanoparticles. Protein quantification assays may be affected by nanoparticle–protein interactions or matrix interference. On the contrary, continuous recording of the heat effects has considerable potential for real-time monitoring of microbial activity. However, the impossibility of defining the real limits of the exponential growth phase on the sole basis of calorimetric measurements constitutes a major obstacle to the heat data processing and interpretation. This is because the heat flow signal changes with time according to the general heat balance equation of Tian. In consequence, any exponentially increasing rate of heat flow strictly depends on thermal parameters of the calorimetric device used and it cannot be identified directly with the exponential bacterial growth. In the previous study [20], the activity of Pseudomonas putida KT2440 in the minimum M1 medium was monitored by using a TAM (III) twin microcalorimeter operating under oxygen-limited or oxygen-rich conditions, and, concurrently, by measuring the number of bacterial cells and glucose uptake as a function of time. From the correlation between the three types of experimental data, the exponential growth phase for P. putida was considered to start where the integral heat exceeded the corresponding uncertainty and to end up at the position of the peak maximum on the heat flow vs. time plot. The same research methodology was subsequently applied to study the influence of ionic Cd(II), Pb(II), and As(III) species on the growth of this model aerobic soil bacterium, whose genome encodes multiple metal resistance mechanisms. The overall toxicity of the three heavy metals represented an irregular trend with the metal concentration. It was found to depend on the complex interplay between the direct perturbation of the cellular processes and the competition for key resources present in the medium (both glucose and phosphates). The IC50 values determined based only on the microcalorimetry experiments were 22.5 ± 3.3 µmol∙L−1 for Cd(II), 139 ± 22 µmol∙L−1 for Pb(II), and 138 ± 22 µmol∙L−1 for As(III).
In the present study, the same calorimetric approach was employed to investigate the effect of ferrihydrite and heavy metal-doped ferrihydrite on the growth of P. putida in M1 medium under similar experimental conditions (i.e., same initial number of bacterial cells, pH of the suspension, temperature). The main goal of this study was to assess microbial tolerance and toxicity thresholds in response to Cd(II), Pb(II), and As(III) incorporated into ferrihydrite particles. In comparison with the previously studied systems, an additional complexity arose due to sorption processes affecting the bioavailability of glucose and phosphates, on one hand, and on the other hand, the release of both iron and heavy metal dopant from the ferrihydrite framework to the growth medium. Therefore, real-time monitoring of the microbial growth by isothermal microcalorimetry was supplemented with analysis of glucose uptake and ferrihydrite dissolution. This integrated approach was foreseen to provide a comprehensive evaluation of the heat release during the exponential growth phase of P. putida in the presence of heavy metal-bearing ferrihydrites.
2. Materials and Methods
2.1. Chemical Reagents
All reagents and acids were of analytical grade, and solutions were prepared using 18.2 MΩ∙cm−1 deionized water (PURELAB® Chorus 1, ELGA LabWater, High Wycombe, UK). Analytical-grade cadmium nitrate tetrahydrate, Cd(NO3)2·4H2O (purity 99.0%), lead (II) nitrate, Pb(NO3)2 (purity 99.0%), sodium (meta)arsenite NaAsO2 (purity 90%), Tryptic Soy Agar (TSA) and Tryptic Soy Broth (TSB) dehydrated culture media were also purchased from Sigma-Aldrich (St. Quentin Fallavier, France). The minimum medium (M1) was prepared by using Sigma-Aldrich chemicals: potassium dihydrogen phosphate, KH2PO4 (purity > 99.5%), magnesium sulphate heptahydrate, MgSO4·7H2O (purity ≥ 99.5%), calcium chloride dihydrate, CaCl2·2H2O (purity > 99%), potassium nitrate, KNO3 (purity > 99%), and D-glucose (purity > 96%) [21]. Sterile Acrodisc® 25 mm syringe filters with Supor® membrane and a pore size of 0.2 µm (Pall Corporation, New York, NY, USA) were utilized.
2.2. Preparation of Ferrihydrite and Heavy Metal-Bearing Ferrihydrite Samples
Ferrihydrite was prepared by neutralization of 0.4 M FeCl3·6H2O (Sigma Aldrich, purity > 97%) with 4 M NaOH [22]. Metal-bearing ferrihydrites were synthesized similarly to pristine ferrihydrite, with the only difference being that a single metal salt (Pb, Cd, or As) was added at 8, 20, 32, or 40 mM to the ferric solution before hydrolysis, corresponding to initial molar ratios of 0.02, 0.05, 0.08, and 0.1 [22]. The solid phase was separated from the supernatant by centrifugation at 10,000 rpm for 15 min. In this way, very small nanoparticles remained suspended in the liquid phase. All precipitates were washed by dialysis (1 nm pore size Spectra/Por® 7 dialysis membranes) until a steady conductivity < 5 μS∙cm−1 was obtained. The obtained powders were dried at room temperature. Since upon drying the ferrihydrite particles may form hardly water-dispersible aggregates [23], the dried powders were subsequently manually ground before characterization and any use in the study.
To assess the real metal content in the sample, 10 mg of each powder were dissolved in 2 mL of 2 wt.% nitric acid (HNO3, Sigma-Aldrich; purity > 65%). The complete removal of solid particles remaining in the liquid phase was ensured through a two-stage procedure: (1) centrifugation at 10,000 rpm for 5 min; (2) filtration through 0.22 µm filters. The filtrates were subsequently analyzed by Dynamic Light Scattering (DLS) to confirm the absence of nanoparticles that may have passed through the filter. Then the total iron and heavy metal concentrations were determined by atomic absorption spectrometry (AAS, Thermo Scientific iCE 3000, Thermo Fisher Scientific, Kandel, Germany) using an air/acetylene flame and the following lamps: Photron (Narre Warren, Victoria, Australia; 6 mA current) for the total iron, Thermo Fisher Scientific (10 mA current) for lead, S&J Juniper & Co. (Harlow, UK; 6 mA current) for cadmium, Pye Unicam (Cambridge, UK; 12 mA current) for arsenic.
All techniques and methods used to evaluate the main physical properties of the solid samples are described in the Supplementary Material, together with the results obtained.
Prior to any analysis of the supernatant solution, the measuring ampoules were carefully opened under microbiological safety cabinet to preserve the integrity of microbial and chemical species. The above described two-stage purification procedure was applied to remove solid particles from the supernatant solution. To remove bacterial cells, samples were first transferred into sterile 2 mL Eppendorf tubes and centrifuged at 10,000 rpm for 5 min. The supernatant was then filtered through sterile 0.22 µm filters into sterile 5 mL Eppendorf tubes.
2.3. Bacterial Culture
P. putida KT2440 wild-type (German Collection of Microorganisms and Cell Cultures, Leibniz Institute DSMZ, Braunschweig, Germany) was selected for the present study. The microbial cultures were prepared using a class II biological safety cabinet (MSC-Advantage™, Thermo Scientific™, Waltham, MA, USA). The strain was first grown on tryptic soy agar (TSA, 40 g∙L−1) at 298 K for approximately 16 h. Liquid pre-cultures were then prepared by transferring colonies from the pre-grown agar plates into tryptic soy broth (TSB, 10 g∙L−1) and incubating overnight (12 h) at 298 K. The bacterial cells were subsequently collected by centrifugation at 4500 rpm for 5 min and washed three times with sterile 0.9 wt.% NaCl isotonic solution to remove any residual growth medium.
2.4. Isothermal Microcalorimetry
The heat release accompanying microbial activity was recorded using a TAM (III) multi-channel twin microcalorimeter system (TA Instruments, Stockholm, Sweden). Experiments were conducted in 4.5 mL stainless steel ampoules maintained at a constant temperature of 298 K. Prior to each experiment, the ampoules and all associated materials were sterilized by autoclaving at 394 K for 15 min. Heat flow versus time curves were recorded after the introduction into each ampoule of 1 mL of M1 medium containing 31 µmol of glucose [21], 0.3 mL of a bacterial suspension containing approximately 6 × 10⁶ cells, and 5 mg of the mineral under investigation. The remaining free volume in each ampoule was filled with 3.1 mL of sterile-filtered air.
The reproducibility of the heat flow recordings was confirmed by using simultaneously two independent calorimeters of the multi-channel TAM (III) system. The initial compositions of the suspensions poured to the corresponding ampoules of the two calorimeters were exactly the same. The uncertainty of heat determination was due to both the experimental variability and reproducibility of data processing procedures (baseline subtraction and curve integrating in OriginPro®).
In the case of pure ferrihydrite system, additional experiments were performed to monitor the quantity of glucose consumption at selected time intervals. These experiments were carried out in the same 4.5 mL ampoules with a tightly closed cap. The ampoules were kept inside the BSC (instead of being transferred into the microcalorimetric device) and the same sample preparation protocols and experimental conditions were applied. For all systems studied by microcalorimetry, the glucose uptake was quantified by stopping the calorimetry run after 24 h. The concentration of glucose remaining in the supernatant solution after having removed solid particles and bacterial cells was determined by high-performance liquid chromatography (UFLC Shimadzu, Kyoto, Japan) equipped with an Aminex HPX-87H carbohydrate column (dimensions: 300 mm × 7.8 mm; Toven = 55 °C) based on the refractive index detection and using the 5 mol∙L−1 H2SO4 isocratic mobile phase passing through the column at a flow rate of 0.6 mL∙min−1. Each experiment was repeated three times, and the measurement uncertainty was determined on this basis.
2.5. Statistical Analyses
RStudio version 2025.09.2 + 418 was used for all data analysis. Factor Analysis of Mixed Data (FAMD) was used to explore the dataset’s underlying structure and to identify variables that explain the integral heat released during the exponential growth phase (packages: FactoMineR, version 2.13 and Factoextra, version 1.0.7). This approach allowed both qualitative (metal type, substitution) and quantitative (integral heat, ferrihydrite dissolution, metal dissolution) variables and enabled integrated dimensionality reduction and variable assessment. The first two dimensions of the FAMD analysis explained 28.6% (Dim1) and 19.2% (Dim2) of the total variance. Analysis of Variance (ANOVA) was then performed on the predictors identified by the FAMD analysis to assess their significance for the response variable (i.e., integral heat). Post hoc comparisons were performed using Tukey’s Honest Significant Difference (Tukey HSD) test to identify which specific group combinations differed significantly.
3. Results
3.1. Main Characteristics of Pure Ferrihydrite and Heavy Metal-Bearing Ferrihydrites
The main characteristics of pure ferrihydrite are given in Figure 1. The X-ray diffraction (XRD) pattern of pure ferrihydrite powder (Figure 1a) exhibits two large diffraction peaks centered at approximately 0.149 nm and 0.258 nm. This pattern is in agreement with data reported in the literature for two-line ferrihydrite samples [6]. When this powdered sample is dispersed in water, most of the solid phase settles rapidly at the bottom of the container. Smaller particles (or submicron aggregates) remaining in the suspension after one hour of rest have been analyzed by dynamic light scattering (DLS), and the resulting particle size distributions are plotted in Figure 1b. The differential curve represents a right-skewed distribution, and the mean diameter (about 129 nm) is slightly different from the median size (about 113 nm). About 90% of such particles have diameters smaller than or equal to 188 nm and, as such, they may undergo Brownian motions of high intensity in aqueous media.
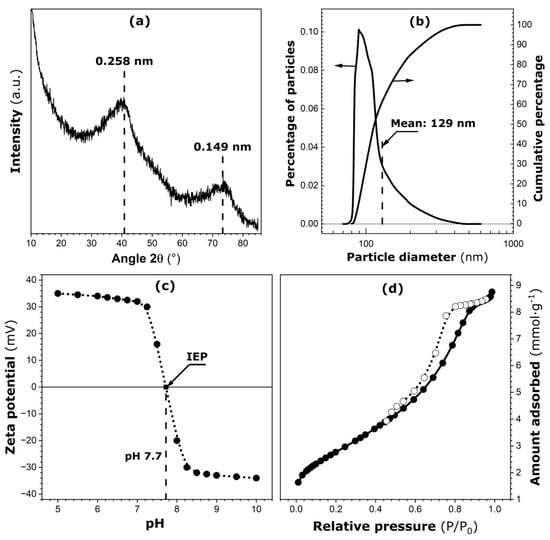
Figure 1.
Main characteristics of pure ferrihydrite: (a) X-ray diffraction pattern. (b) Differential and cumulative particle size distributions in the submicron size range (on linear–log scale). (c) Zeta potential against pH of the aqueous suspension of particles (location of the isoelectric point, IEP, is marked on the curve). (d) Nitrogen adsorption (solid circles) and desorption (empty circles) isotherms determined at 77 K.
The zeta potential for particles in the submicron size range is given in Figure 1c as a function of pH of the aqueous suspension. The isoelectric point (IEP) is located at pH 7.7 [24]. It is worth noting here that the pH of the ferrihydrite suspension introduced into a calorimetric ampoule together with the bacterial cells has always been adjusted to 7. According to Figure 1c, the zeta potential for submicron-sized particles is about 32 mV. Therefore, their aqueous suspension in the calorimetric ampoule can be considered metastable.
Nitrogen adsorption and desorption isotherms are shown in Figure 1d. According to the recent IUPAC classification [25], they represent a type IV(a) isotherm with an extended type H1 hysteresis loop located between relative pressures of 0.45 and 0.9. Estimates of the specific surface area and porosity parameters have been obtained by applying the BET model and αS-plot procedure to analyze the N2 adsorption branch [26]: BET specific surface area, SBET = 240 ± 12 m2∙g−1; BET interaction constant, CBET = 67 ± 4; total surface area ST = 235 ± 10 m2∙g−1; pore volume, Vp = 0.19 ± 0.01 cm3∙g−1; mean pore diameter, dp = 3.4 ± 0.1 nm. The details are given in Section S4 in the Supplementary Material. The present ferrihydrite sample is a mesoporous material with a pronounced intragranular mesoporosity.
The as-synthesized samples of heavy metal-bearing ferrihydrites were dissolved progressively in nitric acid, and the total heavy metal and iron concentrations in the supernatant solution were determined as a function of the equilibration time (the results are given in Figure S1 in the Supplementary Material). It appears that the target molar ratios (where M stands for the heavy metal dopant) have been perfectly reached only for lead (Figure S1a) and arsenic (Figure S1c). In the case of cadmium, the degree of metal insertion into the ferrihydrite matrix by following the co-precipitation procedure seems highly limited: only three synthesis trials with higher heavy metal quantities have been successful, although the final cadmium contents are very low (ultimate molar ratios of 0.01, 0.02, and 0.03). No cadmium has been detected in the sample afforded using an initial molar ratio of 0.02. For further discussion, each heavy metal-bearing ferrihydrite sample will be denoted by the real value of the molar ratio, which is given in brackets, i.e., Pb-Fh(0.02), Pb-Fh(0.05), Pb-Fh(0.08), Pb-Fh(0.1); Cd-Fh(0.01), Cd-Fh(0.02), Cd-Fh(0.03); As-Fh(0.02), As-Fh(0.05), As-Fh(0.08), As-Fh(0.1).
Indications with respect to the possible heavy metal location in the bulk of the solid material or at its surface have been searched by analyzing the rates of solid sample dissolution in the M1 medium, the XRD patterns, the results of SQUID measurements or textural parameters of the co-precipitated samples (see Figures S2–S5 and Tables S1 and S2 in the Supplementary Material [25,27,28,29]). The insertion of heavy metals does not alter the degree of crystallinity, and the final samples retain the characteristic two-line ferrihydrite pattern. The absence of additional peaks in the XRD patterns argues against the formation of secondary phases rich in lead, cadmium, or arsenic as extended crystallites or surface layers (see Figure S2 in the Supplementary Material). In the case of Pb-Fh materials, a slight left-hand shift in the position of the 0.258 nm peak may indicate minor alterations in the crystal lattice dimensions, though more relevant conclusions are biased by the insufficient signal-to-noise ratio of the peak.
The results of SQUID measurements show a maximum magnetization (MS) of 10 A∙m2∙kg−1 for pure ferrihydrite at 300 K (see Figure S3 in the Supplementary Material), much lower than that observed for such an iron oxyhydroxide containing Fe(II) as magnetite [30]. A noticeable decrease in the MS value is observed with increasing metal concentration, especially in the case of lead. Such a decrease likely results from the partial substitution of magnetic Fe(III) atoms by non- or weakly magnetic metal ones, which reduces collective Fe–Fe interactions [31]. This also means that no important fraction of Fe(II) species is present in the as-prepared ferrihydrite materials.
The zeta potential vs. pH curves for Cd- and Pb-Fh samples are not significantly affected and, therefore, the IEP remains unchanged, within the experimental error, compared to that of the pure ferrihydrite (Figure S5 in the Supplementary Material). A possible explanation is that the surface chemical state, at least in the case of the submicron-sized particles, does not change after heavy metal doping: the latter is likely located inside the bulk of the material. For As-Fh samples, the plot is shifted towards smaller pH values, and the IEP decreases from pH 7.7 to 7.1. This may indicate the formation of anionic surface species, which reduce the net positive charge of pH-dependent surface hydroxyl groups under the acidic conditions of the bulk solution.
3.2. Effect of the Addition of Pure Ferrihydrite to M1 Medium on the Heat Release
The raw results of calorimetry measurements of heat release due to P. putida activity in the M1 medium containing ferrihydrite particles are shown in Figure 2.
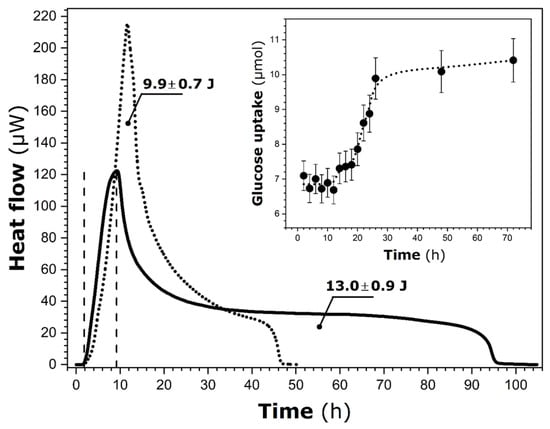
Figure 2.
Room temperature variations of heat flow over time recorded by heat conduction calorimetry for P. putida KT2440 in M1 medium containing pure ferrihydrite particles (solid line). The two vertical dashed lines indicate the limits of the exponential growth phase. For comparison, the heat flow curve of the bacterium in pure M1 (dotted line) is also shown [20]. The values represent the total heat released during the entire calorimetric run. The inset displays glucose uptake as a function of time, measured separately outside the calorimeter; the dotted line is included as a visual guide.
To facilitate further data interpretation, the heat flow curve previously recorded for the same bacterium in M1 (without ferrihydrite particles [20]) was added to Figure 2. The comparison between these two curves indicates that the shape of the heat release profile is significantly modified in the presence of solid particles. It presents a very long tail on the right side, which likely means that the heat release is spread over a much wider time interval. Simultaneously, the total heat released during the whole calorimetry run increases from 9.9 ± 0.7 J (only M1) to 13.0 ± 0.9 J (M1 + ferrihydrite).
Following the findings of the previous study on P. putida suspended in the M1 medium [20] under similar experimental conditions, it is possible to estimate the duration of the exponential growth phase on the sole basis of calorimetry measurements (see Introduction). By analogy, the exponential growth phase lasts from 1.8 ± 0.2 h to 9.2 ± 0.7 h in the presence of ferrihydrite particles. Compared to P. putida in modified M1, this particular growth phase begins two hours in advance, although its duration remains nearly unchanged (i.e., 7.4 ± 0.5 h). The corresponding integral heat is decreased from 4.2 ± 0.3 J to 1.9 ± 0.1 J following the addition of ferrihydrite particles to the M1 medium. In consequence, the corresponding average rate of heat release during the exponential growth of P. putida is equal to 0.26 ± 0.03 J∙h−1, contrary to the previously obtained value of 0.56 ± 0.05 J∙h−1 in the M1 medium.
The corresponding glucose uptake, as determined concurrently out of the calorimeter, is also given in the inset of Figure 2. It can be noted that about 6.9 ± 0.5 µmol of this nutrient has been taken up to 2 h. This value remains constant (within the margin of experimental error) throughout the exponential growth phase and until 12 h. As previously observed [20], a time mismatch still exists between glucose uptake and heat release in the present system.
3.3. Effect of the Addition of Heavy Metal-Bearing Ferrihydrite to M1 Medium on the Heat Release
In line with the data processing described above, the main emphasis of this section is on the variations of the integral heat over time, restricted to the exponential growth phase as recorded by calorimetry.
The corresponding heat vs. time curves are shown in Figure S6 in the Supplementary Material for lead, cadmium, and arsenic, respectively. Based on these results, it was possible to estimate the duration of the exponential growth phase, the total heat released during it, as well as the average heat release rate. With a view to supplementing certain aspects of bacterial activity, the quantity of glucose uptake was measured after stopping the calorimetric run at 24 h. For the purpose of comparison, this time period was arbitrary chosen to be the same for all systems studied and to ensure that the exponential phase had already been completed. The resulting values are presented in Table 1.

Table 1.
Main parameters of the exponential growth phase for P. putida in the presence of heavy metal-bearing ferrihydrites in M1, as inferred from the calorimetric measurements (c.f., Figure S6 in the Supplementary Material), together with the glucose uptake measured after 24 h (last column).
It should be emphasized here that, when the ferrihydrite materials are mixed with the M1 medium, a fraction of the solid phase dissolves into the liquid phase, depending on the type of metal and its substitution level. The factorial ANOVA revealed that metal type (η2 = 0.93), bacterial presence (η2 = 0.59), and their interaction (η2 = 0.75) were the dominant factors driving ferrihydrite dissolution (c.f., Figure S7.1a in the Supplementary Material). This result suggests that the chemical characteristics of the metal dopant within the iron oxide framework significantly influence mineral stability, and that bacteria modulate this effect depending on the dopant’s nature. For instance, the ANOVA analysis on the Fe concentration profiles (Figure S7.1b) demonstrates significantly enhanced Fe release in the presence of P. putida, especially in Pb- and As-substituted ferrihydrite systems; i.e., Fe release was doubled or tripled in the Pb_0.08_yes and As_0.1_yes compared to their abiotic controls. On the contrary, Cd-substituted ferrihydrites display limited Fe release, regardless of the bacterial presence. This observation suggests that Fh-Cd minerals exhibit low reactivity across all substitution levels tested. The working hypothesis admitted here is that P. putida promotes ferrihydrite dissolution, likely via acidification, ligand excretion, or local pH/chelation effects. Nonetheless, the process is influenced by the dopant properties and the solid’s surface chemistry. The minimal Fe release in abiotic conditions across all substitutions implies that bacterial activity is a key driver of Fe re-mobilization under these conditions.
When searching for the most relevant observable to correlate with the properties of metal-bearing ferrihydrite samples and their respective behavior in the growth medium, it is necessary to underline that the estimates of exponential phase duration are subject to much uncertainty. This is due to the nature of the approximation utilized to locate the time limit separating the initial lag phase from the subsequent exponential growth period (i.e., the time at which the integral heat equals the corresponding uncertainty [20]). On the contrary, the integral heat released during the exponential growth phase is less dependent on this choice since the heat release during the lag phase is always very small. The average rate of heat release exhibits an irregular trend depending on both the type and the concentration of the heavy metal. Overall, it is greater than the corresponding rate observed upon ferrihydrite addition to the M1 medium (i.e., 0.26 ± 0.03 J∙h−1), but smaller than that in the M1 medium without any solid particles (i.e., 0.56 ± 0.05 J∙h−1).
In the FAMD analysis, the most discriminating categorical variables along Dim1 are metal type and substitution level (sub), whereas Fe_diss and integral_heat emerge as the key quantitative descriptors. (cf. variable contribution plots, Figure S7.2).
Both metal type and substitution level appear to exert significant effects on the ferrihydrite dissolution and metabolic heat release (p < 0.001) as shown by ANOVA (Figure 3). The subsequent pattern implies a link between Fe release and integral heat with significant metal-specific differences.
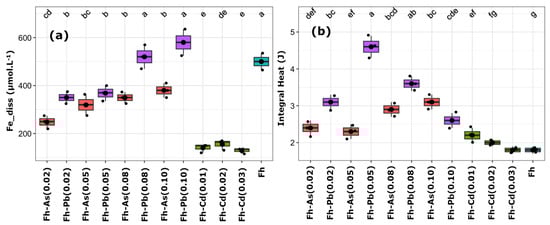
Figure 3.
Boxplots representing the concentrations of dissolved iron (a) and the corresponding integral heat (b). Essays include ferrihydrite (Fh) substituted with arsenic (red), cadmium (green), and lead (purple) at increasing molar ratios (e.g., As_0.02 = 2% mol substitution). The non-substituted Fh control (None0) is shown in blue. Black dots represent individual replicates; thick black lines indicate the mean; lowercase letters indicate significantly different groups based on Tukey’s post hoc test (p < 0.05).
The highest Fe release and integral heat have been observed in Fh-Pb assays, with the Fh-Pb-0.05 assay leading to 400 µM of dissolved iron and the highest integral heat (~4.6 J). However, a significant drop in integral heat has occurred at higher substitution levels (e.g., Pb_0.1), despite Fe release remaining elevated. Fh-Cd has displayed low Fe release (≤170 µM), regardless of the substitution level, and displayed low integral heat, with values closely matching the non-substituted Fh (None0). Fh-As has led to an intermediate Fe release (250–400 µM) and modest metabolic heat output (2.4–3.2 J), thereby suggesting a less favorable environment than Fh_Pb(0.05) but more permissive than Fh-Cd.
4. Discussion
Rationalizing the heat release accompanying the exponential growth of P. putida KT2440 in the M1 medium containing ferrihydrite particles is not an easy task since several biotic and abiotic mechanisms are involved. This strain, widely recognized as an aerobic soil microorganism [32], relies strictly on oxygen availability to sustain its metabolic functions. The calorimetry experiments have been carried out using hermetically sealed ampoules, and thus the total oxygen quantity is deliberately limited to that dissolved in the 1.4 mL aqueous suspension and to its presence in the air contained in the 3.1 mL dead volume of the ampoule. Altogether, the total quantity of oxygen potentially available for bacterial growth does not exceed 28.1 µmol, which can support the total oxidation of approximately 4.7 µmol of glucose (the molar O2 to C6H12O6 ratio of 6) [20].
4.1. Microbial Activity in the Presence of Pure Ferrihydrite
Assigning totally the 6.9 ± 0.5 µmol of glucose uptake until 12 h to the heat release during the exponential phase would give a normalized heat per 1 mole of glucose of 278 ± 30 kJ∙mol−1, which represents a small fraction of the 1289 kJ∙mol−1 energy resulting from the complete oxidation of glucose and transferred in the form of heat to the surroundings across the bacterial outer membrane [33]. But on the contrary, when one takes into account the total heat released during the whole calorimetry run (i.e., 13.0 ± 0.9 J) and the total glucose uptake (i.e., 10.4 ± 0.6 µmol), the resulting normalized heat of 1249 ± 132 kJ∙mol−1 would indicate the complete aerobic cellular respiration. Nevertheless, this hypothesis must be rejected, as there is insufficient oxygen in the calorimetric ampoule to oxidize this amount of glucose completely. It is unlikely that all glucose measured as “consumed” during the calorimetric experiment is actually metabolized by P. putida. Glucose adsorption onto ferrihydrite particles is substantial, namely up to 40–45 mmol per gram of Fe at equilibrium glucose concentrations between 30 and 50 mmol∙L−1 [34]. Given that the residual glucose concentration during the exponential phase is about 20 mmol∙L−1, decreasing to 16 mmol∙L−1 at the end of the experiment, adsorption onto 5 mg of pure ferrihydrite could account for approximately 70 µmol of glucose well above the initial glucose load (31 ± 3 µmol). Thus, glucose adsorption likely plays a non-negligible role, explaining why the measured glucose uptake remains nearly constant throughout the exponential phase.
When dispersed in electrolyte solution, ferrihydrite nanoparticles rapidly aggregate [24] with a concurrent loss of reactive surface area and adsorption sites [35,36]. In the present experimental setup, the observed aggregation of ferrihydrite likely reduced the effective surface area, leaving some phosphate in solution and thus available to bacteria, although in smaller quantities than in phosphate-replete conditions [37]. This suggests that the theoretical maximum of phosphate adsorption capacity could be overestimated if determined based on the nominal SBET of dispersed nanoparticles [38]. The retention of glucose (nutrient) and phosphate (formation of ATP units) onto ferrihydrite particles may explain the hindered growth of P. putida cells and, thus, the lower heat output during the exponential phase [39].
A second factor that may explain the lower integral heat output is the dissolved Fe content of the present ferrihydrite system (500 µmol∙L−1, Table S1 in the Supplementary Material), which, at a near-neutral pH, would allow soluble Fe(III) to hydrolyze and form aqueous complexes with phosphate species such as FePO4 and FeHPO4+ [40]. This phenomenon results in the removal of phosphate from solution, lowering its free concentration and further decreasing the phosphorus bioavailability for microbial utilization. In addition, the presence of ferrihydrite in the medium could induce oxidative stress through Fe(III) in the presence of O2 [41]. In 2019, Du et al. proposed a mechanistic framework for understanding these interactions [42]. This process is metabolite-dependent, as the low-molecular-weight organic molecules released by the bacterium ensure that surface-bound Fe(III) is electrochemically reduced to Fe(II) [43], which may be rapidly re-oxidized by O2, forming superoxide (O2−•) and hydrogen peroxide (H2O2) [44]. These ROS can accumulate in the extracellular medium, where they promote lipid peroxidation and other damage at the cell envelope, ultimately contributing to loss of membrane integrity and cell death [45]. Amongst the minerals tested to induce this process, ferrihydrite displayed the most potent inhibitory effect, with final OD600 values being lowered by between 40 and 60% compared to the no-mineral control [46]. This degree of inhibition is closely consistent with the 45% decrease in the integral heat output observed in the presence of ferrihydrite, suggesting that P. putida may similarly experience surface-induced oxidative stress [47], with a decrease in growth yield by diverting metabolic energy from biosynthesis into maintenance and detoxification work [48].
In the absence of stirring in the calorimetric ampoule, the earlier start of the exponential growth phase in ferrihydrite-containing suspensions compared to that in the pure M1 medium (Figure 2) may be linked to enhanced oxygen mass transfer caused by the presence of nanosized particles. Indeed, the absorption rate and solubility of oxygen in liquids have been shown to increase in the presence of colloidal particles undergoing Brownian motion [49,50].
On the other hand, large aggregates sink through the liquid medium and settle at the bottom of the calorimetric ampoule. Interactions between bacterial cell surfaces and ferrihydrite particles, particularly through O-specific polysaccharide moieties present on the outer membrane of Gram-negative bacteria, can promote the formation of microbial–mineral aggregates [51]. These hybrid aggregates may significantly alter the microenvironment surrounding cells. Firstly, they can limit the diffusion of dissolved oxygen into the inner regions of the aggregate, thereby decreasing the availability of this essential electron acceptor. Secondly, glucose molecules adsorbed onto ferrihydrite or trapped within the aggregate structure may become less accessible to bacterial cells dispersed in the liquid medium.
All the factors and secondary effects described above likely contribute to a reduced extent of aerobic glucose catabolism, resulting in a lower heat output during the exponential growth phase compared to the bacterial growth in the M1 medium without oxide particles, as illustrated in Figure 2. Nevertheless, tracking each individual contribution related to the secondary effects is challenging because it is nearly impossible to separate them in real calorimetric experiments. The adsorption of glucose and phosphates onto ferrihydrite particles, the partial dissolution of ferrihydrite, and the leaching of Fe(III) cations, as well as the precipitation of large ferrihydrite particles aggregated with bacterial cells, occur predominantly during the lag phase, when heat release is negligible. These competing mechanisms are depicted schematically in Scheme 1. Therefore, they directly impact the availability of glucose, phosphates, and oxygen for the growth of the remaining P. putida cells in the liquid medium.
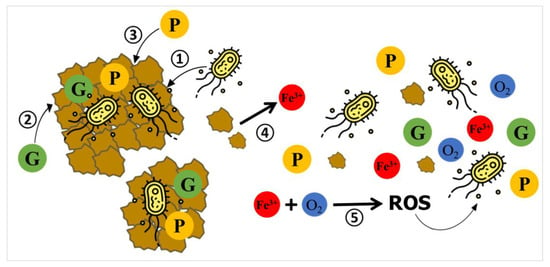
Scheme 1.
Schematic illustration of competing mechanisms leading to uncontrolled changes in the composition of the growth medium and possibly impacting the growth of P. putida cells in the presence of pure ferrihydrite particles. (1) Cell–mineral attachment. (2) Adsorption of glucose (G) onto Fh surface. (3) Adsorption of phosphate (P) onto Fh surface. (4) Partial dissolution of Fh and release of Fe(III) into the medium, followed by complexation of dissolved phosphate. (5) Redox reactions involving dissolved Fe(III) and residual oxygen may lead to the formation of reactive oxygen species (ROS), potentially inducing oxidative stress in bacterial cells.
4.2. Effect of the Addition of Heavy-Metal-Bearing Ferrihydrites to the M1 Medium on the Activity of P. putida
When heavy-metal-bearing variants replace pure ferrihydrite particles, the effects described above persist in the system; however, their intensity depends on the specific heavy metal used and the degree of its substitution into the ferrihydrite matrix. The extent, rate, and reversibility of glucose and phosphate adsorption will depend on the chemical state of the ferrihydrite surface and its porosity. For example, the glucose uptake does not change significantly with the dopant content (Table 1) which may argue in favor of important nutrient adsorption in all systems. However, high (practically constant) glucose consumption by P. putida was documented previously in the absence of ferrihydrite particles, irrespective of the free Pb(II), Cd(II), and As(III) ion content in the M1 medium, even though there was no detectable heat release [20].
The microcalorimetric data and total dissolved iron (Fe_diss) measurements obtained in this study indicate complex interactions between metal substitution in ferrihydrite structure, nutrient concentrations, and bacterial energetics. The isoelectric point of the mineral surface may also emerge as a significant explanatory variable, controlling the sorption and release of critical nutrients, including phosphate, thereby influencing microbial growth and the related heat release.
The equivalent radii of non-hydrated cations are as follows: 95 pm for Cd(II), 118 pm for Pb(II), 65 pm for Fe(III), and 78 pm for Fe(II) [52]. According to some authors [53,54], the similarity between cadmium and iron in terms of ionic radius and coordination geometry facilitates the isomorphous substitution or the formation of stable solid solutions between Cd(II) and Fe(III) in oxyhydroxides. In the present study, isomorphous substitution of cadmium in regions close to the solid surface is consistent with the limited metal content (not more than 0.03), the absence of metal in the supernatant after partial dissolution of ferrihydrite in the M1 medium at pH 7 (Table S1), practically unchanged CBET parameter (Table S2), or minor changes in the textural parameters (Table S2). Here, the total iron leaching to the liquid medium at pH 7 decreases 3–4 times, and the heavy metal leaching is below the detection limit (Table S1 in the Supplementary Material). Pb(II) is not expected to substitute for Fe(III) in oxyhydroxides but instead accumulates at surface sites or becomes trapped within defect-rich regions or interstitial sites of the poorly ordered ferrihydrite network [55]. The iron leaching here is more intensive compared to Fh-As and Fh-Cd samples (Table S1). Arsenic is considered to exhibit distinct behavior, being mainly present as labile, surface-associated species [55], in agreement with previous studies describing its occurrence as inner-sphere complexes bound to Fe–OH groups [56]. In the present study, the synthesis of Fh-As samples has been performed by using sodium (meta)arsenite as the As(III) source. The presence of some negatively charged species at the mineral surface likely hinders the formation of Lewis acid-base complexes with glucose molecules or surface complexes of phosphate ions at the surface of Fh-As particles. The intensity of total iron leaching to the liquid phase at pH 7 lies somewhat between those of Fh-Cd and Fh-Pb samples.
In the present experimental conditions, Fh-Pb caused the most significant impact on metabolism. At moderate substitution (e.g., 0.05), the integral heat reached a maximum, and Fe_diss was approximately 500 µmol∙L−1, indicating stimulation of the bacterial metabolism. This might be due to the favorable balance of phosphate availability with moderate Fe solubilization [57]. The isoelectric point of Fh-Pb suggests that a pH of 7 would already lead to a positive surface charge, which favors moderate phosphate adsorption while allowing sufficient phosphate concentrations in solution for microbial activity [58]. However, at higher levels of substitution (e.g., 0.1), heat release was lower despite high Fe_diss, suggesting potential interference from excessive Fe(III) or Pb-mediated stress, thus indicating a bell-shaped dose–response relationship [59].
Erbs et al. (2010) have shown that the substitution of arsenic in ferrihydrite not only reduces the isoelectric point [60], but also increases the susceptibility of this mineral to reductive dissolution ensured under moderate reducing conditions. This was attributed to weakened Fe–O bonds and structural modifications induced by arsenic doping, thereby strengthening both proton- and electron-transfer activity. This site-weakening mechanism could account for the moderate-to-high Fe_diss levels in the present Fh-As samples (250–400 µmol∙L−1) and is consistent with arsenic substitution promoting Fe(III) solubilization [61]. However, despite this increased Fe availability, the metabolic heat released by P. putida remained relatively moderate, slightly above the level of pure ferrihydrite, but significantly lower than Fh-Pb systems. Arsenic may also exert direct toxicity or induce cellular stress [62], particularly at higher substitution levels, where arsenic release is more pronounced [63].
Fh-Cd systems exhibited the lowest integral heat and Fe_diss of all systems, in line with, or even lower than, those for pure ferrihydrite. These findings indicate poor reactivity of Fh-Cd [64]. It is well-established that Cd inhibits microbial respiratory pathways and impairs cellular processes, such as membrane integrity or oxidative stress response [65]. Hence, the lower microbial activity observed in the Fh-Cd system could be attributed to a combination of limited nutrient supply (due to phosphate and glucose adsorption) and Cd-induced general cellular stress.
5. Conclusions
This study shows that the metabolic response of Pseudomonas putida KT2440 to the addition of ferrihydrite samples to the growth medium is governed by a subtle combination of nutrient redistribution, mineral reactivity, dopant-dependent structural modifications, and microenvironmental constraints. Pure ferrihydrite already alters the growth by simultaneously adsorbing glucose and phosphate, releasing Fe(III), and forming bacterial–mineral aggregates where oxygen and nutrient diffusion is limited. These processes, which take place mainly during the lag phase, reduce the availability of essential resources during exponential growth and result in a 45% decrease in the heat output.
Factorial ANOVA confirms that ferrihydrite dissolution is predominantly controlled by metal type and further amplified by bacterial activity, particularly in the Pb- and As-doped systems.
Heavy-metal substitution modulates these effects in a strongly metal-dependent manner. Pb-bearing ferrihydrite displays the highest reactivity, with substantial ferrihydrite dissolution and a marked metabolic stimulation at moderate substitution levels, followed by inhibition at higher Pb contents. As-substituted ferrihydrite induces intermediate Fe release, but supports the hypothesis of phosphate limitation by increasing its surface sorption, resulting in only moderate metabolic effects stimulation. Cd-substituted ferrihydrite remains the least reactive, with minimal dissolution, preserved surface properties, and reduced metabolic heat, consistent with isomorphic incorporation close to the surface.
Altogether, these findings indicate that microbial energetic responses cannot be inferred solely from the identity of the dopant, but require us to understand how metals are structurally incorporated, how they modify porosity and surface charge, and how they redistribute nutrients and Fe species within mineral–cell microenvironments. Importantly, despite the intrinsic complexity of the culture medium and the additional physicochemical constraints imposed by residual heavy metals, microcalorimetry proves capable of detecting subtle shifts in metabolic functioning and discriminating between closely related mineralogical configurations. While its signal integrates the global thermodynamic response, it nevertheless provides clear guidance for identifying the dominant factors at play and orienting more detailed mechanistic investigations. With adequate knowledge of the system, the observed thermal signatures become powerful indicators for deciphering the processes governing bacteria–mineral interactions.
Supplementary Materials
The following supporting information can be downloaded at: https://www.mdpi.com/article/10.3390/micro6010009/s1, Figure S1: Dissolution of M-bearing ferrihydrites in 0.1 M HNO3 as a function of equilibration time; Figure S2: Room temperature X-ray diffraction patterns recorded for M-bearing ferrihydrites; Figure S3: Results of SQUID measurements at 300 K; Figure S4: Nitrogen adsorption and desorption isotherms determined at 77 K for pure ferrihydrite and three selected M-bearing ferrihydrite samples; Figure S5: Zeta potential against pH of the aqueous suspension of M-bearing ferrihydrites; Figures S6: Variations of the integral heat over time during the exponential growth phase as recorded by heat conduction calorimetry; Figure S7: Results of statistical analyses; Table S1: Heavy metal and iron concentrations in the supernatant solution as a function of the equilibration time; Table S2: Various specific surface area and porosity parameters for pure ferrihydrite and various M-bearing ferrihydrite samples.
Author Contributions
A.A.: Investigation, Methodology, Visualisation, Data curation, Formal analysis, Writing (original draft, editing). A.G.: Investigation, Validation. A.Z.: Conceptualization, Methodology, Supervision, Validation, Writing (original draft, review). B.P.: Funding acquisition, Project administration, Supervision, Validation. J.Z.: Conceptualization, Methodology, Validation, Supervision and Writing (original draft, review, editing). All authors have read and agreed to the published version of the manuscript.
Funding
This project has received financial support from the CNRS through the 80|Prime program (Mission pour les Initiatives Transverses et Interdisciplinaires).
Data Availability Statement
All data generated or analysed in the present study are contained within the article and in the related Supplementary Material file.
Acknowledgments
The authors are grateful to Patrick Billard (LIEC, Nancy, France) for generously providing P. putida KT 2440 used in this study and to Corine Tourné-Péteilh (ICGM, Montpellier, France) for her assistance with DLS measurements. Calorimetry measurements were carried out using the equipment and analytical facilities available at the experimental platform ‘PAC Chimie Balard’ (Univ Montpellier, CNRS, ENSCM).
Conflicts of Interest
The authors declare that they have no known competing financial interests or personal relationships that could have appeared to influence the work reported in this paper.
References
- Chiroma, T.; Ebewele, R.; Hymore, F. Comparative assessment of heavy metal levels in soil, vegetables and urban grey waste water used for irrigation in Yola and Kano. IRJES 2014, 3, 1–9. [Google Scholar]
- Haghighizadeh, A.; Rajabi, O.; Nezarat, A.; Hajyani, Z.; Haghmohammadi, M.; Hedayatikhah, S.; Asl, S.D.; Beni, A.A. Comprehensive analysis of heavy metal soil contamination in mining Environments: Impacts, monitoring Techniques, and remediation strategies. Arab. J. Chem. 2024, 17, 105777. [Google Scholar] [CrossRef]
- Ljaljević Grbić, M.; Dimkić, I.; Janakiev, T.; Kosel, J.; Tavzes, Č.; Popović, S.; Knežević, A.; Legan, L.; Retko, K.; Ropret, P.; et al. Uncovering the Role of Autochthonous Deteriogenic Biofilm Community: Rožanec Mithraeum Monument (Slovenia). Microb. Ecol. 2024, 87, 87. [Google Scholar] [CrossRef] [PubMed]
- Marini, M.; Caro, D.; Thomsen, M. The new fertilizer regulation: A starting point for cadmium control in European arable soils? Sci. Total Environ. 2020, 745, 140876. [Google Scholar] [CrossRef]
- Tian, L.; Shi, Z.; Lu, Y.; Dohnalkova, A.C.; Lin, Z.; Dang, Z. Kinetics of Cation and Oxyanion Adsorption and Desorption on Ferrihydrite: Roles of Ferrihydrite Binding Sites and a Unified Model. Environ. Sci. Technol. 2017, 51, 10605–10614. [Google Scholar] [CrossRef]
- Cornell, R.M.; Schwertmann, U. The Iron Oxides: Structure, Properties, Reactions, Occurrences, and Uses; Wiley-VCH Weinheim: Weinheim, Germany, 2003; Volume 664. [Google Scholar]
- Hiemstra, T.; Hofmann, A.; Mendez, J.C.; Bai, Y. Surface Complexation and Reactivity of Ferrihydrite in Relation to its Surface and Mineral Structure, with Applications to Natural Systems. Rev. Mineral. Geochem. 2025, 91A, 175–227. [Google Scholar] [CrossRef]
- Randall, S.; Sherman, D.; Ragnarsdottir, K.; Collins, C.R. The mechanism of cadmium surface complexation on iron oxyhydroxide minerals. Geochim. Cosmochim. Acta 1999, 63, 2971–2987. [Google Scholar] [CrossRef]
- Singleton, I.; Merrington, G.; Colvan, S.; Delahunty, J.S. The potential of soil protein-based methods to indicate metal contamination. Appl. Soil Ecol. 2003, 23, 25–32. [Google Scholar] [CrossRef]
- Díaz-Raviña, M.; Bååth, E.; Frostegård, A. Multiple heavy metal tolerance of soil bacterial communities and its measurement by a thymidine incorporation technique. Appl. Environ. Microbiol. 1994, 60, 2238–2247. [Google Scholar] [CrossRef]
- Nehra, P.; Chauhan, R.P.; Garg, N.; Verma, K. Antibacterial and antifungal activity of chitosan coated iron oxide nanoparticles. Br. J. Biomed. Sci. 2018, 75, 13–18. [Google Scholar] [CrossRef]
- Mubaraki, M.A.; Ali, J.; Khattak, B.; Fozia, F.; Khan, T.A.; Hussain, M.; Aslam, M.; Iftikhar, A.; Ahmad, I. Characterization and Antibacterial Potential of Iron Oxide Nanoparticles in Eradicating Uropathogenic E. coli. ACS Omega 2024, 9, 166–177. [Google Scholar] [CrossRef]
- Hayat, A.; Irshad, A.; Ishtiaq, U.; Mushtaq, Q.; Spalletta, A.; Martin, P.; Jawad, R.; Batool, T. Potent antimicrobial and antibiofilm activity of citric acid coated magnetite nanoparticles for leather preservation. Sci. Rep. 2025, 15, 27889. [Google Scholar] [CrossRef]
- He, S.; Feng, Y.; Ren, H.; Zhang, Y.; Gu, N.; Lin, X. The impact of iron oxide magnetic nanoparticles on the soil bacterial community. J. Soils Sediments 2011, 11, 1408–1417. [Google Scholar] [CrossRef]
- Zúñiga-Miranda, J.; Guerra, J.; Mueller, A.; Mayorga-Ramos, A.; Carrera-Pacheco, S.E.; Barba-Ostria, C.; Heredia-Moya, J.; Guamán, L.P. Iron Oxide Nanoparticles: Green Synthesis and Their Antimicrobial Activity. Nanomaterials 2023, 13, 2919. [Google Scholar] [CrossRef] [PubMed]
- Braissant, O.; Wirz, D.; Gopfert, B.; Daniels, A.U. Use of isothermal microcalorimetry to monitor microbial activities. Fems Microbiol. Lett. 2010, 303, 1–8. [Google Scholar] [CrossRef] [PubMed]
- Wang, F.; Yao, J.; Si, Y.; Chen, H.L.; Russel, M.; Chen, K.; Qian, Y.G.; Zaray, G.; Bramanti, E. Short-time effect of heavy metals upon microbial community activity. J. Hazard. Mater. 2010, 173, 510–516. [Google Scholar] [CrossRef]
- Shi, W.; Becker, J.; Bischoff, M.; Turco, R.F.; Konopka, A.E. Association of microbial community composition and activity with lead, chromium, and hydrocarbon contamination. Appl. Environ. Microbiol. 2002, 68, 3859–3866. [Google Scholar] [CrossRef]
- Straub, K.L.; Hanzlik, M.; Buchholz-Cleven, B.E. The use of biologically produced ferrihydrite for the isolation of novel iron-reducing bacteria. Syst. Appl. Microbiol. 1998, 21, 442–449. [Google Scholar] [CrossRef] [PubMed]
- Akhdar, A.; Geneste, A.; Zegeye, A.; Prélot, B.; Zajac, J. Contribution of Calorimetry to Real-Time Monitoring of Pseudomonas putida KT2440 Growth Under Oxygen-Limited Conditions and Heavy Metal Stress. J. Therm. Anal. Calorim. Submitted 2025. [Google Scholar]
- Gibbons, S.M.; Feris, K.; McGuirl, M.A.; Morales, S.E.; Hynninen, A.; Ramsey, P.W.; Gannon, J.E. Use of microcalorimetry to determine the costs and benefits to Pseudomonas putida strain KT2440 of harboring cadmium efflux genes. Appl. Environ. Microbiol. 2011, 77, 108–113. [Google Scholar] [CrossRef]
- Schwertmann, U.; Cornell, R.M. Iron Oxides in the Laboratory: Preparation and Characterization; John Wiley & Sons: Hoboken, NJ, USA, 2008. [Google Scholar]
- Raiswell, R.; Vu, H.P.; Brinza, L.; Benning, L.G. The determination of labile Fe in ferrihydrite by ascorbic acid extraction: Methodology, dissolution kinetics and loss of solubility with age and de-watering. Chem. Geol. 2010, 278, 70–79. [Google Scholar] [CrossRef]
- Liu, J.; Louie, S.M.; Pham, C.; Dai, C.; Liang, D.; Hu, Y. Aggregation of ferrihydrite nanoparticles: Effects of pH, electrolytes and organics. Environ. Res. 2019, 172, 552–560. [Google Scholar] [CrossRef]
- Thommes, M.; Kaneko, K.; Neimark, A.V.; Olivier, J.P.; Rodriguez-Reinoso, F.; Rouquerol, J.; Sing, K.S.W. Physisorption of gases, with special reference to the evaluation of surface area and pore size distribution (IUPAC Technical Report). Pure Appl. Chem. 2015, 87, 1051–1069. [Google Scholar] [CrossRef]
- Dhaini, A.; Geneste, A.; Alfadel Raad, F.; Picot, P.; Martin-Gassin, G.; Prelot, B.; Gassin, P.-M.; Trens, P.; Thill, A.; Zajac, J. Dried hybrid imogolite nanotubes as solids with a changeable surface area: An insight into textural properties based on the correlation between nitrogen gas adsorption, immersion calorimetry into water, and small angle X-ray scattering. Phys. Chem. Chem. Phys. 2024, 26, 23835–23845. [Google Scholar] [CrossRef]
- Sandler, S.E.; Fellows, B.; Mefford, O.T. Best Practices for Characterization of Magnetic Nanoparticles for Biomedical Applications. Anal. Chem. 2019, 91, 14159–14169. [Google Scholar] [CrossRef]
- Gregg, S.J.; Sing, K.S.W. Adsorption, Surface Area, and Porosity, 2nd ed.; Academic Press: London, UK, 1982. [Google Scholar]
- Swan, J.W.; Furst, E.M. A simpler expression for Henry’s function describing the electrophoretic mobility of spherical colloids. J. Colloid Interface Sci. 2012, 388, 92–94. [Google Scholar] [CrossRef] [PubMed]
- Kumar, V.; Singh, R.P.; Kumar, S.; Agarwal, A.; Singh, P. Particle Size Determination and Magnetic Characterization of Fe3O4 Nanoparticles Using Superconducting Quantum Interference Device Magnetometry. Sens. Mater. 2016, 28, 191–199. [Google Scholar]
- Li, X.; Deng, M.; Wang, X.; Li, H.; Yu, M. Synthesis and magnetic properties of Fe-doped CdS nanorods. Micro Nano Lett. 2019, 14, 275–279. [Google Scholar] [CrossRef]
- Wu, X.; Monchy, S.; Taghavi, S.; Zhu, W.; Ramos, J.; van der Lelie, D. Comparative genomics and functional analysis of niche-specific adaptation in Pseudomonas putida. Fems Microbiol. Lett. 2011, 35, 299–323. [Google Scholar] [CrossRef]
- Jurtshuk, P. Bacterial metabolism. In Medical Microbiology, 4th ed.; Baron, S., Ed.; University of Texas Medical Branch at Galveston: Galveston, TX, USA, 1996. [Google Scholar]
- Porras, R.C.; Hicks Pries, C.E.; Torn, M.S.; Nico, P.S. Synthetic iron (hydr)oxide-glucose associations in subsurface soil: Effects on decomposability of mineral associated carbon. Sci. Total Environ. 2018, 613–614, 342–351. [Google Scholar] [CrossRef] [PubMed]
- Mendez, J.C.; Hiemstra, T. Surface area of ferrihydrite consistently related to primary surface charge, ion pair formation, and specific ion adsorption. Chem. Geol. 2020, 532, 119304. [Google Scholar] [CrossRef]
- Hiemstra, T.; Mendez, J.C.; Li, J. Evolution of the reactive surface area of ferrihydrite: Time, pH, and temperature dependency of growth by Ostwald ripening. Environ. Sci. Nano 2019, 6, 820–833. [Google Scholar] [CrossRef]
- Ma, J.; Li, J.; Weng, L.; Ouyang, X.; Chen, Y.; Li, Y. Phosphorus-Enhanced and Calcium-Retarded Transport of Ferrihydrite Colloid: Mechanism of Electrostatic Potential Changes Regulated via Adsorption Speciation. Environ. Sci. Technol. 2023, 57, 4219–4230. [Google Scholar] [CrossRef]
- Cismasu, A.C.; Michel, F.M.; Tcaciuc, A.P.; Tyliszczak, T.; Brown, G.E., Jr. Composition and structural aspects of naturally occurring ferrihydrite. Comptes Rendus Geosci. 2011, 343, 210–218. [Google Scholar] [CrossRef]
- Alvarez-Lorenzo, C.; Concheiro, A. Isothermal microcalorimetry for scaffold design and characterization: Assessing bacterial and host cell interactions and physicochemical stability. Adv. Colloid Interface Sci. 2025, 346, 103681. [Google Scholar] [CrossRef]
- Ping, Q.; Zhang, B.; Zhang, Z.; Lu, K.; Li, Y. Speciation analysis and formation mechanism of iron-phosphorus compounds during chemical phosphorus removal process. Chemosphere 2023, 310, 136852. [Google Scholar] [CrossRef]
- Cornelis, P.; Wei, Q.; Andrews, S.C.; Vinckx, T. Iron homeostasis and management of oxidative stress response in bacteria. Metallomics 2011, 3, 540–549. [Google Scholar] [CrossRef] [PubMed]
- Du, H.; Qu, C.; Ma, M.; Lei, M.; Tie, B.; Liu, X.; Wei, X.; Yang, Y. Insights into Pb(II) binding by Fe/Al hydroxide–microbe composite: XAFS spectroscopy and isothermal titration calorimetry study. Chem. Geol. 2019, 510, 84–90. [Google Scholar] [CrossRef]
- Claudia, M.V.; Javiera, A.A.; Sebastián, N.S.; José, F.R.; Gloria, L. Interplay between desiccation and oxidative stress responses in iron-oxidizing acidophilic bacteria. J. Biotechnol. 2024, 383, 64–72. [Google Scholar] [CrossRef] [PubMed]
- Williams, S.M.; Chatterji, D. Dps Functions as a Key Player in Bacterial Iron Homeostasis. ACS Omega 2023, 8, 34299–34309. [Google Scholar] [CrossRef]
- Xie, M.; Koch, E.H.W.; Walree, C.A.v.; Sobota, A.; Sonnen, A.F.P.; Killian, J.A.; Breukink, E.; Lorent, J.H. Synergistic effects of oxidative and acid stress on bacterial membranes of Escherichia coli and Staphylococcus simulans. Commun. Biol. 2024, 7, 1161. [Google Scholar] [CrossRef]
- Yamada, C.; Kato, S.; Ueno, Y.; Ishii, M.; Igarashi, Y. Inhibitory effects of ferrihydrite on a thermophilic methanogenic community. Microbes Environ. 2014, 29, 227–230. [Google Scholar] [CrossRef][Green Version]
- Roca, A.; Rodríguez-Herva, J.J.; Duque, E.; Ramos, J.L. Physiological responses of Pseudomonas putida to formaldehyde during detoxification. Microb. Biotechnol. 2008, 1, 158–169. [Google Scholar] [CrossRef]
- Wehrmann, M.; Berthelot, C.; Billard, P.; Klebensberger, J. Rare Earth Element (REE)-Dependent Growth of Pseudomonas putida KT2440 Relies on the ABC-Transporter PedA1A2BC and Is Influenced by Iron Availability. Front. Microbiol. 2019, 10, 2494. [Google Scholar] [CrossRef]
- Labbeiki, G.; Attar, H.; Heydarinasab, A.; Sorkhabadi, S.; Rashidi, A. Enhanced oxygen transfer rate and bioprocess yield by using magnetite nanoparticles in fermentation media of erythromycin. Daru 2014, 22, 66. [Google Scholar] [CrossRef] [PubMed]
- Nagy, E.; Feczkó, T.; Koroknai, B. Enhancement of oxygen mass transfer rate in the presence of nanosized particles. Chem. Eng. Sci. 2007, 62, 7391–7398. [Google Scholar] [CrossRef]
- Jacobson, K.H.; Gunsolus, I.L.; Kuech, T.R.; Troiano, J.M.; Melby, E.S.; Lohse, S.E.; Hu, D.; Chrisler, W.B.; Murphy, C.J.; Orr, G.; et al. Lipopolysaccharide Density and Structure Govern the Extent and Distance of Nanoparticle Interaction with Actual and Model Bacterial Outer Membranes. Environ. Sci. Technol. 2015, 49, 10642–10650. [Google Scholar] [CrossRef]
- Marcus, Y. A simple empirical model describing the thermodynamics of hydration of ions of widely varying charges, sizes, and shapes. Biophys. Chem. 1994, 51, 111–127. [Google Scholar] [CrossRef]
- Shi, M.; Min, X.; Ke, Y.; Lin, Z.; Yang, Z.; Wang, S.; Peng, N.; Yan, X.; Luo, S.; Wu, J.; et al. Recent progress in understanding the mechanism of heavy metals retention by iron (oxyhydr)oxides. Sci. Total Environ. 2021, 752, 141930. [Google Scholar] [CrossRef] [PubMed]
- Aguilar-Carrillo, J.; Villalobos, M.; Pi-Puig, T.; Escobar-Quiroz, I.; Romero, F. Synergistic arsenic (V) and lead (II) retention on synthetic jarosite. I. Simultaneous structural incorporation behaviour and mechanism. Environ. Sci. Process. Impacts 2018, 20, 354–369. [Google Scholar] [CrossRef]
- Forray, F.L.; Smith, A.M.L.; Drouet, C.; Navrotsky, A.; Wright, K.; Hudson-Edwards, K.A.; Dubbin, W.E. Synthesis, characterization and thermochemistry of a Pb-jarosite. Geochim. Cosmochim. Acta 2010, 74, 215–224. [Google Scholar] [CrossRef]
- Das, S.; Essilfie-Dughan, J.; Hendry, M.J. Arsenate partitioning from ferrihydrite to hematite: Spectroscopic evidence. Am. Mineral. 2014, 99, 749–754. [Google Scholar] [CrossRef]
- Antelo, J.; Fiol, S.; Pérez, C.; Mariño, S.; Arce, F.; Gondar, D.; López, R. Analysis of phosphate adsorption onto ferrihydrite using the CD-MUSIC model. J. Colloid Interface Sci. 2010, 347, 112–119. [Google Scholar] [CrossRef]
- Gustafsson, J.P.; Antelo, J. Competitive Arsenate and Phosphate Adsorption on Ferrihydrite as Described by the CD-MUSIC Model. ACS Earth Space Chem. 2022, 6, 1397–1406. [Google Scholar] [CrossRef]
- Du, H.; Huang, Q.; Lei, M.; Tie, B. Sorption of Pb(II) by Nanosized Ferrihydrite Organo-Mineral Composites Formed by Adsorption versus Coprecipitation. ACS Earth Space Chem. 2018, 2, 556–564. [Google Scholar] [CrossRef]
- Erbs, J.J.; Berquó, T.S.; Reinsch, B.C.; Lowry, G.V.; Banerjee, S.K.; Penn, R.L. Reductive dissolution of arsenic-bearing ferrihydrite. Geochim. Cosmochim. Acta 2010, 74, 3382–3395. [Google Scholar] [CrossRef]
- Zhao, Z.; Jia, Y.; Xu, L.; Zhao, S. Adsorption and heterogeneous oxidation of As(III) on ferrihydrite. Water Res. 2011, 45, 6496–6504. [Google Scholar] [CrossRef] [PubMed]
- Meng, Y.L.; Liu, Z.; Rosen, B.P. As(III) and Sb(III) uptake by GlpF and efflux by ArsB in Escherichia coli. J. Biol. Chem. 2004, 279, 18334–18341. [Google Scholar] [CrossRef]
- Silver, S.; Phung, L.T. Bacterial heavy metal resistance: New surprises. Annu. Rev. Microbiol. 1996, 50, 753–789. [Google Scholar] [CrossRef]
- Gao, Y.; Liu, N.; Meng, F.; Dong, L.; Fei, Z.; Chen, M.; Liu, C.; Wu, P.; Tong, H. The fate of cadmium during the hydrolysis and solid-state transformation of iron. Water Res. 2025, 283, 123840. [Google Scholar] [CrossRef]
- Cardoso, P.; Pinto, R.; Lopes, T.; Figueira, E. How Bacteria Cope with Oxidative Stress Induced by Cadmium: Volatile Communication Is Differentially Perceived among Strains. Antioxidants 2024, 13, 565. [Google Scholar] [CrossRef] [PubMed]


Disclaimer/Publisher’s Note: The statements, opinions and data contained in all publications are solely those of the individual author(s) and contributor(s) and not of MDPI and/or the editor(s). MDPI and/or the editor(s) disclaim responsibility for any injury to people or property resulting from any ideas, methods, instructions or products referred to in the content. |
© 2026 by the authors. Licensee MDPI, Basel, Switzerland. This article is an open access article distributed under the terms and conditions of the Creative Commons Attribution (CC BY) license.