Abstract
This paper presents a theoretical and experimental investigation of the amplitude–frequency response of a triple-microcantilever system designed for real-time ultra-low mass detection. The present study focuses on the unfunctionalized configuration to clarify the intrinsic electromechanical behavior of this system. Starting with analytical expressions, output voltage amplitude–frequency responses are derived for a Wheatstone-bridge-based readout circuit and used to analyze the relationship between the resonant frequencies and mechanical amplitude–frequency responses of the three microcantilevers and the resulting electrical response. The extrema and zero-crossing points of the output voltage do not trivially coincide with the individual resonance peaks or their intersection points; this offers more freedom for defining strong detection criteria. A specialized experimental setup has been developed and used to measure the frequency response of a fabricated triple-microcantilever prototype; good agreement with the theoretical predictions has been found within the operating range. Initial humidification tests confirm the high sensitivity of the microsystem against small added masses, corresponding to an estimated detection limit on the order of 10−16 kg for the unfunctionalized device. In this way, the present work confirms the validity of the proposed triple-microcantilever configuration for ultra-low mass sensing and outlines its potential for future application in pathogen detection upon surface functionalization.
1. Introduction
Globalization, urbanization, intensive mobility, and environmental change have contributed to the high risk of emerging and re-emerging pathogens for epidemics and pandemics in modern society [1,2]. Recent outbreaks, such as SARS-CoV-2, H1N1, and Zika virus, illustrated that early detection and timely interventions are imperative to constrain transmission and reduce severity [3], raising pressing demands for diagnostic technologies with the combination of high sensitivity and specificity and rapid accessible operation. Well-established methods include the molecular ones targeting nucleic acid detection through real-time RT-PCR, droplet digital PCR, and isothermal amplification [4,5,6], serological and immunological assays targeting viral antigens or host antibodies [7,8], and classical or advanced electron microscopy for direct visualization and studies on virus pathogenesis [9]. Biophysical and mass-sensitive techniques aim at detecting extremely small masses by tracking changes in the mechanical or physical properties of dedicated sensing structures. Attogram-to-nanogram loads are detected by Quartz Crystal Microbalance through piezoelectric resonance shifts [10]. Specific binding events cause refractive index changes to be tracked through the Surface Plasmon Resonance method [11]. Further, novel platforms add electrical/biophysical readouts to this list: graphene field-effect transistor biosensors for SARS-CoV-2 antigens [12], solid-state nanopores for direct DNA/RNA/protein sensing [13], and CRISPR assays such as SHERLOCK and DETECTR for sequence-specific nucleic-acid detection [14,15]. Complementary digital health and AI tools leverage wearables with symptom reporting [16] and machine-learning analysis of clinical/imaging data, e.g., COVIDiag for CT-based diagnosis [17,18].
In this context, microcantilever-based sensors are a prominent platform. In reference [19], an array of microcantilever sensors are used to bend in response to biochemical surface tension generated by specific molecular binding. Microcantilever beams with different geometries were used by the authors of [20] to detect prostate-specific antigen without the use of markers by bending under nanomechanical forces caused by specific biomolecular binding on one surface of the beam. By combining microcantilever sensors with atomic force microscopy, it is possible to detect molecular interactions by measuring bending or changes in resonant frequency caused by absorbed masses [21]. To calculate resonance shifts, a model based on the Euler–Bernoulli equation is utilized to measure the mass of a substance on a microcantilever that is not absorbed evenly [22]. The effect of Lorentz forces was evaluated by examining dual microcantilever sensors with piezoresistive elements and integrated heaters in a recent study [23]. The discovery of ultra-low masses could be achieved through the measurement of modulus of difference in the amplitude–frequency responses of a Wheatstone bridge using piezoresistive microcantilever sensors with double beams and a vibrating base in [24]. Silicon cantilever beams with nanoscale thickness are studied in [25] and are used as microresonator sensors to detect virus particle masses by measuring changes in resonance frequency. Huber et al. [26] describe the detection of bacterial pathogens or biomarkers using nanomechanical microcantilever biosensors that measure changes in surface tension caused by biomolecular binding. Microcantilever sensors have remarkable sensitivity, but their lack of specificity without surface functionalization makes them mostly experimental. In a theoretical and experimental study [27], Pakdast et al. demonstrated that a microcantilever sensor composed of three identical mechanically connected beams exhibits superior capabilities in comparison to mono-microcantilever sensors with regard to vacuum operation, mass localization, insensitivity to surface tension, and distributed α-specific adsorption.
In an earlier article [28], the authors of the present paper introduced and discussed the fundamental theory and anticipated outcomes of a sensor composed of three distinct microcantilever beams, fabricated from a common substrate, which vibrates with a smoothly varying frequency. The emphasis was on sensing, electromechanical modeling, and proof-of-principle measurements. However, the influence of mechanical coupling among three microcantilever beams on the output amplitude–frequency response has not yet been analytically described and experimentally validated.
The present work aims to develop an analytical and experimental framework for the output voltage amplitude–frequency response of an unfunctionalized triple-microcantilever system for ultra-low mass sensing. Work focuses on clarifying the relation between the micro-mechanical response of the three individual cantilevers and their nonlinear Wheatstone-bridge output to identify characteristic extrema and zero-crossing features that can serve as strong detection criteria. Furthermore, the sensitivity of the system to external influences like humidity was investigated by using a prototype fabrication and a high-resolution measurement setup to assess its potential for future use in real-time, highly sensitive biosensing after surface functionalization.
2. Comparative Analysis of Single-, Double- and Triple-Microcantilever Structures Designed for Small Mass Detection
Comparing the capabilities of single-, double-, and triple-microcantilever structures and their use in sensors for detecting ultra-small masses can be performed based on research.
The single-microcantilever sensor can detect a change in resonant frequency, which can determine events like pathogen capture on the microcantilever surface [21]. Identifying the maximum of the amplitude–frequency characteristic is a challenge due to the small change in amplitude value around the same frequency. Due to the zero derivative of the frequency response at the resonance frequency, comparing close values in practice is not reliable. There is a noticeable drift in the resonance frequency due to external influences, and when the shift due to detection is comparable in amplitude to the drift, detection becomes unreliable.
Because a single frequency shift cannot unambiguously prove that the target pathogen is bound to the sensor surface, and may instead arise from random fluctuations, more confirmation steps are required to verify that the observed signal corresponds to a true binding event.
In a differential two-cantilever sensor, pathogen capture on the functionalized microcantilever is tracked via the position of a cusp point in the electrical response rather than by the absolute shift of one single resonance frequency [24]. The cusp point is defined with more precision than the AFR maxima due to its zero amplitude and two tangents to the AFR. In this system, there is a nonfunctionalized reference cantilever and another cantilever with a receptor layer that is selective for the target pathogen. Both cantilevers are influenced equally by external factors, such as temperature drift or nonspecific effects, which causes their resonance frequencies to shift synchronously, maintaining the balance of the Wheatstone bridge. Binding specifically on the functionalized cantilever introduces an additional mass load and bending, breaking this balance and leading to a change in resonance frequencies and to a shift of the cusp point, defined as the frequency where the differential Wheatstone-bridge output crosses zero. Tracking resonance behavior and cusp point position together lets the sensor reliably distinguish between true binding events and random or common-mode fluctuations, thus significantly reducing the probability of false detection.
The use of three microcantilevers allows the determination of three resonant frequencies and at least two cusp points [28]. In this microstructure, for mechanical AFR the values of the three resonant frequencies and AFR line intersections create a significantly greater variety in the possible configuration sets (see Figure 1). The amplitude B represents the displacement of the equivalent mass in a lumped dynamic model.
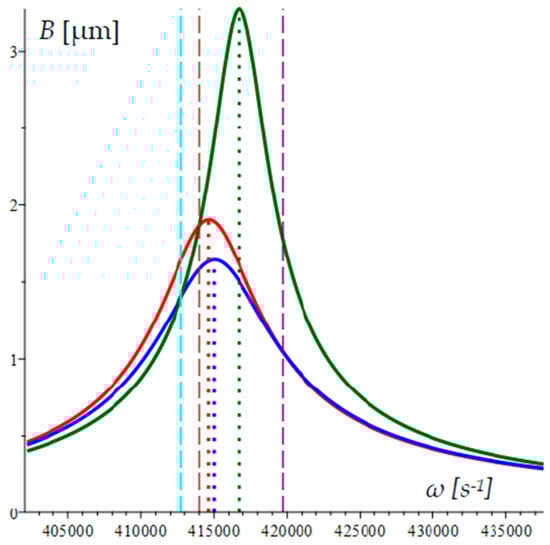
Figure 1.
A geometric configuration of three mechanical AFRs with corresponding resonance frequencies and their intersection points. Resonant frequencies are denoted with dotted lines, while intersections are denoted with dashed lines.
The microcantilever that has captured additional mass on its surface can be reliably identified by examining the frequency of identified cusp points. The capture of a particle on the cantilever with a resonance frequency value between the highest and lowest will result in both cusp points moving simultaneously. Only one of the two cusp points is displaced when the microcantilever is captured with the highest or lowest frequency, which allows for identification of the participating microcantilever (see Section 5 and Section 6). This allows for the distinction between false and real events, as well as information on the functionalization of the cantilevers.
To sum up, the triple-microcantilever configuration incorporates some benefits of both single and differential dual sensors while adding new capabilities. It has multiple independent markers, including three resonant frequencies and at least two cusp-like points, unlike a single cantilever that provides only one marker and cannot distinguish true mass loading from common-mode drifts. The motion of the cusp points will help locate which cantilever has captured the extra mass (central or side beam) compared to a dual-microcantilever sensor. At the same time, the richer resonance structure of the triple configuration makes it more difficult to interpret the frequency response and requires a more careful design of the cantilever geometries and the bridge topology. To obtain well-defined intersection points and cusp-like features, the natural frequencies must remain sufficiently close. Analytically and experimentally, these aspects are addressed here and will be further refined in future optimization studies.
3. Design Concept and Basic Operation of the Triple-Microcantilever Sensor
Three silicon microcantilevers with similar natural frequencies and a single common substrate make up the triple-microcantilever microsystem. Vibrations are transmitted onto the substrate by a piezoelectric actuator, which sweeps over a range of frequencies close to the natural frequencies of the microcantilevers. Two piezoresistors are formed on the fixed end of the middle microcantilever. Only one piezoresistor is formed on the fixed ends of the side microcantilevers (Figure 2a). Due to the many variations of piezoresistor and resistor wiring diagrams, this study is limited to the variant in Figure 2b.

Figure 2.
Simplified schematic representation of a triple-microcantilever microsystem: (a) General geometric view and arrangement of electrical parts; (b) the wiring diagram under consideration containing only piezo resistors: 1, 2 and 3 are microcantilevers, 4 is common substrate, R1, R2, R3 and R4 are piezoresistors, and R5, R6, R7 and R8 are passive resistors.
Figure 3 also clearly depicts the structural elements of the triple-microcantilever system. Bulk micromachining technology was used to fabricate the three microcantilevers (1, 2 and 3) from the silicon substrate (4), which have a thickness of 4 µm. The lengths of the microcantilevers range from 250 to 295 µm, and their widths vary around 150 µm. The dimensions were chosen to make sure that their natural frequencies do not differ by more than 2 kHz. The formation of piezoresistors R1, R2, R3, and R4 is carried out on the microcantilevers according to the schematic representation depicted in Figure 2a. Each microcantilever has a gold pad (5), which can be functionalized to detect specific viruses, pathogens, or trace gases. Four rectangular apertures are made at its fixed ends to adjust the stiffness of the cantilever. Microlaser cutting can be used to change the stiffness of a microcantilever by removing a segment of the wall that forms the rectangular holes. A thin aluminum wire (7) is formed on each microcantilever, which outlines it externally and serves as a heater. Each microcantilever or a selected combination of microcantilevers can be individually heated by the heater terminals.
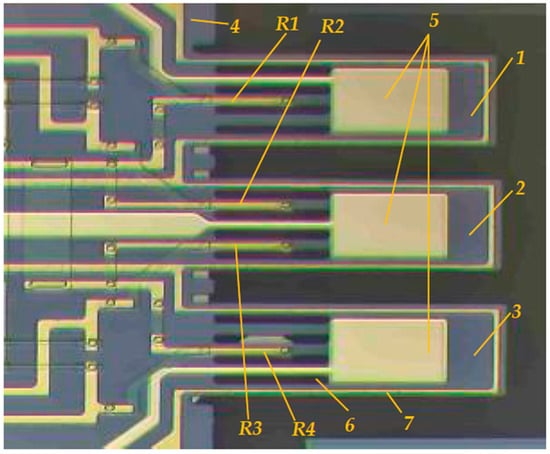
Figure 3.
A picture of the triple-microcantilever system. 1. Left side microcantilever. 2. Middle microcantilever. 3. Right-side microcantilever. 4. Common substrate. R1 piezoresistor on the left-side microcantilever. R2 and R3 piezoresistors on the middle console. R4 piezoresistor on the right-side microcantilever. 5. Gold pads. 6. Rectangular holes. 7. Aluminium wire (heater).
The Joule effect triggers a rise in temperature in the heaters of each microcantilever, affecting its geometry and Young’s modulus of the material. The stiffness and natural frequency of the microcantilever are affected by these changes. The microcantilever bends when the layers of the heater expand at different rates due to their differing coefficients of thermal expansion. The fast thermal processes in microcantilevers lead to frequent use of bending to generate vibrations, typically at the resonant frequency [29,30].
The heater generates a Lorentz force when subjected to an external magnetic field. When these forces are oriented so they lie in the plane of the microcantilever, depending on the direction of the current, they either stretch or contract the microcantilever, leading to a change in its natural frequency. Conversely, when oriented perpendicular to its plane and applied to an alternating current, Lorentz forces are used to induce vibrations in the microcantilever [31,32]. Inducing vibrations with thermal or Lorentz forces combined with precise tuning of the natural frequency has been shown to be a highly effective approach, as demonstrated in [23].
4. The Theoretical Basics of the Detection Principle Using the Triple-Microcantilever Microsystem
The current research is centered on a lumped model of microcantilevers. The law of motion of each microcantilever’s effective mass is formulated according to [24,28]. Position of every equivalent mass of the i-th microcantilever ( 1, 2, and 3) can be expressed with these relationships:
where is the circular frequency of the forced oscillations, t is the time,
is the amplitude of the forced oscillation of the -th microcantilever and
is the phase of the -th microcantilever. In Equations (2) and (3), is the acceleration; and are the damping coefficient and the natural frequency of the -th microcantilever respectively.
According to [33] the resistance of a j-th (j = 1, 2, 3, and 4) piezoresistor can be written as
where is the base and is the variable resistance of the j-th piezoresistor. For the considered case the variable resistance of the j-th piezoresistor can be presented as follows:
where is a generalized piezoresistive coefficient which depends on the piezoresistive components of the piezoresistor, its acceleration and the strain at the fixed microcantilever end. This study assumes that the case is ideal and that all piezoresistors have the same generalized piezoresistive coefficient.
The voltage of the first divider of Wheatstone-bridge-containing piezoresistors and is
where is the suppling voltage of the Wheatstone bridge. Similarly, the voltage of the second voltage divider formed of the piezoresistors and follows
Assuming that, in the ideal case, , the output Wheatstone-bridge voltage follows the expression
Considering Equations (4) and (5), and making simple transformations, Equation (8) becomes
Simplifying the equation above can be performed with substitution,
assuming as small quantities; then, the third-order Taylor series of (9) with respect to leads to the polynomial
As it can be seen, this result does not consider the influence of the middle microcantilever. Therefore, the Taylor series continues to the fourth order, which has the following form:
The derived equations can be used to track and analyze the output voltage of the side and middle microcantilevers. Due to its complexity, Formula (12) is substituted with Formula (9) in later calculations. The study found that = 0.069. This is a minor error compared to the piezoresistor’s nominal value of 1000 ohms. This result shows there are instances where the second-order Taylor series error can be very high.
Estimating the mass deposited on the surface of the microcantilevers can be performed by solving the equation
leading to the solution
where is the deposited mass of water on the i-th microcantilever, is the change in the angular frequency; and are the mass and stiffness of the i-th microcantilever, i = 1, 2, 3.
5. Experimental Validation and Numerical Study of the Output Voltage’s Amplitude–Frequency Response
The theoretical assumptions described above were confirmed using a fabricated prototype, and the relevant parameters are listed in Table 1 below.

Table 1.
The parameters of the fabricated triple-microcantilever prototype.
The AFR describes the relationship between maximum amplitude and frequency of oscillations. Figure 4 provides an illustrative representation of the relationship, showcasing a three-dimensional graph that depicts the output voltage as a function of circular frequency and the time . The output voltage is a non-linear trigonometric function (9). A special program was created to determine the AFR for the case being considered. The circular frequency was varied in this program by taking a small step in a range that included the natural frequencies of the three microcantilevers. The absolute value of the maximum amplitude was determined by varying the time t with a small step within a period of the oscillation for each frequency. The set of maximum amplitudes plotted against their corresponding excitation frequencies was considered the AFR of the triple-microcantilever system.

Figure 4.
Three-dimensional graph of the output voltage versus circular frequency and the time .
The approach that has been selected enables the characteristics of the two dividers and to be determined using the provided Formulas (6) and (7). The voltage graphs of these dividers and their respective locations are shown in Figure 5.
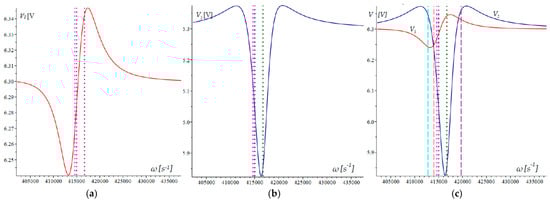
Figure 5.
Output response of the voltage divider: (a) response V1(ω) of the first voltage divider; (b) response V2(ω) of the second voltage divider; (c) relative comparison of the two voltages.
Figure 5a,b show the voltages of the first and second dividers. The three microcantilevers’ natural frequencies can be identified by the vertical dotted lines on these plots. It is noteworthy that the extreme voltage values of the dividers do not occur at the natural frequencies.
Figure 5c displays the two divider voltages, with the dotted lines representing the natural frequencies. The dashed lines on this plot represent the frequencies at which the mechanical amplitude–frequency responses intersect. The general arrangement of these lines relative to the maxima and intersections of the divisors suggests that the relationship between them is complex and difficult to analyze.
The calculated AFR, natural frequency lines that correspond to it, and intersection points of the mechanical AFR are depicted in Figure 6.
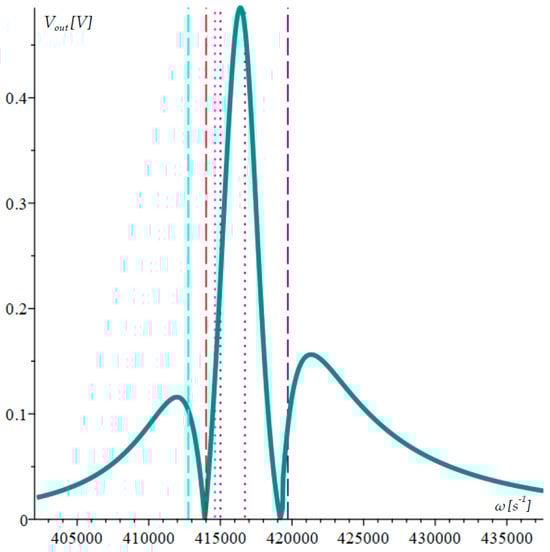
Figure 6.
Calculated AFR of the triple-microcantilever microsystem.
The numerical approach was implemented using a LabVIEW program in a specialized setup created for the experimental study of the amplitude–frequency characteristic (Figure 7) [34]. In Figure 7a, a 3D block schematic shows the basic experimental modules and its connections; Figure 7b is photo of the experimental setup, and Figure 7c a close view of the triple-microcantilever microsystem.

Figure 7.
Experimental setup for frequency response study of the triple-microcantilever microsystem; (a) schematic of the experimental setup without the hydro-sprayer (5); (b) picture of the experimental setup and the microsystem (c) picture of the microsystem: 1. PXI data acquisition system, 2. microsystem, 3. Digilent signal generator, 4. screen, 5. hydro-sprayer, 6. piezoelectric actuator.
The experimental setup can measure frequencies up to 300 kHz with a resolution of 0.01 Hz. This is due to the PXI data acquisition system operating at a discretization rate of 2 Msps. The piezoelectric actuator is powered by a Digilent signal generator. The microsystem’s behavior in humidification was tested by adding a hydro-sprayer to the experimental setup.
The PXI data acquisition system is managed by a LabVIEW program that adjusts the signal generator frequency to match the natural frequencies of the three microcantilevers during the experiment. Changing the frequency between 50 and 120 kHz is possible. A driving voltage at the same frequency is provided by the signal generator to the piezoelectric actuator. Vertical driving of the common substrate of the three microcantilevers causes vibrations in the microcantilevers. Although they oscillate at the same frequency, the three microcantilevers exhibit unique resonances and phase variations. The frequency range is divided by a number of points and can be measured by a step of 0.1 Hz. As the signal passes through each frequency, it maintains this frequency for more than one period of the current vibrations. The Wheatstone bridge made up of microcantilever piezoresistors is powered by the PXI system and its output voltage is read simultaneously. The LabVIEW program tracks the maximum output voltage on both diagonals of the bridge and the total output voltage for each frequency throughout the duration. The resulting array forms the system’s AFR.
When comparing the initial experimental results to the numerical ones (Figure 8), a relatively good match was seen, particularly in terms of the maximum values and the intersection points of the two voltage dividers with the x-axis.

Figure 8.
Comparison of the experimental and calculated AFR of the triple-microcantilever microsystem. The red line represents the calculated data.
The graph shows significant deviations beyond the frequency interval limits, which could result from the inaccuracy of the parameters in the tested prototype.
To determine how well the system detects changes in ambient humidity, three microcantilevers were subjected to hydro-spray for a short period. The AFR was examined by wetting the microcantilevers. Figure 9 shows the graphic depiction of this result. The response’s shape remained the same, but the frequency decreased and the damping increased. The wetting process caused a decrease in the frequency of the biggest intersection point by 3051 s−1, or 485.8 Hz.
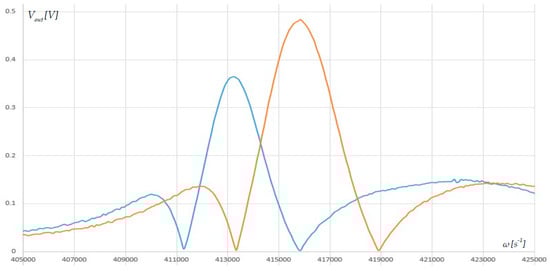
Figure 9.
Graph of the AFR after wetting the surfaces of the triple-microcantilever microstructure. The blue line is AFR after the deposition of water mass.
Using the Formula (14) and the data in Table 1 the following values of the deposited water masses are obtained: = 9.76489 × 10⁻¹³ kg; = 9.53252 × 10⁻¹³ kg; = 9.23577 × 10⁻¹³ kg. This change in the mass is for a deviation of = 485.6 Hz. Considering that the resolution of the experimental setup is 0.1 Hz, it can be roughly concluded that the minimum mass of water that can be detected without functionalization is about 2 × 10⁻¹⁶ kg.
The data in Figure 7 shows that damping increased by 24.3% because of moisture absorption.
The findings indicate that the microsystem is highly sensitive to the measured mass. External conditions cause a shift in the frequencies of all three microcantilevers, as shown by the overall change in all frequencies. Finding a reference base that can remove their influence and leave only the signal from the mass of interest is a challenging task.
6. Discussion
The comparison of calculations and experimental measurements (Figure 4, Figure 5, Figure 6, Figure 7, Figure 8 and Figure 9) indicates that the analytical formulation used for the output bridge voltage (see Equation (9)) is valid based on the good agreement within the operating frequency range. The system’s ability to detect small masses remains despite the deviations seen outside the operating range being explained by parametric inaccuracies in the prototype and simplifications in the model.
The conducted experimental and simulation studies showed that the system has complex behavior, expressed in the fact that there is no coincidence of the resonant frequencies of the mechanical AFRs with the extreme values of the output voltage AFR. Also, there is no coincidence of the frequencies of the intersection points of the mechanical AFRs with the cusp points of the AFR of the output voltage.
The natural frequency ratios significantly impact the observed behavior. Small geometric or parametric variations among the three cantilevers can easily shift the intersection points, resulting in frequencies where the output voltage crosses zero. This suggests the possibility of using cusp-like zero-crossing features as alternative detection criteria, different from the one used in the dual microcantilever sensor. A compact frequency interval has three resonant frequencies and at least two cusp-like zero-crossing features that enrich the picture further. The analytical and numerical results show these markers move in a correlated way when one of the beams is perturbed, creating multiple self-consistency checks that can be exploited to reduce false positives and refine mass estimates.
The wetting test (Figure 9) shows a shift of the AFR to lower frequencies (on the order of several hundred hertz) and about a one-quarter increase in damping, but the shape of the curve remains unchanged. This behavior is consistent with the environmental changes acting on the common substrate, leading to a shift in all three resonance frequencies in the same direction. In contrast, a localized added mass impacts only one beam, resulting in an asymmetric shift of the three-frequency pattern and the accompanying cusp-like features. This intrinsic asymmetry allows the triple-beam system to automatically separate ambient drift from specific mass loading.
Based on the parameters from Table 1, the accumulated water masses on the cantilevers of the order of 10−13 kg were estimated from the same data (the specific numerical values are shown in the text for each cantilever). Considering the accuracy of the frequency resolution, this leads to an approximate detection limit of order of 10−16 kg for an unfunctionalized system.
From the point of view of the measurement circuit, it is shown that the bridge output is a nonlinear function of small changes in resistances; the second-order expansion is not always enough for a correct approximation, although the absolute change is small compared to the nominal (about 0.069 Ω at 1000 Ω). The exact but compact expression (9) is used in the subsequent analysis, while the higher-order expansion is only given to show the limitations of low-order approximations. Finally, it is defined that the considered bridge topology is a specific variant (Figure 2b); other connections with piezoresistors and passive arms remain beyond the present study.
To expand and define the validity of conclusions drawn in a larger class of configurations and under different measurement conditions, the authors have established the following future tasks:
- (a)
- To systematically study different Wheatstone-bridge connections to determine those configurations that most accurately establish the relationship between the displacement of the cusp points in the amplitude–frequency characteristic of the output voltage and the masses added to the microcantilevers;
- (b)
- To pick a trustworthy method for determining a reference signal that is not influenced by changes in the general conditions for the three cantilevers, like temperature, humidity, and dustiness of the environment.
7. Conclusions
Analysis was carried out on the triple-microcantilever system, and the main dependencies that describe the output voltage of the bridge circuit based on piezoresistive elements were derived. A specialized experimental setup with high resolution, accuracy and fast response was developed, and a prototype of a triple-microcantilever system was fabricated and tested. The setup was used to measure the amplitude–frequency response of a prototype, and a satisfactory correspondence between the analytical and experimental results was seen in the operating frequency range.
Theoretical and numerical analysis revealed a key distinctive feature of the considered triple configuration: the maxima of the amplitude–frequency response of the bridge output voltage do not coincide with the individual resonant frequencies of the three cantilevers, and the zero-crossing frequencies (cusp-like points) do not trivially coincide with the intersection points of the mechanical amplitude–frequency characteristics. The triple configuration investigated here offers a more extensive set of markers than the traditional ones, which include three resonant frequencies and multiple cusp-like zero-crossing points of the bridge output. This feature allows for implementing detection strategies and improving discrimination between local mass loading and global environmental drifts. The frequency response interpretation becomes more challenging due to the non-trivial relationship between mechanical resonances and electrical extrema, which requires careful design of device geometry and the electrical circuit.
The influence of humidity on the frequency response has been investigated experimentally. It has been found that the triple-microcantilever system responds to humidification by decreasing the amplitude, increasing the effective damping, and shifting the amplitude–frequency response to lower frequencies.
The obtained results can quantify key operating parameters of the system, including sensitivity and minimum detectable mass, and guide future optimization of functionalized triple-microcantilever sensors for ultra-low mass and pathogen detection.
Author Contributions
Conceptualization, T.T., L.B., R.M. and B.G.; methodology, B.G.; software, B.G.; validation, B.G., T.T. and L.B.; formal analysis, R.M. and V.S.; investigation, L.B., T.T. and B.G.; resources, V.S.; data curation, V.S.; writing—original draft preparation, T.T.; writing—review and editing, R.M.; visualization, R.M.; supervision, T.T.; project administration, T.T.; funding acquisition, T.T. All authors have read and agreed to the published version of the manuscript.
Funding
The results in this research were obtained under project № 252ПД0031-05, funded by the subsidy of the Technical University of Sofia. This research was also funded by the European Union-NextGenerationEU through the National Recovery and Resilience Plan of the Republic of Bulgaria, project № BG-RRP-2.004-0005.
Institutional Review Board Statement
Not applicable.
Informed Consent Statement
Not applicable.
Data Availability Statement
Data are contained within the article.
Conflicts of Interest
The author Vladimir Stavrov was employed by the company AMG Technology Ltd. The authors declare that the research was conducted in the absence of any commercial or financial relationships that could be construed as potential conflicts of interest.
References
- Morse, S.S.; Mazet, J.A.; Woolhouse, M.; Parrish, C.R.; Carroll, D.; Karesh, W.B.; Zambrana-Torrelio, C.; Lipkin, W.I.; Daszak, P. Prediction and Prevention of the next Pandemic Zoonosis. Lancet 2012, 380, 1956–1965. [Google Scholar] [CrossRef]
- Saker, L.; Lee, K.; Cannito, B.; Campbell-Lendrum, D. Globalization and Infectious Diseases, A Review of the Linkages; World Health Organization on behalf of the Special Programme for Research and Training in Tropical Diseases (TDR): Geneva, Switzerland, 2004. [Google Scholar]
- Li, Q.; Guan, X.; Wu, P.; Wang, X.; Zhou, L.; Tong, Y.; Ren, R.; Leung, K.S.M.; Lau, E.H.Y.; Wong, J.Y.; et al. Early Transmission Dynamics in Wuhan, China, of Novel Coronavirus–Infected Pneumonia. N. Engl. J. Med. 2020, 382, 1199–1207. [Google Scholar] [CrossRef] [PubMed]
- Corman, V.M.; Landt, O.; Kaiser, M.; Molenkamp, R.; Meijer, A.; Chu, D.K.; Bleicker, T.; Brünink, S.; Schneider, J.; Schmidt, M.L.; et al. Detection of 2019 Novel Coronavirus (2019-NCoV) by Real-Time RT-PCR. Eurosurveillance 2020, 25, 2000045. [Google Scholar] [CrossRef]
- Hindson, B.J.; Ness, K.D.; Masquelier, D.A.; Belgrader, P.; Heredia, N.J.; Makarewicz, A.J.; Bright, I.J.; Lucero, M.Y.; Hiddessen, A.L.; Legler, T.C.; et al. High-Throughput Droplet Digital PCR System for Absolute Quantitation of DNA Copy Number. Anal. Chem. 2011, 83, 8604–8610. [Google Scholar] [CrossRef]
- Notomi, T. Loop-Mediated Isothermal Amplification of DNA. Nucleic Acids Res. 2000, 28, e63. [Google Scholar] [CrossRef]
- Udugama, B.; Kadhiresan, P.; Kozlowski, H.N.; Malekjahani, A.; Osborne, M.; Li, V.Y.C.; Chen, H.; Mubareka, S.; Gubbay, J.B.; Chan, W.C.W. Diagnosing COVID-19: The Disease and Tools for Detection. ACS Nano 2020, 14, 3822–3835. [Google Scholar] [CrossRef]
- Gozalbo-Rovira, R.; Gimenez, E.; Latorre, V.; Francés-Gómez, C.; Albert, E.; Buesa, J.; Marina, A.; Blasco, M.L.; Signes-Costa, J.; Rodríguez-Díaz, J.; et al. SARS-CoV-2 Antibodies, Serum Inflammatory Biomarkers and Clinical Severity of Hospitalized COVID-19 Patients. J. Clin. Virol. 2020, 131, 104611. [Google Scholar] [CrossRef]
- Goldsmith, C.S.; Miller, S.E. Modern Uses of Electron Microscopy for Detection of Viruses. Clin. Microbiol. Rev. 2009, 22, 552–563. [Google Scholar] [CrossRef]
- Marx, K.A. Quartz Crystal Microbalance: A Useful Tool for Studying Thin Polymer Films and Complex Biomolecular Systems at the Solution−Surface Interface. Biomacromolecules 2003, 4, 1099–1120. [Google Scholar] [CrossRef] [PubMed]
- Homola, J. Surface Plasmon Resonance Sensors for Detection of Chemical and Biological Species. Chem. Rev. 2008, 108, 462–493. [Google Scholar] [CrossRef] [PubMed]
- Seo, G.; Lee, G.; Kim, M.J.; Baek, S.-H.; Choi, M.; Ku, K.B.; Lee, C.-S.; Jun, S.; Park, D.; Kim, H.G.; et al. Rapid Detection of COVID-19 Causative Virus (SARS-CoV-2) in Human Nasopharyngeal Swab Specimens Using Field-Effect Transistor-Based Biosensor. ACS Nano 2020, 14, 5135–5142. [Google Scholar] [CrossRef]
- Dekker, C. Solid-State Nanopores. Nat. Nanotechnol. 2007, 2, 209–215. [Google Scholar] [CrossRef]
- Kellner, M.J.; Koob, J.G.; Gootenberg, J.S.; Abudayyeh, O.O.; Zhang, F. SHERLOCK: Nucleic Acid Detection with CRISPR Nucleases. Nat. Protoc. 2019, 14, 2986–3012. [Google Scholar] [CrossRef]
- Broughton, J.P.; Deng, X.; Yu, G.; Fasching, C.L.; Servellita, V.; Singh, J.; Miao, X.; Streithorst, J.A.; Granados, A.; Sotomayor-Gonzalez, A.; et al. CRISPR–Cas12-Based Detection of SARS-CoV-2. Nat. Biotechnol. 2020, 38, 870–874. [Google Scholar] [CrossRef] [PubMed]
- Quer, G.; Radin, J.M.; Gadaleta, M.; Baca-Motes, K.; Ariniello, L.; Ramos, E.; Kheterpal, V.; Topol, E.J.; Steinhubl, S.R. Wearable Sensor Data and Self-Reported Symptoms for COVID-19 Detection. Nat. Med. 2021, 27, 73–77. [Google Scholar] [CrossRef] [PubMed]
- Aalam, J.; Ahmad Shah, S.N.; Parveen, R. An Extensive Review on Infectious Disease Diagnosis Using Machine Learning Techniques and next Generation Sequencing: State-of-the-Art and Perspectives. Comput. Biol. Med. 2025, 189, 109962. [Google Scholar] [CrossRef]
- Abbasian Ardakani, A.; Acharya, U.R.; Habibollahi, S.; Mohammadi, A. COVIDiag: A Clinical CAD System to Diagnose COVID-19 Pneumonia Based on CT Findings. Eur. Radiol. 2021, 31, 121–130. [Google Scholar] [CrossRef]
- Fritz, J.; Baller, M.K.; Lang, H.P.; Rothuizen, H.; Vettiger, P.; Meyer, E.; Güntherodt, H.-J.; Gerber, C.; Gimzewski, J.K. Translating Biomolecular Recognition into Nanomechanics. Science 2000, 288, 316–318. [Google Scholar] [CrossRef]
- Wu, G.; Datar, R.H.; Hansen, K.M.; Thundat, T.; Cote, R.J.; Majumdar, A. Bioassay of Prostate-Specific Antigen (PSA) Using Microcantilevers. Nat. Biotechnol. 2001, 19, 856–860. [Google Scholar] [CrossRef]
- Alunda, B.O.; Lee, Y.J. Review: Cantilever-Based Sensors for High Speed Atomic Force Microscopy. Sensors 2020, 20, 4784. [Google Scholar] [CrossRef] [PubMed]
- Ramos, D.; Calleja, M.; Mertens, J.; Zaballos, A.; Tamayo, J. Measurement of the Mass and Rigidity of Adsorbates on a Microcantilever Sensor. Sensors 2007, 7, 1834–1845. [Google Scholar] [CrossRef]
- Banchelli, L.; Todorov, G.; Stavrov, V.; Ganev, B.; Todorov, T. Evaluation of the Influence of Lorentz Forces on the Natural Frequencies of a Dual-Microcantilever Sensor for Ultralow Mass Detection. Micro 2024, 4, 572–584. [Google Scholar] [CrossRef]
- Banchelli, L.; Todorov, G.; Stavrov, V.; Ganev, B.; Todorov, T. Investigating a Detection Method for Viruses and Pathogens Using a Dual-Microcantilever Sensor. Micromachines 2024, 15, 1117. [Google Scholar] [CrossRef] [PubMed]
- Gupta, A.; Akin, D.; Bashir, R. Single Virus Particle Mass Detection Using Microresonators with Nanoscale Thickness. Appl. Phys. Lett. 2004, 84, 1976–1978. [Google Scholar] [CrossRef]
- Huber, F.; Lang, H.P.; Marten, A.; Bielicki, J.A.; Meyer, E.; Gerber, C. Ultra-Sensitive Biosensors for Medical Applications Based on Nanomechanics: From Detection of Synthetic Biomolecules to Analysis of Sepsis in Pediatric Patients. Biosensors 2025, 15, 217. [Google Scholar] [CrossRef]
- Pakdast, H.; Lazzarino, M. Triple Coupled Cantilever Systems for Mass Detection and Localization. Sens. Actuators A Phys. 2012, 175, 127–131. [Google Scholar] [CrossRef]
- Banchelli, L.; Stavrov, V.; Ganev, B.; Nikolov, N.; Todorov, T. Investigation of Triple-Microcantilever Sensor for Ultra-Low Mass-Sensing Applications. Eng. Proc. 2025, 100, 60. [Google Scholar] [CrossRef]
- Potekhina, A.; Wang, C. Review of Electrothermal Actuators and Applications. Actuators 2019, 8, 69. [Google Scholar] [CrossRef]
- Allen, J.J. Micro Electro Mechanical System Design, 1st ed.; Taylor & Francis Group, LLC: Abingdon, UK, 2005; Volume 1. [Google Scholar]
- Nieradka, K.; Kopiec, D.; Małozięć, G.; Kowalska, Z.; Grabiec, P.; Janus, P.; Sierakowski, A.; Domański, K.; Gotszalk, T. Fabrication and characterization of electromagnetically actuated microcantilevers for biochemical sensing, parallel AFM and nanomanipulation. Microelectron. Eng. 2012, 98, 676–679. [Google Scholar] [CrossRef]
- Somnath, S.; Liu, J.O.; Bakir, M.; Prater, C.B.; King, W.P. Multifunctional atomic force microscope cantilevers with Lorentz force actuation and self-heating capability. Nanotechnology 2014, 25, 395501. [Google Scholar] [CrossRef]
- Liu, C. Foundations of MEMS, 2nd ed.; Prentice Hall, 2 Pearson Education, Inc.: Upper Saddle River, NJ, USA, 2011. [Google Scholar]
- Banchelli, L.F.; Ganev, B.T.; Todorov, T.S. Sustainability Validation of a LabVIEW Based System for Biomarkers Detection. In Proceedings of the 2023 XXXII International Scientific Conference Electronics (ET), Sozopol, Bulgaria, 13 September 2023; pp. 1–6. [Google Scholar]
Disclaimer/Publisher’s Note: The statements, opinions and data contained in all publications are solely those of the individual author(s) and contributor(s) and not of MDPI and/or the editor(s). MDPI and/or the editor(s) disclaim responsibility for any injury to people or property resulting from any ideas, methods, instructions or products referred to in the content. |
© 2025 by the authors. Licensee MDPI, Basel, Switzerland. This article is an open access article distributed under the terms and conditions of the Creative Commons Attribution (CC BY) license (https://creativecommons.org/licenses/by/4.0/).