Abstract
Size is a surface coating applied to glass fibres during manufacture, and it is arguably the most important component in a glass-reinforced composite. Research and development on sizings and composite interfaces are severely limited, because conventional laboratory- scale glass fibre sizing analysis commonly involves sample preparation by dip coating, resulting in a size layer up to two orders of magnitude thicker than industrially produced glass fibre products. This makes it difficult to make useful comparisons between industrial and lab-scale-prepared samples when investigating size performance. This paper presents a novel, but simple, use of laboratory spin coating to apply a size layer to glass fibres that are similar to industrial-sized fibres. Thermogravimetric analysis and electron microscopy were used to investigate the size layers of glass fibres spin-coated with two chemically different sizing formulations, under a range of conditions. The average size layer thickness on spin-coated glass fibres could be easily and simply controlled in a range from 0.05 to 0.6 µm, compared to 0.4–1.3 µm on samples dip coated with the same size formulation and 0.06–0.10 µm on industrial reference samples. This novel application of the spin coating method offers the potential of improved research sample preparation, as it eliminates the need to alter the concentration of the sizing formulations to unacceptably low levels to obtain normal size layer thicknesses.
1. Introduction
Glass fibre reinforcements form the backbone of the composites industry. Today, glass fibre products account for more than 95% of fibre reinforcements used in the composites industry, primarily due to their highly attractive performance-to-price ratio. Despite their relatively low-tech image as a composite reinforcement, the production of glass fibres has evolved into a very complex technology with requirements that challenge the state-of-the-art in materials science research and development [1,2]. Possibly the most critical component involved in the manufacture of glass fibres and their composites is the fibre size. Size is a thin surface coating of mainly organic materials, applied, most often as a dilute aqueous solution or emulsion, to nearly all types of man-made fibres during their manufacture. In the case of glass fibres, sizing is probably the key component influencing the commercial success (or failure) of most reinforcement products and their composites. This is due to the major role played by the sizing in the profitability, processability and performance of that product. Continuous reinforcement of grade glass fibres could not be manufactured in a high volume, cost-effective manner without the correct sizing formulations. Similarly, most composite production processes could not be operated in a cost-effective manner without appropriately sized glass fibres. Finally, both short-term and long-term composite performances are critically influenced by the optimisation of the fibre sizing and the closely associated fibre–matrix interphase in the composite [2,3,4,5,6,7]. However, due to the lack of reliable and verifiable information on the physical and chemical nature of sizings, the generally available understanding of these complex chemical mixtures does not reflect the level of importance that they have in determining the success of any glass reinforced composite material in a specific application [7].
Despite the critical need of the composite industry to fully understand all aspects of the materials it uses, size and sizing remains a “black box” technology in composites, since glass fibre producers are very reticent to reveal much information about the complex formulations they use. Consequently, openly available descriptions of sizes tend to be highly generic in nature. Commercial glass fibres are often supplied with only two sizing-related details. The first is the chemical “compatibility” of the sizing with a general class of matrix polymer. The second is a value for the loss on ignition (LoI), a measurement of the amount of size present on the fibres. This paucity of information on the physical and chemical nature of the sizing on a glass fibre product is an issue for many users of glass fibres, if they are interested in quality control for manufacturing through to the fundamentals of the fibre–matrix interphase. Typically, the user will be told that sizes are dilute water-based emulsions or dispersions containing a complex mixture of components. These will often be described more by their generic function than by their chemical formulae. The primary components are the film former and the coupling agent [2,3,4,5]. The film former is designed to protect and lubricate the fibres and hold them together prior to composite processing, yet also to promote their separation and wetout when in contact with resin. The coupling agent is often said to primarily serve to bond the fibre to the matrix resin. Beyond these two major components, sizes also may include lubricating agents, antistatic agents and surfactants. A complex size formulation may contain five or more components. The interaction of these components with each other, with the fibre surface, with the matrix polymer or within a particular processing environment is extremely complex and quite inadequately researched. A number of recent reviews have highlighted some serious issues for the composites industry, related to the state of play in glass fibre sizing technology [5,6,7]. It has been suggested that the nature of all the complex interactions involved in size formulations, size application, fibre drying, fibre wetting impregnation and composite performance are not at all fully understood, even by those with inside knowledge of size formulations. It has also been highlighted that there is virtually no information available in the open literature on what methods the manufacturers of glass fibres use to characterise their sizings and control the quality and consistency of their sized products. This problem extends to their customers, who consequently have little, or no, real guidance on tools to employ for the quality control of sized glass fibres, other than monitoring issues during full production processing. Even then, quality issues with sizings may only become apparent after many years of long-term performance of the final composite parts.
Notwithstanding the critical importance of size formulations to the composites industry, the enormous diversity of the applications that make use of sized glass fibre as reinforcements, coupled with the veil of industrial secrecy that covers sizing formulations, hinder the development of a sound foundation to the “science” of sizing. Unlike in many other fields of materials science of a similar age, the available literature on sizes, size formulations and the role of individual and combinations of size components is highly fragmented and does not form a continuous and comprehensive foundation for those outside of the glass fibre industry to build meaningful research and development programmes in order to progress the knowledge base in this area. Even where research groups have been able to cooperate with glass fibre manufacturers, the knowledge generated is nearly always unsatisfactorily incomplete, due to the non-disclosed information on the precise details of size formulations. Furthermore, published results are very rarely reproduced and checked by other researchers, due to the non-availability of replicate glass fibre samples which have been identically manufactured and sized. This results in even this meagre amount of published information on sizings being of little help in its application to a slightly different size formulation, or to assist in the reinforcement of a different polymer system. One consequence of this situation is that, while rapid and expanding progress is made in developing areas of materials science, where background information is more openly available, new size development continues to be carried by an extremely small number of researchers in glass fibre manufacturers’ laboratories (in proportion to the size of the composites industry). To make matters even more challenging, these small research groups (or individuals) cannot even discuss the subject with their peers in other companies. Hence, size development actually takes place in an extraordinarily isolated environment in comparison to many other fields of materials science. Having to operate in such restricted silos is highly detrimental to innovation; indeed, studies on the effect of silos in large corporations have concluded that “a silo is where collaboration goes to die. The reality is that the number one thing slowing innovation is a lack of effective cross-silo communication” [8]. It is a small wonder, then, that trial and error is still a predominant method of new size development, although nowadays the trial-and-error method is frequently dressed up to look more scientific by using the design of experiment methods combined with statistical analysis.
From a wider perspective, this situation potentially has enormous consequences for the slowing and limiting of innovation in the composite environment. Because of the lack of any comprehensive or reliable database on the science and technology of glass fibre sizings, and the lack of accepted analysis and characterisation techniques and standards for sizings, the number of knowledgeable researchers outside of the glass fibre producers is extremely small. This is compounded by the secrecy surrounding size formulations, the unique conditions of size application during fibre manufacture [4,7] and the very low concentration of size mixtures in a final composite part. This situation makes it challenging for those without insider knowledge of sizings to draw any significant conclusions about whether any real progress is being made in this important area of composites science. However, there is little evidence of any real innovation in commercial sizing development, and it seems likely that the area is in near stagnation, as many glass fibre products and their sizes are high on the development S-curve, resulting in rapidly diminishing returns on effort [9]. Indeed, the glass fibre industry is on record as saying that product (i.e., sizing) development across the industry is moving at a slower pace than in the past [10].
It is well-established that the pace of technology development in any scientific field is directly proportional to the level of information sharing and to the number of well-informed researchers active in the field [11,12,13]. While rapid and expanding progress is made in developing areas of materials science, where background information is more openly available, new size development continues to be carried out by an exceedingly small number of researchers. These very limited numbers of researchers operate in an isolated and restricted environment with little or no open exchange of information. This situation seriously reduces the probability of an innovation in the field, leading to a jump to a new S-curve, which could bring rapid acceleration in the performance of resultant new composite products. Consequently, it seems that it is highly likely that the current overall state of size development is a serious barrier to the innovation of improved glass fibre-reinforced composite materials, and is something that urgently needs to be addressed on an industry-wide level. Researchers in the composite industry urgently need to acquire a better understanding of glass fibre sizings and how they can be tailored to improve composite performance. One possible way to assist this would be to develop some size screening tools that could be used in any laboratory and do not require the resource-intensive facilities of a glass fibre manufacturing plant. One of the principal roles of a glass fibre size is ensuring the quality and endurance of the fibre–polymer interphase in a composite. Conventional lab-scale sizing research and development, outside of the glass fibre manufacturing companies, commonly involves sample preparation by dip-coating fibre samples in a test size formulation. Although this enables the investigation of chemicals that might be used in sizing formulations, this process lacks any connection with the high speed and high shear of real-world sizing applications during glass fibre manufacture. Moreover, when used with sizes containing a normal concentration of components, this method usually results in an unrealistically thick size layer on the fibres, with a significantly higher LoI than industrial sized fibres [14]. This makes a useful evaluation of size performance and the related composite interface performance from lab-scale prepared samples highly uncertain. Consequently, there is a pressing need for the development of a lab-scale sizing process that more closely mirrors the results of the industrial process.
Spin-coating is a simple technique, commonly used in a wide variety of industries and technology sectors, for rapidly applying thin coatings onto mainly flat substrates [15,16]. The required equipment is relatively low-cost and is widely available in many university and industrial laboratories. The principal advantage of spin-coating in comparison to other coating application methods is the ability to simply and quickly create very uniform coatings. When a solution of a material and a solvent is spun at high speeds using a spin coater, the centripetal force and the surface tension of the liquid together create an even covering. After any remaining solvent has evaporated, spin-coating results in a thin film ranging from a few nanometres to a few microns in thickness. The use of spin-coating in organic electronics and nanotechnology is widespread and has built upon many of the techniques used in other semiconductor industries. However, spin-coating was developed, and is used predominantly, to coat flat substrates. There are some examples to be found of its use on cotton or polymer fibre textile substrates [17,18] but, to the best of our knowledge, the technique has never been investigated for its potential to apply sizings to glass fibres. This paper presents an investigation into spin-coating of sizing onto glass fibre bundles. This novel, but simple, approach to glass fibre sizing can produce small glass fibre samples, suitable for typical fibre and interface micromechanical testing, with a size layer thickness that is similar to industrial sized samples, which is an order of magnitude thinner than the layer thickness obtained by dip-coating.
2. Materials and Methods
2.1. Materials
Aminopropyltriethoxysilane (APS) and Glycidoxypropyltrimethoxysilane (GPS) were purchased from Sigma-Aldrich (St. Louis, MO, USA). The film former aqueous emulsions were supplied by Şişecam (Şişecam, Kocaeli, Turkey). FFPP was a commercially available maleated polyproylene (MPP) emulsion with 38% solids and an average molecular weight of approximately 30,000 g/mol. FFEP was a commercially available epoxy resin emulsion with 55% solids and an epoxide equivalent weight of approximately 190 mol/100 g. The fibre-coating experiments were conducted using bare (water-sized) E-glass fibres (1400 tex, nominal 17 µm diameter fibres), taken from a large roving, supplied by Şişecam. Commercial E-glass fibre products (GFPP and GFEP) sized with a proprietary polypropylene and epoxy compatible sizings (2400 tex, nominal 17 µm diameter fibres) were also supplied by Şişecam for comparison purposes.
Two sizing formulations were used for the main fraction of the work reported here. These were based on typical ingredients and solid contents of sizings commonly used for industrial sized fibres [4]. The first was a 10% solid PP compatible mixture (PP10), based on FFPP and APS. The second was a 5% solid epoxy compatible sizing (EP5), based on FFEP and GPS. The proportions of the ingredients of these two sizings are summarised in Table 1. To create 100 g of sizing PP10, 1.6 g of APS were mixed with 50 g deionized water and agitated for 10 min. Subsequently, 24.2 g of FFPP emulsion were added to the mixture, along with a further 24.2 g of deionized water. A lower solid content version (PP1) of this sizing was prepared by diluting a sample PP10 appropriately. To produce 100 g of sizing EP5, 1.0 g of GPS were mixed with 50 g deionized water and agitated for 10 min. To facilitate the hydrolysis of the GPS, a diluted acetic acid solution was used first, to adjust the pH of deionised water within the range of 5 to 5.5. Subsequently, 7.8 g of FFEP were added together with a further 41.2 g of deionized water. Sizing EP10, with a 10% solid content, was made in the same manner with the component contents adjusted accordingly.

Table 1.
Size formulations used in this work.
2.2. Methods
Thermogravimetric analysis (TGA) was used to determine the LoI of the sizing coated on to glass fibres. TGA temperature scans of the sized glass fibres were performed in an air atmosphere at a heating rate of 10 °C/min, using a TA Instruments Q50 TGA (TA Instruments, New Castle, DE, USA). The LoI value was taken as the sample weight loss, recorded at 600 °C. The fibre samples of around 5–15 mg were carefully positioned in the TGA platinum pan with fibres covering the entire surface area, ensuring good contact between the fibres and pan. The structure and morphology of sized glass fibre bundles were examined using Scanning Electron Microscopy (SEM). The analysis was conducted using a Hitachi TM3000 scanning electron microscope (Hitachi High-Tech Europe, 47807 Krefeld, Germany), with an accelerating voltage of 15.0 kV. All SEM samples were sputter-gold-coated under an Argon atmosphere. The diameter of individual fibres was determined by transverse optical microscopy measurements, using a Leitz Ergolux microscope. Images obtained at ×500 magnification were analysed using ImageJ software (version 1.54).
Dip-coating was carried out by immersing a 10 cm length of bare glass fibre bundle into a container containing 100 mL of sizing for 10 min. On removal, the bundle was allowed to drain excess sizing and then dried in an air circulating oven at 110 °C for 120 min. Spin-coating was performed using a Laurell WS-650-23B spin coater (Laurel Co Technology Limited, Beaconsfield, UK) with a disc diameter of 100 mm. A 100 mm length of the bare glass fibre roving was placed onto a plastic microscope slide. To ensure stability and prevent any separation during the process, both the bundle and the slide were securely attached to the spin coater using tape, as depicted in Figure 1. A fixed volume of 0.2 mL of sizing mixture, which proved sufficient to coat the entire bundle, was applied at the middle of the glass fibre sample. Once the machine was sealed, various spin speeds (rpm) were investigated for influence on the final LOI of the sample. After spinning for 10 s, the sized fibres were carefully detached and dried in an air-circulating oven for 120 min at a temperature of 110 °C.
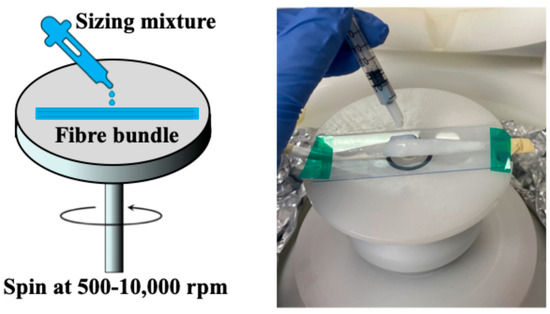
Figure 1.
Schematic and photograph of sizing being applied to a glass fibre bundle in the spin coater.
3. Results and Discussion
3.1. Polypropylene Compatible Sizing
Figure 2 compares typical TGA curves, obtained from fibres, dip-coated in sizing PP10 and PP1 at 10% and 1% solids, compared to the industrially manufactured PP compatible reference sample. Given that E-glass is thermally stable in this temperature region, it is reasonable to assume that the weight changes are caused primarily by the degradation of the organic materials in the fibre sizing layer. Average LoI values for these three samples were 11.2%, 2.3% and 0.8%, respectively. These values emphasise the comments in the Introduction that dip-coating glass fibre bundles with sizings containing a normal (for commercial glass fibre production) solid content produce unacceptably high LoI values. Moreover, even by diluting the sizing solid concentration by a factor of 10 it was still not possible to reach the lower LoI levels which are typical of industrial sized fibres. Of course, further reduction in the sizing solid content could eventually bring the dip-coated samples’ LoI into an acceptable (<1%) LoI range. However, it is well known that the nature of the chemical reactions and interactions taking place in these complex mixtures of reactive chemicals is very likely to be concentration-dependent. This is certainly well-documented for solutions containing silanes [3,5,19,20,21,22,23,24]. Consequently, it is extremely questionable as to whether the use of such dilute sizing solutions would in any way result in a sample which is representative of an industrially manufactured sample, using the same sizing ingredients. In other words, dip-coating does not appear to be a useful technique to screen sizing formulations or to carry our more fundamental studies of the influence of sizing formulation on fibre–polymer adhesion.
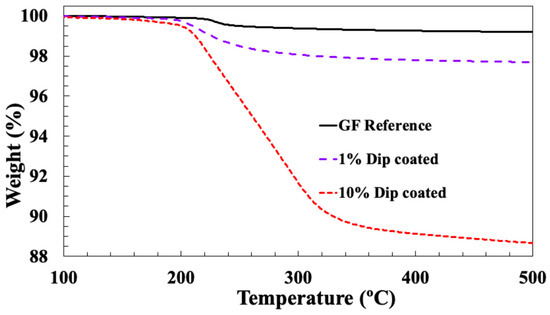
Figure 2.
TGA results for reference glass fibre and fibres dip-coated in PP10 size.
Table 2 summarises the TGA-obtained LoI values for the glass fibre sample laboratory, spin-coated with sizing PP10, at 10% solid sizing, spun at different speeds. LoI values for the dip-coated fibres and the industrially sized PP compatible reference fibres are also included. The average LoI values are plotted in Figure 3. It can be observed that the spin-coated fibres exhibit a much lower LoI compared with the dip-coated fibres, and the LoI approaches that of the industry-sized fibres when the spin speed is increased. It appears from these results that it is possible to easily select the final LoI (or average sizing layer thickness) obtained by a simple adjustment of the spin-coating speed. In order to evaluate the consistency of the sizing coating along a spin-coated fibre bundle, TGA samples were selected from the middle and both ends of a 10 cm fibre bundle spin-coated with sizing PP10 at 10,000 rpm and tested using TGA. Figure 4 shows the TGA results for these three samples. The curves for all three samples appear to be very similar. The sizing on all samples exhibits a similar thermal degradation process within the temperature range of 200–300 °C. The final LoI of all three samples can also be considered equal within acceptable experimental error. Hence, the spin-coating method appears to produce a relatively consistent sizing layer along the full length of the 10 cm fibre bundle sample.
Table 2.
Glass fibre sizing LoI obtained by TGA.
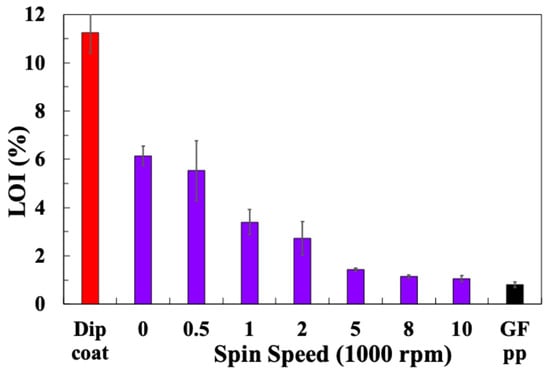
Figure 3.
Loss in ignition results for glass fibres spin-coated with PP10 at different speeds.
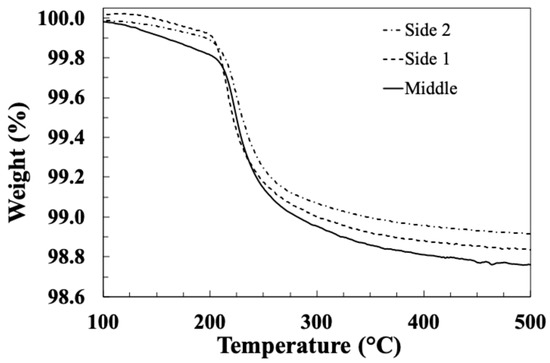
Figure 4.
TGA results for samples taken at different positions along a spin-coated fibre bundle.
Figure 5 and Figure 6 present typical results for weight loss (TGA) and differential weight loss (DTG) of these fibre samples. It is clear that there are major differences in the TGA results, depending on the sizing technique and on the spin coating speed. Upon examining the TGA and DTG graphs, a distinct change in the curves becomes evident when the spin-coating speed is increased above 500 rpm. It can be seen in Figure 5 that the main sizing degradation weight loss is observed in the temperature range of 200–350 °C. However, for spin speeds higher than 500 rpm, the width of the degradation temperature range appears to be smaller. This can be seen more clearly in the DTG curves (Figure 6), which appear to exhibit two overlapping thermal degradation events: a “low temperature” event peaking around 220–230 °C and a “high temperature” event peaking around 280–300 °C. It appears that once the spin-coating speed exceeds 500 rpm, the sizing component responsible for the high temperature degradation event is reduced and eventually removed. Unfortunately, the lack of available information regarding the exact formulation of the commercial film former emulsion used by the sponsor precludes any detailed discussion of which component may be preferentially lost during the higher speed spin-coating adhesion.
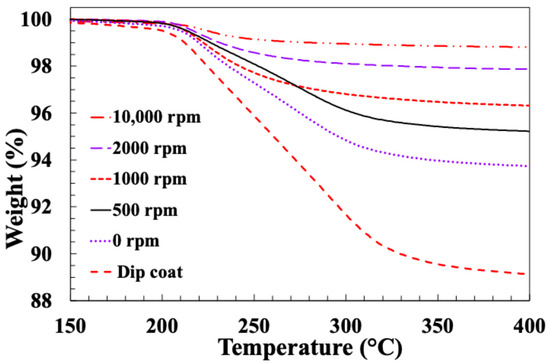
Figure 5.
TGA results for glass fibres spin-coated with PP10 at different speeds.
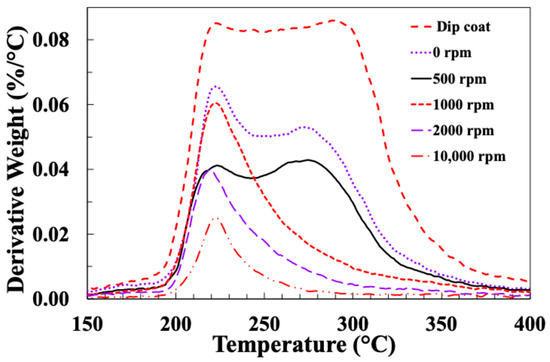
Figure 6.
DTG results for glass fibres spin-coated with PP10 at different speeds.
Figure 7 compares TGA and DTG results for both the commercial PP compatible reference fibre GFPP and the bare glass fibre spin-coated with sizing PP10 at a speed of 10,000 rpm. Both these fibre samples exhibit a single major weight loss event in the temperature range 200–300 °C, and the curves follow a very similar pattern. The peak in the differential mass change data occurs around 225 °C, signifying the maximum rate of weight change. Thomason et al. investigated the thermal degradation of the sizings on a range of industrial coated PP compatible glass fibre products in air. They reported that the majority of the weight loss was between 200 and 300 °C, which appeared to be due to degradation of the MPP film former and the aminosilane coupling agent [25]. Given that the exact formulation of the sizing on the industrial reference sample is unknown and that the exact composition of the film former emulsions used in this work are also unknown due to industrial confidentiality, then the similarity in these results is notable. In a published review of industrial sizing formulation patents, Thomason also noted that the same two main constituents of PP compatible sizings from different fibre manufacturers do consistently appear to be MPP and APS [4].
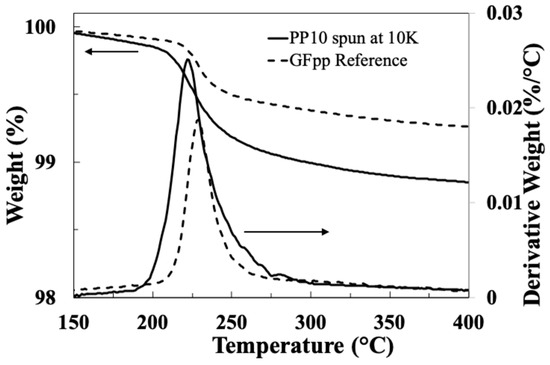
Figure 7.
Comparison of TGA and DTG results for GFPP reference and PP10 spin-coated glass fibre (arrows indicate appropriate y-axis).
Figure 8 presents SEM images of the sized glass fibre bundles where the effects of the sizing structure on the fibre surface of the different coating methods are compared. In Figure 8a, the PP10 dip-coated fibre bundle is heavily covered with sizing, rendering the fibres poorly visible, as they are fully coated with a high thickness of size. More fibres are visible in the PP1 dip-coated bundle in Figure 8b, which is clearly related to the lower thickness of the size deposit. However, there is still a thick sizing coverage visible on some parts of the bundle. The micrographs in Figure 8c,d show that the PP10 spin-coated and the commercial reference fibre bundles exhibit a similar sizing distribution pattern, with less sizing coverage in the bundle and little sign of any thick areas of sizing connecting the individual fibres’ adhesion.
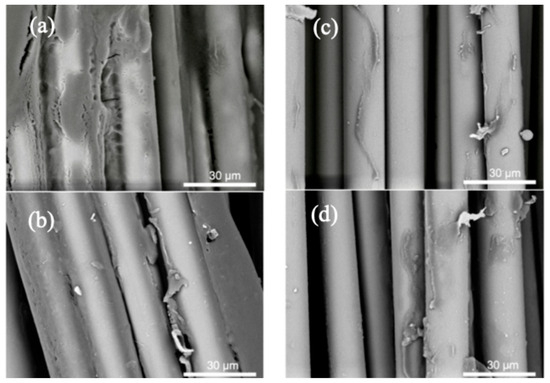
Figure 8.
SEM micrographs of glass fibre bundles: (a) PP10 dip-coated, (b) PP1 dip-coated, (c) PP10 spin-coated at 10,000 rpm and (d) GFPP reference.
3.2. Epoxy Compatible Sizing
Figure 9 compares typical TGA curves obtained from fibres dip-coated in sizing EP10 and EP5 at 10% and 5% solids, with an EP5 sample spin-coated at 10,000 rpm and the industrially manufactured EP compatible reference sample. The LoI values obtained from these results were 8.4%, 4.7%, 0.6% and 0.3%, respectively. These results for epoxy compatible sizing support the results obtained with the PP compatible sizing, which indicated that dip-coating with sizings of a normal industrial solid content produces sized fibres with average LoI values that are approximately one order of magnitude higher than the LoI on commercially produced glass fibres. In contrast to this, spin coating with the same sizing provides a method to obtain glass fibres samples with the same order of magnitude of LoI as commercial samples. Indeed, in this case, the 10,000 rpm sample achieved an LoI even lower than the industrial reference sample. These results emphasise the comments in the Introduction that dip-coating glass fibre bundles with sizings containing a normal (for commercial production) solid content produces unacceptably high LoI values. The effect of spin speed on the average LoI values obtained by TGA for the EP5 spin-coated samples are plotted in Figure 10. The results show again that it is relatively simple to dial in the desired sample LoI, just by adjusting the speed of the spin coater.
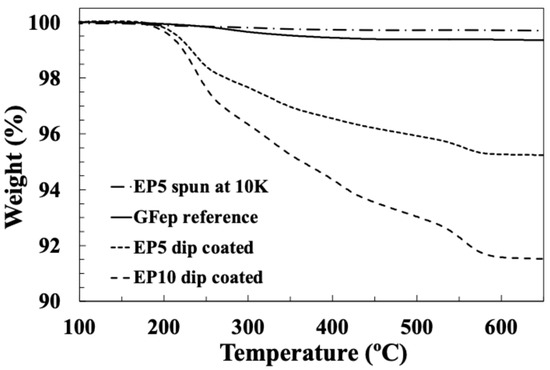
Figure 9.
TGA results for reference glass fibre, fibres dip-coated in EP5 and EP10 size and fibre spin-coated in EP5 size.
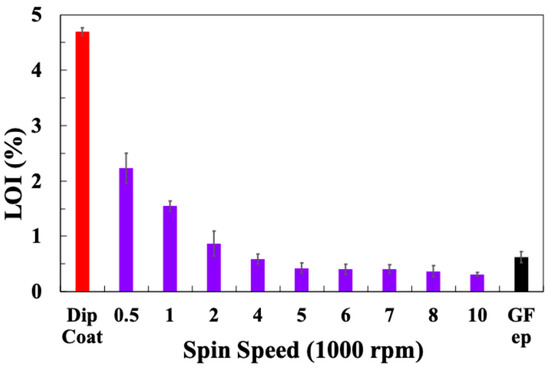
Figure 10.
Loss on ignition results for glass fibres spin-coated with EP5 at different speeds.
Figure 11 and Figure 12 present typical results for weight loss and differential weight loss of these fibre samples spin-coated with sizing EP5 at different speeds.
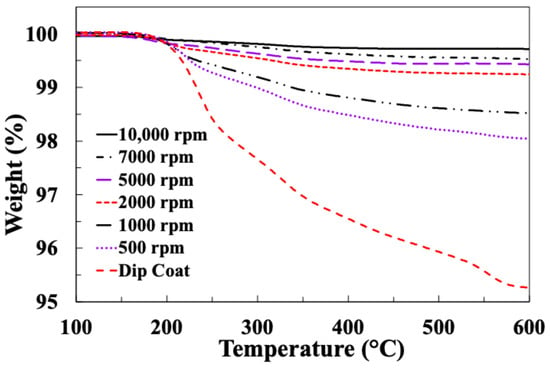
Figure 11.
TGA results for glass fibres spin-coated with EP5 at different speeds.
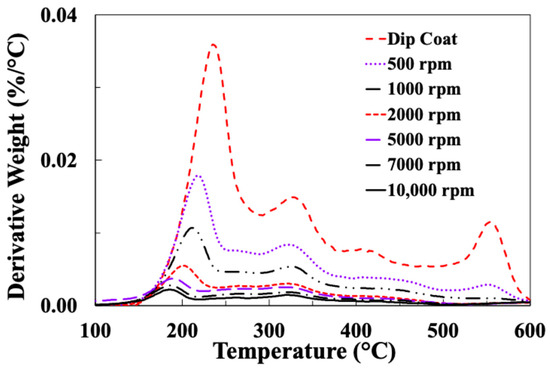
Figure 12.
DTG results for glass fibres spin-coated with EP5 at different speeds.
It can be seen in Figure 11 that more than 80% of the EP sizing layer is thermally removed in the temperature range 200–400 °C. This is associated with two clear peaks at around 200 C and 350 °C in the DTG curves in Figure 12. The DTG curves in Figure 12 also reveal a somewhat more complex thermal degradation pattern for the EP compatible sizing in comparison to the PP sizing curves in Figure 6. Two further peaks are observed at about 450 °C and 550 °C in the DTG curves of most EP5-coated samples.
The temperatures of the peak maxima for these four DTG peaks (P1–P4) are summarised in Table 3. Some interesting observations can be made about these results. The temperature of peak P1 appears to be LoI-dependent; this can be seen clearly in Figure 13, which plots the temperature of P1 versus the sample LoI. However, peaks P2 and P3 do not exhibit any significant LoI dependence. Peak P4 is strongly present in the dip-coated sample DTG curve, but reduces in intensity rapidly as spin speed is increased and does not appear in the DTG curves of any of the samples spun at speeds higher than 1000 rpm. Despite the greater complexity of the EP sizing layer of DTG curves, this disappearance of the highest temperature peak would appear to correlate with the observation of the higher peak in Figure 6 for the DTG of the PP sized fibres disappearing at higher spin coating speeds.
Table 3.
Temperatures of DTG peaks of EP5 sized glass fibres.
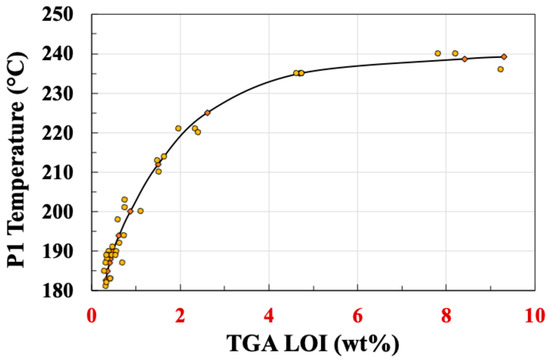
Figure 13.
Dependence of TGA peak 1 of EP5 sized fibres on samples loss on ignition.
Figure 14 compares TGA and DTG results for both the commercial EP compatible reference fibre GFEP and the bare glass fibre spin-coated with sizing EP5, at a speed of 5000 rpm. Although the TGA results show a similar LoI from these two samples, there is less similarity observed in the DTG curves in comparison with the PP compatible fibres in Figure 7. Both samples appear to show the presence of peaks P1–3, although their relative intensities are clearly different. As mentioned above, peak P4 is also missing from both curves. Both Thomason et al. and Petersen et al. have published data on the thermal degradation of the sizing on commercial epoxy compatible glass fibres from different manufacturers [25,26,27]. In both cases, they observed DTG peaks at around 310 °C and 440 °C, which would correspond with peaks P2 and P3 in this work. Given that the actual chemical composition of the sizings on commercial glass fibres are unknown, due to industrial secrecy, some differences might be expected due to potentially different sizing formulations being used by different producers. Thomason has reviewed the sizing formulations found in the patent literature of various glass fibre manufacturers [4]. It was observed that epoxy compatible sizings normally contain GPS and some form of epoxy–resin emulsion. However, these sizings may also contain other silanes, lubricants, antistatic agents and high levels of emulsification agents (many of the epoxy–resin emulsions contained up to 18% by weight of these).
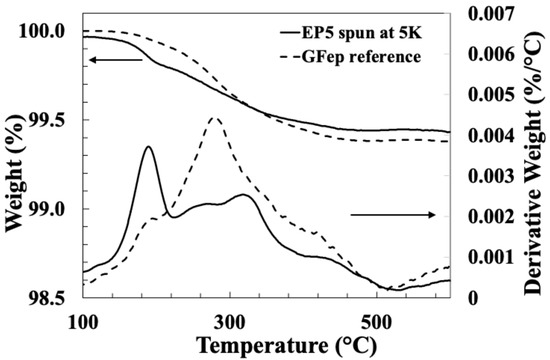
Figure 14.
Comparison of TGA and DTG results for GFEP reference and EP5 spin-coated glass fibre.
3.3. Sizing Layer Thickness
Nowadays, the spin coating method is well-known and extensively employed for applying thin uniform polymeric coatings, with thicknesses in the sub-micrometre range, onto flat substrates. In spite of this widespread use of spin coating in thin film preparation, to the best of our knowledge, no one has used this technique for the sizing of glass fibre samples. However, the relationships between spin coating conditions and the final thickness of the film obtained on a flat substrate has been extensively studied and modelled. Final film thickness has typically been correlated to the spinning angular velocity and the coating solution properties [28,29]. An experimental correlation between film thickness (T) and process parameters has been widely observed and can be described by the following mathematical relationship:
where V is the angular spin velocity, while k and a are empirically determined constants. The exponent a has been observed to change only slightly, in the range of −0.4 to −0.67, for various polymer/solvent systems, and has been set by most workers in the close vicinity of −0.5 [30,31,32,33]. Meyerhofer developed a more theoretical model of the relationship and predicted a calculated value for a of −0.67 [34].
It is of interest to examine whether, despite the large difference in the substrate geometry investigated in this work (a bundle of parallel cylinders instead of a flat substrate), the well-documented relationship of Equation (1) also holds. The sizing layer thickness can be easily estimated from the sample LoI. Assuming that the size is uniformly coated around each fibre in the sample bundle as a layer of thickness (T), then, from simple geometrical considerations, the sizing layer thickness is given by the following:
where X is the fractional LoI, D is the average fibre diameter, ρf is the density of the fibre and ρs is the density of the sizing. Figure 15 shows the diameter distribution obtained from the measurement of 450 individual fibres and gives an average fibre diameter of 17.1 µm (with 95% confidence limit of 0.13 µm). Average sizing layer thicknesses were calculated using this value for the fibre diameter, along with an E-glass fibre density of 2550 kg/m3 and density values of polypropylene and unreacted epoxy resin (910 kg/m3 and 1150 kg/m3) for the sizing layer density. The results presented in Table 4 indicate that the sizing layer thickness on the commercial fibres is in the range of 60–100 µm. In comparison, dip-coated fibres have a sizing layer thickness that is one to two orders of magnitude greater. However, by using spin coating, it is possible to reach the same, or even a lower, sizing layer thickness as commercial fibres.
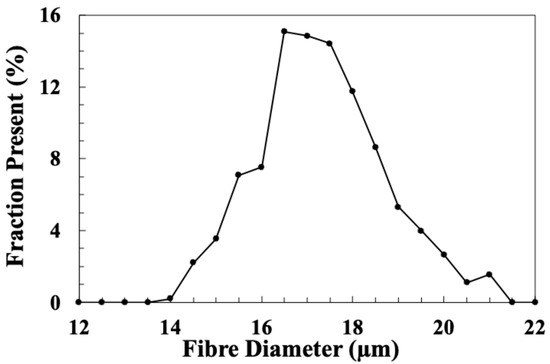
Figure 15.
Diameter distribution of the glass fibres used in these spin coating experiments.
Table 4.
Sizing layer thickness calculated from LoI values.
Figure 16 presents a logarithmic plot of sizing layer thickness against spin coating velocity. It can be seen that both data sets show a strong correlation between these two parameters. A best-fit line for the PP10 sizing data has a slope of −0.55 and for the EP5 sizing layer it is −0.67. Both values lie in the above referenced range observed by other researchers when coating polymer solutions onto flat substrates. These results would appear to indicate that it is now perfectly possible for researchers to easily control the thickness of a sizing layer on small bundles of glass fibre using the spin coating method. This should enable a much more systematic investigation of the micromechanical effects of size layer thickness and composition on the fibre–matrix interface than was previously possible when using dip-coating techniques for sample preparation.
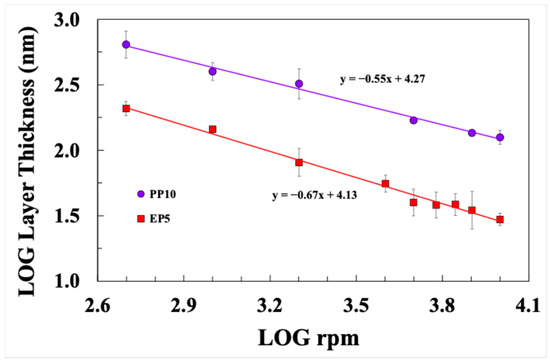
Figure 16.
Dependence of size layer thickness on spin coating speed.
4. Conclusions
The original and novel use of spin coating to apply a well-controlled thickness sizing layer to the fibres in a bare glass fibre roving has been investigated. This was deemed worthy of investigation as it was shown that the size layer obtained by the conventional dip-coating method was two orders of magnitude thicker than that produced on industrial reference samples. To the best of our knowledge, no other researchers have published results on the use of spin-coating for glass fibre sizing applications. The results presented here demonstrate that it is perfectly possible to prepare small samples of sized glass fibre, suitable for micro-mechanical fibre and interface measurements, using the commonly available laboratory-based spin-coating method. When compared with industrially produced products with a size layer thickness in the range of 0.06–0.10 µm, glass fibre rovings sized by spin-coating could be obtained with a size layer thickness of the same order of magnitude. Moreover, the spin-coating method offered the advantage of simple and accurate control of the glass fibre sample sizing application with a layer thickness range of 0.05–0.6 µm. Use of this spin-coating sample preparation method should enable well-defined exploration of the effects of different sizing layer compositions and thicknesses.
It was also observed that, in contrast to dip-coated fibres, the TGA fingerprint of the thermal degradation profile of the spin-coated sizing layer was very comparable with that of industrially produced reference fibre samples. Furthermore, it was shown that the relationship between the average size layer thickness on spin-coated fibres and the spin-coating speed followed a similar power–law relationship, as has been frequently documented for the thickness of spin-coated films on flat substrates. Compared to the commonly employed dip-coating method, this novel application of the spin-coating method holds the promise of improved research sample preparation, as it eliminates the need to alter the concentration of the sizing formulations to unacceptably low levels to obtain normal size layer thicknesses.
Author Contributions
Conceptualization, J.L.T. and L.Y.; methodology, J.L.T., R.A. and L.Y.; validation, J.L.T., R.A. and L.Y.; formal analysis, J.L.T.; investigation, R.A.; data curation, J.L.T. and R.A.; writing—original draft preparation, J.L.T.; writing—review and editing, J.L.T.; visualisation, J.L.T.; supervision, J.L.T. and L.Y.; project administration, L.Y.; funding acquisition, J.L.T. and L.Y. All authors have read and agreed to the published version of the manuscript.
Funding
The authors would like to extend thanks to the Şişecam company and the University of Strathclyde (ISP fund) as the funding sponsors of this project.
Institutional Review Board Statement
Not applicable.
Informed Consent Statement
Not applicable.
Data Availability Statement
Data will be made available on request.
Acknowledgments
The authors declare that no use was made of any generative AI or AI-assisted technologies during the preparation of this manuscript.
Conflicts of Interest
The funders had no role in the design of the study; in the collection, analyses, or interpretation of data; in the writing of the manuscript; or in the decision to publish the results.
References
- Zu, Q.; Solvang, M.; Li, H. Commercial glass fibers. In Fiberglass Science and Technology: Chemistry, Characterization, Processing, Modeling, Application, and Sustainability; Li, H., Ed.; Springer Nature: Cham, Switzerland, 2021; pp. 1–87. [Google Scholar]
- Loewenstein, K.L. Glass science and technology 6. In The Manufacturing Technology of Continuous Glass Fibres; Elsevier: Amsterdam, The Netherlands, 1993. [Google Scholar]
- Thomason, J.L. Glass Fibre Sizing: A Review of the Literature. Blurb Incorporated 2015. Available online: http://www.blurb.co.uk/b/6244677-glass-fibre-sizing (accessed on 15 January 2024).
- Thomason, J.L. Glass Fibre Sizing: A Review of Size Formulation Patents. Blurb Incorporated 2015. Available online: http://www.blurb.co.uk/b/6244662-glass-fibre-sizing (accessed on 15 January 2024).
- Thomason, J.L. Glass fibre sizing: A review. Compos. Part A Appl. Sci. Manuf. 2019, 127, 105619. [Google Scholar] [CrossRef]
- Thomason, J.L. A review of the analysis and characterisation of polymeric glass fibre sizings. Polym. Test. 2020, 85, 106421. [Google Scholar] [CrossRef]
- Thomason, J.L. Glass fibre sizings and the composites industry: The current state of play. In Proceedings of the Aachen Reinforced: Glass & Carbon Fibres, Aachen, German, 10–11 May 2021. [Google Scholar]
- Hassett, S. This One Problem Stifles Innovation at Big Companies. Forbes.com 24 March 2020. Available online: https://www.forbes.com/sites/forbestechcouncil/2020/03/24/this-one-problem-stifles-innovation-at-big-companies/ (accessed on 3 February 2025).
- Christensen, C.M. Exploring the limits of the technology S-curve. Part I: Component technologies. Prod. Oper. Manag. 1992, 1, 334–357. [Google Scholar] [CrossRef]
- Mapleston, P. Reinforcing options for compounders. Compd. World October. 2018, pp. 80–84. Available online: https://content.yudu.com/web/1rl19/0A1rl2p/CWOct18/html/index.html?page=78&origin=reader (accessed on 27 August 2025).
- Shockley, W.B. Secrecy and Science, a Survey of the Extent to Which Restrictions on the Free Exchange of Information Have Impeded Scientific Development and Progress; US Government Printing Office: Washington, DC, USA, 1959; p. 29. [Google Scholar]
- Takalo, T.; Kanniainen, V. Do patents slow down technological progress? Real options in research, patenting, and market introduction. Int. J Ind. Organ. 2000, 18, 1105–1127. [Google Scholar] [CrossRef]
- Evans, J.A. Industry collaboration, scientific sharing, and the dissemination of knowledge. Soc. Stud. Sci. 2010, 40, 757–791. [Google Scholar] [CrossRef]
- Thomason, J.L.; Akrami, R.; Yang, L. A New Method to Prepare More Representative Coated Glass Fibres for Screening and Development of Sizings at the Laboratory Scale. In Proceedings of the 21st European Conference on Composite Materials, Nantes, France, 2–5 July 2024; Available online: https://sdrive.cnrs.fr/s/Hsy686dM2S6fYGw (accessed on 12 February 2025).
- Birnie, D.P., III. Spin coating: Art and science. In Chemical Solution Deposition of Functional Oxide Thin Films; Schneller, T., Waser, R., Kosec, M., Payne, D., Eds.; Springer: Vienna, Austria, 2013; pp. 263–274. [Google Scholar] [CrossRef]
- Ren, Z. Spin-coating. In Solution-Processed Organic Light-Emitting Devices; Xie, G., Ed.; Woodhead Publishing: Kidlington, UK, 2024; pp. 17–35. [Google Scholar] [CrossRef]
- Shaban, M.; Mohamed, F.; Abdallah, S. Production and characterization of superhydrophobic and antibacterial coated fabrics utilizing ZnO nanocatalyst. Sci. Rep. 2018, 8, 3925. [Google Scholar] [CrossRef]
- Dissanayake, N.; Abeysundara, S.; Wanasekara, N.D. Investigating the feasibility of applying spin coating method for textiles. In Proceedings of the 2020 Moratuwa Engineering Research Conference (MERCon), Moratuwa, Sri Lanka, 27–29 July 2020; IEEE: Piscataway, NJ, USA, 2020; pp. 448–452. [Google Scholar]
- Ishida, H.; Chiang, C.H.; Koenig, J.L. The structure of aminofunctional silane coupling agents: 1. γ-Aminopropyltriethoxysilane and its analogues. Polymer 1982, 23, 251–257. [Google Scholar] [CrossRef]
- Koenig, J.L.; Emadipour, H. Mechanical characterization of the interfacial strength of glass-reinforced composites. Polym. Compos. 1985, 6, 142–150. [Google Scholar] [CrossRef]
- Yue, C.Y.; Quek, M.Y. The interfacial properties of fibrous composites: Part III Effect of the thickness of the silane coupling agent. J. Mat. Sci. 1994, 29, 2487–2490. [Google Scholar] [CrossRef]
- Kim, J.K.; Sham, M.L.; Wu, J. Nanoscale characterisation of interphase in silane treated glass fibre composites. Compos. Part A Appl. Sci. Manuf. 2001, 32, 607–618. [Google Scholar] [CrossRef]
- Thomason, J.L.; Adzima, L.J. Sizing up the interphase: An insider’s guide to the science of sizing. Compos. Part A Appl. Sci. Manuf. 2001, 32, 313–321. [Google Scholar] [CrossRef]
- Sever, K.; Sarikanat, M.; Seki, Y.; Tavman, I.H. Concentration effect of glycidoxypropyltrimethoxysilane on the mechanical properties of glass fiber-epoxy composites. Polym. Compos. 2009, 30, 1251–1257. [Google Scholar] [CrossRef]
- Thomason, J.L.; Nagel, U.; Yang, L.; Bryce, D. A study of the thermal degradation of glass fibre sizings at composite processing temperatures. Compos. Part A Appl. Sci. Manuf. 2019, 121, 56–63. [Google Scholar] [CrossRef]
- Petersen, H.N.; Kusano, Y.; Brøndsted, P.; Almdal, K.K. Analysis of glass fibre sizing. In Proceedings of the 28th International Conference on Surface Modification Technologies, Tampere, Finland, 16–18 June 2014. [Google Scholar]
- Petersen, H.N. Investigation of Sizing—From Glass Fibre Surface to Composite Interface. Ph.D. Thesis, Technical University of Denmark, Kongens Lyngby, Denmark, 2017. [Google Scholar]
- Lawrence, C.J. The mechanics of spin coating of polymer films. Phys. Fluids 1988, 31, 2786–2795. [Google Scholar] [CrossRef]
- Norrman, K.; Ghanbari-Siahkali, A.; Larsen, N.B. Studies of spin-coated polymer films. Annu. Rep. Prog. Chem. Sect. C 2005, 101, 174–201. [Google Scholar] [CrossRef]
- Lai, J.H. An investigation of spin coating of electron resists. Polym. Eng. Sci. 1979, 19, 1117–1121. [Google Scholar] [CrossRef]
- Chen, B.T. Investigation of the solvent-evaporation effect on spin coating of thin films. Polym. Eng. Sci. 1983, 2, 399–403. [Google Scholar] [CrossRef]
- Spangler, L.L.; Torkelson, J.M.; Royal, J.D.S. Influence of solvent and molecular weight on thickness and surface topography of spin-coated polymer films. Polym. Eng. Sci. 1990, 30, 644–653. [Google Scholar] [CrossRef]
- Sukanek, P.C. Dependence of film thickness on speed in spin coating. J. Electrochem. Soc. 1991, 138, 1712. [Google Scholar] [CrossRef]
- Meyerhofer, D. Characteristics of resist films produced by spinning. J. Appl. Phys. 1978, 49, 3993–3997. [Google Scholar] [CrossRef]


Disclaimer/Publisher’s Note: The statements, opinions and data contained in all publications are solely those of the individual author(s) and contributor(s) and not of MDPI and/or the editor(s). MDPI and/or the editor(s) disclaim responsibility for any injury to people or property resulting from any ideas, methods, instructions or products referred to in the content. |
© 2025 by the authors. Licensee MDPI, Basel, Switzerland. This article is an open access article distributed under the terms and conditions of the Creative Commons Attribution (CC BY) license (https://creativecommons.org/licenses/by/4.0/).