Abstract
Raman spectroscopy is a rapid, label-free, and non-destructive technique for probing molecular structures, making it a powerful tool for clinical pathogen identification. However, interpreting its complex spectral data remains challenging. In this study, we evaluate and compare a suite of machine learning models—including Support Vector Machines (SVM), XGBoost, LightGBM, Random Forests, k-nearest Neighbors (k-NN), Convolutional Neural Networks (CNNs), and fully connected Neural Networks—with and without Principal Component Analysis (PCA) for dimensionality reduction. Using Raman spectral data from 30 clinically important bacterial and fungal species that collectively account for over 90% of human infections in hospital settings, we conducted rigorous hyperparameter tuning and assessed model performance based on accuracy, precision, recall, and F1-score. The SVM with an RBF kernel combined with PCA emerged as the top-performing model, achieving the highest accuracy (0.9454) and F1-score (0.9454). Ensemble methods such as LightGBM and XGBoost also demonstrated strong performance, while CNNs provided competitive results among deep learning approaches. Importantly, interpretability was achieved via SHAP (Shapley Additive exPlanations), which identified class-specific Raman wavenumber regions critical to prediction. These interpretable insights, combined with strong classification performance, underscore the potential of explainable AI-driven Raman analysis to accelerate clinical microbiology diagnostics, optimize antimicrobial therapy, and improve patient outcomes.
1. Introduction
The escalating threat of antimicrobial resistance has sharpened the clinical imperative for rapid and accurate pathogen identification. However, regular diagnostic approaches remain dominated by culture-based workflows that, although familiar and widely accessible, require a notable amount of time to both yield bacterial cultures and isolate single bacterial colonies. Most bacterial identifications to the species level are still based on enzymatic reactions, which are time-consuming to accomplish and interpret, even when using automated ID platforms. Moreover, occasionally, bacterial overlapping metabolic repertoires limit species-level discrimination, leading to misidentification or failure to classify accurately. In addition to enzymatic methods, modern techniques such as FTIR spectroscopy are increasingly employed for microbial identification. Recent studies highlight its effectiveness in clinical and environmental microbiology [1,2].
In terms of bacterial growth in cultures, isolation and identification, the time intervals from sample collection to a species call vary significantly, ranging from 1.81 days for blood cultures to 2 days for routine urine cultures and more than 3.5 days for respiratory infections. Of note, it is challenging to isolate bacteria such as anaerobes and may require more than 4 days of incubation and identification [3,4]. Moreover, phenotypic and enzymatic identification methods remain imperfect, often achieving only around 90–94% concordance at the species level, which may lead to misidentification or failure to classify 1–4% of clinical isolates, particularly in the case of fastidious or atypical organisms [5,6]. In all cases, an additional day is usually required to evaluate the antimicrobial resistance patterns of the isolated species. Inevitably, the above conditions prompt clinicians to meet the diagnostic timelines using broad-spectrum antimicrobials, a practice that significantly compromises patient outcomes due to potential ineffectiveness [7,8] and the gradual development of antimicrobial resistance levels.
The recognized need to reduce identification time triggered intensive global efforts to develop culture-independent diagnostic assays. Among others, single-cell Raman spectroscopy—often coupled with surface-engineered SERS substrates—has recently drawn considerable attention and is currently listed as one of the most promising culture-independent assays. The bacterial identification process using Raman is primarily based on creating unique biochemical fingerprints and can be deployed either directly on clinical specimens (such as blood, urine, or sputum) or on culture-derived material, with the choice balancing the required detection limit, turnaround time, and matrix complexity [9,10,11,12,13]. The assay could roughly be divided into two phases; the first phase entails ultrafast Raman spectral acquisition—1–100 ms shots on – cells with a 532–785 nm laser—while the latter employs machine-learning algorithms to interpret the processed spectra and correctly classify the bacterium at the species level. To date, the method has yielded successful bacterial identification at >90% of common pathogens at the species level, while the overall assay is regularly completed in under five minutes—a 20-fold compression of the traditional timeline [14,15,16].
Despite its rapid development and maturation, the widespread clinical adoption of Raman assays remains elusive due to a confluence of technical, computational, and regulatory limitations. Technically, the intrinsically weak Raman scattering of bacterial cells necessitates SERS substrates whose batch-to-batch and even intra-chip variability undermines spectral consistency [17]. At the same time, the high instrument and consumable costs remain a limitation, restricting deployment in lower-throughput settings. From a machine-learning standpoint, the principal obstacles involve data scarcity, domain shift, model opacity, and the absence of harmonized validation standards [18,19]. The recently adopted state-of-the-art classifiers (random forests, convolutional neural networks, and transformer architectures) demand thousands of balanced spectra per species. However, repositories such as Bacteria-ID still suffer from an accuracy loss when models encounter spectra from different instruments or growth media, revealing acute sensitivity to class-imbalance bias and instrument-specific artifacts. Also, domain-adaptation strategies—wavelength warping, piece-wise direct standardization, and calibration-transfer schemes—have not attained the ±2% error margin acceptable in clinical chemistry; broadly, this is because Raman substrates introduce complex, nonlinear variance that resists simple parameterization [20,21,22].
To overcome the limitations inherent in current machine learning (ML) approaches to bacterial identification, recent studies have introduced a range of innovative methodologies. A seminal contribution by Chi-Sing Ho et al. (2019) [14] demonstrated the transformative potential of integrating Raman spectroscopy with deep learning to enable rapid, label-free, and culture-independent identification of pathogenic bacteria, as well as antibiotic susceptibility profiling. Their work highlighted the efficacy of convolutional neural networks (CNNs) in accurately classifying bacterial species, even from low signal-to-noise spectra, and in distinguishing between methicillin-resistant and susceptible Staphylococcus aureus (MRSA/MSSA), thereby laying the groundwork for point-of-care, real-time diagnostic applications. Building upon this foundation, Sun et al. (2024) [23] proposed RamanCluster, a deep clustering-based framework capable of unsupervised classification of bacterial Raman spectra without reliance on annotated training data, rendering it particularly suitable for label-free applications. In parallel, Jeon et al. (2025) [24] demonstrated that the integration of advanced ML algorithms with optimized data preprocessing techniques, in conjunction with a hydrophobic surface-enhanced Raman scattering platform, can achieve near-perfect sensitivity in bacterial identification.
In light of recent advances in Raman-based microbial diagnostics, this study seeks to contribute further to the field by addressing both predictive performance and interpretability. The primary objective was to systematically evaluate and compare the performance of a diverse set of machine learning and deep learning models in classifying clinically relevant microbial species using Raman spectroscopy data. The analysis was structured around three biologically distinct classification tasks: (i) broad-spectrum multiclass identification of 30 bacterial and fungal taxa; (ii) group-level classification of Gram-positive versus Gram-negative bacteria; (iii) binary discrimination between Candida albicans and Candida glabrata.
In addition to performance benchmarking, the study aimed to develop and validate a reproducible analytical pipeline that integrates spectral preprocessing, deep learning-based classification, and post hoc explainability analysis. By applying SHAP (Shapley Additive exPlanations) directly on the Raman spectral domain, the framework enabled the identification of specific wavenumber regions most relevant to microbial discrimination. This combined focus on predictive accuracy and model interpretability was designed to enhance biological insight and support the clinical feasibility, transparency, and regulatory alignment of Raman-based AI tools for diagnostic microbiology.
The overarching goal is to establish a robust and interpretable Raman–AI pipeline that advances microbial diagnostics for human health applications.
2. Materials and Methods
2.1. Dataset
All Raman spectra analyzed in this study were sourced from the publicly available dataset constructed by Ho et al. (2019) [14], which contained 60,000 spectra acquired from in vitro cultured isolates of 30 clinically relevant bacterial and fungal species. The isolates were obtained from the American Type Culture Collection (ATCC) and the Stanford Clinical Microbiology Laboratory. Spectra were collected at three biologically distinct time points for each isolate to account for intra-species variability and to ensure robustness in spectral representation.
The selection of microbial species was based on their clinical prevalence, covering approximately 94% of all bacterial infections—spanning respiratory, urinary, bloodstream, and wound-related cases—treated at Stanford Hospital between 2016 and 2017. The panel also reflected pathogens commonly encountered in intensive care settings worldwide, thus enhancing the clinical relevance and generalizability of the dataset. Included organisms comprised Gram-positive cocci such as Staphylococcus aureus (both MRSA and MSSA), Streptococcus species (Groups A, B, C, and G), and Enterococcus faecalis/faecium, as well as Gram-negative rods including Escherichia coli, Klebsiella pneumoniae, Pseudomonas aeruginosa, Proteus mirabilis, and Serratia marcescens. Opportunistic pathogens like Enterobacter cloacae were also present. Additionally, two fungal species—Candida albicans and Candida glabrata—were included to address the diagnostic challenge of invasive candidiasis in critically ill patients (Table 1 and Figure 1).

Table 1.
The list of 30 bacterial and yeast isolates.
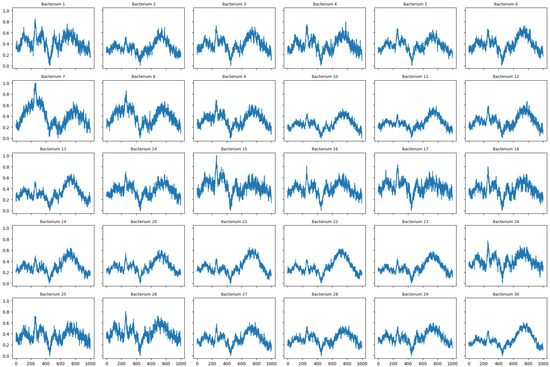
Figure 1.
Reference Raman spectra of 30 bacterial species. Each spectrum corresponds to a different bacterium. The x-axis represents the Raman shift (wavenumber, ) and the y-axis the relative intensity.
This dataset provided a high level of biological diversity and diagnostic coverage, supporting the training and evaluation of machine-learning models for Raman-based microbial classification.
2.2. Methodological Pipeline
2.2.1. Feature Preprocessing
The first stage of the methodological pipeline involved preprocessing raw Raman spectral data to standardize input vectors, reduce dimensionality, and prepare the data for machine learning analysis. Each spectrum contained 1000 intensity values, each corresponding to a specific Raman shift (wavenumber). L2 normalization—a preprocessing technique used to scale feature vectors so that their total norm equals 1—was applied to every spectrum to scale each feature vector to the unit Euclidean norm. This normalization helped mitigate the influence of variability in laser power, sample concentration, and instrumental drift while also improving training stability for algorithms sensitive to input scale or geometric distance metrics, such as neural networks and k-nearest neighbors (k-NN). In Table 2, we present a comparative summary of the models used in this study, highlighting their input types and key characteristics.
Table 2.
Comparison of machine learning models for Raman-based bacterial classification.
Following normalization, Principal Component Analysis (PCA) was used to reduce the dimensionality of the data while preserving the variance structure most relevant to class differentiation. PCA transformed the original, highly correlated features into a set of orthogonal components, thus addressing multicollinearity and reducing noise. Each spectrum was projected onto the first 25 principal components, which retained the majority of the meaningful spectral variance while significantly lowering the risk of overfitting and computational cost. The number of components was selected based on the explained variance ratio, ensuring a balance between model expressiveness and efficiency.
The PCA-transformed data were used with classical machine learning algorithms, including k-NN, support vector machines (SVM), decision trees (DT), random forests (RF), LightGBM, XGBoost, and fully connected neural networks (NN). In parallel, convolutional neural networks (CNNs), along with tree-based ensemble methods such as XGBoost and LightGBM, were trained directly on the original high-dimensional spectra without prior dimensionality reduction. This dual-input strategy reflected the ability of deep and tree-based models to extract nonlinear and hierarchical features from raw input while allowing for interpretable comparisons with PCA-based models.
2.2.2. Model Training and Evaluation
In the second stage of the pipeline, all models were trained and evaluated using a 10-fold stratified cross-validation framework to ensure robust and unbiased performance estimation. The dataset was randomly shuffled and split into 10 non-overlapping folds, each preserving the original class distribution. During each iteration, nine folds were used for training and the remaining fold for validation, such that every sample was used for both training and testing across the cross-validation cycle.
A diverse set of classification models was implemented and compared. These included traditional algorithms (k-NN, SVM, DT, RF), gradient-boosted ensemble methods (LightGBM, XGBoost), and deep learning models (NN, CNN). Each model was trained independently on the training set of each fold and evaluated on the corresponding validation set. Performance was assessed using four standard classification metrics: accuracy, precision, recall, and F1-score (Table 3). This combination of metrics provided a balanced perspective on both model correctness and sensitivity, which is particularly important in multiclass and clinically imbalanced datasets.
Table 3.
Evaluation metrics used to assess classification performance in this study.
Although no universally accepted cutoff is currently applied, we defined F1-scores above 0.90 as indicative of high-performing models within the context of Raman-based microbial classification. This threshold was chosen to reflect realistic diagnostic expectations, acknowledging the need for both high precision and generalizability in practical clinical applications. We also took into account that, in real-world scenarios, classification models must contend with biological variability, heterogeneous sample quality, imperfect spectral acquisition, and imbalanced class distributions. Under such conditions, an F1-score exceeding 0.90 offers a robust compromise between sensitivity and specificity. This criterion also aligned with performance levels frequently reported in the literature for comparable spectroscopic classification tasks.
2.2.3. Model Interpretability with SHAP
To interpret the contribution of individual input features, Shapley Additive Explanations (SHAP) were employed [25]. This method, grounded in cooperative game theory, assigns a value to each feature that represents its average marginal contribution to the model’s predictions. SHAP values were computed for each Raman wavenumber, providing both global and local interpretability. At the global level, SHAP analysis identified the most influential spectral regions across the entire dataset, enabling the identification of common biochemical markers associated with specific bacterial or fungal classes. At the local level, SHAP provided case-by-case explanations, showing how individual features influenced the classification of a particular spectrum. The insights yielded were visualized through summary plots and dependence plots, offering an intuitive and transparent view of the internal decision-making processes of complex models.
This interpretability step was critical for validating the biological plausibility of the models’ outputs and enhancing their credibility in potential clinical or epidemiological applications. By identifying the regions of the Raman spectrum that drove predictions, SHAP analysis supported the discovery of diagnostic signatures and contributed to the development of an explainable, AI-assisted framework for microbial identification.
The flowchart outlines (Figure 2) a systematic machine learning pipeline for bacterial identification using Raman spectroscopy, divided into two main phases: model selection and model assessment.
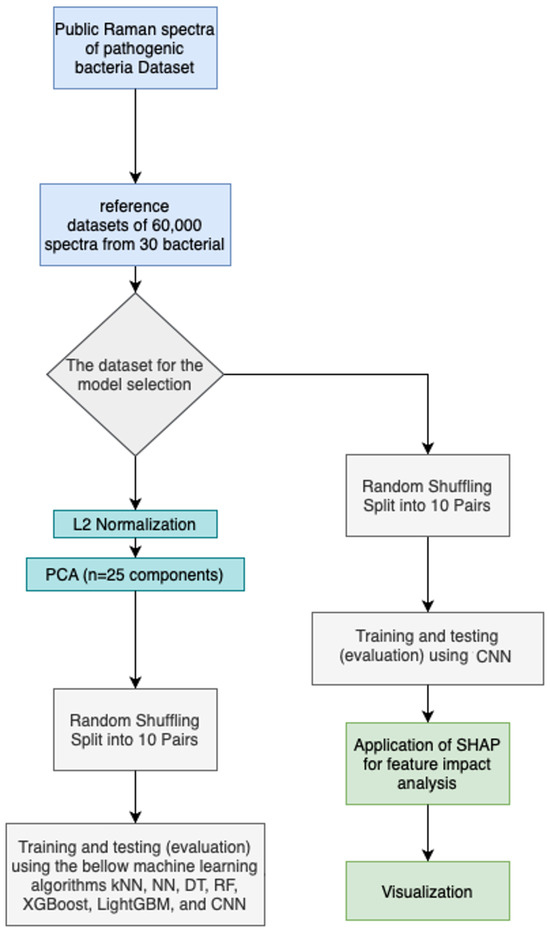
Figure 2.
The flow chart of the methodology.
3. Results
3.1. Comparative Performance of ML Models in Multiclass Pathogen Classification
The comparative evaluation of the ML models tested was based on accuracy and F1-score (Table 4 and Figure 3), revealing that the SVM outperformed all other models, achieving scores of nearly 0.95 for both metrics. LightGBM and Neural Networks followed closely, indicating that ensemble and deep-learning methods are highly effective for Raman-based bacterial classification. CNNs—both with and without PCA—also demonstrated strong performance, with slightly reduced scores compared to their non-CNN counterparts but still above 0.926 in both metrics.
Table 4.
Final ranking of models based on best accuracy and F1-score (with PCA).
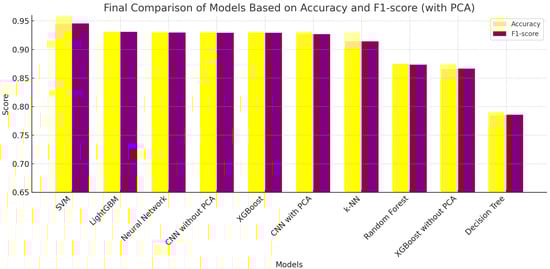
Figure 3.
Final ranking of models based on best accuracy and F1-score (with PCA).
XGBoost maintained competitive performance with PCA but performed significantly worse without it, highlighting the importance of dimensionality reduction in maintaining model generalization. K-Nearest Neighbors (k-NN) and Random Forest offered moderate accuracy but showed limitations in balancing sensitivity and precision.
Finally, Decision Trees (with PCA) and XGBoost without PCA ranked lowest in the evaluation, reaffirming that simpler models or those trained on unprocessed data may struggle in high-dimensional spectral domains. This analysis underscores the importance of both expressive model architectures and robust preprocessing techniques, such as principal component analysis (PCA), for achieving optimal performance in bacterial identification tasks based on Raman spectra.
SHAP-Based Feature Importance Across All Pathogen Bacteria
The SHAP analysis performed on the normalized Raman spectra revealed class-specific patterns of spectral importance. As visualized in the SHAP heatmap (Figure 4), elevated SHAP values were observed primarily around 970–, 1450– and .
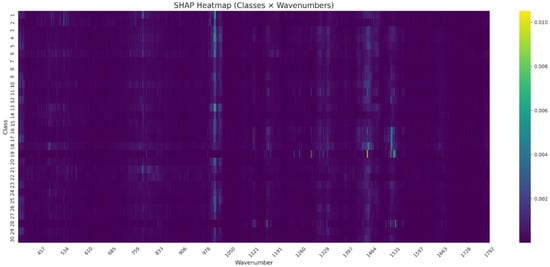
Figure 4.
SHAP heatmap showing the mean feature importance across 30 microbial classes and the full Raman spectral range. Each row corresponds to a class, and each column to a specific wavenumber. Color intensity reflects the average SHAP value per class–wavenumber pair, highlighting spectral regions that most strongly influenced model predictions.
These contributions varied across classes, with Class 17 showing a sharp SHAP peak near , while Classes 25, 28, and 19 exhibited distinct activation in the 970– range. Notably, only a limited number of wavenumber regions contributed substantially to model predictions, suggesting a compressed spectral relevance space.
3.2. Machine Learning Models’ Performance on Gram-Positive Bacteria
All models tested achieved high identification performance on Gram-positive bacteria (Figure 5). The Support Vector Machine (SVM) with an RBF kernel produced the highest mean accuracy at 96.27%, with minimal performance variability across folds, suggesting strong generalization across different sample subsets. Neural networks and LightGBM followed closely, with accuracies of 95.41% and 95.31%, respectively, also demonstrating reliable behavior. Although the CNN model showed slightly more variation in performance, its accuracy remained within a high-performance range, highlighting its effectiveness in capturing nonlinear spectral patterns.
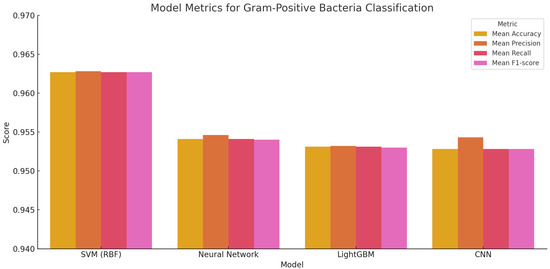
Figure 5.
Bar plot showing mean accuracy (with 95% confidence intervals) for each model on Gram-positive bacterial classification.
The consistently high scores across metrics—accuracy, precision, recall, and F1-score—indicate that these models reliably distinguished Gram-positive species based solely on their spectral profiles. This supports their potential role in clinical workflows, where fast, label-free species identification can improve diagnostic timelines and inform antimicrobial stewardship.
SHAP-Based Feature Interpretation for Gram-Positive Classification
To investigate the decision-making patterns of the CNN model applied to Gram- positive bacterial spectra, SHAP values were computed directly across all Raman wavenumbers. The resulting heatmap (Table 5 and Figure 6) displays the average feature importance per class and wavenumber.
Table 5.
Gram-positive bacteria species corresponding to class numbers 12–28.
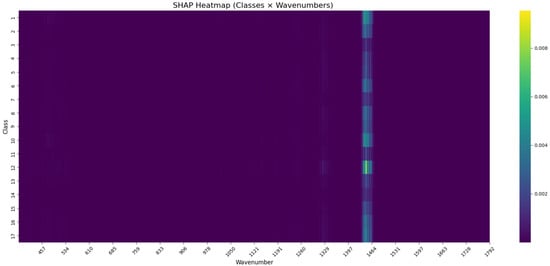
Figure 6.
SHAP heatmap of the CNN model trained on Gram-positive bacterial Raman spectra. Each row corresponds to a microbial class, and each column to a Raman wavenumber. Color intensity represents the mean SHAP value per class–wavenumber pair.
Elevated SHAP values were observed in a narrow spectral region, most prominently around . This region appeared recurrently across multiple classes, suggesting that certain wavenumber bands contributed disproportionately to class predictions. These findings likely reflect genuine biological differences between the taxa. Variations in the biochemical composition of bacterial cell walls, such as the degree of peptidoglycan cross-linking, teichoic acid concentration, or the presence of surface proteins and glycolipids, can all influence Raman scattering intensity and band structure.
For example, Streptococcus spp. is known to express group-specific carbohydrate antigens, whereas Enterococcus species exhibit diversity in membrane-associated lipoproteins and glycolipids [26,27]. The SHAP heatmaps revealed that specific Raman bands, such as those near , were differentially weighted across these taxa, suggesting that these biochemical traits are captured by the model [25,26]. These chemically informative features, although often undetectable by conventional staining or biochemical profiling techniques, are amplified and interpreted through Raman spectroscopy in combination with explainable AI. This supports the model’s capacity to detect both broad-spectrum spectral information and species-specific molecular traits, such as peptidoglycan composition or membrane-bound biomolecules [13,28], thereby enhancing diagnostic resolution and biological interpretability.
3.3. Machine Learning Models’ Performance on Gram-Negative Classification
The classification of Gram-negative (Figure 7) bacteria based on Raman spectral data yielded consistently strong results across all models tested. Accurate identification of these species is clinically important, given their association with multidrug resistance and involvement in severe infections such as urinary tract infections, pneumonia, and septicemia.
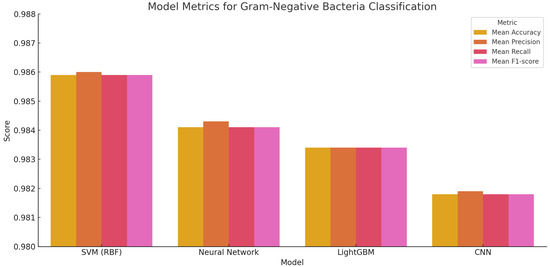
Figure 7.
Performance metrics for Gram-negative bacterial classification across four machine learning models. Bars represent accuracy, precision, recall, and F1-score for each model.
Among the models evaluated, the Support Vector Machine (SVM) with an RBF kernel achieved the highest overall performance. It recorded a mean accuracy of 98.59%, along with precision, recall, and F1-score values, all at 98.59%, indicating highly consistent and balanced predictions across the Gram-negative taxa. Neural Networks and LightGBM followed closely with accuracies of 98.41% and 98.34%, respectively. The CNN model also delivered robust results, attaining 98.18% accuracy. These patterns mirror those observed in the Gram-positive classification task, reinforcing the SVM’s reliability in handling complex microbial datasets.
SHAP-Based Feature Interpretation for Gram-Negative Classification
As regards the interpretation of how the CNN model distinguished between Gram-negative bacterial species, SHAP values were computed directly across the Raman spectral domain (Figure 8 and Table 6). The analysis revealed distinct class-specific spectral dependencies, with Classes 2, 5, and 11 showing particularly strong SHAP activation in the low-wavenumber region around , and all Classes displaying elevated relevance near and . These patterns suggest that different Gram-negative taxa exhibit characteristic Raman features that are differentially captured by the model.
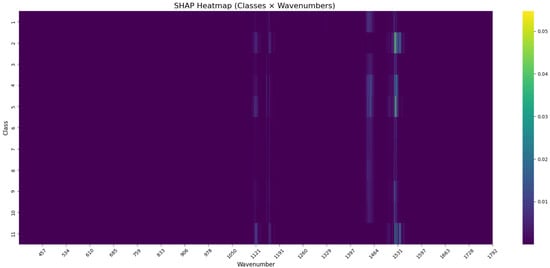
Figure 8.
SHAP heatmap of the CNN model trained on Gram-negative bacterial Raman spectra. Each row represents a microbial class, and each column corresponds to a Raman wavenumber. Color intensity reflects the mean SHAP value per class–wavenumber pair.
Table 6.
Gram-negative bacteria species corresponding to class numbers 1–11.
The SHAP heatmap also highlighted common spectral regions, such as the bands near 1120–, which were consistently weighted across multiple classes. These regions likely correspond to conserved biochemical structures among Gram-negative species.
These spectral features likely reflect underlying biological differences in Gram-negative cell envelope architecture, including structural variation in lipopolysaccharide layers, differences in outer membrane protein content, and species-specific metabolite profiles. Such characteristics are often inaccessible using conventional microbiological tests, but become evident through vibrational spectroscopy enhanced by explainable AI, enabling interpretable, data-driven insights into microbial classification.
3.4. Machine Learning Models’ Performance on Candida spp. Classification
The ability to discriminate between Candida albicans and Candida glabrata was evaluated through a binary classification task using Raman spectral data. This analysis, performed using three different computational models, aimed to assess how well each approach could distinguish between the two species based on subtle biochemical differences captured in their spectra (Table 7 and Figure 9).
Table 7.
Candida species corresponding to class numbers 0–1, class 0 = C. albicans, class 1 = C. glabrata.
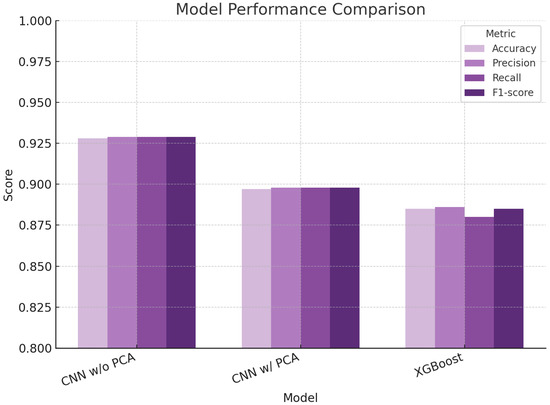
Figure 9.
Performance of the three models on the binary classification task, plotted by metric.
The convolutional neural network (CNN) trained directly on the whole, unprocessed Raman spectra showed the best overall performance. It achieved an accuracy of 92.8%, with similarly high values for precision, recall, and F1-score. These results suggest that the CNN was able to identify and use meaningful biochemical signals from the spectra to classify the species correctly. The model’s consistent performance across all metrics indicates both reliability and balance in detecting true positives while avoiding false classifications—an important characteristic in any diagnostic context. When dimensionality reduction was applied using Principal Component Analysis (PCA) before CNN training, a slight decrease in performance was observed. The model still performed well, with all metrics below 90%, but the drop suggests that compressing the spectral data may remove some of the finer biochemical information necessary for accurate classification. This highlights the trade-off between simplifying data and retaining diagnostically relevant detail.
The XGBoost model, a tree-based machine learning approach, also used PCA-transformed spectra but performed slightly less effectively than both CNN versions. Its accuracy and related metrics remained high (around 88.5%), but its slightly lower recall indicates a greater tendency to miss true-positive cases. This may reflect the model’s limited ability to recognize more complex biochemical patterns in the data.
SHAP-Based Spectral Feature Interpretation for Candida spp. Classification
As regards the interpretation of how the CNN model distinguished between Candida bacterial species, SHAP values were computed directly across the Raman spectral domain. The analysis revealed distinct spectral dependencies, with elevated SHAP activation in the regions around 760–770−1, 980–990−1, , , , , and . These patterns suggest that all the Candida species exhibit characteristic Raman features that are differentially captured by the model.
Figure 10 shows the SHAP values for each class across all wavenumbers. Striped vertical bands indicate spectral regions where the CNN places the greatest importance.
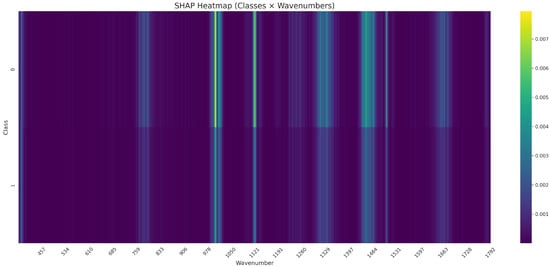
Figure 10.
SHAP heatmap of CNN feature importance across all wavenumbers for Class 0 and Class 1, Candida spp.
4. Discussion
Infectious diseases caused by the bacterial and fungal pathogens examined here remain a major global health burden, where delays in accurate identification directly compromise patient outcomes. Traditional diagnostics, though reliable, are hindered by slow culture-based processes that cannot keep pace with the urgent need for rapid, targeted therapy. Raman spectroscopy has emerged as a fast, label-free biochemical fingerprinting method that captures pathogen-specific molecular signatures within minutes. However, the inherent complexity of spectral data has historically limited its clinical translation. By coupling Raman spectroscopy with artificial intelligence, this study demonstrates how machine learning not only resolves these analytical challenges but also delivers interpretable predictions across diverse taxa, highlighting the promise of Raman–AI pipelines as next-generation diagnostic tools.
Within this framework, our findings revealed distinct strengths across microbial groups, with particularly high performance in Gram-negative bacteria. This likely reflects the chemically diverse structures of their outer membranes, which produce discriminative Raman signatures well captured by AI models. Building on this observation, the outer-membrane architecture—rich in lipopolysaccharides (LPS), lipid A, porins, and outer-membrane proteins—creates heterogeneous, species-specific vibrational patterns that facilitate robust interspecies separation in Raman space [29,30]. Variability in LPS O-antigen chains and lipid A phosphorylation, in particular, is consistent with the distinct signatures our models exploited for accurate classification [29,30].
By comparison, Gram-positive organisms lack an outer membrane but possess thick peptidoglycan layers enriched with teichoic and lipoteichoic acids. Despite this more conserved envelope, our results indicate that species-level differences in wall-associated polysaccharides, surface proteins, and membrane enzymes provide sufficient biochemical diversity for reliable discrimination [31,32]. Prior work focused on clinically relevant Staphylococcus spp. further supports this potential: Tang et al. reported high performance using SERS-based classification across > 100 strains, underscoring the discriminatory power of vibrational fingerprints even within closely related Gram-positive taxa [33].
For the fungal genus Candida, performance declined when distinguishing Candida albicans from Candida glabrata—a biologically unsurprising result given that Candida are fungi (yeasts) with shared structural and metabolic features. Both species exhibit similar wall scaffolds (1,3/-1,6-glucans, chitin, and mannan-rich glycoproteins) that can yield overlapping spectra [34]. Moreover, although C. glabrata is phylogenetically closer to Saccharomyces cerevisiae than to C. albicans, convergent adaptation to the human host has produced comparable pathogenic traits, further narrowing spectral separability [35]. Even so, near-term discrimination at clinically useful accuracy remains valuable given the time-critical nature of antifungal therapy in invasive candidiasis.
Across models, Support Vector Machines (SVMs) consistently led performance, aligning with prior reports that highlight their robustness on high-dimensional spectroscopic data [14,36]. Deep learning—particularly convolutional neural networks—also performed strongly and is attractive for capturing nonlinear spectral structure, including resistance-related patterns in focused tasks [15]. However, our results suggest CNNs are more sensitive to data scale and balance, reinforcing the practical advantage of kernel methods when datasets are limited or taxonomies are broad [14,15,36].
A key contribution of this work is the use of explainable AI to connect predictions to biochemistry. SHAP analyses on raw wavenumbers revealed conserved and class-specific regions—most prominently near 1120–, , and —that align with C–C/C–N stretching, bending, and protein-associated (Amide II) vibrations, respectively. This direct, spectrum-level attribution supports biological plausibility, clarifies which bands drive discrimination across taxa, and strengthens the translational credibility of Raman–AI outputs in clinical contexts.
Clinically, the compression of identification timelines from days to minutes has clear implications: earlier organism-level calls can enable timely, targeted therapy, improving outcomes while supporting antimicrobial stewardship and reducing costs. These advances are particularly salient for bloodstream and respiratory infections, where rapid pathogen resolution can alter management within the initial window of care.
Important challenges remain for translating Raman–AI diagnostics into routine clinical practice. Progress toward standardized, open-access spectral libraries for clinically relevant pathogens will be essential to improve reproducibility and enable cross-institutional validation. Algorithmically, adaptive methods that prioritize informative spectral regions and handle polymicrobial signals, class imbalance, and domain variability are needed to ensure robustness under real-world conditions. Several study-specific limitations should also be acknowledged. The dataset was derived from cultured isolates rather than direct patient specimens, which ensured high-quality spectra but did not capture the complexity of clinical matrices such as blood, urine, or sputum. The evaluation relied on cross-validation within a single dataset, without external validation to confirm generalizability across instruments and clinical settings. The study focused on species-level identification, while antimicrobial resistance profiling was not directly addressed. Addressing these constraints provides a clear agenda for future work, including validation directly on clinical specimens, the creation of large spectral repositories, integration of antimicrobial resistance prediction, and adoption of advanced model architectures. In parallel, combining Raman spectroscopy with complementary modalities such as MALDI-TOF MS or metagenomics, and developing lightweight models deployable on portable Raman devices, will further support translation from experimental validation to routine hospital and point-of-care workflows.
5. Conclusions
This study demonstrated the effectiveness of Raman spectroscopy combined with machine learning for rapid and clinically relevant pathogen identification. Among the tested models, Support Vector Machines consistently achieved the highest performance, confirming both robustness and interpretability. The integration of L2 normalization with explainability methods such as SHAP enabled not only high accuracy but also transparent insights into the biochemical features driving classification decisions. To realize the full diagnostic potential of Raman–AI approaches, future efforts should focus on building standardized spectral databases, developing adaptive algorithms for informative band selection, reducing computational demands for real-time deployment, and conducting extensive validation across diverse specimens and clinical settings. Explainable Raman–AI diagnostics thus represent a promising human health-centered technology that, with continued refinement, could be translated from research laboratories into routine hospital and point-of-care workflows, enabling earlier targeted therapy, improved antimicrobial stewardship, and better patient outcomes.
Author Contributions
Conceptualization, D.K. and Y.K.; methodology, D.C., D.K., and Y.K.; validation, A.I.K., C.B., and Y.K.; formal analysis, D.K. and Y.K.; data curation, D.K. and Y.K.; writing—original draft preparation, D.K., D.C., A.I.K., and Y.K.; writing—review and editing, D.K., D.C., and Y.K.; visualization, D.K. and Y.K.; supervision, C.B. All authors have read and agreed to the published version of the manuscript.
Funding
This research received no external funding.
Data Availability Statement
The original contributions presented in the study are included in the article, further inquiries can be directed to the corresponding author.
Conflicts of Interest
The authors declare no conflicts of interest.
Abbreviations
The following abbreviations are used in this manuscript:
| AI | Artificial Intelligence |
| CNN | Convolutional Neural Network |
| DT | Decision Tree |
| F1-score | Harmonic Mean of Precision and Recall |
| k-NN | k-Nearest Neighbors |
| LightGBM | Light Gradient Boosting Machine |
| ML | Machine Learning |
| PCA | Principal Component Analysis |
| RF | Random Forest |
| SERS | Surface-Enhanced Raman Spectroscopy |
| SHAP | SHapley Additive exPlanations |
| SVM | Support Vector Machine |
| XAI | Explainable Artificial Intelligence |
| XGBoost | eXtreme Gradient Boosting |
References
- Manzulli, V.; Cordovana, M.; Serrecchia, L.; Rondinone, V.; Pace, L.; Farina, D.; Cipolletta, D.; Caruso, M.; Fraccalvieri, R.; Difato, L.M.; et al. Application of Fourier Transform Infrared Spectroscopy to Discriminate Two Closely Related Bacterial Species: Bacillus anthracis and Bacillus cereus Sensu Stricto. Microorganisms 2024, 12, 183. [Google Scholar] [CrossRef]
- Kassem, A.; Abbas, L.; Coutinho, O.; Opara, S.; Najaf, H.; Kasperek, D.; Pokhrel, K.; Li, X.; Tiquia-Arashiro, S. Applications of Fourier Transform-Infrared spectroscopy in microbial cell biology and environmental microbiology: Advances, challenges, and future perspectives. Front. Microbiol. 2023, 14, 1304081. [Google Scholar] [CrossRef]
- Kirn, T.J.; Weinstein, M.P. Update on blood cultures: How to obtain, process, report, and interpret. Clin. Microbiol. Infect. 2013, 19, 513–520. [Google Scholar] [CrossRef]
- Kumar, A.; Roberts, D.; Wood, K.E.; Light, B.; Parrillo, J.E.; Sharma, S.; Suppes, R.; Feinstein, D.; Zanotti, S.; Taiberg, L. Duration of Hypotension Before Initiation of Effective Antimicrobial Therapy Is the Critical Determinant of Survival in Human Septic Shock. Crit. Care Med. 2006, 34, 1589–1596. [Google Scholar] [CrossRef]
- Gülaydin, N.; Bilen, A.M.; Göçmen, B. Comparison of some bacterial identification methods. Turk. J. Vet. Res. 2019, 3, 9–12. [Google Scholar]
- Clark, A.E.; Kaleta, E.J.; Arora, A.; Wolk, D.M. Matrix-assisted laser desorption ionization–time of flight mass spectrometry: A fundamental shift in the routine practice of clinical microbiology. Clin. Microbiol. Rev. 2013, 26, 547–603. [Google Scholar] [CrossRef] [PubMed]
- van Belkum, A.; Bachmann, T.T.; Lüdke, G.; Lisby, J.G.; Kahlmeter, G.; Mohess, A.; Becker, K.; Hays, J.P.; Woodford, N.; Mitsakakis, K.; et al. JPIAMR AMR-RDT Working Group on Antimicrobial Resistance and Rapid Diagnostic Testing. Developmental roadmap for antimicrobial susceptibility testing systems. Nat. Rev. Microbiol. 2019, 17, 51–62. [Google Scholar] [CrossRef] [PubMed]
- Aradhya, A.S.S.; Bandiya, P.; Diggikar, S.; Kumar, V.; Krithika, M.V.; Balachander, B.; Reddy, V.I.; Chandrakala, B.S.; Bhavana, J.; Kulkarni, S.; et al. High prevalence of antimicrobial resistance to initial empirical antibiotic therapy in neonatal sepsis in Bengaluru, India—A multicentre study. J. Trop. Pediatr. 2025, 71, fmaf020. [Google Scholar] [CrossRef] [PubMed]
- Premasiri, W.R.; Lee, J.C.; Sauer-Budge, A.; Théberge, R.; Costello, C.E.; Ziegler, L.D. The biochemical origins of the surface-enhanced Raman spectra of bacteria: A metabolomics profiling by SERS. Anal. Bioanal. Chem. 2016, 408, 4631–4647. [Google Scholar] [CrossRef]
- Thomsen, B.L.; Christensen, J.B.; Rodenko, O.; Usenov, I.; Grønnemose, R.B.; Andersen, T.E.; Lassen, M. Accurate and fast identification of minimally prepared bacteria phenotypes using Raman spectroscopy assisted by machine learning. Sci. Rep. 2022, 12, 16436. [Google Scholar] [CrossRef]
- Liu, S.; Zhang, N.; Tang, J.; Chen, C.; Wang, W.; Zhou, J.; Ye, L.; Chen, X.; Li, Z.; Wang, L. Comparison of Raman spectroscopy with mass spectrometry for sequence typing of Acinetobacter baumannii strains: A single-center study. Microbiol. Spectr. 2025, 13, e01425-24. [Google Scholar] [CrossRef]
- Usman, M.; Tang, J.-W.; Li, F.; Lai, J.-X.; Liu, Q.-H.; Liu, W.; Wang, L. Recent advances in surface enhanced Raman spectroscopy for bacterial pathogen identifications. J. Adv. Res. 2023, 51, 91–107. [Google Scholar] [CrossRef]
- Stöckel, S.; Kirchhoff, J.; Neugebauer, U.; Rösch, P.; Popp, J. The application of Raman spectroscopy for the detection and identification of microorganisms. J. Raman Spectrosc. 2016, 47, 89–109. [Google Scholar] [CrossRef]
- Ho, C.S.; Jean, N.; Hogan, C.A.; Blackmon, L.; Jeffrey, S.S.; Holodniy, M.; Banaei, N.; Saleh, A.A.E.; Ermon, S.; Dionne, J. Rapid identification of pathogenic bacteria using Raman spectroscopy and deep learning. Nat. Commun. 2019, 10, 4927. [Google Scholar] [CrossRef] [PubMed]
- Ciloglu, F.U.; Caliskan, A.; Saridag, A.M.; Kilic, I.H.; Tokmakci, M.; Kahraman, M.; Aydin, O. Drug-resistant Staphylococcus aureus bacteria detection by combining surface-enhanced Raman spectroscopy (SERS) and deep learning techniques. Sci. Rep. 2021, 11, 18444. [Google Scholar] [CrossRef] [PubMed]
- Kang, H.; Wang, Z.; Sun, J.; Song, S.; Cheng, L.; Sun, Y.; Pan, X.; Wu, C.; Gong, P.; Li, H. Rapid identification of bloodstream infection pathogens and drug resistance using Raman spectroscopy enhanced by convolutional neural networks. Front. Microbiol. 2024, 15, 1428304. [Google Scholar] [CrossRef] [PubMed]
- Vulchi, R.T.; Morgunov, V.; Junjuri, R.; Bocklitz, T. Artifacts and anomalies in Raman spectroscopy: A review on origins and correction procedures. Molecules 2024, 29, 4748. [Google Scholar] [CrossRef]
- Rodriguez, J.D.; Westenberger, B.J.; Buhse, L.F.; Kauffman, J.F. Standardization of Raman spectra for transfer of spectral libraries across different instruments. Analyst 2011, 136, 4031–4037. [Google Scholar] [CrossRef]
- Guo, S.; Heinke, R.; Stöckel, S.; Rösch, P.; Bocklitz, T.; Popp, J. Towards an improvement of model transferability for Raman spectroscopy in biological applications. Vib. Spectrosc. 2017, 91, 111–118. [Google Scholar] [CrossRef]
- Srivastava, S.; Wang, W.; Zhou, W.; Jin, M.; Vikesl, P.J. Machine Learning-Assisted Surface-Enhanced Raman Spectroscopy Detection for Environmental Applications: A Review. Environ. Sci. Technol. 2024, 58, 20830–20848. [Google Scholar] [CrossRef]
- Lee, S.; Park, R.; Jung, H.S. AI-enhanced surface-enhanced Raman scattering for accurate and sensitive biomedical sensing. Adv. Intell. Syst. 2025, 7, 202500030. [Google Scholar] [CrossRef]
- Hu, J.; Chen, G.J.; Xue, C.; Liang, P.; Xiang, Y.; Zhang, C.; Chi, X.; Liu, G.; Ye, Y.; Cui, D.; et al. RSPSSL: A novel high-fidelity Raman spectral preprocessing scheme to enhance biomedical applications and chemical resolution visualization. Light Sci. Appl. 2024, 13, 52. [Google Scholar] [CrossRef]
- Sun, Z.; Wang, Z.; Jiang, M. RamanCluster: A deep clustering-based framework for unsupervised Raman spectral 538 identification of pathogenic bacteria. Talanta 2024, 275, 126076. [Google Scholar] [CrossRef]
- Jeon, Y.; Lee, S.; Jeon, Y.J.; Kim, D.; Ham, J.H.; Jung, D.H.; Kim, H.Y.; You, J. Rapid identification of pathogenic bacteria using data preprocessing and machine learning-augmented label-free surface-enhanced Raman scattering. Sens. Actuators B Chem. 2025, 425, 136963. [Google Scholar] [CrossRef]
- Henneke, P.; Dramsi, S.; Mancuso, G.; Chraibi, K.; Pellegrini, E.; Theilacker, C.; Hübner, J.; Santos-Sierra, S.; Teti, G.; Golenbock, D.T.; et al. Lipoproteins are critical TLR2 activating toxins in group B streptococcal sepsis. J. Immunol. 2008, 180, 6149–6158. [Google Scholar] [CrossRef]
- Lundberg, S.M.; Lee, S.-I. A unified approach to interpreting model predictions. In Proceedings of the 31st International Conference on Neural Information Processing Systems, Long Beach, CA, USA, 4–9 December 2017; Curran Associates Inc.: Red Hook, NY, USA, 2017; pp. 4768–4777. [Google Scholar]
- Facklam, R. What happened to the streptococci: Overview of taxonomic and nomenclature changes. Clin. Microbiol. Rev. 2002, 15, 613–630. [Google Scholar] [CrossRef]
- Vaculík, O.; Bernatová, S.; Rebrošová, K.; Samek, O.; Silhan, L.; Ruzicka, F.; Šerý, M.; Šiler, M.; Ježek, J.; Zemánek, P. Rapid identification of pathogens in blood serum via Raman tweezers in combination with advanced processing methods. Biomed. Opt. Express 2023, 14, 6410–6421. [Google Scholar] [CrossRef] [PubMed]
- Arend, N.; Pittner, A.; Ramoji, A.; Mondol, A.S.; Dahms, M.; Rüger, J.; Kurzai, O.; Schie, I.W.; Bauer, M.; Popp, J.; et al. Detection and Differentiation of Bacterial and Fungal Infection of Neutrophils from Peripheral Blood Using Raman Spectroscopy. Anal Chem. 2020, 92, 10560–10568. [Google Scholar] [CrossRef]
- Yang, Y.; Xu, B.; Haverstick, J.; Ibtehaz, N.; Muszyński, A.; Chen, X.; Chowdhury, M.E.H.; Zughaier, S.M.; Zhao, Y. Differentiation and classification of bacterial endotoxins based on surface enhanced Raman scattering and advanced machine learning. Nanoscale 2022, 14, 8806–8817. [Google Scholar] [CrossRef] [PubMed]
- Rusciano, G.; Capaccio, A.; Sasso, A.; Capo, A.; Almuzara, C.M.; Staiano, M.; D’Auria, S.; Varriale, A. A Surface-Enhanced Raman Spectroscopy-Based Biosensor for the Detection of Biological Macromolecules: The Case of the Lipopolysaccharide Endotoxin Molecules. Int. J. Mol. Sci. 2023, 24, 12099. [Google Scholar] [CrossRef] [PubMed]
- Pezzotti, G. Raman spectroscopy in cell biology and microbiology. J. Raman Spectrosc. 2021, 52, 150–166. [Google Scholar] [CrossRef]
- Tang, J.-W.; Liu, Q.-H.; Yin, X.-C.; Pan, Y.-C.; Wen, P.-B.; Liu, X.; Kang, X.X.; Gu, B.; Zhu, Z.B.; Wang, L. Comparative analysis of machine learning algorithms on surface enhanced Raman spectra of clinical Staphylococcus species. Front. Microbiol. 2021, 12, 696921. [Google Scholar] [CrossRef] [PubMed]
- Pfaller, M.A.; Diekema, D.J. Epidemiology of invasive candidiasis: A persistent public health problem. Clin. Microbiol. Rev. 2007, 20, 133–163. [Google Scholar] [CrossRef] [PubMed]
- Gabaldón, T.; Fairhead, C. Genomes shed light on the secret life of Candida glabrata: Not so asexual, not so commensal. Curr. Genet. 2019, 65, 93–98. [Google Scholar] [CrossRef]
- Kloss, S.; Kampe, B.; Sachse, S.; Rösch, P.; Straube, E.; Pfister, W.; Kiehntopf, M.; Popp, J. Culture independent Raman spectroscopic identification of urinary tract infection pathogens: A proof of principle study. Anal. Chem. 2013, 85, 9610–9616. [Google Scholar] [CrossRef]


Disclaimer/Publisher’s Note: The statements, opinions and data contained in all publications are solely those of the individual author(s) and contributor(s) and not of MDPI and/or the editor(s). MDPI and/or the editor(s) disclaim responsibility for any injury to people or property resulting from any ideas, methods, instructions or products referred to in the content. |
© 2025 by the authors. Licensee MDPI, Basel, Switzerland. This article is an open access article distributed under the terms and conditions of the Creative Commons Attribution (CC BY) license (https://creativecommons.org/licenses/by/4.0/).