Article

Microplastics in Freshwater River in Rio de Janeiro and Its Role as a Source of Microplastic Pollution in Guanabara Bay, SE Brazil

by
Thiago L. Drabinski
1,
Diego G. de Carvalho
1,
Christine C. Gaylarde
2,
Marcos F. P. Lourenço
3,
Wilson T. V. Machado
3,
Estefan M. da Fonseca
1,
André Luiz Carvalho da Silva
4 and
José Antônio Baptista Neto
1,*
1
Laboratório de Geologia Marinha/LAGEMAR, Department of Geology and Geophysics, Instituto de Geociências, Universidade Federal Fluminense, Avenida Litorânea s/n, Niterói 24210-340, RJ, Brazil
2
Department of Microbiology and Plant Biology, Oklahoma University, 770 Van Vleet Oval, Norman, OK 73019, USA
3
Departamento de Geoquímica, Instituto de Química, Universidade Federal Fluminense, Outeiro São João Batista s/n, Niterói 24020-141, RJ, Brazil
4
Departamento de Geografia, Faculdade de Formação de Professores, Universidade do Estado do Rio de Janeiro, Francisco Portela, 1470, Patronato, São Gonçalo 24435-005, RJ, Brazil
*
Author to whom correspondence should be addressed.
Micro 2023, 3(1), 208-223; https://doi.org/10.3390/micro3010015
Submission received: 21 December 2022 / Revised: 20 January 2023 / Accepted: 28 January 2023 / Published: 6 February 2023

Abstract

:
In the present research, the occurrence of contamination by microplastics in the water column was investigated in 15 sample sites along the rivers Guapimirim, Macacu and Maracanã—important rivers that flow into Guanabara Bay, a very polluted estuarine environment in Brazil. The correctidentified polymers were manually counted and classified as to their morphology and color using a binocular stereomicroscope and were characterized by ATR-FTIR spectroscopy. The total mean abundance of particles was 3651.5 items m−3, ranging from 3.6 to 51,166.5 items m−3. Plastic debris was identified in all samples, with a predominance of fibers (67.3%). Polyethylene, polyester fiber and high-density polyethylene (50%) were the major polymers, and the main colors were transparent followed by black and blue in all the water bodies studied. The highest quantities of microplastics were found in the Maracanã River. The figures show that microplastic concentrations are correlated to the level of urbanization.

1. Introduction

Plastics are synthetic polymers mainly produced from crude oil that are widely used in the modern world [1]. Since their creation in the 20th century, their production, which started in the 1940s and continues to increase, had already reached 348 million tons per year by 2017 and is increasing every year [2]. Modern society is strongly dependent on plastics due to their versatility, durability, adaptability, and low cost [3]. Plastics are robust and have a wide range of uses, 40% of the production being for single use [4]. Their versatility has, however, served to make them one of the most copious forms of anthropogenic pollution in various water bodies, mainly marine environments from coastlines to the deep sea [3,4,5]. Brazil is the Earth’s fourth-largest producer of plastic waste, generating about 10.68 million tons per year. Of this, only 1.28% is recycled; hence, the overwhelming majority of plastic waste ends up incinerated, buried in landfills, or polluting the land and sea. In the next 2–3 years alone, about 250 million tons of plastic waste will enter our oceans [6], while the amount of plastic waste that will be generated in the next twenty years is estimated to increase to around 12 million tons [7]. At the moment, only 20% of all plastic waste is recycled or burned [8]. One of the biggest environmental concerns in the last decades is the exposure of marine ecosystems to such anthropogenic insults [3]. Uncertainty about the susceptibility of humans and the non-human biota to risks posed by MPs [9] highlights the need for further studies in this area.
The presence of large pieces of plastic in our waters obviously causes great concern; however, recently this concern has shifted to plastic particles smaller than 5 mm, known collectively as microplastics (MPs), which are not only present at high concentrations but also have especially worrying environmental effects [10]. MPs can be divided into primary and secondary particles. Primary MPs are regarded as those which are produced industrially for incorporation into cosmetics, cleaning agents, etc. Secondary MPs are produced when MPs decompose and degrade in the environment due to wave action, solar radiation, thermal reactions and microbial activity. Secondary MPs have become the main source of microplastics to the oceans [11,12,13]. Although freshwater and estuary systems are recognized as origins and transport pathways of plastics to the oceans, there is little comparison of MPs in different water bodies or river networks.
Large amounts of debris, including plastics, can spread through the oceans to even remote unpopulated areas [14,15,16,17,18]. The majority of the published research is associated with marine systems, with an enormous lack of information about freshwater systems, even in areas of the world with considerable plastic debris. Guanabara Bay has been identified as one of the most polluted environments on the Brazilian coast [19,20,21,22,23] and is normally associated with different forms of pollution (heavy metals, sewage, hydrocarbons, etc.). However, pollution by solid waste has been drawing attention in recent years [24,25]; more recently, several studies have demonstrated the occurrence of microplastics in its water column [26,27,28,29,30] and in the nearby coastal environments [31], and this has become a major environmental concern in this already greatly impacted environment. Nevertheless, there are no studies on MPs in freshwater environments in the surrounding aquatic areas, which are the main source of floating macro-, meso- and microplastic in Guanabara Bay.
In the coastal and marine environment, sources of MPs are mainly derived from offshore industrial activities, the extraction of oil and gas, aquaculture, fisheries and other maritime activities, which according to [5,32] represent only 20% of the microplastics that enter the coastal and oceanic system. On the other hand, [33] highlighted that rivers are at the heart of the dynamics of plastic pollution. The authors of [34] suggested that 70–80% of all MPs are transported to coastal and oceanic environments by river systems. There is, then, a strong need to determine the role of rivers as a source of MPs for these environments. This becomes important in places such as Guanabara Bay, which has many of its hydrographic basins urbanized and which receives inflows from about 45 rivers, some of which are highly urbanized.

2. Materials and Methods

Guanabara Bay is a 384 km2 eutrophic coastal bay located in Southeast Brazil; it is one of the most important embayments of the Brazilian coast, whose scenery displays some of the most important icons of the country, such as “Pão de Açúcar” (Sugar Loaf) and Corcovado, as well as many other natural beauties [20]. It is located in Rio de Janeiro (23°41′–23°56′ S and 43°02′–43°18′ W). This bay has been classified as a coastal estuary with shallow and partially mixed waters [19]. The climate is tropical humid with a rainy season occurring during summer (December–March) [20,35]. According to [36], Guanabara Bay can be divided into three areas: the entrance of the bay, mainly influenced by coastal-oceanic waters; a second area with transitional characteristics; and a third, located in the interior of the bay and strongly influenced by fluvial discharge.
Guanabara Bay is highly degraded due to discharges of solid waste and domestic, industrial and agricultural effluents that enter the bay through polluted rivers and channels [22]. Its drainage basin measures approximately 4000 km2, with 45 rivers and channels that contribute to the average annual flow of 100 m3 s−1. This area is characterized by a high level of urbanization and a significant low-income population. Of the total, six rivers contribute 85.5% of the input: Guapimirim River (20.8%), Iguaçu River (16.7%), Caceribu River (13.7%), Estrela River (12.7%), Rio Meriti (12.3%) and Rio Sarapuí (9.3%) [35]. The rivers and channels that discharge into the bay cross highly urbanized areas, receiving all kinds of effluents [37,38]. The drainage basin receives polluted effluents from about 6000 industries, 2 airports, 2 commercial harbors and 15 oil terminals that are located in its vicinity [20,35]. Furthermore, there are inputs of untreated domestic sewage from diffuse sources. Mostly, those inputs come from the rivers of the vast watershed [20,35].
With the aim of characterizing the fluvial contribution of microplastics to Guanabara Bay, two distinct hydrographic basins were selected: one with a low population that is more preserved (Guapi-Macacu Basin), and one that is totally urbanized and polluted (Maracanã River Basin/Mangrove Channel) (Figure 1). The Guapi-Macacu Basin has a drainage area of approximately 1640 km2 and an estimated population of 106 thousand inhabitants. Due to its location, the characteristics of its physical environment and its historical occupation, typical agricultural and extractive activities predominated in the basin until a few decades ago, with low-density urban occupation and industrial activities. However, the entire eastern region of the bay—the area in which the basin is located—has been undergoing an accelerated process of anthropization characterized by rapid population growth, disorderly occupation, deforestation and the installation of industries; this has had a direct impact on its environmental resources and the quality of life of the population. The basin has, as main tributary watercourses, the Macacu, Guapiaçu and Guapimirim rivers, accounting for approximately 31% of the total continental area contributing to Guanabara Bay. It is also through this hydrographic region that the bay receives about 70% of all its freshwater [35].
The Canal do Mangue Basin is located in the northern part of the city of Rio de Janeiro (Figure 1). It has a drainage area equivalent to 45.4 km2, comprising the neighborhoods of Tijuca, Grajaú, Vila Isabel, São Cristóvão, Rio Comprido, Maracanã, Santo Cristo and Cidade Nova located in the macro-zone of encouraged occupation, according to the Master Plan for Sustainable Development of the City.
The basin area is thus located in a highly urbanized region covering areas of intense land occupation, mostly residential and commercial. It is considered the most polluted basin in atmospheric terms in the city of Rio de Janeiro. The few remaining areas of vegetation cover are under constant threat from urban sprawl and advancing communities. Tijuca National Park stands out as the most environmentally preserved area of the basin, which has a secondary forest in good condition and a complex network of channels that result in high drainage [38,39].
The Maracanã River is one of the main watercourses of the Mangue channel basin. At the end of the 20th century, in its medium and low course, several canalization and rectification works were carried out in order to reduce and avoid the frequent flooding events in the area and enable urban occupation. It runs for 8.5 km, receiving several tributaries such as the Joana and Trapicheiros rivers, finally flowing into the Mangue Channel [39].
The release of effluents along the Maracanã River, which are directly associated with raw sewage, makes large amounts of nutrients and chemical compounds available; these alter the natural characteristics of the river, causing eutrophication. In addition, the river experiences several impacts as a result of domestic and industrial waste produced in the area.

2.1. Sample Collection

For the collection of material in the field (Table 1), a Neuston net with a mesh of 300 µm and 2.0 m in length was used, coupled to a rectangular stainless-steel structure measuring 0.4 m by 0.3 m (adjustable) in order to collect only the material present in the superficial portion of the water column. A mechanical flowmeter (General Oceanics—model 2030R), a multiparameter probe (YSI PRODSS) and GPS (Garmin Etrex 10) were also used.
The sampling protocol for microplastics in the water column proposed by NOAA (National Oceanic and Atmospheric Administration) [40] was adapted to detect MPs in the water column in the river environment. This involved the placement of a Neuston net in the central region of the watercourse at each pre-established station. The net was manually fixed by means of cables, and the collection time was measured using a stopwatch (10–15 min per sampling); the flowmeter reading was performed before and after the insertion of the net in the water, as suggested by [41].
The volume of water filtered through the mesh at each station was measured following the flowmeter manufacturer’s instructions. First, virtual distance (D) was calculated in meters (since the net was positioned at a fixed location at each sampling station). After obtaining the value, it was multiplied by the area of the net mouth (A m2), according to the following equation:
Volume = AD
After the end of each collection, the net was rinsed with filtered water and all collected material retained in the cup attached to the end of the net was transferred, in the field, to clean and pre-identified containers that were stored until proceeding for laboratory analysis.

2.2. Sample Preparation and Analyses

In the laboratory, each sample was transferred to 1000 mL glass beakers that were previously cleaned, dried and identified. The storage flasks used in the field were rinsed with distilled water repeatedly until all material was transferred to the beakers. Then, adapting the methodology proposed by NOAA [40], hydrogen peroxide was used to degrade the organic matter present in the samples. A measure of 20 mL of 30% hydrogen peroxide was added, and the beakers were placed on a heating plate at 75 °C for 30 min. Each sample was stirred every 10 min for 1 min using a glass rod. After these procedures, if any organic matter remained, another 20 mL of hydrogen peroxide was added, and the entire step was repeated. Sodium chloride was dissolved in the distilled water to adjust the density to 1.190 g cm3, the density of 5 M NaCl. The floating MPs separated in the salt solution and were collected, air dried, and stored in small petri dishes for microscopic examination. In the next step, which aimed to categorize and quantify the MPs found in the samples, a binocular stereo microscope model Zeiss STEMI 2000 C was used for manual analysis. Close photographs were captured to show greater details of the samples, essential for better visualization, identification and characterization of the material. Samples were characterized chemically by attenuated total reflectance Fourier transformed infrared spectroscopy (ATR-FTIR, Thermo Nicolet 6700, Thermo Fisher Scientific- Waltham, Massachusetts, USA). Identification based on infrared (IR) spectroscopy was used in the selected samples. This method compares the IR spectrum of an unknown plastic sample with spectra of known polymers. The different types of spectroscopy applied for MPs identification were infrared spectrophotometer, Fourier transform infrared spectroscopy (FT-IR), and near-infrared spectrometer. The chemical composition of the polymer was identified by comparing the entire spectral range of the unprocessed spectra with those in the referenced publications. Spectra were identified with Open Specy, version 0.9.5 [42].

3. Results

Freshwater environments represent the most complex systems in terms of the transport and retention of MPs, being considered the major form of entry of these polymers into marine ecosystems [43,44]. Studies already carried out suggest that the spatial distribution and transport of MP particles along water bodies are directly related to anthropogenic factors, physicochemical characteristics of MP particles, hydrogeological characteristics and meteorological conditions in the region [45]. Several studies have shown that urbanization is the main factor, with MP concentration increasing with urbanization.
As previously stated, MPs are composed of both primary and secondary particles [11]. While primary MPs are produced industrially and are relatively standard in shape and size, secondary MPs are formed by the breakdown of larger pieces [46] that may have a wide variety of shapes, sizes, and chemical compositions [47,48]. In the area studied in this project, the vast majority of the particles were secondary MPs.
All the water samples analyzed were contaminated with microplastics, but at different levels. A total of 12,713 items were found at the 15 stations, with a range of 76 to 4007 particles. The highest number of microplastic particles identified was at station MN-02 and the lowest at station GM-04 (Table 2). As expected, the highest concentrations were observed in the Maracanã River, with 86% of the total; this is a highly urbanized area with slums lacking basic sanitation in much of it. MPs were, however, found in every area, indicating extensive contamination by these pollutants throughout the water bodies; this was observed even in regions further upstream of the rivers, where one expects to find little or no MP pollution. The Macacu and Guapimirin rivers, with 7.5% and 6.6% of total particles detected, respectively, are much less urbanized (Table 2). These rivers showed lower levels than the Macaranã river. Almost certainly, this is due to the fact that the Guapi-Macacu basin region has a lower population density, predominantly rural land use and large areas of natural vegetation; it is thus a considerably less urbanized region compared with the Maracanã River.
The variability in MP abundance is related to the distance from the sources that generate the particles. Samples that were collected close to urban centers and with intense human activity (high population occupancy, inadequate waste disposal and greater urbanization) showed higher values of MP contamination, similar to that reported in other studies [49,50].
The morphological classification of the particles is an important parameter for the classification of MPs; the degradation of MPs into their typical morphologies can help in the identification of their source. In this study, the analyses aimed to identify the main characteristics of shape, color and size. Fibers, fragments, films, pellets and styrofoam were identified (Figure 2).
Fiber fragments represented the majority of the MP particles found in the river samples, followed by films, fragments and a small number of pellets and styrofoam, similar to other studies carried out in freshwater, coastal and marine environments [44,51].
In total, 12,713 MP particles were characterized from all three rivers, with 63.3% identified as fibers, 27.3% as films, 7.5% as fragments, 1.8% as styrofoam and 0.1% as pellets (Table 2). However, styrofoam occurred only in the Maracanã River, and the pellets occurred mainly in the Maracanã Guapimirim Rivers. The large amount of fiber fragments in these areas is similar to that found in other studies carried out in freshwater, coastal and marine environments [44,51,52,53]. According to [54], clothes washing is a likely source of fibers in urban areas. The same pattern has also been observed in other studies carried out in river environments [44,52,53,55].
The amount of MP particles in river surface water has been shown to increase with downstream distance [43,56]. However, in the present study, population density, urbanization level and type of land use and occupation appear to be determining factors for MP distribution and abundance.
Anthropogenic sources of MP particles can be numerous [57]. Domestic waste, plastic bags and packaging can produce irregular fragments. Fibers are generated mostly from clothes and their washing processes and from synthetic fabrics [58]. Pellets and granules can originate from personal hygiene products such as liquid soaps, exfoliants and abrasive spheres used in industrial processes [57]. Ref. [53] highlighted the importance of air as a potential source of fibers for river systems. After the aerial polymers are deposited in the river drainage area, they can be transported into the system through surface runoff and wind currents.
In the Maracanã River near station MN-02, there are several sewer outlets that discharge untreated domestic effluents from the houses located on the banks of the river; there is also open garbage disposal close to the river, mainly in places near the shanty town Morro do Borel. The community there does not have adequate access to sanitation services. This scenario probably affected the abundance of MP particles at this station, where there was a significant increase in the number of polymers identified compared to station MN-01 (Table 2).
Table 3 compares the concentration of MP particles with similar studies carried out in different countries. The concentrations of MPs found in the rivers analyzed herein are similar or significantly higher than other studies around the world (Table 3). The abundance of MPs in the Maracanã River is considerably higher; contamination in this water body is quite severe. A relationship can be established between the abundance of MP particles present in the water column and land use in areas adjacent to the river systems.
The discrepancy of the filtered volume in some stations of the same river is mainly due to the geography of the area that influences the water flow (Table 4). Stations where larger volumes of water were filtered are located in places where rivers have greater energy. On the other hand, stations such as GM-05, GM-06 and MN–05 are located in regions closer to the mouths of rivers, where the water flow is slower (Table 4).
Observing the filtered volume and the number of items identified at station MN-05, it can be seen that the Mangrove Channel (final station of the Maracanã River) is an environment severely contaminated by MPs; the low volume that was filtered contained many MP particles (Table 4). This fact highlights the daily input of MP particles into Guanabara Bay through this station alone. Many of the adverse environmental impacts are still unknown, but recognition of the presence of such high plastic pollution in this estuarine environment, already heavily impacted by MPs and other pollutants, is of obvious importance.
Ref. [29] suggested that the morphology of the microplastics could give a clue for determining the length of time that they have been degrading in the environment. Some of the fragments found have more regular edges, suggesting that they are the result of a recent fragmentation. Those fragments that have more rounded edges may have been present in the environment for a longer time and consequently have experienced wear by mechanical action, photodegradation and biochemical processes over a longer period. It is important, of course, to distinguish MPs that originate as microspheres, such as those from skin cleansers, toothpaste and other consumer products [64]. However, a recent analysis of MPs in organic fertilizer from biowaste fermentation and composting found that these microspheres were only 0–8% of the total [65], while [66] found that microspheres composed only 0.4% of the MPs in samples from the beaches at Phuket, Thailand. In addition, these MP particles are generally found as perfect spheres, enabling easy discrimination from degraded plastics.
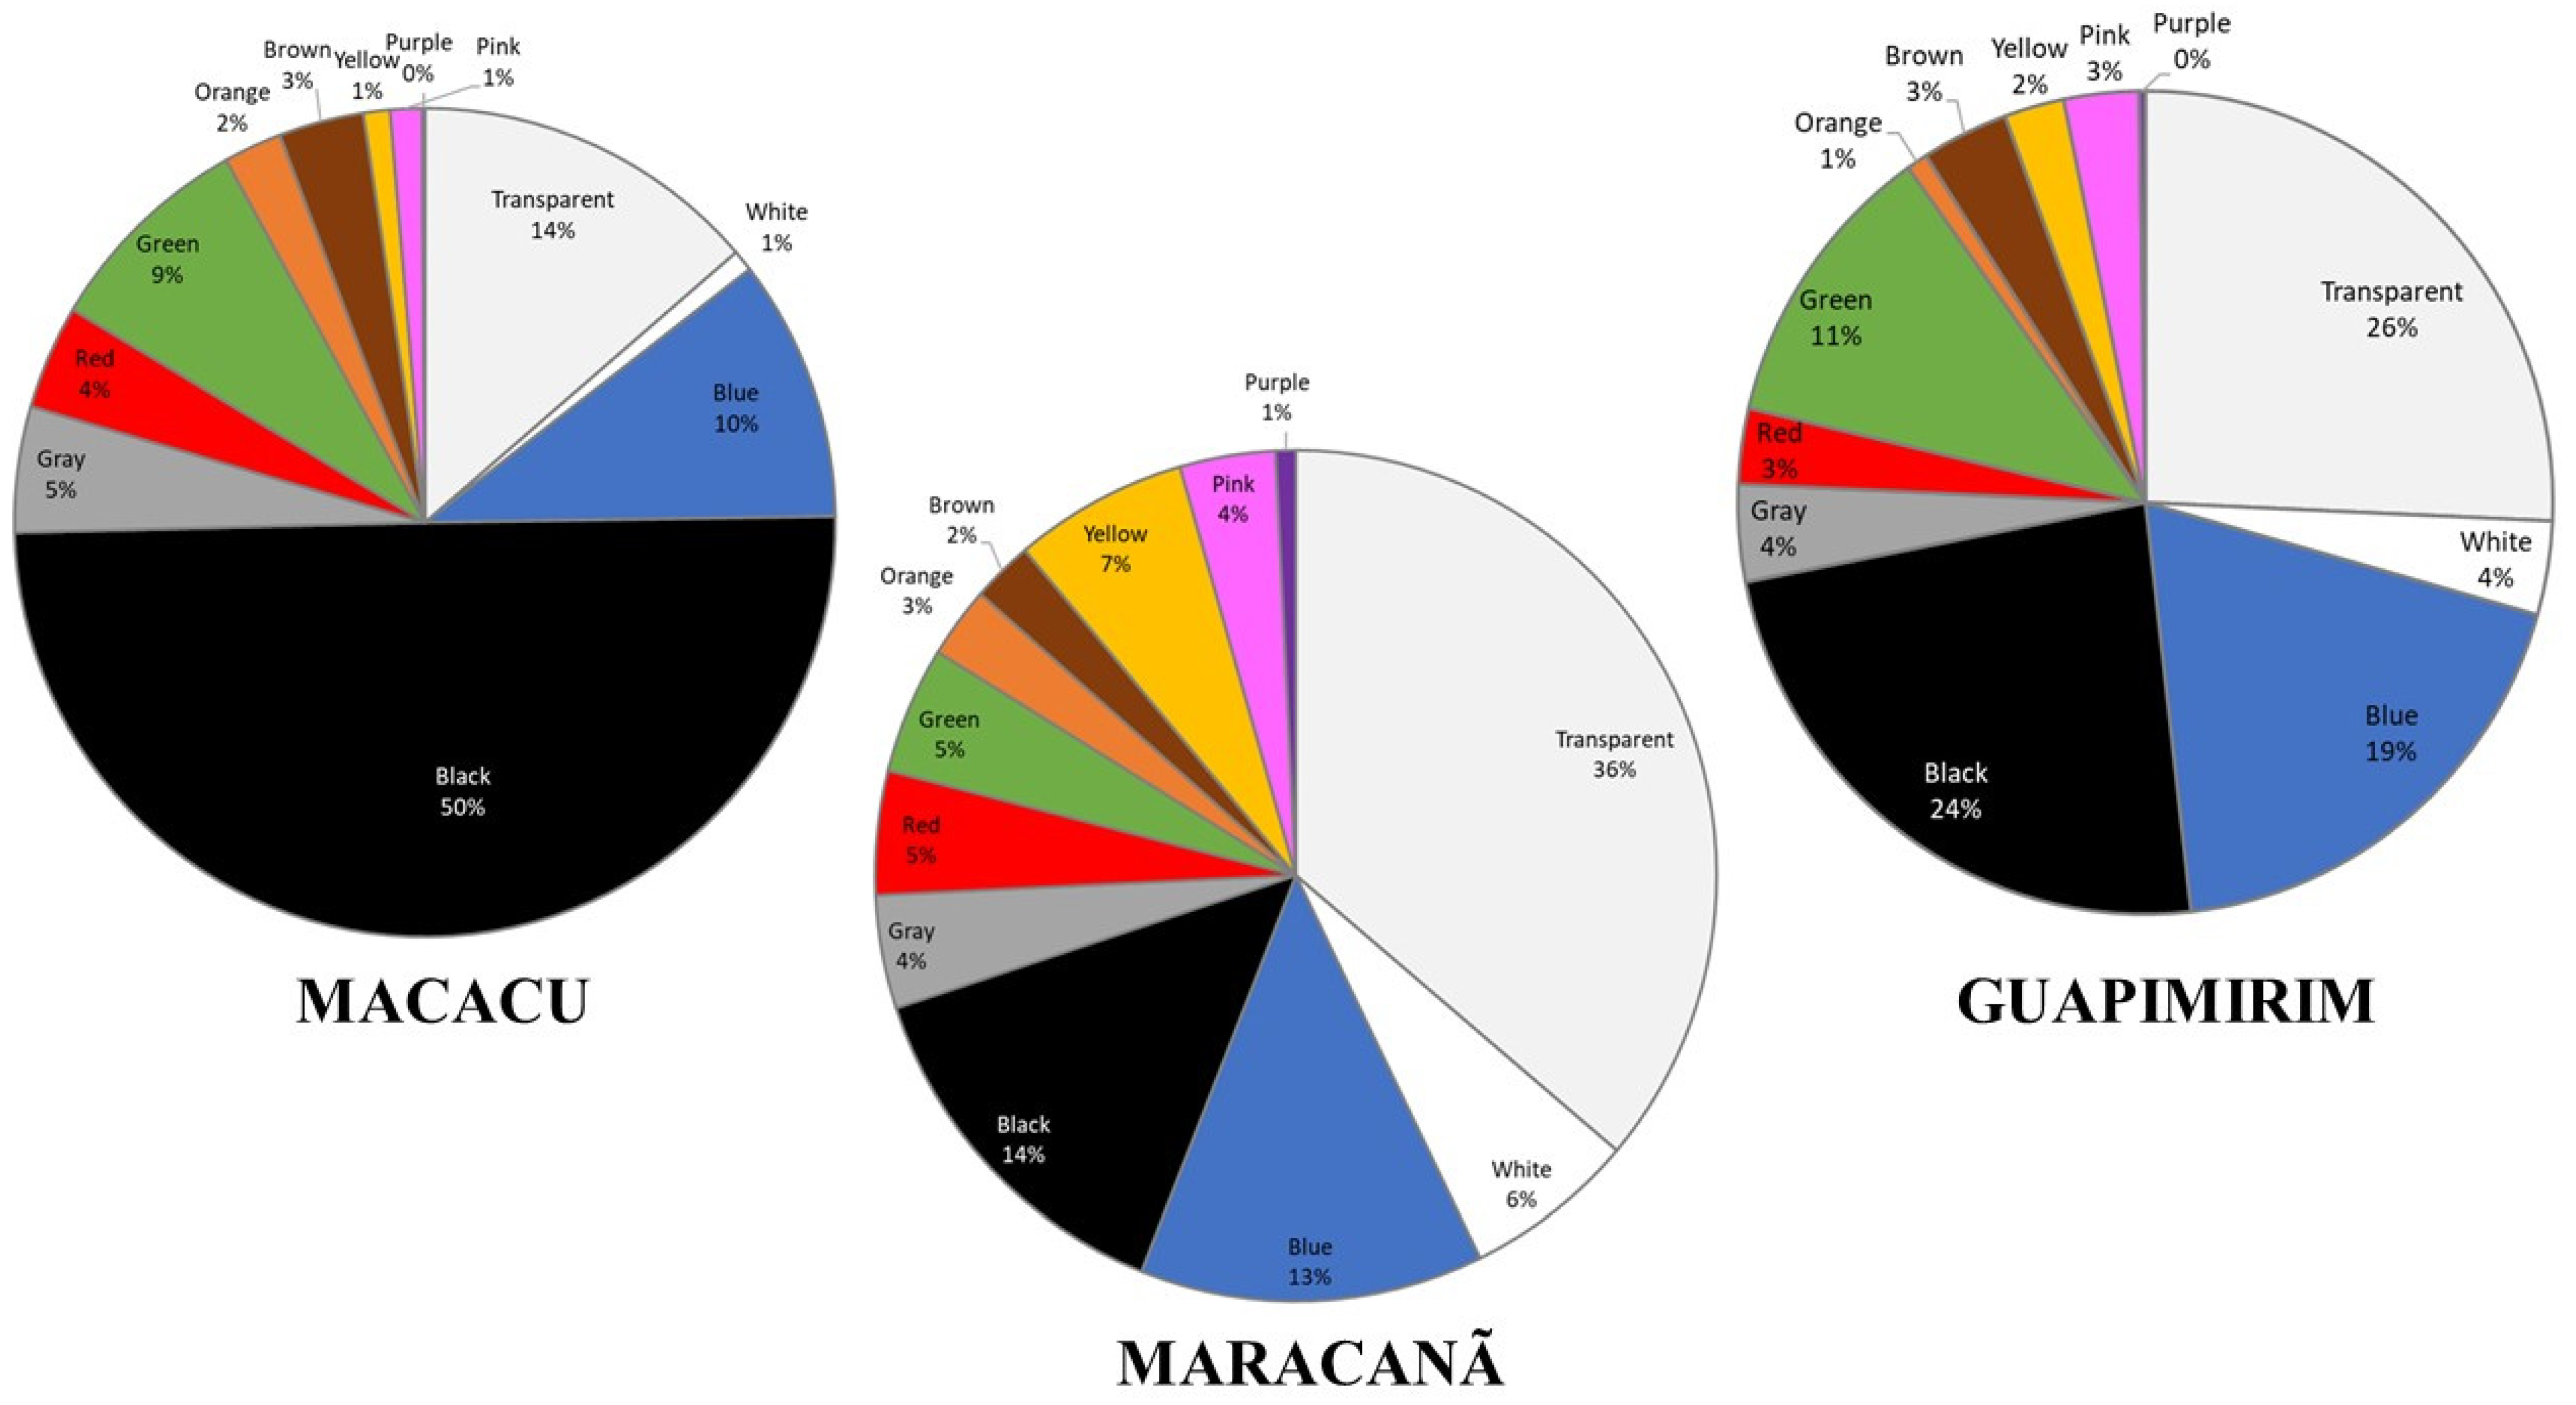
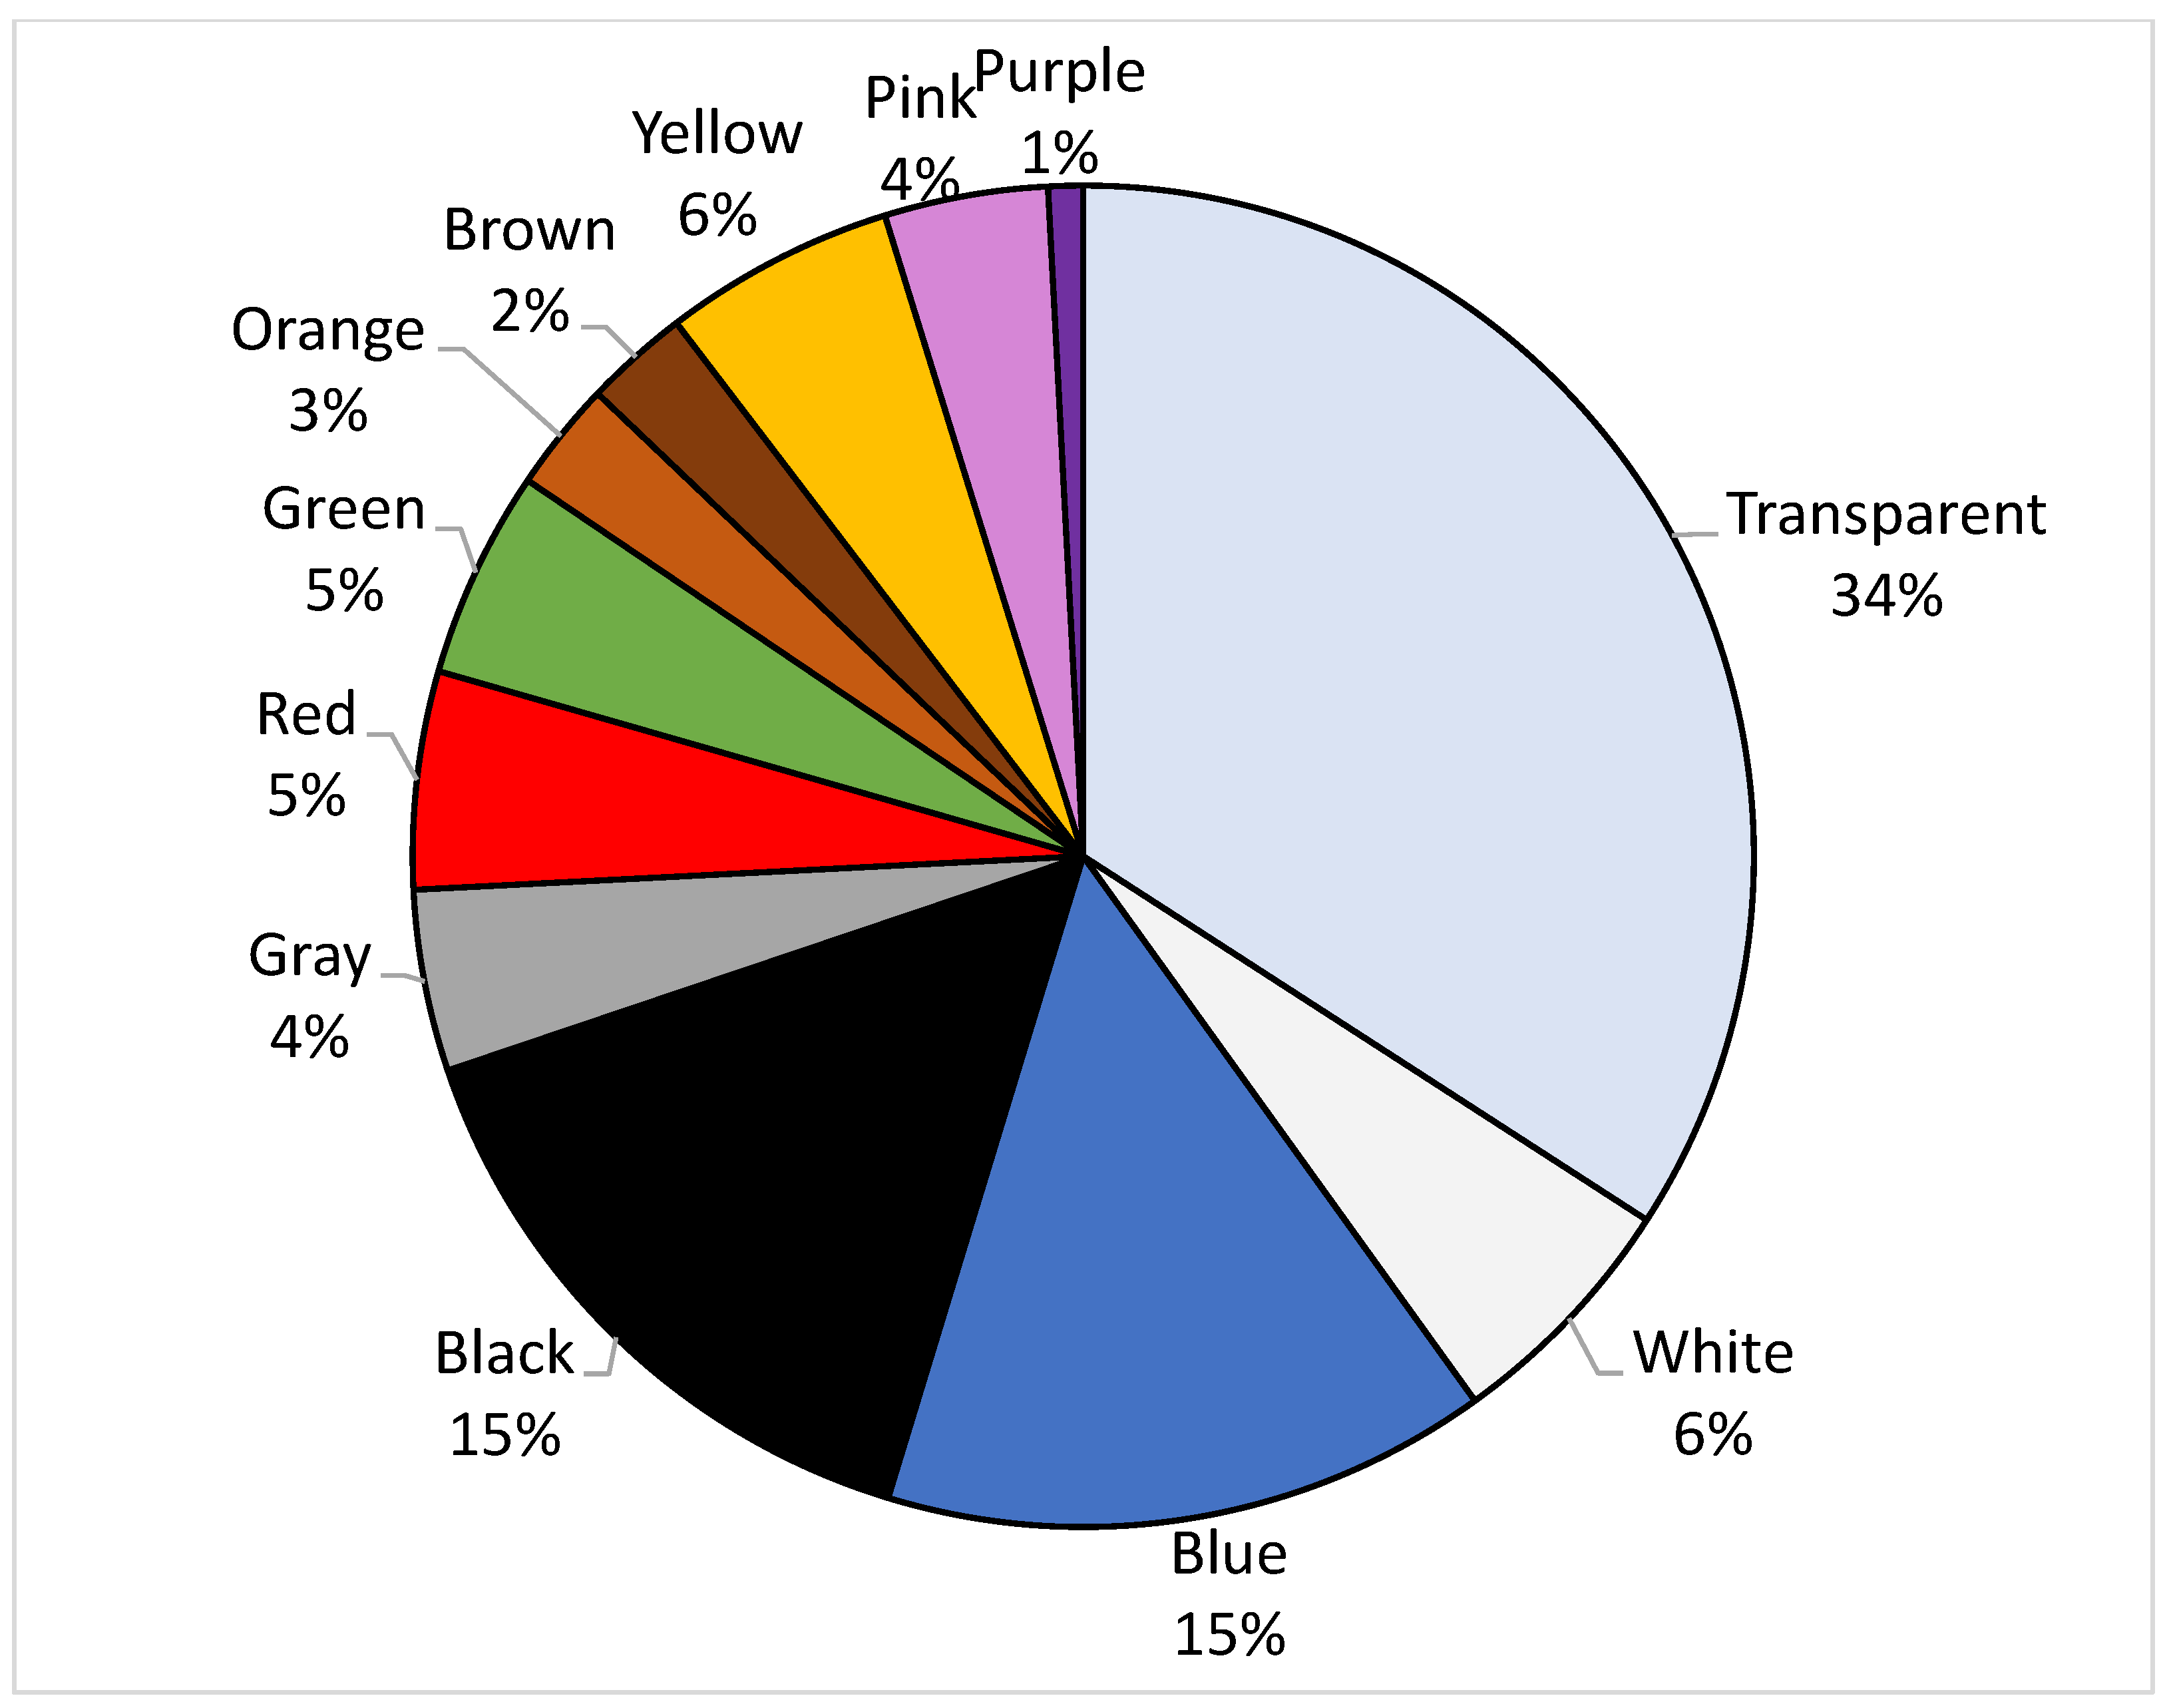
The colors of the MPs were very diverse. They were grouped into twelve colors, as shown in Figure 3. The most abundant colors were those found in the following studied areas: Maracanã River—transparent (36.0%) followed by black (14.0%), blue (13.0%), yellow (7.0%), white (6.0%), red (5.0%), green (5.0%), gray (4.0%), pink (4.0%), orange (3.0%), brown (2.0%), and purple (1.0%); Macacu River—black (50.0%), followed by transparent (14.0%), blue (10.0%), green (9.0%), gray (5.0%), red (4.0%), brown (3.0%), orange (2.0%), pink (1.0%), yellow (1.0%), white (1.0%); and Guapimirim River—transparent (26.0%) followed by black (24.0%), blue (19.0%), green (11.0%), gray (4.0%), white (4.0%), red (3.0%), brown (3.0%), pink (3.0%), yellow (2.0%), orange (2.0%). However, when we consider the total, the main colors are transparent (34%), blue (15%) and black (15%) (Figure 4). This pattern is slightly different from studies in sediments and in water columns around the world, where blue is usually the most common color, followed by transparent and black. The predominance of transparent MPs in the current study is explained by the widespread use of materials such as transparent packaging bags and transparent plastics. Other studies have previously demonstrated that blue, black and transparent are dominant MP colors worldwide [67,68]. Sometimes, in the current study, a loss of color along the fiber filament was seen, suggesting that these polymers had already been available in the environment for some time and had lost their color due to weathering.
Plastic coloring increases the attractiveness of the product [69], but it also plays a role in bioavailability; a resemblance to food increases the likelihood of being ingested [51,70]. Marine fauna confuse their common prey with MP particles due to the color [68]. Ref. [71] highlighted that the color of MPs plays a role in the adsorption of chemical contaminants, which is higher for black MPs. According to the same authors, black and aged particles can sorb higher concentrations of chemicals than colored and white particles. Ref. [72] suggested that pigmented particles may also contain some colored additives that make it easier to sorb chemicals from the surrounding seawater. This information becomes more important in rivers considered highly polluted, such as the Maracanã River. Ref. [73] found high micropollutant concentrations of Bisphenol A, followed by estrogens EE2, E3, and E2 in the river, which have a high affinity for microplastic. On the other hand, chemical additives used in the manufacturing and coloring of MP particles can slowly migrate to the surface, where they become more toxic to microflora and fauna [74].
Several studies have already identified the interaction between toxic chemicals and MPs [70,75]. A large and chemically active surface area allows the precipitation of inorganic minerals and organic compounds on the particles, leading to a change in their surface properties and the formation of various active binding groups. This can lead to the particles acting as vectors for the transfer of contaminants such as heavy metals and organic compounds to the environment. Endocrine disruptor compounds, harmful bacteria, and other compounds are potential hazards for organisms and humans [75,76,77,78,79,80,81,82]. Unlike the sediments transported by rivers, which tend to flocculate in the estuarine zone due to changes in salinity, pH, etc., buoyant MPs could be transported over considerable distances. Another factor that strongly influences the role of MPs in the transport of pollutants is related to the weathering of the plastic; the aging of the surface facilitates the absorption of heavy metals [81]. One of the main problems in highly polluted rivers such as the Maracanã River, which receive a large amount of organic discharge from untreated sewage, is the increased dispersal and transport of human pathogens. They can, for example, be transported between terrestrial and marine environments [83]. According to [84], because of their slow biodegradation, high surface-area-to-volume ratio and hydrophobicity, they can transport pathogens between ecosystems. These authors also suggest the transfer of various micro-organisms to other marine species along the trophic web.
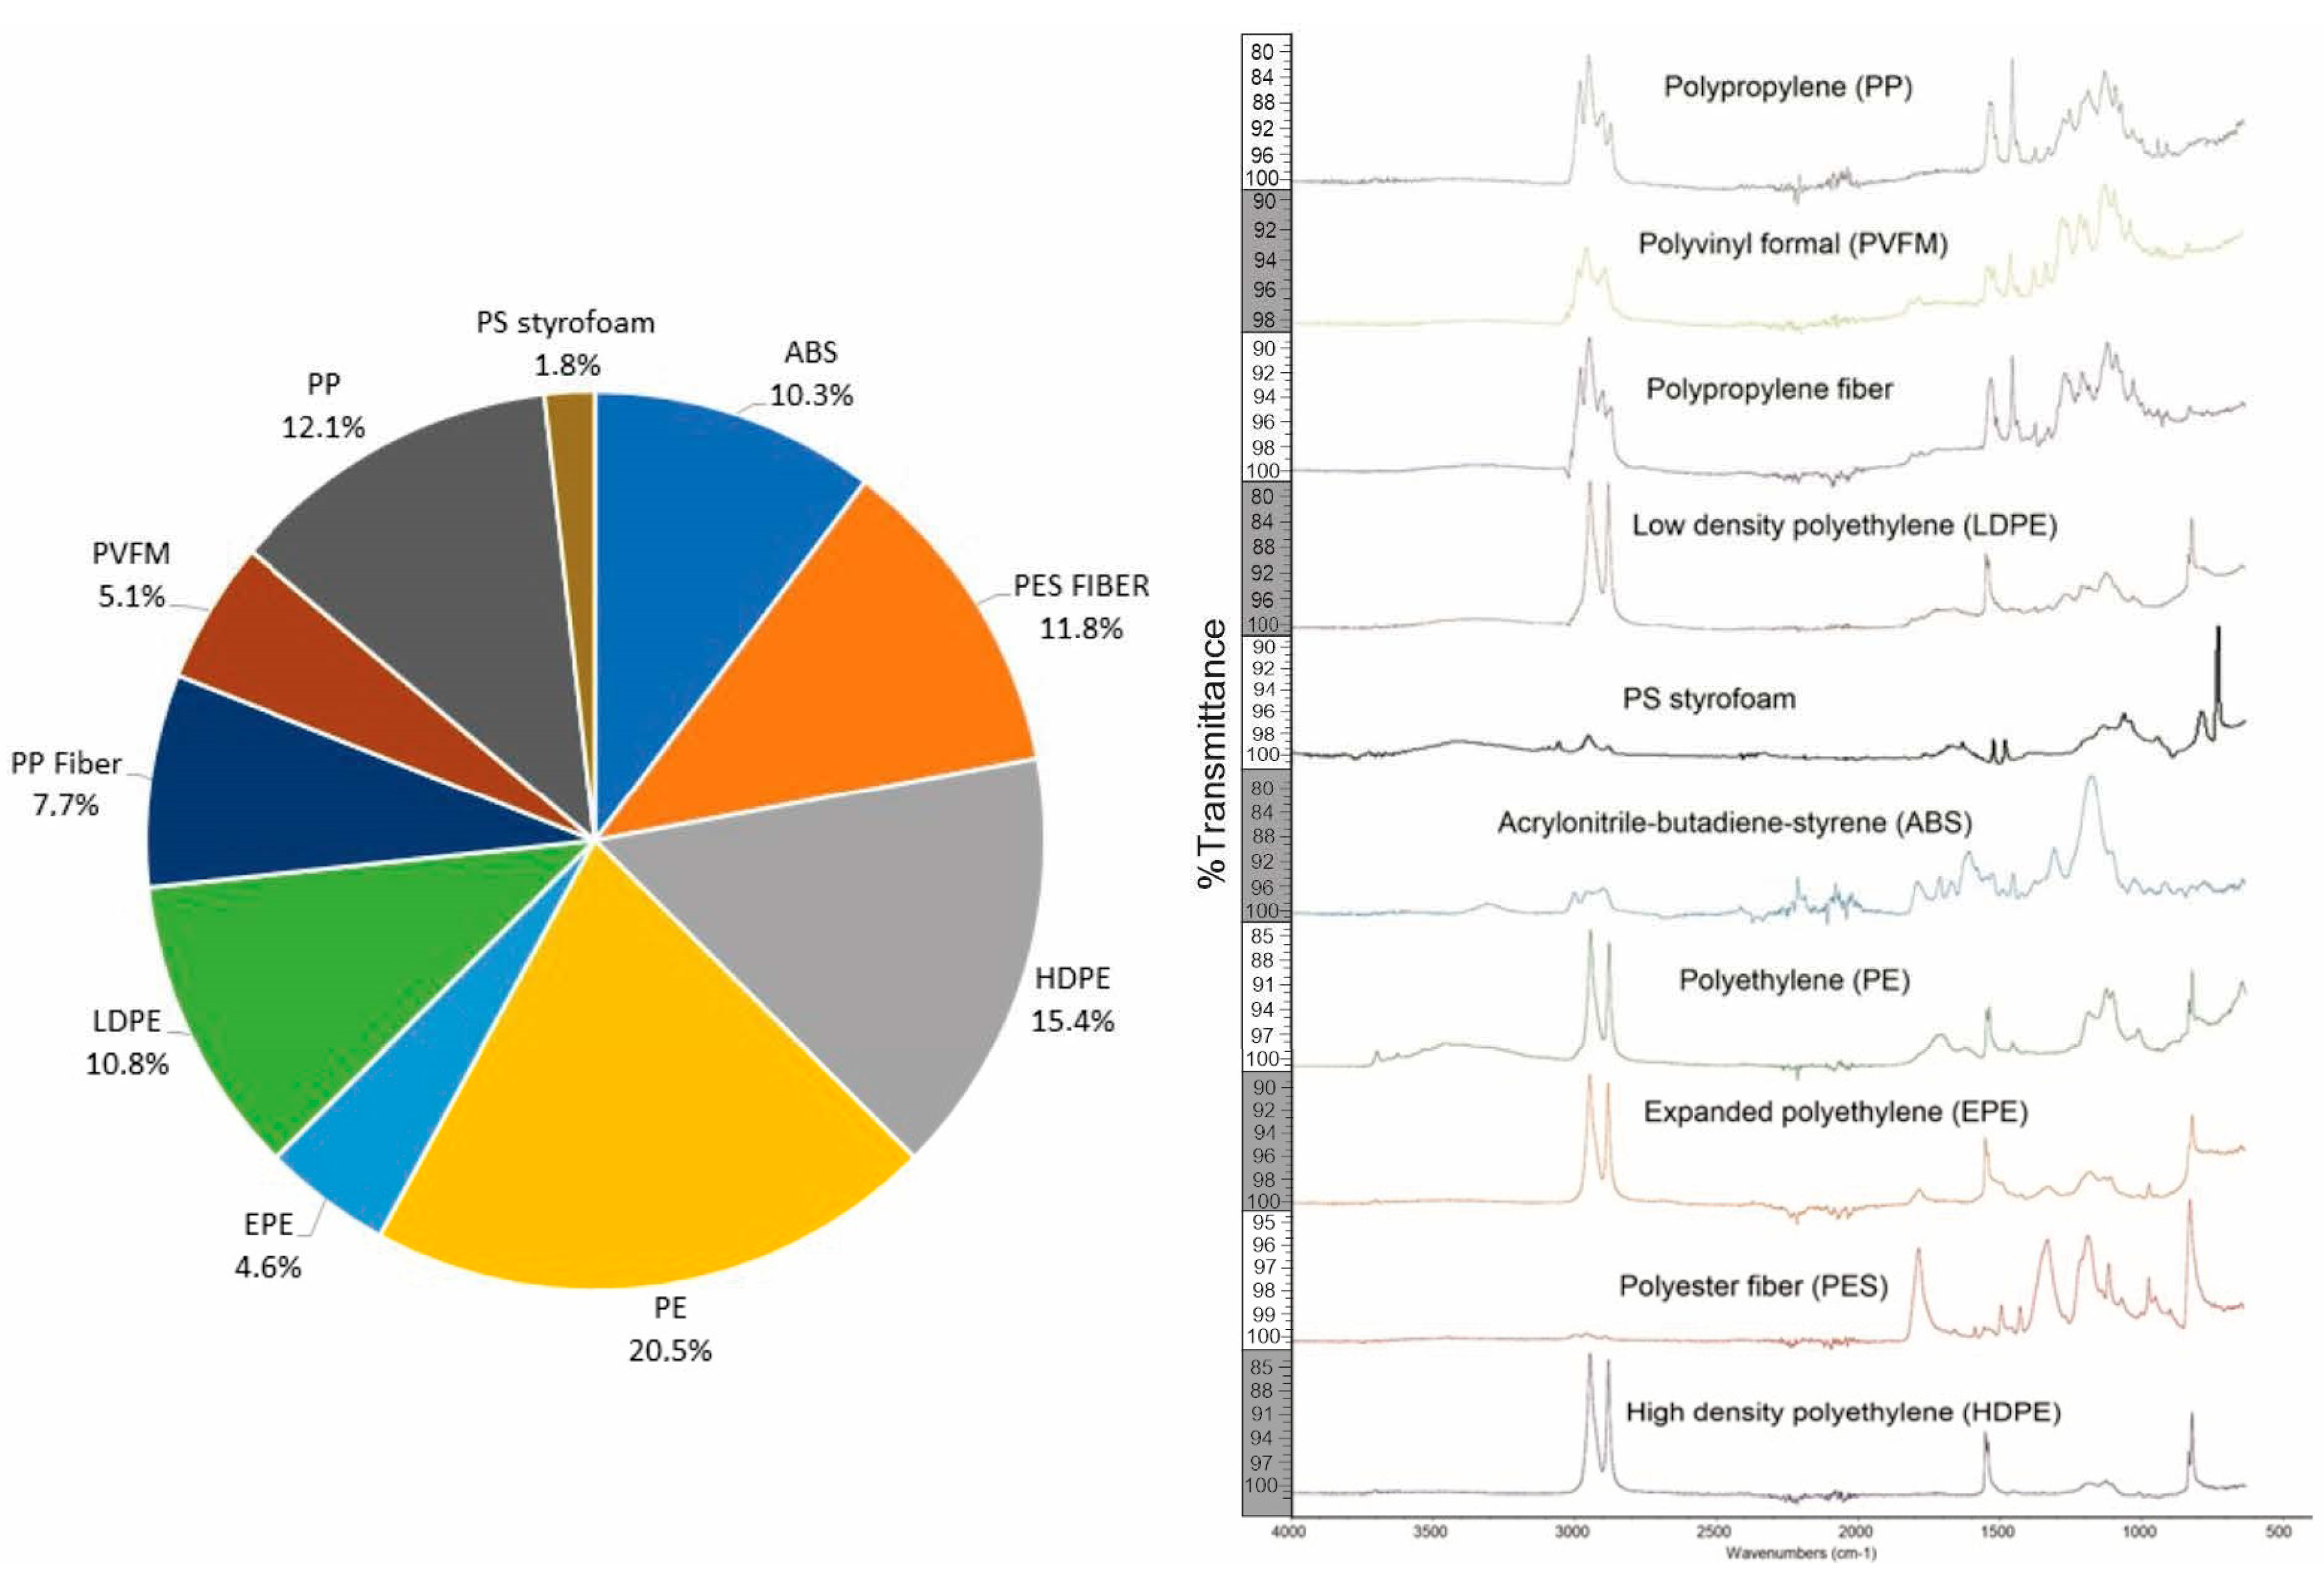
Plastics are synthetic polymers made from a wide range of chemical compounds with varying characteristics. The composition of MP particles determines the density of the plastic debris and its behavior in aquatic environments. For instance, depending on their density, microplastic debris may be suspended in the water column or sink to the sediment when discharged [85]. Depending on their chemical properties, some polymers are biologically inert, not affecting the aquatic environment. In the current study, the MP polymers were identified by FT-IR to be polyethylene (22%), high density polyethylene (17%), polyester fibers (11%), acrylonitrile butadiene styrene (11%), low density polyethylene (11%), polypropylene (11%), foamed polyethylene 5%, polypropylene fibers (4%) and polyvinyl formal 3% (Figure 5). Polyester fibers, high-density polyethylene and polyethylene are the polymers most produced in the world, and so it is not surprising that a similar pattern of predominance has been found in other studies [86]. All of the fragment polymers found in the Rio de Janeiro rivers are commonly used in consumer products such as packages, bottles, coatings, films, and construction materials [10]. The MP composition determines the density of the plastic debris and its behavior in aquatic environments. In this case, it was possible to observe both low- and high-density polymers in the samples, even though high-density polymers tend to settle to the bottom and low-density polymers remain on the surface. Apart from polymer density, factors such as hydraulic conditions, salinity, temperature, wind and biofouling, as well as changes of surface-to-volume ratio, affect the vertical distribution of MPs in water [87].

4. Conclusions

Guanabara Bay has already been described by several authors as one of the main sites for microplastic pollution on the Brazilian coastline. Considerable amounts of microplastic are discharged into the bay from several sources, but the fluvial systems appear to be the main one. Studies on the occurrence and dynamics of MPs in freshwater environments remain very scarce, especially in South America. Understanding how MP concentrations vary along the course of a river is crucial to help identify key sources and pathways of MP pollution and develop management strategies. This study provides an initial understanding of the dynamics of MP pollution in Guanabara Bay from sources to the sea.
MP contamination in the Guapimirim, Macacu and Maracanã rivers was demonstrated and quantified for the first time. The data revealed the presence of MP particles in all samples collected from these bodies of water, which have as their final destination Guanabara Bay—one of the largest and most polluted estuarine environments on the Brazilian coast.
In total, 12,713 plastic particles were identified, with fibers being the most abundant morphological type followed by films and fragments. The concentrations of MP particles were between 3,6 and 51,166.5 items m−3, with an average of 3651.5 items m−3.
The prevalence of MP fibers (63.3%) highlights the influence of land use and the failures of sewage treatment, the latter being absent in the area. The MPs were grouped into twelve colors, the most abundant being transparent, followed sequentially by black, blue, yellow, white, red, green, gray, pink, orange, brown, and finally purple. Plastics are synthetic polymers made from a wide range of chemical compounds with different characteristics. The most common polymers identified in this study are, in order of prevalence, polyethylene, high density polyethylene, polyester fiber, ABS plastic (Acrylonitrile Butadiene Styrene), low density polyethylene, polypropylene, polyethylene foam, polypropylene fibers and polyvinyl formal.
In order to try to mitigate or solve the problem of microplastics in Brazil, the entire context must, first of all, be analyzed and understood. This includes issues found in countries as yet incompletely developed, where a large fraction of their populations may not have access to basic or developed sanitation services. This is particularly important in light of the lack of understanding about the risks of MPs to Humankind and, to a lesser extent, to the non-human biota. The impacts of MP particles, especially in the long term, are still poorly understood. It is essential that more research related to the contamination of water resources by MPs be developed in Brazil, a country that occupies an important position in the world ranking of plastic production, consumption and disposal.

Author Contributions

Conceptualization, T.L.D., D.G.d.C., J.A.B.N. and E.M.d.F.; methodology, T.L.D., D.G.d.C., J.A.B.N., M.F.P.L., W.T.V.M. and E.M.d.F.; software, T.L.D., D.G.d.C. and J.A.B.N.; validation, T.L.D., D.G.d.C., J.A.B.N., M.F.P.L., W.T.V.M., C.C.G., A.L.C.d.S. and E.M.d.F.; formal analysis, T.L.D., D.G.d.C., J.A.B.N., M.F.P.L., W.T.V.M., C.C.G. and E.M.d.F.; investigation, T.L.D., D.G.d.C., J.A.B.N., M.F.P.L., W.T.V.M., C.C.G., A.L.C.d.S. and E.M.d.F.; resources, J.A.B.N.; data curation, T.L.D., D.G.d.C., J.A.B.N., M.F.P.L., W.T.V.M., C.C.G., A.L.C.d.S. and E.M.d.F.; writing—original draft preparation, T.L.D., D.G.d.C., J.A.B.N., M.F.P.L., W.T.V.M., C.C.G., A.L.C.d.S. and E.M.d.F.; writing—review and editing, T.L.D., D.G.d.C., J.A.B.N., M.F.P.L., W.T.V.M., C.C.G., A.L.C.d.S. and E.M.d.F.; visualization, C.C.G.; supervision: J.A.B.N.; project administration, J.A.B.N.; funding acquisition, T.L.D., D.G.d.C., J.A.B.N., M.F.P.L., W.T.V.M., C.C.G., A.L.C.d.S. and E.M.d.F. All authors have read and agreed to the published version of the manuscript.

Funding

This research received no external funding.

Institutional Review Board Statement

Not applicable.

Informed Consent Statement

Not applicable.

Data Availability Statement

Not applicable.

Acknowledgments

The authors are grateful for CNPq (Conselho Nacional de Desenvolvimento Científico e Tecnológico), FAPERJ (Fundação Carlos Chagas Filho de Amparo à Pesquisa do Estado do Rio de Janeiro), CAPES (Coordenação de Aperfeiçoamento de Pessoal de Nível Superior), and the Geology and Geophysics Department/LAGEMAR at the Universidade Federal Fluminense for infrastructure and administrative support.

Conflicts of Interest

The authors declare no conflict of interest.

References

  1. Lithner, D.; Larsson, Å.; Dave, G. Environmental and health hazard ranking and assessment of plastic polymers based on chemical composition. Sci. Total Environ. 2011, 409, 3309–3324. [Google Scholar] [CrossRef]
  2. PlasticsEurope. 2018. Annual Review 2017–2018. Available online: https://www.plasticseurope.org/download_file/force/1830/181 (accessed on 28 December 2022).
  3. Galgani, F.; Hanke, G.; Maes, T. Global Distribution, Composition and Abundance of Marine Litter. In Marine Anthropogenic Litter; Bergmann, M., Gutow, L., Klages, M., Eds.; Springer: Cham, Switzerland, 2015. [Google Scholar] [CrossRef]
  4. Waring, R.; Harris, R.; Mitchell, S. Plastic contamination of the food chain: A threat to human health? Maturitas 2018, 115, 64–68. [Google Scholar] [CrossRef] [PubMed]
  5. Lebreton, L.; Slat, B.; Ferrari, F.; Sainte-Rose, B.; Aitken, J.; Marthouse, R.; Hajbane, S.; Cunsolo, S.; Schwarz, A.; Levivier, A.; et al. Evidence that the Great Pacific Garbage Patch is rapidly accumulating plastic. Sci. Rep. 2018, 8, 4666. [Google Scholar] [CrossRef] [PubMed]
  6. Jambeck, J.R.; Geyer, R.; Wilcox, C.; Siegler, T.R.; Perryman, M.; Andrady, A.; Narayan, R.; Law, K.L. Plastic waste inputs from land into the ocean. Science 2015, 347, 768–771. [Google Scholar] [CrossRef]
  7. Ding, Y.; Zou, X.; Wang, C.; Feng, Z.; Wang, Y.; Fan, Q.; Chen, H. The abundance and characteristics of atmospheric microplastic deposition in the northwestern South China Sea in the fall. Atmos. Environ. 2021, 253, 118389. [Google Scholar] [CrossRef]
  8. PlasticEurope. Plastics—The Facts 2020 An Analysis of European Plastics Production, Demand and Waste Data; Plastic Europe: Brussels, Belgium, 2020. [Google Scholar]
  9. Neves, C.V.; Gaylarde, C.C.; Neto, J.A.B.; Vieira, K.S.; Pierri, B.; Waite, C.C.; Scott, D.C.; da Fonseca, E.M. The transfer and resulting negative effects of nano- and micro-plastics through the aquatic trophic web—A discreet threat to human health. Water Biol. Secur. 2022, 1, 100080. [Google Scholar] [CrossRef]
  10. GESAMP; Anderson, A.; Andrady, A.; Arthur, C.; Baker, J.; Bouwman, H.; Gall, S.; Hildalgo-Ruz, V.; Köhler, A.; Lavender Law, K.; et al. Sources, Fate and Effects of Microplastics in the Environment: A Global Assessment; GESAMP Reports&Studies Series; No. 90; International Maritime Organization: London, UK, 2015; Available online: http://www.gesamp.org/data/gesamp/files/media/Publications/Reports_and_studies_90/gallery_2230/object_2500_large.pdf (accessed on 28 December 2022).
  11. Andrady, A.L. Microplastics in the marine environment. Mar. Pollut. Bull. 2011, 62, 1596–1605. [Google Scholar] [CrossRef] [PubMed]
  12. Andrady, A.L. Persistence of Plastic Litter in the Oceans Marine Anthropogenic Litter; Bergmann, M., Gutow, L., Klages, M., Eds.; Springer: Dordrecht, The Netherlands, 2015; pp. 57–72. [Google Scholar]
  13. Xu, C.; Zhang, B.; Gu, C.; Shen, C.; Yin, S.; Aamir, M.; Li, F. Are we underestimating the sources of microplastic pollution in terrestrial environment? J. Hazard. Mater. 2020, 400, 123228. [Google Scholar] [CrossRef]
  14. Barnes, D.K.A.; Galgani, F.; Thompson, R.C.; Barlaz, M. Accumulation and fragmentation of plastic debris in global environments. Philos. Trans. R. Soc. Lond. B Biol. Sci. 2009, 364, 1985–1998. [Google Scholar] [CrossRef] [Green Version]
  15. Santos, I.R.; Friedrich, A.C.; Sul, J.A.I.D. Marine debris contamination along undeveloped tropical beaches from northeast Brazil. Environ. Monit. Assess. 2009, 148, 455–462. [Google Scholar] [CrossRef]
  16. Hirai, H.; Takada, H.; Ogata, Y.; Yamashita, R.; Mizukawa, K.; Saha, M.; Kwan, C.; Moore, C.; Gray, H.; Laursen, D.; et al. Organic micropollutants in marine plastics debris from the open ocean and remote and urban beaches. Mar. Pollut. Bull. 2011, 62, 1683–1692. [Google Scholar] [CrossRef]
  17. Ivar Do Sul, J.A.; Costa, M.F. The present and future of microplastic pollution in the marine environment. Environ. Pollut. 2014, 185, 352–364. [Google Scholar] [CrossRef]
  18. Laglbauer, B.J.; Franco-Santos, R.M.; Andreu-Cazenave, M.; Brunelli, L.; Papadatou, M.; Palatinus, A.; Grego, M.; Deprez, T. Macrodebris and microplastics from beaches in Slovenia. Mar. Pollut. Bull. 2014, 89, 356–366. [Google Scholar] [CrossRef] [PubMed]
  19. Amador, E.S. Bacia da Baía de Guanabara: Características Geoambientais, Formação e Ecossistemas; Interciência: Rio de Janeiro, Brazil, 2012; 432p. [Google Scholar]
  20. Soares-Gomes, A.; da Gama, B.; Neto, J.B.; Freire, D.; Cordeiro, R.; Machado, W.; Bernardes, M.; Coutinho, R.; Thompson, F.; Pereira, R. An environmental overview of Guanabara Bay, Rio de Janeiro. Reg. Stud. Mar. Sci. 2016, 8, 319–330. [Google Scholar] [CrossRef]
  21. Baptista Neto, J.A.; Gingele, F.X.; Leipe, T.; Brehme, I. Spatial distribution of trace elements in surficial sediments from Guanabara Bay–Rio de Janeiro/Brazil. Environ. Geol. 2006, 49, 1051–1063. [Google Scholar] [CrossRef]
  22. Baptista Neto, J.A.; Peixoto, T.C.S.; Smith, B.J.; McAlister, J.J.; Patchineelam, S.M.; Patchineelam, S.R.; Fonseca, E.M. Geochronology and heavy metal flux to Guanabara Bay, Rio de Janeiro state: A preliminary study. Ann. Braz. Acad. Sci. 2013, 85, 1317–1327. [Google Scholar] [CrossRef] [PubMed]
  23. Aguiar, V.M.D.C.; Abuchacra, P.F.F.; Neto, J.A.B.; de Oliveira, A.S. Environmental assessment concerning trace metals and ecological risks at Guanabara Bay, RJ, Brazil. Environ. Monit. Assess. 2018, 190, 448. [Google Scholar] [CrossRef] [PubMed]
  24. Baptista Neto, J.; Fonseca, E.M. Variação sazonal, espacial e composicional de lixo ao longo das praias da margem oriental da Baía de Guanabara (Rio de Janeiro) no período de 1999–2008. Rev. Gestão Costeira Integr. 2011, 11, 31–39. [Google Scholar] [CrossRef]
  25. Bernardino, D.; Franz, B. Lixo flutuante na Baía de Guanabara: Passado, presente e perspectivas para o futuro. Desenvolv. Meio Ambient. 2016, 38, 231–252. [Google Scholar] [CrossRef] [Green Version]
  26. Castro, R.O.; Silva, M.L.; Marques, M.R.C.; de Araújo, F.V. Evaluation of microplastics in Jurujuba Cove, Niterói, RJ, Brazil, an area of mussels farming. Mar. Pollut. Bull. 2016, 110, 555–558. [Google Scholar] [CrossRef]
  27. Figueiredo, G.M.; Vianna, T.M.P. Suspended microplastics in a highly polluted bay: Abundance, size, and availability for mesozooplankton. Mar. Pollut. Bull. 2018, 135, 256–265. [Google Scholar] [CrossRef] [PubMed]
  28. Alves, V.E.; Figueiredo, G.M. Microplastic in the sediments of a highly eutrophic tropical estuary. Mar. Pollut. Bull. 2019, 146, 326–335. [Google Scholar] [CrossRef]
  29. Olivatto, G.P.; Martins, M.C.T.; Montagner, C.C.; Henry, T.B.; Carreira, R.S. Microplastic contamination in surface waters in Guanabara Bay, Rio de Janeiro, Brazil. Mar. Pollut. Bull. 2019, 139, 157–162. [Google Scholar] [CrossRef] [PubMed]
  30. Silva, M.M.; Maldonado, G.C.; Castro, R.O.; Felizardo, J.D.S.; Cardoso, R.P.; dos Anjos, R.M.; de Araújo, F.V. Dispersal of potentially pathogenic bacteria by plastic debris in Guanabara Bay, RJ, Brazil. Mar. Pollut. Bull. 2019, 141, 561–568. [Google Scholar] [CrossRef] [PubMed]
  31. Carvalho, D.G.; Baptista Neto, J.A. Microplastic pollution of the beaches of Guanabara Bay, Southeast Brazil. Ocean Coast. Manag. 2016, 128, 10–17. [Google Scholar] [CrossRef]
  32. Barboza, L.G.A.; Vieira, L.R.; Guilhermino, L. Single and combined effects of microplastics and mercury on juveniles of the European seabass (Dicentrarchus labrax): Changes in behavioural responses and reduction of swimming velocity and resistance time. Environ. Pollut. 2018, 236, 1014–1019. [Google Scholar] [CrossRef]
  33. Rochman, C.M. Microplastics research—From sink to source. Science 2018, 360, 28–29. [Google Scholar] [CrossRef]
  34. Horton, A.A.; Walton, A.; Spurgeon, D.J.; Lahive, E.; Svendsen, C. Microplastics in freshwater and terrestrial environments: Evaluating the current understanding to identify the knowledge gaps and future research priorities. Sci. Total Environ. 2017, 586, 127–141. [Google Scholar] [CrossRef]
  35. Kjerfve, B.; Ribeiro, C.H.A.; Dias, G.T.M.; Filippo, A.M.; Da Silva Quaresma, V. Oceanographic characteristics of an impacted coastal bay: Baía de Guanabara, Rio de Janeiro, Brazil. Cont. Shelf Res. 1997, 17, 1609–1643. [Google Scholar] [CrossRef]
  36. Catanzaro, L.F.; Neto, J.A.B.; Guimarães, M.S.D.; Silva, C.G. Distinctive sedimentary processes in Guanabara Bay—SE/Brazil, based on the analysis of echo-character (7.0 kHz). Braz. J. Geophys. 2004, 22, 69–83. [Google Scholar] [CrossRef]
  37. Fonseca, E.; Neto, J.B.; Pereira, M.; Silva, C.; Junior, J.A. Study of pollutant distribution in the Guaxindiba Estuarine System—SE Brazil. Mar. Pollut. Bull. 2014, 82, 45–54. [Google Scholar] [CrossRef]
  38. Borges, R.C.; Caldas, V.G.; Filho, F.F.L.S.; Ferreira, M.M.; Lapa, C.M.F. Use of GIS for the evaluation of heavy metal contamination in the Cunha Canal watershed and west of the Guanabara Bay, Rio de Janeiro, RJ. Mar. Pollut. Bull. 2014, 89, 75–84. [Google Scholar] [CrossRef] [PubMed]
  39. Rezende, O.M.; Franco, A.B.R.D.C.D.; de Oliveira, A.K.B.; Jacob, A.C.P.; Miguez, M.G. A framework to introduce urban flood resilience into the design of flood control alternatives. J. Hydrol. 2019, 576, 478–493. [Google Scholar] [CrossRef]
  40. Masura, J.; Baker, J.; Foster, G.; Arthur, C.; Herring, C. Laboratory Methods for the Analysis of Microplastics in the Marine Environment: Recommendations for Quantifying Synthetic Particles in Waters And Sediments; NOAA Technical Memorandum NOS-OR&R-48; NOAA Marine Debris Division: Siver Spring, MD, USA, 2015; p. 31. [CrossRef]
  41. McCormick, A.R.; Hoellein, T.J.; London, M.G.; Hittie, J.; Scott, J.W.; Kelly, J.J. Microplastic in surface waters of urban rivers: Concentration, sources, and associated bacterial assemblages. Ecosphere 2016, 7, e01556. [Google Scholar] [CrossRef]
  42. Cowger, W.; Steinmetz, Z.; Gray, A.; Munno, K.; Lynch, J.; Hapich, H.; Primpke, S.; De Frond, H.; Rochman, C.; Herodotou, O. Microplastic Spectral Classification Needs an Open Source Community: Open Specy to the Rescue! Anal. Chem. 2021, 93, 7543–7548. [Google Scholar] [CrossRef]
  43. Napper, I.E.; Baroth, A.; Barrett, A.C.; Bhola, S.; Chowdhury, G.W.; Davies, B.F.; Duncan, E.M.; Kumar, S.; Nelms, S.E.; Niloy, N.H.; et al. The abundance and characteristics of microplastics in surface water in the transboundary Ganges River. Environ. Pollut. 2021, 274, 116348. [Google Scholar] [CrossRef]
  44. Ding, L.; Mao, R.F.; Guo, X.; Yang, X.; Zhang, Q.; Yang, C. Microplastics in surface waters and sediments of the Wei River, in the northwest of China. Sci. Total Environ. 2019, 667, 427–434. [Google Scholar] [CrossRef]
  45. Bertoldi, C.; Lara, L.Z.; Mizushima, F.A.D.L.; Martins, F.C.; Battisti, M.A.; Hinrichs, R.; Fernandes, A.N. First evidence of microplastic contamination in the freshwater of Lake Guaíba, Porto Alegre, Brazil. Sci. Total Environ. 2020, 759, 143503. [Google Scholar] [CrossRef]
  46. Wang, J.; Liu, X.; Li, Y.; Powell, T.; Wang, X.; Wang, G.; Zhang, P. Microplastics as contaminants in the soil environment: A mini-review. Sci. Total Environ. 2019, 691, 848–857. [Google Scholar] [CrossRef]
  47. Rillig, M.C.; Lehmann, A.; Machado, A.A.D.S.; Yang, G. Microplastic effects on plants. New Phytol. 2019, 223, 1066–1070. [Google Scholar] [CrossRef]
  48. Helmberger, M.S.; Tiemann, L.K.; Grieshop, M.J. Towards an ecology of soil microplastics. Funct. Ecol. 2019, 34, 550–560. [Google Scholar] [CrossRef]
  49. Mani, T.; Burkhardt-Holm, P. Seasonal microplastics variation in nival and pluvial stretches of the Rhine River—From the Swiss catchment towards the North Sea. Sci. Total Environ. 2020, 707, 135579. [Google Scholar] [CrossRef] [PubMed]
  50. Rodrigues, M.; Abrantes, N.; Gonçalves, F.; Nogueira, H.; Marques, J.; Gonçalves, A. Spatial and temporal distribution of microplastics in water and sediments of a freshwater system (Antuã River, Portugal). Sci. Total Environ. 2019, 633, 1549–1559. [Google Scholar] [CrossRef]
  51. Gago, J.; Carretero, O.; Filgueiras, A.V.; Viñas, L. Synthetic microfibers in the marine environment: A review on their occurrence in seawater and sediments. Mar. Pollut. Bull. 2018, 127, 365–376. [Google Scholar] [CrossRef]
  52. Yang, L.; Zhang, Y.; Kang, S.; Wang, Z.; Wu, C. Microplastics in soil: A review on methods, occurrence, sources, and potential risk. Sci. Total Environ. 2021, 780, 146546. [Google Scholar] [CrossRef] [PubMed]
  53. Dris, R.; Imhof, H.; Sanchez, W.; Gasperi, J.; Galgani, F.; Tassin, B.; Laforsch, C. Beyond the ocean: Contamination of freshwater ecosystems with (micro-)plastic particles. Environ. Chem. 2015, 12, 539–550. [Google Scholar] [CrossRef]
  54. Browne, M.A. Sources and Pathways of Microplastics to Habitats. In Marine Anthropogenic Litter; Bergmann, M., Gutow, L., Klages, M., Eds.; Springer: Cham, Switzerland, 2015. [Google Scholar] [CrossRef]
  55. Kapp, K.J.; Yeatman, E. Microplastic hotspots in the Snake and Lower Columbia rivers: A journey from the Greater Yellowstone Ecosystem to the Pacific Ocean. Environ. Pollut. 2018, 241, 1082–1090. [Google Scholar] [CrossRef]
  56. Wang, C.; Xing, R.; Sun, M.; Ling, W.; Shi, W.; Cui, S.; An, L. Microplastics profile in a typical urban river in Beijing. Sci. Total Environ. 2020, 743, 140708. [Google Scholar] [CrossRef]
  57. Harpah, N.; Ageng, P.; Addauwiyah, R.; Rizki, A.; Perdana, Z.; Suryati, I.; Leonardo, R.; Husin, A.; Faisal, M. Microplastic pollution in Deli River Medan. IOP Conf. Series Earth Environ. Sci. 2021, 802, 012019. [Google Scholar] [CrossRef]
  58. Gaylarde, C.; Baptista-Neto, J.A.; da Fonseca, E.M. Plastic microfibre pollution: How important is clothes’ laundering? Heliyon 2021, 7, e07105. [Google Scholar] [CrossRef]
  59. Wong, G.; Lowemark, L.; Kunz, A. Microplastic pollution of the Tamsui River and its tributaries in northern Taiwan: Spatial heterogeneity and correlation with precipitation. Environ. Pollut. 2020, 260, 113935. [Google Scholar] [CrossRef] [PubMed]
  60. Pariatamby, A.; Hamid, F.S.; Bhatti, M.S.; Anuar, N.; Anuar, N. Status of Microplastic Pollution in Aquatic Ecosystem with a Case Study on Cherating River, Malaysia. J. Eng. Technol. Sci. 2020, 52, 222. [Google Scholar] [CrossRef]
  61. Eo, S.; Hong, S.H.; Song, Y.K.; Han, G.M.; Shim, W.J. Spatiotemporal Distribution and Annual Load of Microplastics in the Nakdong River, South Korea. Water Res. 2019, 160, 228–237. [Google Scholar] [CrossRef] [PubMed]
  62. Kataoka, T.; Nihei, Y.; Kudou, K.; Hinata, H. Assessment of the sources and inflow processes of microplastics in the river environments of Japan. Environ. Pollut. 2019, 244, 958–965. [Google Scholar] [CrossRef]
  63. Mccormick, A.R.; Hoellein, T.J.; Mason, S.A.; Schluep, J.; Kelly, J.J. Microplastic is an Abundant and Distinct Microbial Habitat in an Urban River. Environ. Sci. Technol. 2014, 48, 11863–11871. [Google Scholar] [CrossRef]
  64. Hogue, C. Microplastic Beads Pollute Great Lakes. Chem. Eng. News 2013, 91, 23–25. [Google Scholar] [CrossRef]
  65. Weithmann, N.; Möller, J.N.; Löder, M.G.J.; Piehl, S.; Laforsch, C.; Freitag, R. Organic fertilizer as a vehicle for the entry of microplastic into the environment. Sci. Adv. 2018, 4, eaap8060. [Google Scholar] [CrossRef] [Green Version]
  66. Akkajit, P.; Khongsang, A. Distribution of Microplastics along Mai Khao Coastline, Phuket. J. Eng. Technol. Sci. 2022, 54, 220105. [Google Scholar] [CrossRef]
  67. Rummel, C.D.; Löder, M.G.J.; Fricke, N.F.; Lang, T.; Griebeler, E.-M.; Janke, M.; Gerdts, G. Plastic ingestion by pelagic and demersal fish from the North Sea and Baltic Sea. Mar. Pollut. Bull. 2016, 102, 134–141. [Google Scholar] [CrossRef]
  68. Rios-Fuster, B.; Alomar, C.; Compa, M.; Guijarro, B.; Deudero, S. Anthropogenic particles ingestion in fish species from two areas of the western Mediterranean Sea. Mar. Pollut. Bull. 2019, 144, 325–333. [Google Scholar] [CrossRef]
  69. Thetford, D.; Chorlton, A.; Hardman, J. Synthesis and properties of some polycyclic barbiturate pigments. Dye. Pigment. 2003, 59, 185–191. [Google Scholar] [CrossRef]
  70. Duncan, E.M.; Arrowsmith, J.; Bain, C.; Broderick, A.C.; Lee, J.; Metcalfe, K.; Pikesley, S.K.; Snape, R.T.; van Sebille, E.; Godley, B.J. The true depth of the Mediterranean plastic problem: Extreme microplastic pollution on marine turtle nesting beaches in Cyprus. Mar. Pollut. Bull. 2018, 136, 334–340. [Google Scholar] [CrossRef] [PubMed]
  71. Wang, F.; Wong, C.; Chen, D.; Lu, X.; Wang, F.; Zeng, E.Y. Interaction of toxic chemicals with microplastics: A critical review. Water Res. 2018, 139, 208–219. [Google Scholar] [CrossRef]
  72. Fries, E.; Dekiff, J.H.; Willmeyer, J.; Nuelle, M.-T.; Ebert, M.; Remy, D. Identification of polymer types and additives in marine microplastic particles using pyrolysis-GC/MS and scanning electron microscopy. Environ. Sci. Process. Impacts 2013, 15, 1949–1956. [Google Scholar] [CrossRef]
  73. Nascimento, M.; Oliveira-Santos, A.; Cunha, D.; Felix, L.; Gomes, G.; Rangel, C.; Hauser-Davis, R.; Fonseca, E.; Maia-Bila, D.; Baptista-Neto, J.A. Endocrine disruptors, estrogenic activity by the YES bioassay, and acute toxicity in Southeastern Brazil metropolitan surface waters. Geochim. Bras. 2022, 36, 1–14. [Google Scholar] [CrossRef]
  74. Hahladakis, J.N.; Velis, C.A.; Weber, R.; Iacovidou, E.; Purnell, P. An overview of chemical additives present in plastics: Migration, release, fate and environmental impact during their use, disposal and recycling. J. Hazard. Mater. 2018, 344, 179–199. [Google Scholar] [CrossRef]
  75. Groh, K.J.; Backhaus, T.; Carney-Almroth, B.; Geueke, B.; Inostroza, P.A.; Lennquist, A.; Leslie, H.A.; Maffini, M.; Slunge, D.; Trasande, L.; et al. Overview of known plastic packaging-associated chemicals and their hazards. Sci. Total Environ. 2018, 651, 3253–3268. [Google Scholar] [CrossRef]
  76. Liu, K.; Wang, X.; Song, Z.; Wei, N.; Li, D. Terrestrial plants as a potential temporary sink of atmospheric microplastics during transport. Sci. Total Environ. 2020, 742, 140523. [Google Scholar] [CrossRef] [PubMed]
  77. Tang, G.; Liu, M.; Zhou, Q.; He, H.; Chen, K.; Zhang, H.; Hu, J.; Huang, Q.; Luo, Y.; Ke, H.; et al. Microplastics and polycyclic aromatic hydrocarbons (PAHs) in Xiamen coastal areas: Implications for anthropogenic impacts. Sci. Total Environ. 2018, 634, 811–820. [Google Scholar] [CrossRef]
  78. Hüffer, T.; Weniger, A.-K.; Hofmann, T. Sorption of organic compounds by aged polystyrene microplastic particles. Environ. Pollut. 2018, 236, 218–225. [Google Scholar] [CrossRef]
  79. Zhou, Q.; Tian, C.; Luo, Y. Various forms and deposition fluxes of microplastics identified in the coastal urban atmosphere. Chin. Sci. Bull. 2017, 62, 3902–3909. [Google Scholar] [CrossRef]
  80. Hodson, M.E.; Duffus-Hodson, C.A.; Clark, A.; Prendergast-Miller, M.T.; Thorpe, K.L. Plastic Bag Derived-Microplastics as a Vector for Metal Exposure in Terrestrial Invertebrates. Environ. Sci. Technol. 2017, 51, 4714–4721. [Google Scholar] [CrossRef] [PubMed]
  81. Holmes, L.A.; Turner, A.; Thompson, R.C. Adsorption of trace metals to plastic resin pellets in the marine environment. Environ. Pollut. 2012, 160, 42–48. [Google Scholar] [CrossRef]
  82. Rochman, C.M.; Hoh, E.; Hentschel, B.T.; Kaye, S. Long-Term Field Measurement of Sorption of Organic Contaminants to Five Types of Plastic Pellets: Implications for Plastic Marine Debris. Environ. Sci. Technol. 2012, 47, 1646–1654. [Google Scholar] [CrossRef]
  83. Debroas, D.; Mone, A.; Ter Halle, A. Plastics in the North Atlantic garbage patch: A boat-microbe for hitchhikers and plastic degraders. Sci. Total Environ. 2017, 599, 1222–1232. [Google Scholar] [CrossRef]
  84. Murphy, L.; Germaine, K.; Dowling, D.N.; Kakouli-Duarte, T.; Cleary, J. Association of Potential Human Pathogens with Microplastics in Freshwater Systems. In Proceedings of the 2nd International Conference on Microplastic Pollution in the Mediterranean Sea, Capri, Italy, 15–18 September 2019; ICMPMS 2019; Cocca, M., Di Pace, E., Errico, M.E., Gentile, G., Montarsolo, A., Mossotti, R., Avella, M., Eds.; Springer: Cham, Switzerland, 2020. [Google Scholar] [CrossRef]
  85. Cole, M.; Lindeque, P.; Halsband, C.; Galloway, T.S. Microplastics as contaminants in the marine environment: A review. Mar. Pollut. Bull. 2011, 62, 2588–2597. [Google Scholar] [CrossRef] [PubMed]
  86. Liu, M.; Lu, S.; Song, Y.; Lei, L.; Hu, J.; Lv, W.; Zhou, W.; Cao, C.; Shi, H.; Yang, X.; et al. Microplastic and mesoplastic pollution in farmland soils in suburbs of Shanghai, China. Environ. Pollut. 2018, 242, 855–862. [Google Scholar] [CrossRef] [PubMed]
  87. Graca, B.; Szewc, K.; Zakrzewska, D.; Dołęga, A.; Szczerbowska-Boruchowska, M. Sources and fate of microplastics in marine and beach sediments of the Southern Baltic Sea—A preliminary study. Environ. Sci. Pollut. Res. 2017, 24, 7650–7661. [Google Scholar] [CrossRef] [PubMed] [Green Version]
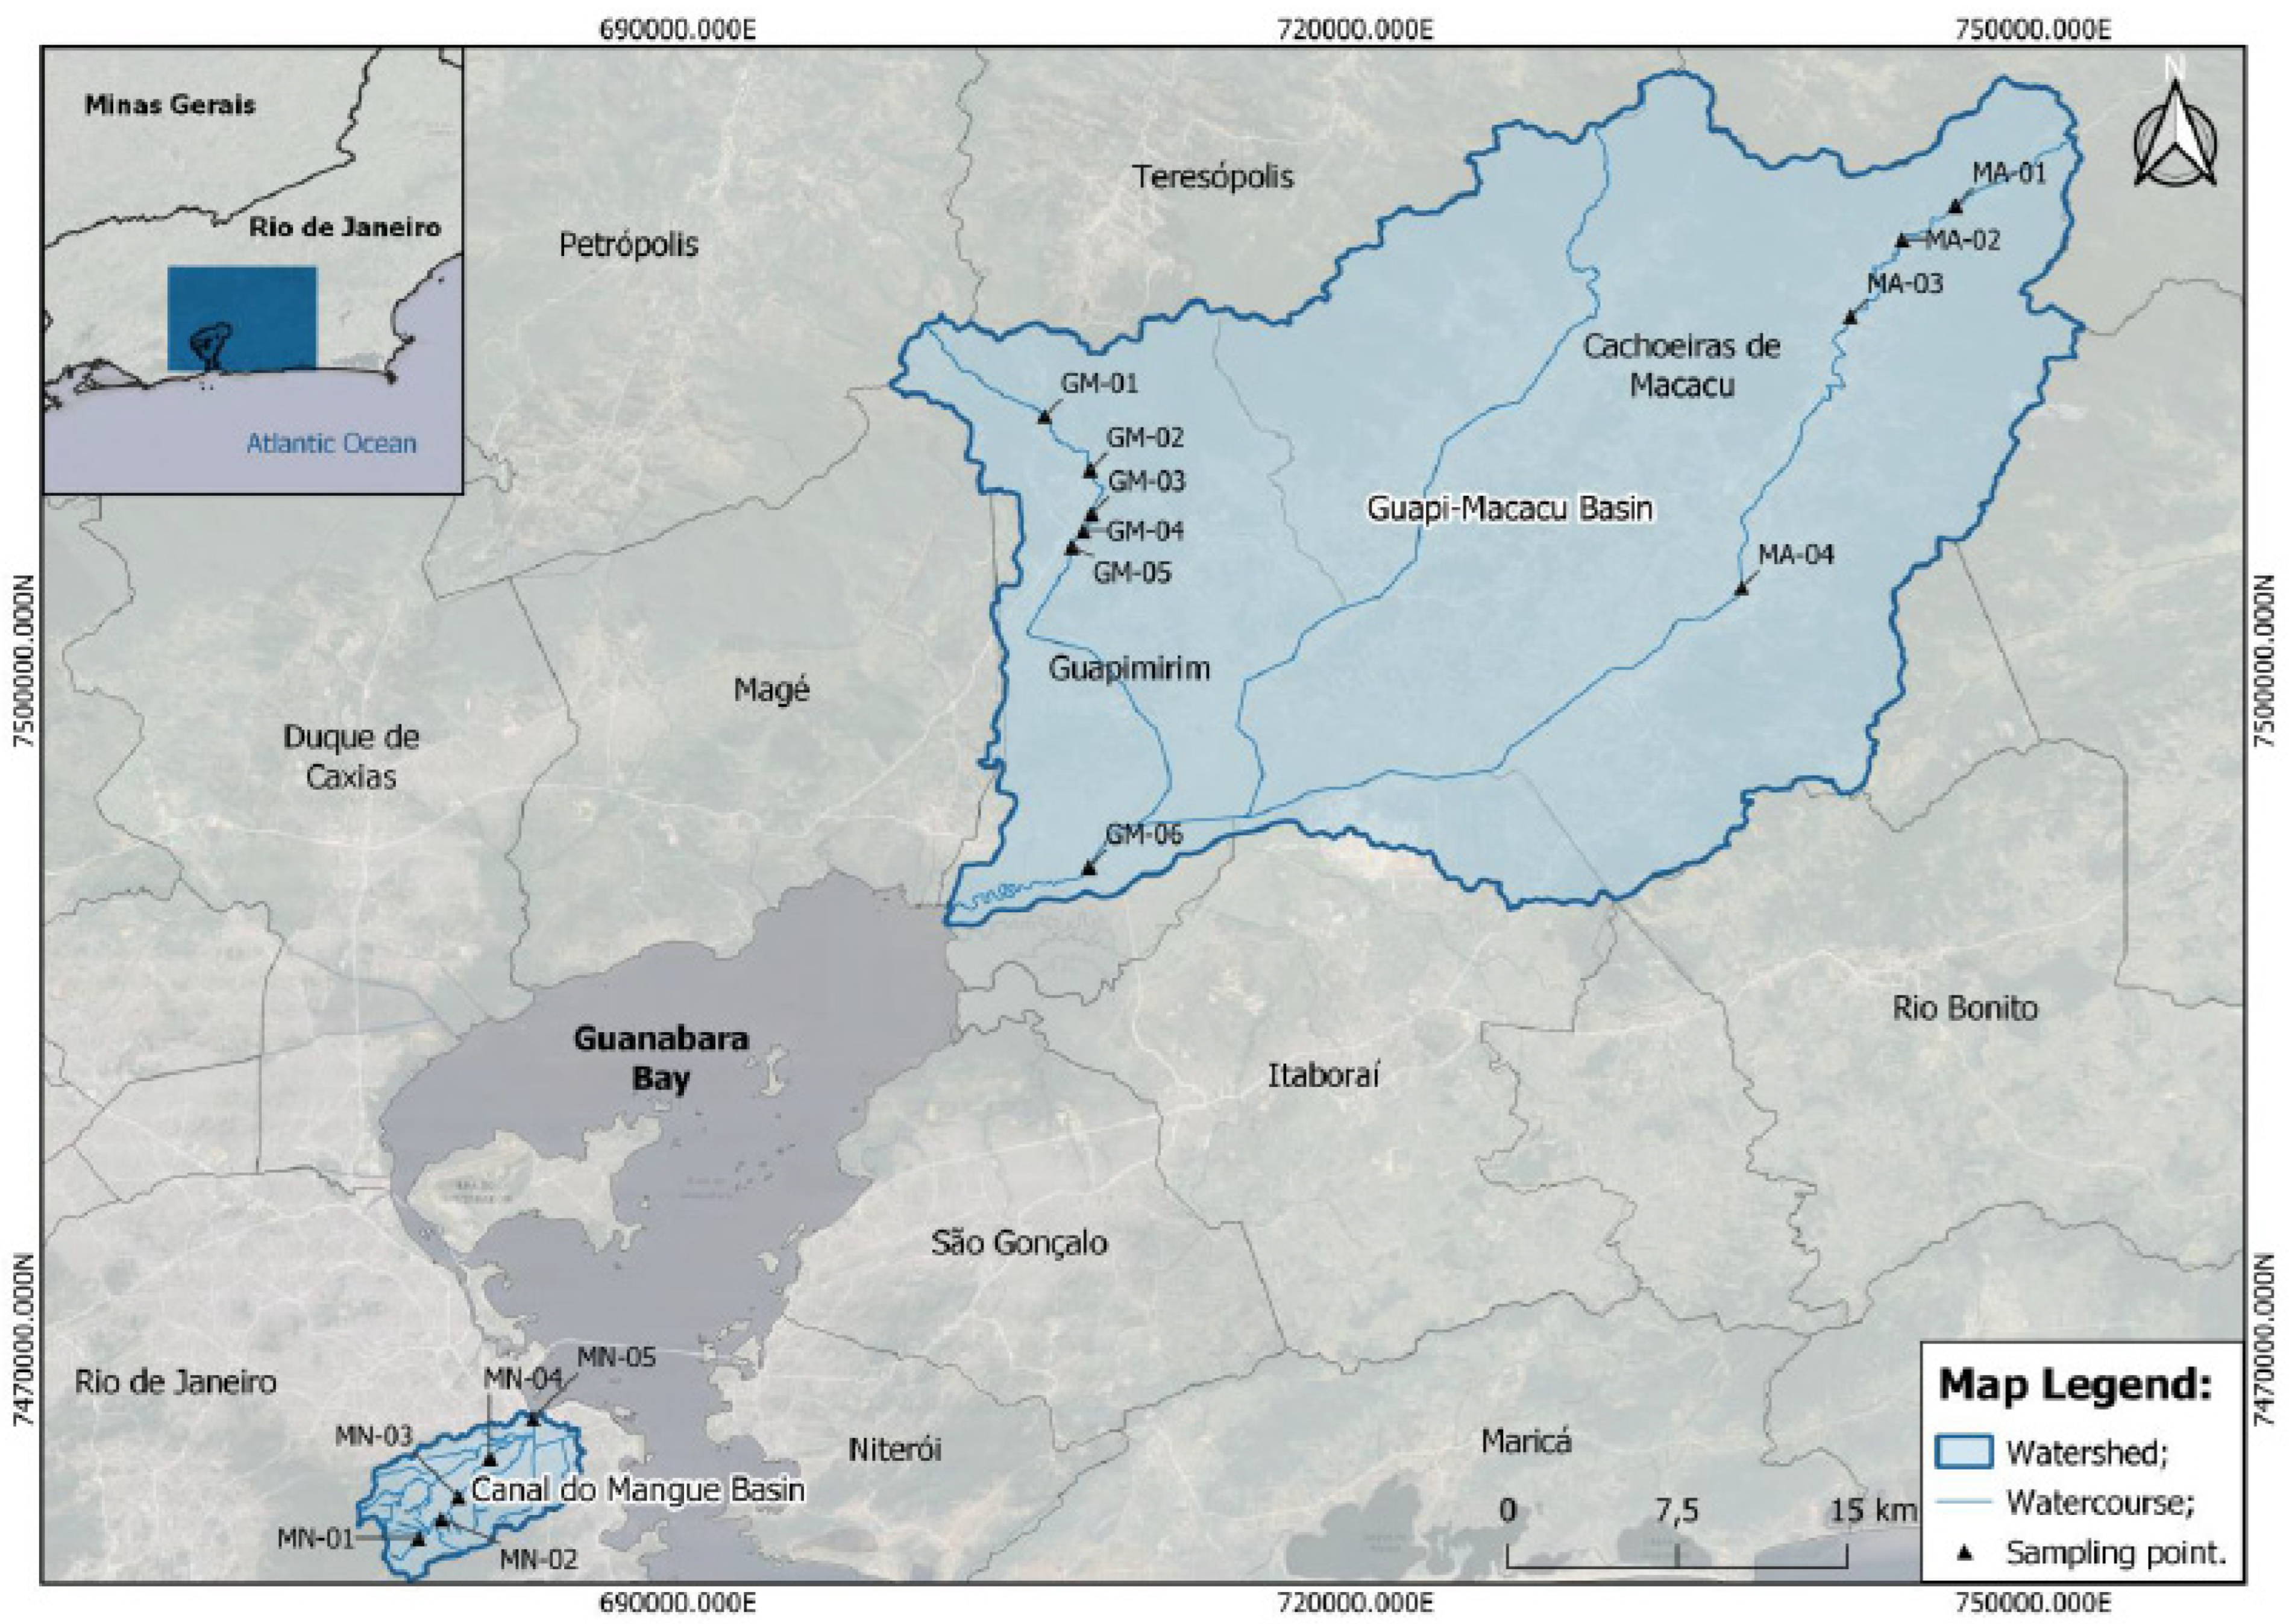
Figure 1. Sampling site in the watershed around Guanabara Bay in the State of Rio de Janeiro State, Brazil.
Micro 03 00015 g001
Figure 2. Images of microplastics found in River’s water in the studied area.
Micro 03 00015 g002
Figure 3. Microplastic color abundance in the water of the three studied rivers.
Micro 03 00015 g003
Figure 4. Total of the microplastic color abundance in the water found in the area.
Micro 03 00015 g004
Figure 5. Types and number of polymers found in the studied area.
Micro 03 00015 g005
Table 1. Coordinates of the stations.
StationsLongitudeLatitude
MA-01−42.605−22.4069
MA-02−42.6278−22.4209
MA-03−42.6494−22.4517
MA-04−42.6943−22.5608
GM-01−42.9953−22.4964
GM-02−42.9755−22.5176
GM-03−42.9745−22.5351
GM-04−42.978−22.5418
GM-05−42.983−22.5485
GM-06−42.9737−22.6762
MN-01−43.2591−22.9475
MN-02−43.2494−22.9397
MN-03−43.2423−22.9309
MN-04−43.2288−22.9152
MN-05−43.2104−22.8991
Table 2. Quantity of microplastics and morphology found per sample.
StationsStyrofoamFragmentFilmFiberPelletTotal
MA-01031471088
MA-0203153790397
MA-03027491640240
MA-04017411740232
GM-01013181070138
GM-0209221560187
GM-0302137813142
GM-04015160076
GM-05027271320186
GM-060514911111
MN-018381812800507
MN-02162752168154714007
MN-0335892774794884
MN-0494215326257213208
MN-0582190280175532310
Table 3. Abundance of microplastic particles in the water column of rivers in several countries.
No.Study AreaAbundance (Items m−3)Reference
1.Koshi River, China50–325[52] Yang et al. (2021)
2.Dahan River, Taiwan6.7–83.7[59] Wong et al. (2020)
3.Cherating River, Malaysia0.005–0.007[60] Pariatamby et al. (2020)
4.Nakdong River, Republic of Korea293–4760[61] Eo et al. (2019)
5.Japanese Rivers, Japan0-12[62] Kataoka et al. (2019)
6.Columbia Rivers, USA0–13.7[59] Kapp e Yeatman (2018)
7.Antuã River, Portugal58–1265[50] Rodrigues et al. (2019)
8.Sena and Marne Rivers, France4–108[53] Dris et al. (2015)
9.Chicago River, USA1.94–17.93[63] McCormick et al. (2014)
10.Macacu River, Brazil7.1–32.5present study
11.Guapimirm River, Brazil3.6–1179.6present study
12.Maracanã River, Brazil17.6–51,166.5present study
Table 4. Quantity of microplastics identified per m3.
StationsVolume (m³)ItemsItems m−3
GM-0135.2724601383.9
GM-0251.4188501873.6
GM-0336.4978701423.9
GM-040.23540876322.8
GM-050.1576741861179.6
GM-060.306353111362.3
MA-013.7149278823.7
MA-0212.22830239732.5
MA-0320.55141624011.7
MA-0432.5926822327.1
MN-0128.81648450717.6
MN-026.6946084007598.5
MN-034.840370884182.6
MN-043.7471753208856.1
MN-050.045147231051,166.5
Disclaimer/Publisher’s Note: The statements, opinions and data contained in all publications are solely those of the individual author(s) and contributor(s) and not of MDPI and/or the editor(s). MDPI and/or the editor(s) disclaim responsibility for any injury to people or property resulting from any ideas, methods, instructions or products referred to in the content.