Article

Fluorescence Sensing of Some Important Nitroaromatic Compounds by Using Polyaniline Ag Composite

by
Satish Ashok Ture
1,
Shruthy D. Pattathil
2,3,
Bertrand Zing Zing
2,4 and
Venkataraman Abbaraju
1,2,*
1
Department of Chemistry, Gulbarga University, Kalaburagi 585106, India
2
Materials Chemistry Laboratory, Department of Materials Science, Gulbarga University, Kalaburagi 585106, India
3
Bhavan’s Vivekananda College of Science, Humanities & Commerce, Sainikpuri, Secunderabad 500094, India
4
Institute of Agricultural Research for Development, Yaoundé P.O. Box 2123, Cameroon
*
Author to whom correspondence should be addressed.
Micro 2023, 3(1), 224-238; https://doi.org/10.3390/micro3010016
Submission received: 23 December 2022 / Revised: 1 February 2023 / Accepted: 6 February 2023 / Published: 9 February 2023

Abstract

:
Conducting polymers (CPs) have contributed significantly to the field of sensing. The sensing of nitroaromatic compounds by fluorescence has recently gained more attention due to its sensitivity and selectivity. In this study, polyaniline (PANI) was functionalized by forming a polyaniline-Ag (PANI-Ag) composite and used as a fluorophore for sensing. The nitro groups present in nitroaromatic compounds (NACs) such as 2,4,6-trinitrophenol (picric acid-TNP) and Dinitrobenzene (DNB) act as electron-accepting molecules and quench the fluorescence of polymer chains by showing an amplified quenching effect in which trace amounts of electron-accepting NACs quench emissions of several fluorophore units. The PANI-Ag composite synthesized by interfacial polymerization was analyzed using UV-vis spectroscopy and Fourier-transform infrared (FTIR) spectroscopy for determination of molecular structure; X-ray powder diffraction (XRD) and scanning electron microscopy (SEM/EDAX) for its morphology, which is cubic crystalline silver; and thermogravimetric analysis (TGA) for the thermal stability. The fluorescence quenching mechanism was deduced from the Stern–Volmer plot. The quenching constant value (Ksv) obtained from the Stern–Volmer (S–V) plot was found to be Ksv = 0.1037 × 10⁶ M−1 (TNP) and Ksv = 0.161 × 10⁴ M−1 (DNB). The plot shows a single mechanism with formation of an exciplex complex for TNP with a photoinduced electron transfer (PET) mechanism. The limit of detection (LOD) is found to be TNP = 5.58 × 10⁻⁷ M, whereas DNB = 23.30 × 10⁻⁶ M shows that the PANI-Ag composite is a potential fluorophore for sensing of nitroaromatic compounds in trace levels.

1. Introduction

Nitroaromatic compounds (NACs) are primarily used in military and commercial applications such as explosives, landmines, detonators, and in different industries and may ignite and explode due to spark, friction, or heat. Among the NACs, the TNP is the most dangerous as it has a low safety coefficient and is widely used in explosives with high detonation velocity and various industries. The NACs react with concrete, oxidizing materials, metals, and bases to form unstable by-products. The by-products resulting from their preparation and degradation are harmful pollutants for soil and water where they are released or stored [1]. Since these NACs are also used in terrorist activities, detection of NACs is important for safeguarding citizens [2]. In this regard, known techniques such as Raman spectroscopy, ion mobility spectroscopy, mass spectroscopy, chromatography, and electrochemical technique are used for detecting NACs, but these techniques are expensive and require intensive training [3,4]. Among all these techniques, the fluorescence technique is the most sensitive technique which can be used for high energy materials (HEMs) detection. Fluorescence-based detection is the simplest, sensitive, selective, and most interesting technique, where the electron donor and acceptor groups play an important role. In employing fluorescence quenching of conjugated polymers to detect NACs, the electron-accepting nature of nitroaromatics is used for their detection using fluorescent-conjugated polymer. Fluorescence-based detection is again classified into turn-on and turn-off techniques. Swager and co-workers used nicotinamide adenine dinucleotide NADH analog 10-methyl-9, 10- dihydroacridine (AcrH2) to form (AcrH+) during photoreduction with 1,3,5-trinitro-1,3,5-triazinane (RDX), and Pentaerythritol tetranitrate (PETN) activates fluorescence to show the turn-on mechanism [5]. Pandya et al. designed a sensitive nanocurcumin-based nanomaterial to detect trace amounts of 2,4,6-trinitrotoluene (TNT) by the formation of nano aggregation through nanomaterial surface energy transfer (NSET) [6]. Samuel et al. developed a fluorophore diisopropyl carbodiimide fluorophore for detecting TNP through a miniaturized fiber-optic fluorescence analyzer, wherein the nano concentration of TNP forms a Meisenheimer complex and shows a turn-on mechanism with a detection limit of 100 nM [7]. These turn-on mechanisms lack sensitivity, which can be overcome by the fluorescence turn-off mechanism. The fluorescence quenching process involves several mechanisms including PET (photoinduced electron transfer) or fluorescence resonance electron transfer (FRET) mechanism. The π- conjugate molecules with excellent fluorescence properties are widely used for sensing nitroaromatic compounds with high sensitivity [8,9]. Xing et al. synthesized an amino-functionalized Zn-MOF for detecting TNP through fluorescence quenching with an LOD of 5.6 × 10⁻⁷ M [10]. Zhanga and co-workers used a naphthalene-based fluorescent probe by intramolecular charge transfer emission with Tris-ClO4 buffer solution for the detection of TNP and obtained an LOD of 5.3 nM [11]. Ma et al. employed three different core–shell porous aromatic frameworks of pyrene to detect the specific analyte by a donor–acceptor electron-transfer mechanism with a fluorescence quenching of Ksv = 2.42 × 10⁻² ppm for TNP [12]. Wang et al. used di-carboxylic acid-based hydrogen-bonded organic frameworks (HOF) with emission unit 9-phenylcarbazole for the detection of TNP and obtained an LOD of 60 nm [13]. Yang et al. used lanthanide-based MOF with terephthalic acid ligand fluorophore to detect TNP at an LOD of 1 × 10⁻⁵ M [14]. Other techniques for sensing NACs have been reported in the literature. For instance, Rao and co-workers employed surface-enhanced Raman spectroscopy with a gold-coated silver substrate for detecting TNP at 360 nm [15]. The stripping voltammetry technique developed by Talwar and co-workers for the detection of HEMs (such as TNT, RDX, HMX, and PETN) using tetrabutylammonium bromide with a fixed voltage scan to the electrode showed changes in reduction and oxidation current and achieved selective detection up to trace levels [16].
In recent years, conducting polymers (CPs) have received extensive attention in optoelectronic devices and other applications because of their cost-effectiveness, sensitivity, processability, etc. Because of their structural versatility, conducting polymers are also used as fluorescence-based detectors for biomaterials [17]. Conduction in CPs is caused by conjugation (alternative double bond and single bond), which has a small HOMO to LUMO energy band gap, forming electron–hole pairs that delocalize throughout the polymer chain. On photoexcitation, electrons jump from the highest occupied molecular orbital (HOMO) to the lowest unoccupied molecular orbital (LUMO), resulting in the formation of an excited state, which is then de-excited to produce fluorescence emission and is used as a detector [18]. Polyaniline is one of the most studied conducting polymers due to its ease of synthesis, stability, and good physical and chemical properties, which can be controlled by doping. Raghupathy et al. showed PANI is used in various sensor applications due to its conducting and electrochemical properties [19]. The literature contains reports on PANI-based compounds used to detect NACs by using various PANI properties. Wang et al. used a photothermal detection technique by using a fabricated PANI-based paper sensor to detect TNT and obtained a visible change in photothermal images as low as 14 ng/cm2 by forming a Meisenheimer complex with PANI, forming a brown solution having absorption peaks of 437 nm and 775 nm, demonstrating the NIR photothermal effect [20]. Zhang et al. used a chemiresistive property to prepare flexible PANI-coated filter paper by spraying and achieved improved conductivity for sensing of vapor NACs with response times as low as 8.1 s. The NACs adsorbed on the PANI take electrons from PANI and increase the entire carrier [21]. Sung et al. used a fabricated PANI-MWNTs (multi-walled carbon nanotubes) composite as a chemiresistive sensor material for NACs gases by the change in resistivity showing high sensitivity with specific molecular detection [22]. Kar et al. used poly (m-aminophenol)/silver nanorod composite-based paper strips for sensing of TNP with a dip process in DMSO solution, studied resistivity changes, and obtained lower resistivity for TNP with selective detection [23].
According to literature reviews, polymer-based composites improve optical properties in sensors by forming an inner surface, porosity, and large surface area, which increases interaction for the detection of analyte and has increased mechanical strength, durability, and thermal conductivity [24]. The composites improve the fluorescent response and accuracy while decreasing the luminescence quantum yield. These improved properties are achieved on these composites through covalent and non-covalent interactions (such as hydrogen bonding and π-π stacking) in composites [25].
In the present study, the fluorescence property of PANI for sensing NACs and understanding its interaction with the polymer during fluorescence quenching is shown in Figure 1. The PANI acts as a fluorophore having benzenoid and quinoid units in which the benzenoid group contributes the fluorescence to the polymer chain, whereas the quinoid unit has a short-lived excited state without fluorescence and quenches some of the fluorescence emission adjacent to the benzenoid unit of PANI [26]. The PANI with variable oxidation states, i.e., pernigraniline, a fully oxidized form with an equal number of benzenoid and quinoid units; emeraldine, a partially reduced form having a higher number of benzenoid units compared with the quinoid units; and luecoemeraldine, a fully reduced form, have a complete polymer chain containing benzenoid units [27]. These help in distinguishing between different analytes based on the fluorescence quenching and by changes in oxidation potential to select the suitable analyte by developing a toolkit for sensitive and selective sensing. In this work, we employed polyaniline as a PANI-Ag composite with enhanced physical, chemical, and optoelectronic properties such as thermal stability, conductivity, dielectric properties, and fluorescence property. The PANI-Ag composite was used as a fluorophore for quenching studies by using NACs such as 2,4,6- trinitrophenol (TNP) and dinitrobenzene (DNB), and understood the mechanisms of interaction by employing various characterization techniques. Here the PANI-Ag composite with conjugation undergoes quenching with the NACs where the nitro groups in the NACs accept the electrons from the fluorophore and show fluorescence quenching with a molecular wire effect. The single receptor NACs reduce the transport property of exciton by accepting electrons to quench fluorescence to a large extent and enhance the chemo response of the sensor [28].

2. Materials and Methods

Synthesis of PANI-Ag Composites via Interfacial Polymerization

The PANI-Ag composite was synthesized by interfacial polymerization as shown in Figure 2 [29] using the chemical oxidation method by APS (ammonium persulfate-(NH4)2S2O8). All chemicals, solvents used were of analytical grade from S D Fine Chem limited, India. An amount of 0.1 M of AgNO3 was dissolved in 1.0 M HNO3 and added to the organic phase, which contains aniline in CHCl3 (chloroform). Then, 0.1 M of ammonium persulfate dissolved in 1.0 M of HNO3 solution was added slowly to the solution and then stirred for 4 h until a dark green solid was formed slowly at the interface and then gradually diffused into the aqueous phase after 24 h. Then, the aqueous layer was separated from the organic layer (orange color/little brownish color), filtered, and washed with ethanol and water to remove unreacted aniline. The compound was dried at 40 °C for 36 h and the dried PANI-Ag composite sample was used for characterization and further studies. During polymerization, the Ag+ (from AgNO3) reacts and reduces to Ag0, which interacts with PANI to form the PANI-Ag composite that is confirmed by characterization techniques [29,30].

3. Results

3.1. FTIR Studies

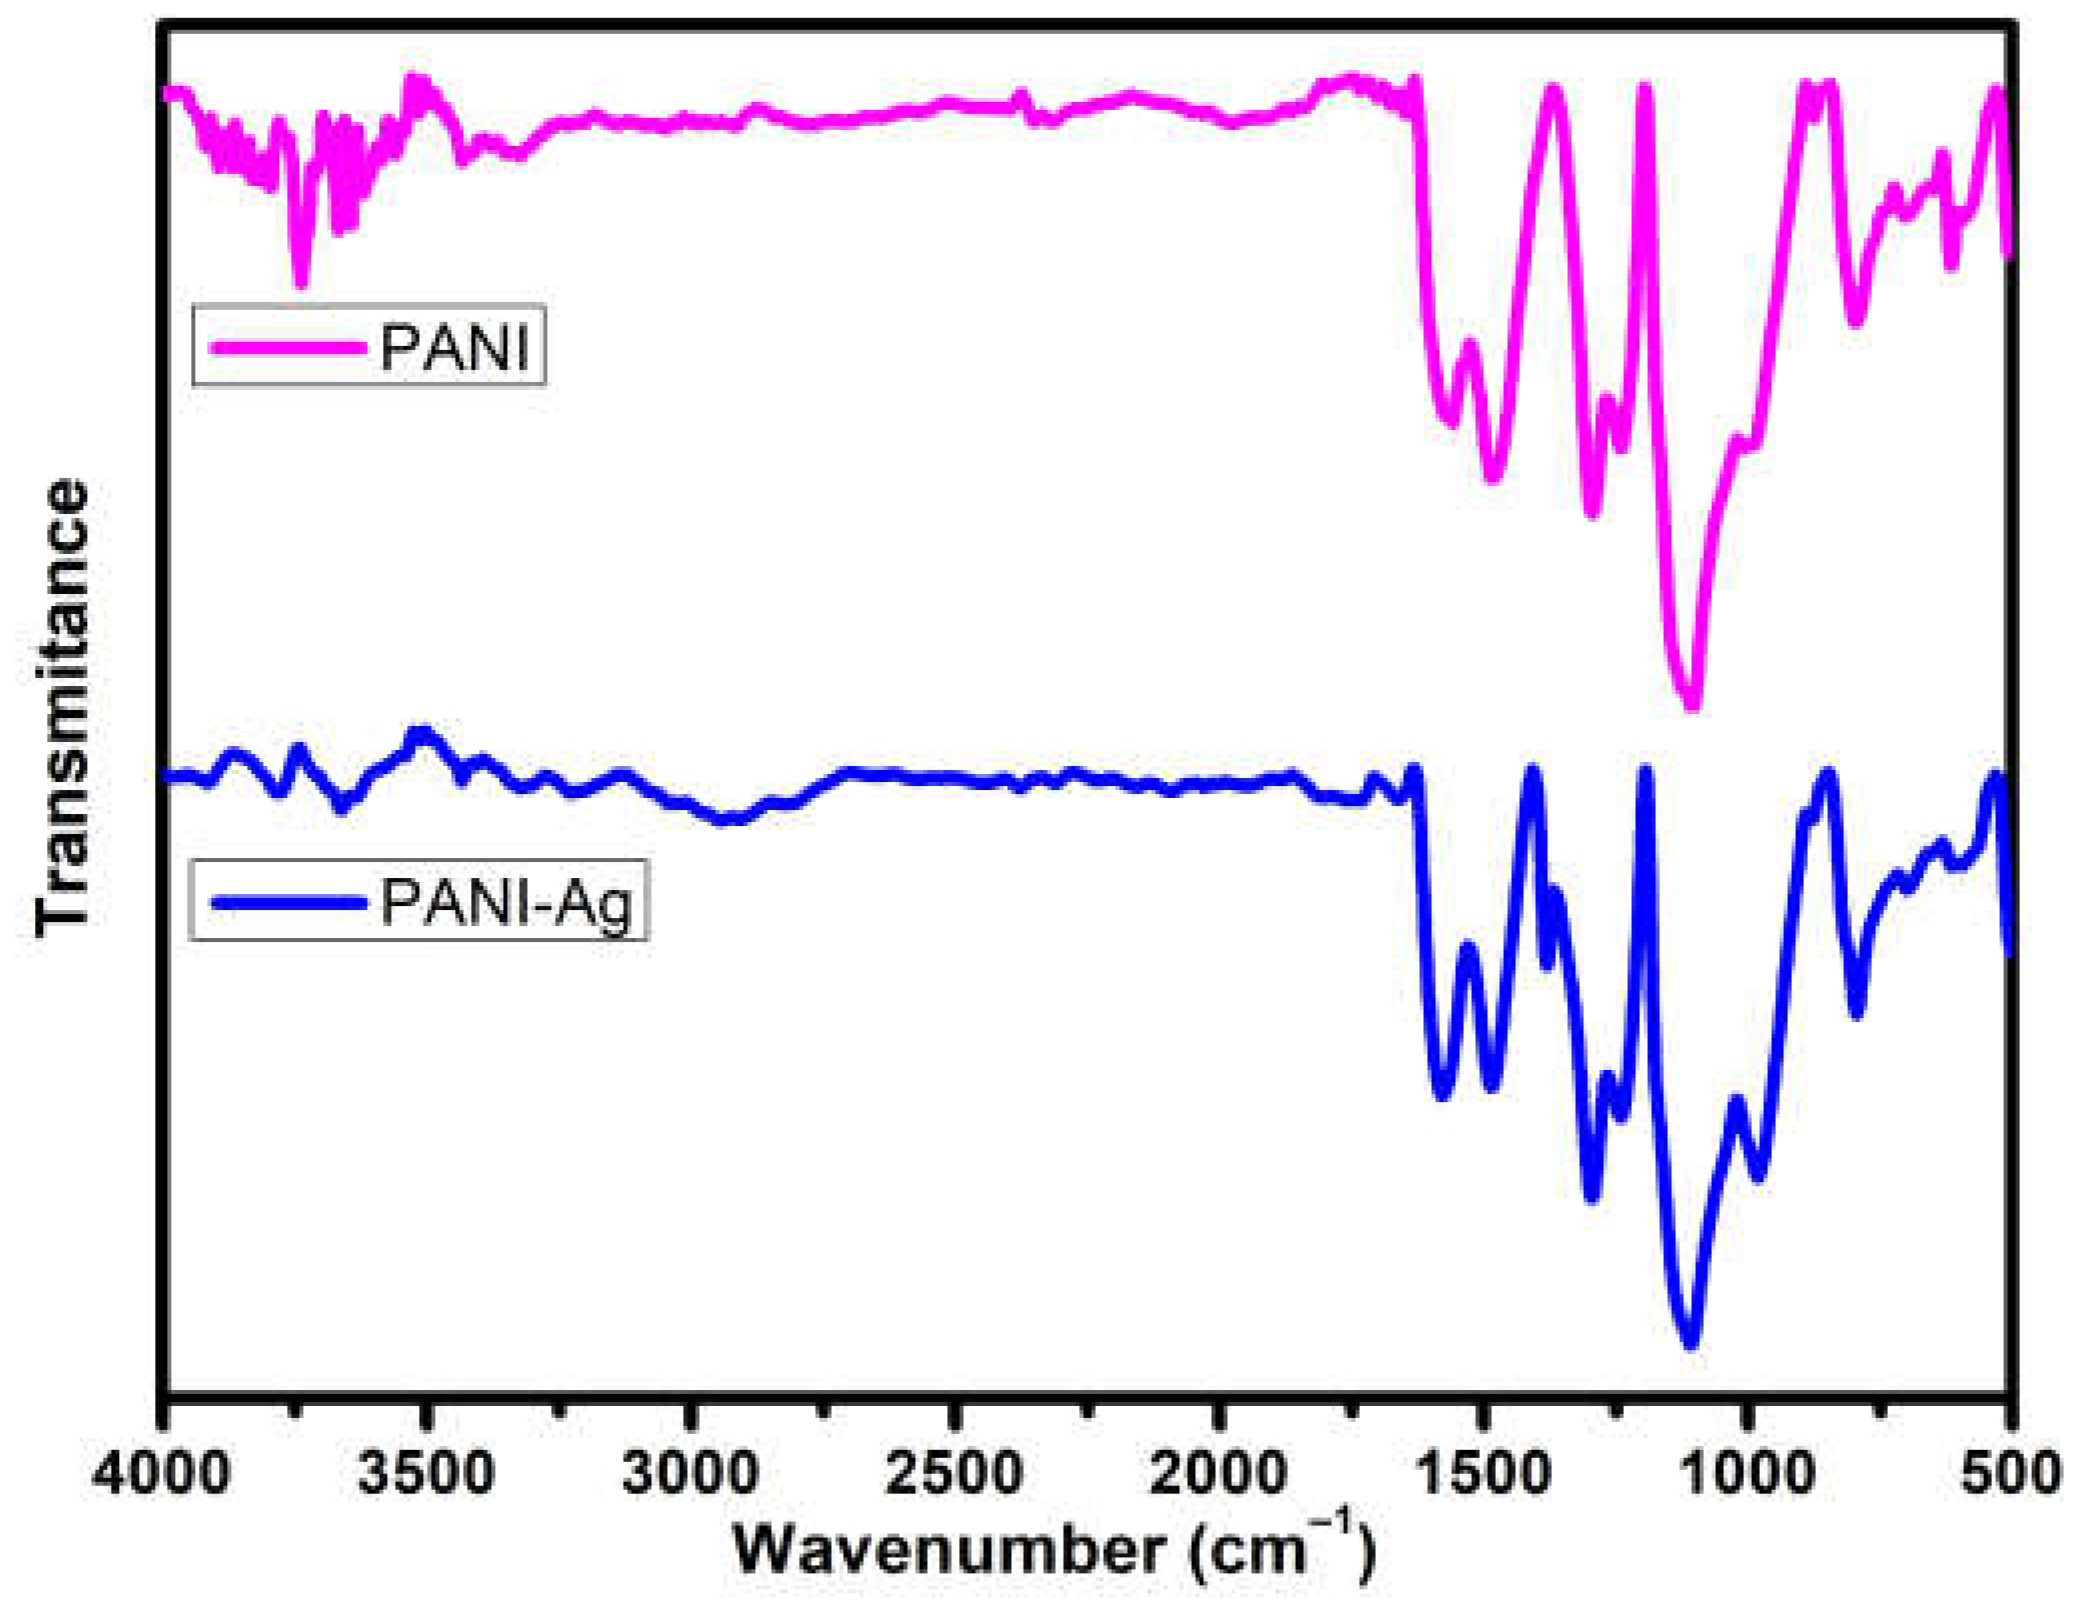
Figure 3 depicts the FTIR spectrum, which is assigned in Table 1. The FTIR peaks match with standards. There are 11 major peaks observed from the FTIR spectra. The peaks at 1556 cm−1 and 1479 cm−1 are for the N=Q=N Quinoid (Q) and the N-B-N Benzenoid (B) rings stretching for PANI. In the case of PANI-Ag composites, the N=Q=N Quinoid (1577 cm−1) and N-B-N Benzenoid (1485 cm−1) ring stretchings show a shift in the stretching frequency to a higher value when compared with pure PANI, indicating the interaction between Ag and PANI [30]. The new C-N stretching in QBQ is observed in the PANI-Ag composite at 1381 cm−1. The peak at 1105 cm−1 for Q=NH+–B or B–NH+•–B in PANI-Ag composite also shifts; these changes are due to the sharing of a lone pair electrons of PANI with Ag. The remaining peaks at 1294 cm−1, 1238 cm−1, 794 cm−1, and 702 cm−1 are for (C–N) stretching of secondary aromatic amine, (C–N) stretching of primary aromatic amine, C-H mono substituted or 1, 2-disubstituted ring, and out of plane ring bending (monosubstituted ring). The peaks at 1008 cm−1, 875 cm−1, and 615 cm−1 are for dopants HNO3/ NO3, which show a shift in the case of the PANI-Ag confirming the replacement of the acid group with Ag [31,32,33]. These shifts in peaks show the interaction between Ag and Nitrogen in the polymer chain with the replacement of the acid group, confirming the formation of the PANI-Ag composites. The TNP interaction with the PANI-Ag composite shows the shift in peaks of the N=Q=N Quinoid (Q) and the N-B-N Benzenoid (B) stretching with the C-N stretching mode of the benzenoid ring [26,34].

3.2. Scanning Electron Microscopy (SEM/EDAX)

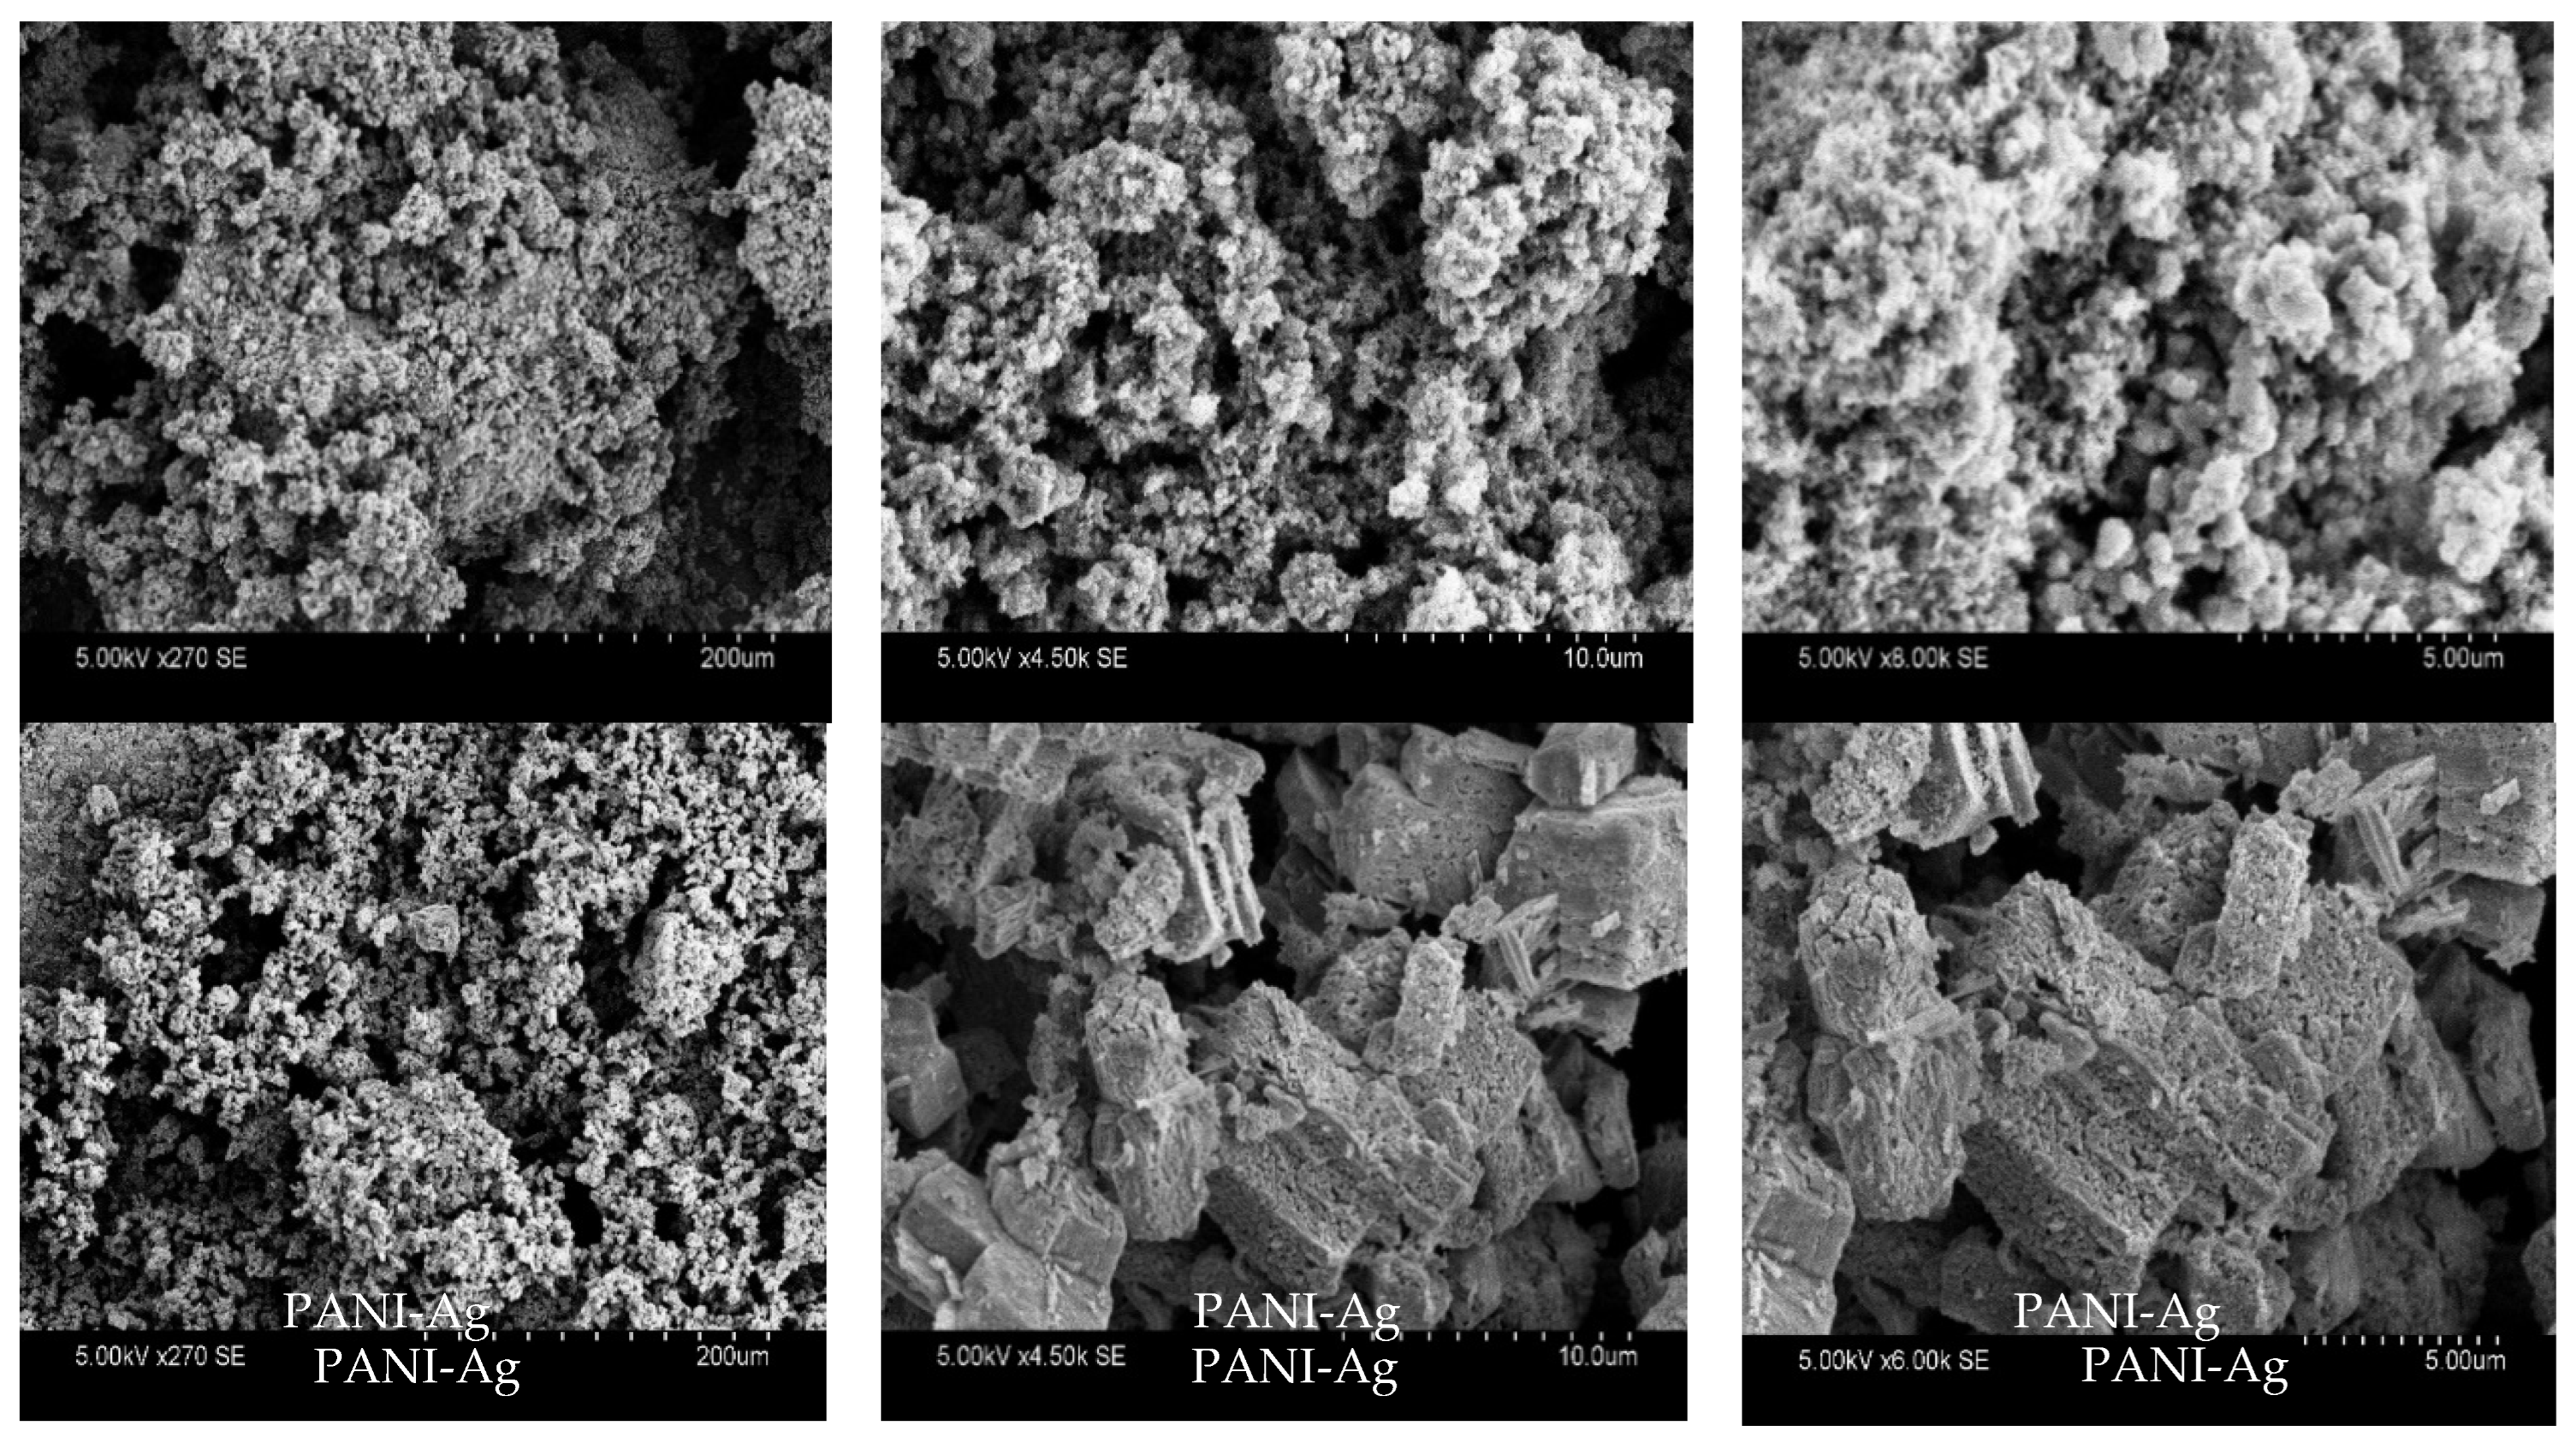
The SEM micrographs are shown in Figure 4. The first row of micrographs shows PANI with micro aggregations with a large surface area, whereas in the SEM micrographs of the PANI-Ag composite in the second row, Ag forms a homogeneous cluster of the PANI-Ag composite where Ag is surrounded by PANI granules. In this case, the Ag has multiple positions to bind with the nitrogen sites of the PANI to form an interchain linkage between several adjacent PANIs.
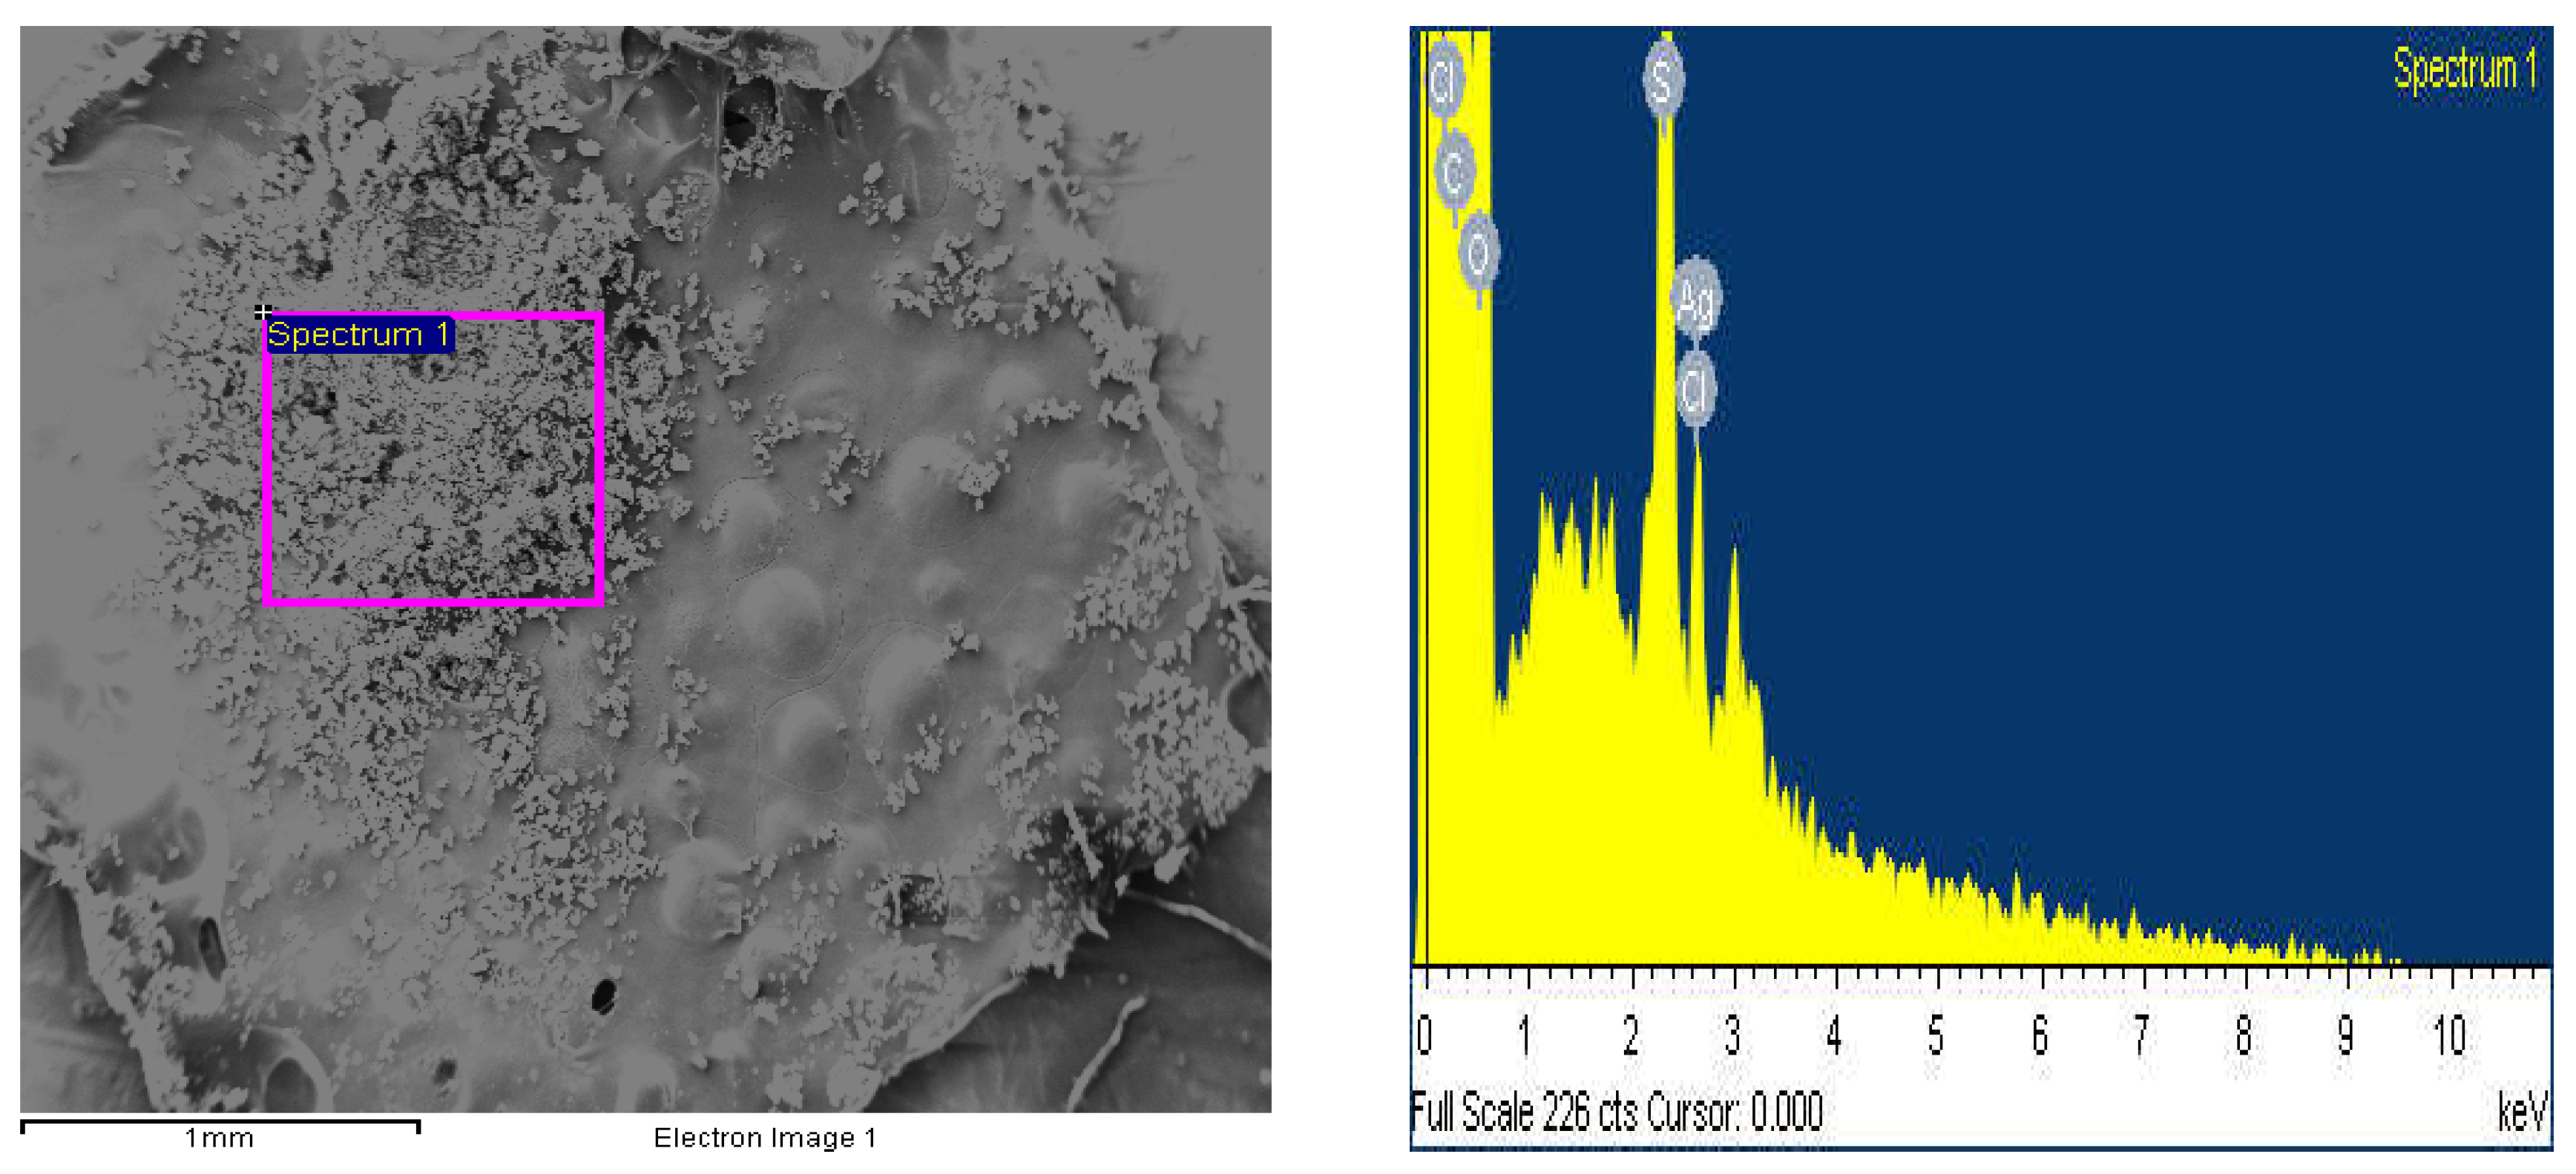
EDAX micrographs from Figure 5 show the quantitative analysis of the distribution of Ag in PANI; it indicates the homogeneous distribution of Ag present in the PANI-Ag composite. The EDAX also gives the surface estimated values of silver present in the PANI-Ag composite, which is found to be 1.88% of the weight of Ag on the surface of the PANI.

3.3. X-ray Powder Diffraction Studies

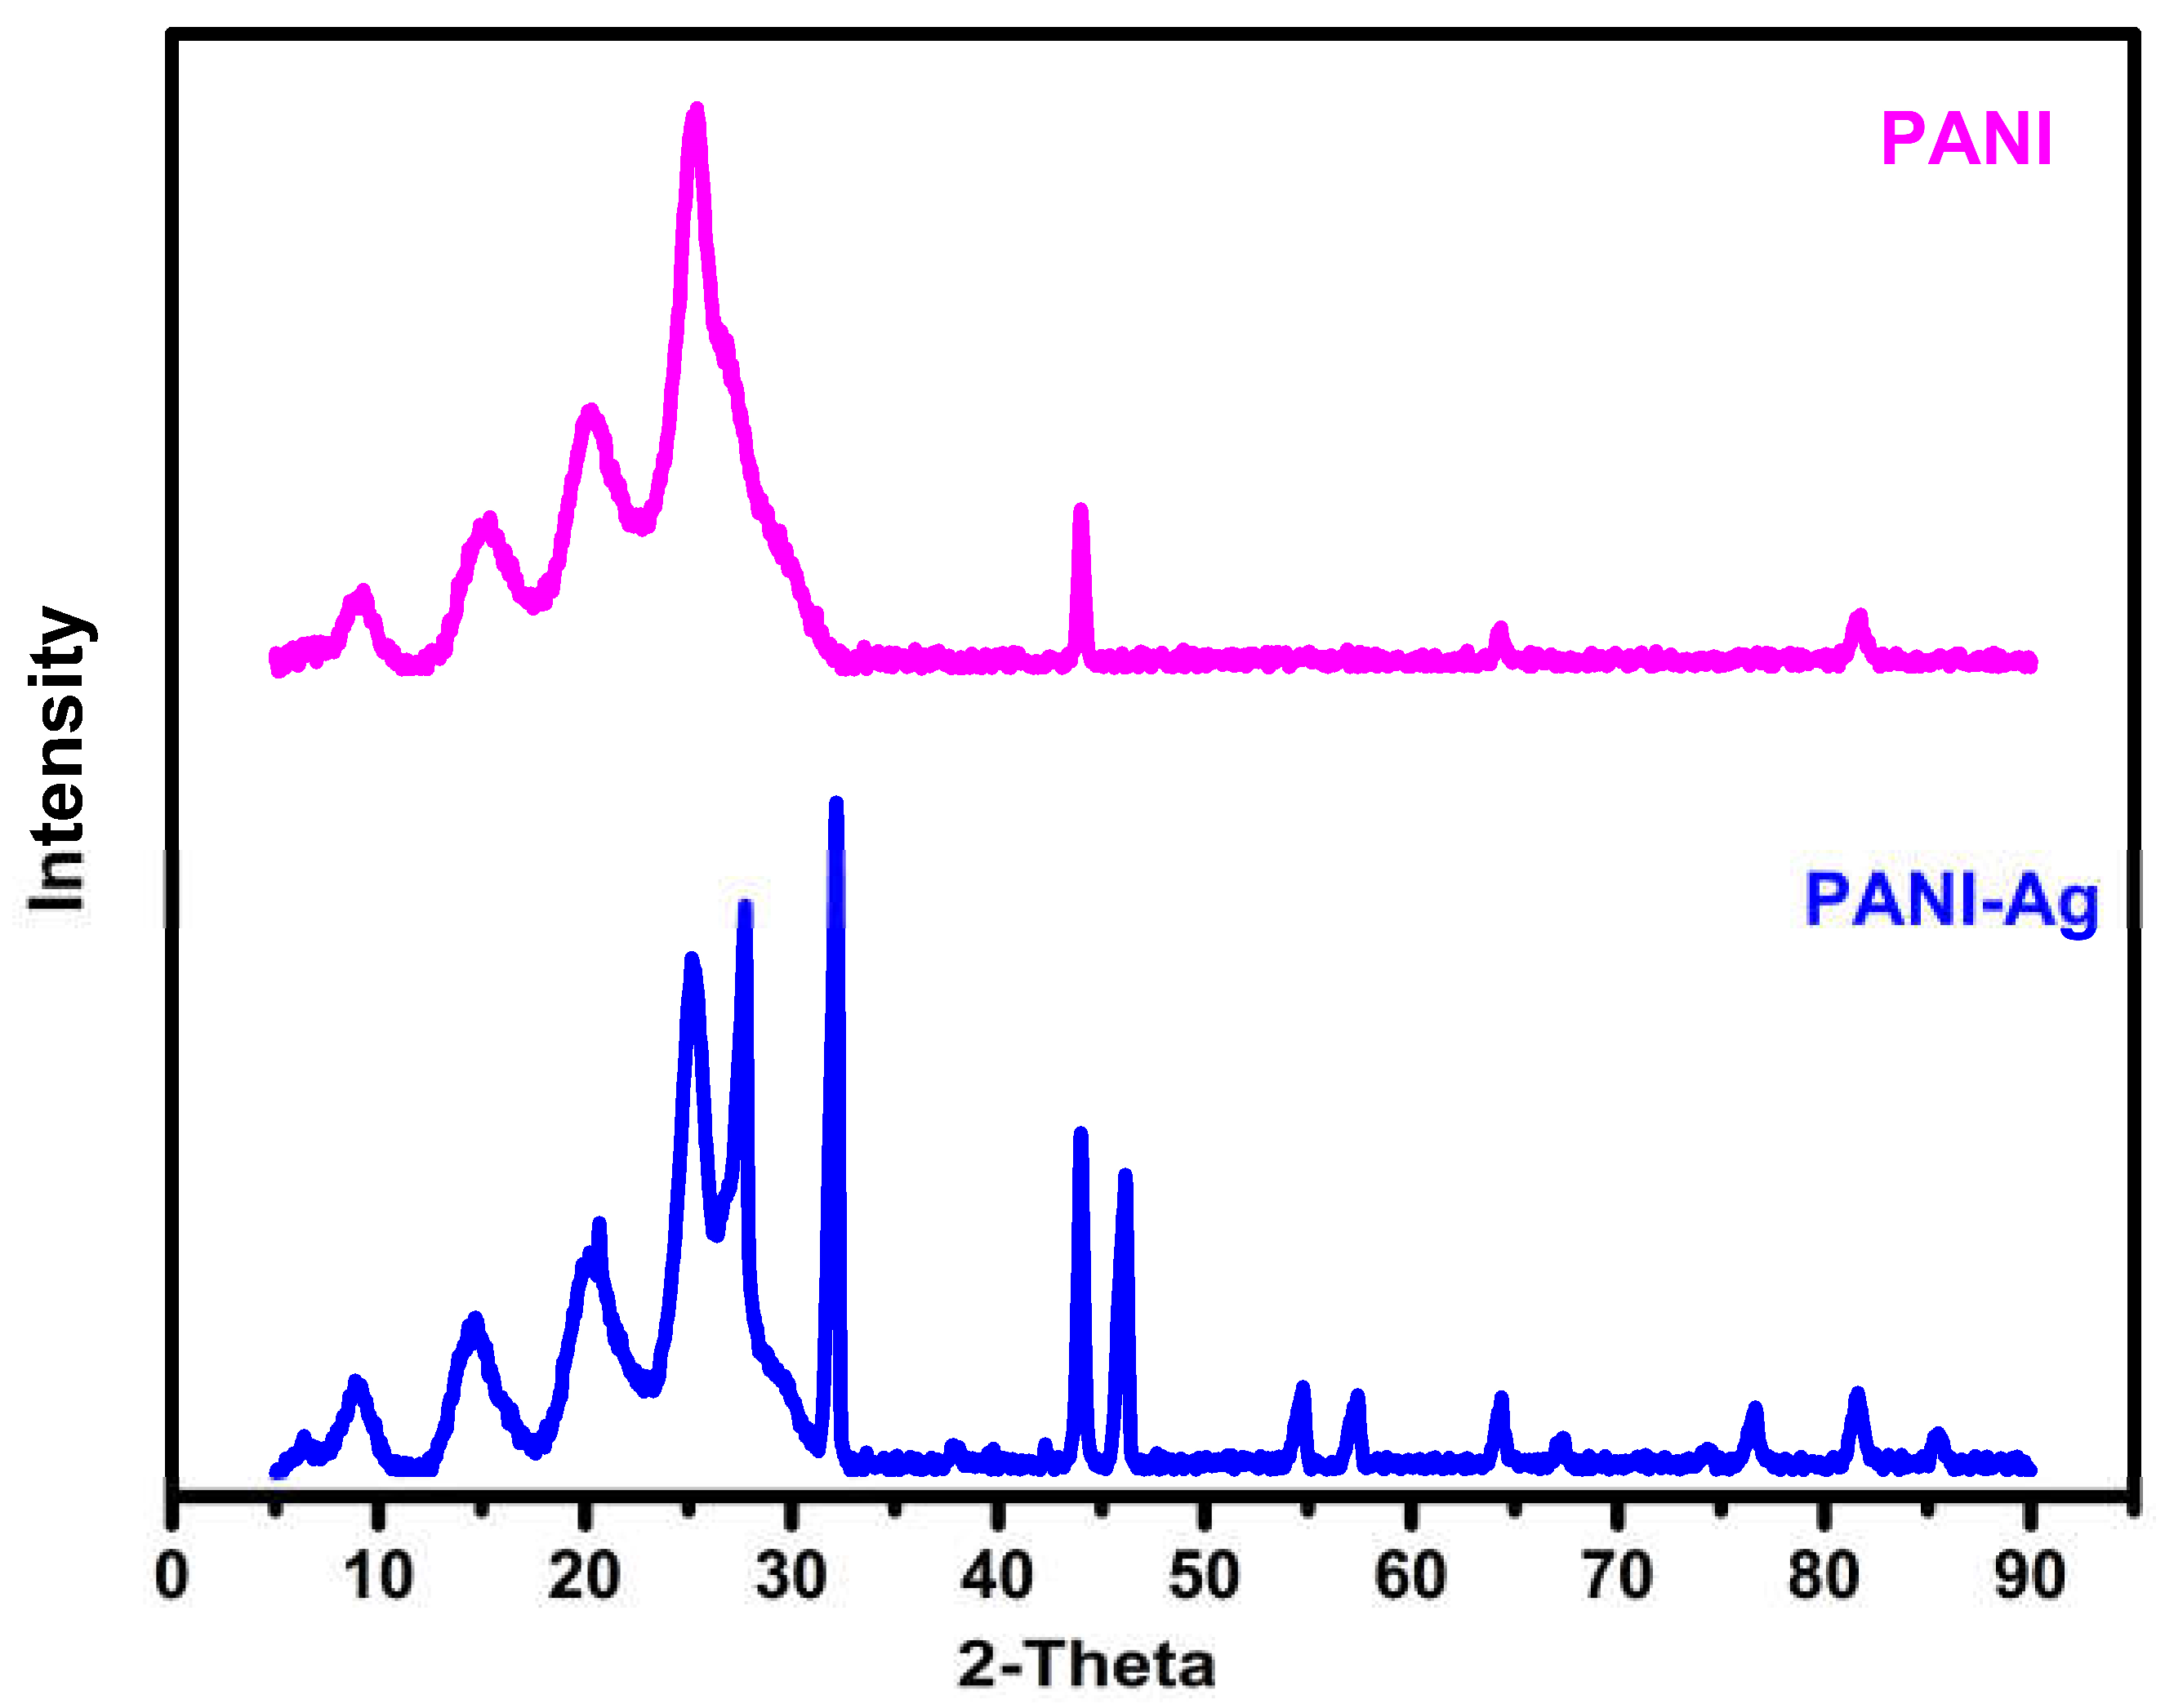
The XRD patterns of PANI and the PANI-Ag composite are shown in Figure 6, and hkl values are tabulated in Table 2 [35,36]. The X-ray diffraction pattern of PANI gives 4 diffraction peaks at 2θ = 9.2°, 15.4°, 20.3°, 25.4°, 43.9°, and 64.3°, which matches with the standard and shows the semicrystalline nature of PANI. The XRD pattern of the PANI-Ag composite shows 4 patterns of PANI and 4 extra peaks for Ag with 2θ = 32.1°, 44°, 67°, and 76°, indicating the presence of cubic crystalline silver, which is referred from JCPDS file no. 04-0783 [37]. From the XRD pattern of the PANI-Ag composite, the average Ag crystallite size is calculated using Debye Scherrer’s formula and is found to be 19.6 nm. The other remaining peaks with 2θ = 27.7°, 46.1°, 54.7°, and 57.4° are due to the formation of a crystalline Ag-capped PANI in the PANI-Ag composite, demonstrating the interaction between Ag and PANI to form the PANI-Ag composite [38,39].

3.4. Thermal Analysis (TGA)

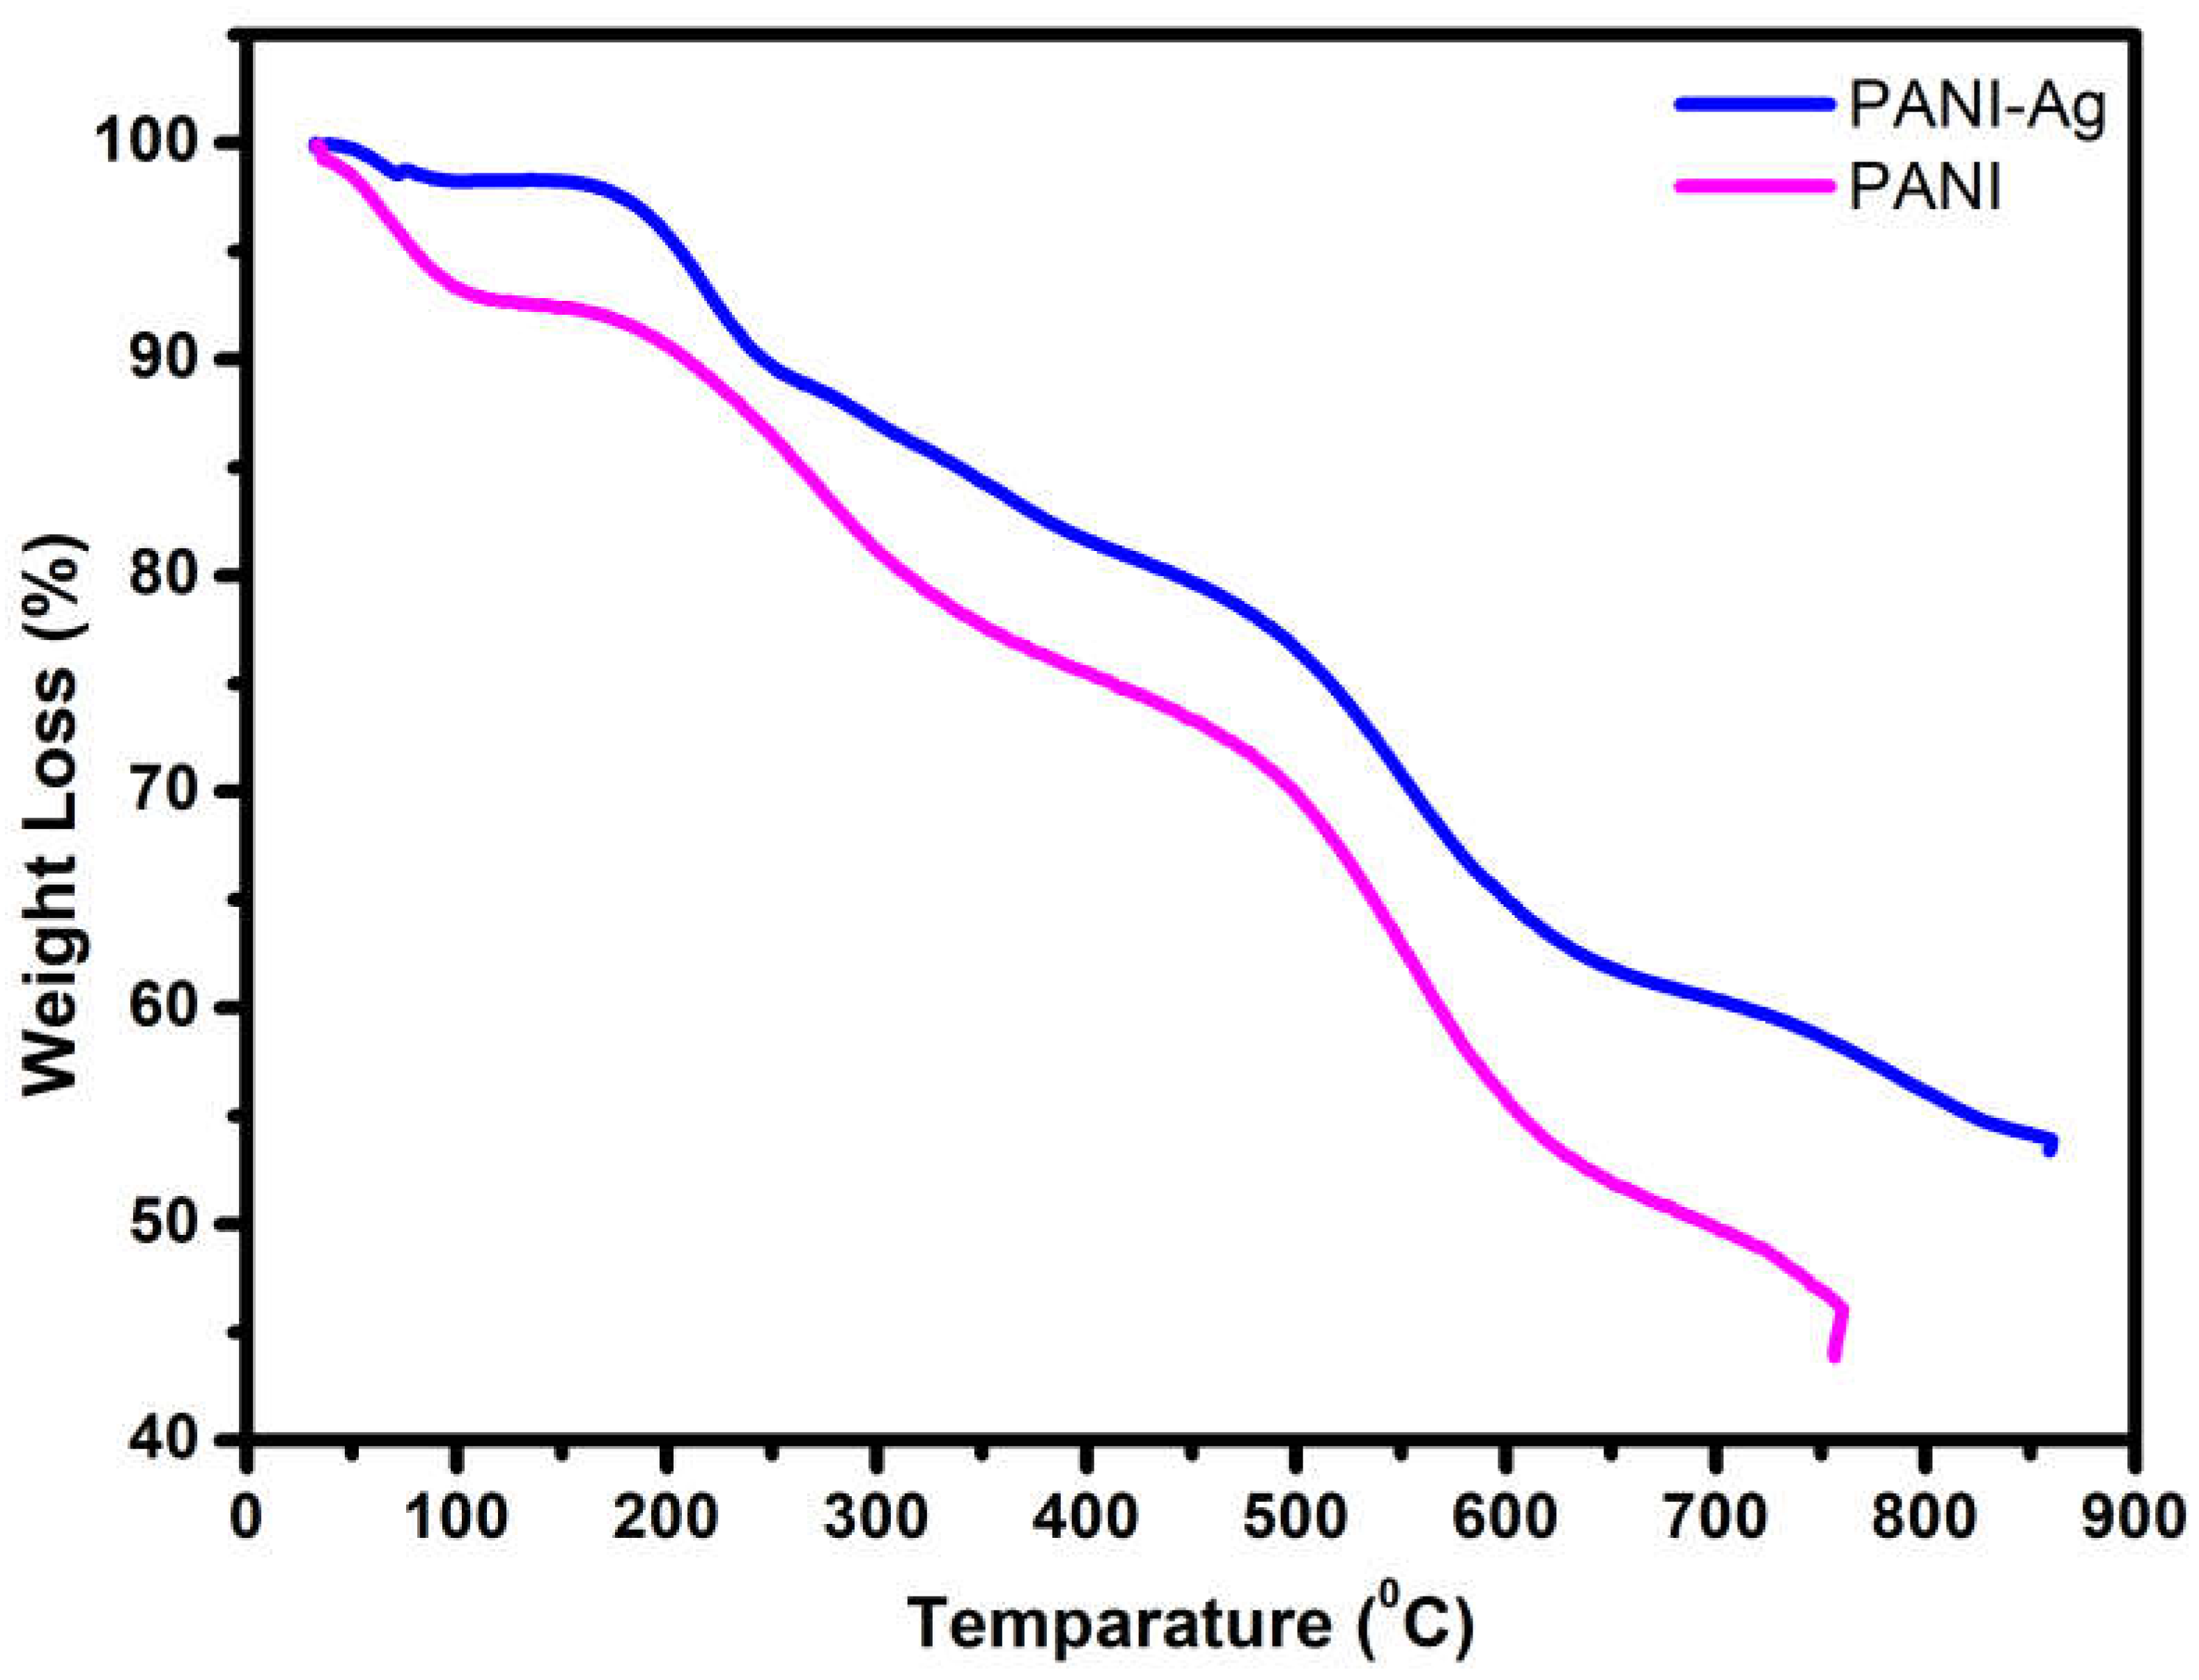
The thermal studies of PANI and the PANI-Ag composite using thermogravimetric analysis (TGA) are shown in Figure 7. Both of the traces for PANI and the PANI-Ag composite show three steps of weight loss. The three steps of weight loss in PANI are due to the release of adsorbed volatile solvent and moisture for the first step, from 30 °C to 100 °C, the second weight loss is due to the breakage of secondary bonds in between polymer chains and dopant acids ranging from 180 °C to 400 °C, and the third weight loss is due to the decomposition of polymer PANI, which begins at 500 °C and forms a residue at the higher temperatures. The TGA traces of the PANI-Ag composites also show a three-step thermal behavior with slight variation in these steps. In the first step, there is less loss of volatile solvent and moisture compared with PANI and lower material loss during the second weight loss. This is because the presence of Ag incorporated into the polymer matrix reduced the protonated chain due to the presence of acids. The weight loss in the third step is less than that of the bare polymer, indicating a higher residue formation. The Ag in the polymer matrix forms links between PANI chains and increases the stability of the PANI-Ag composite.

3.5. UV-vis Spectroscopy

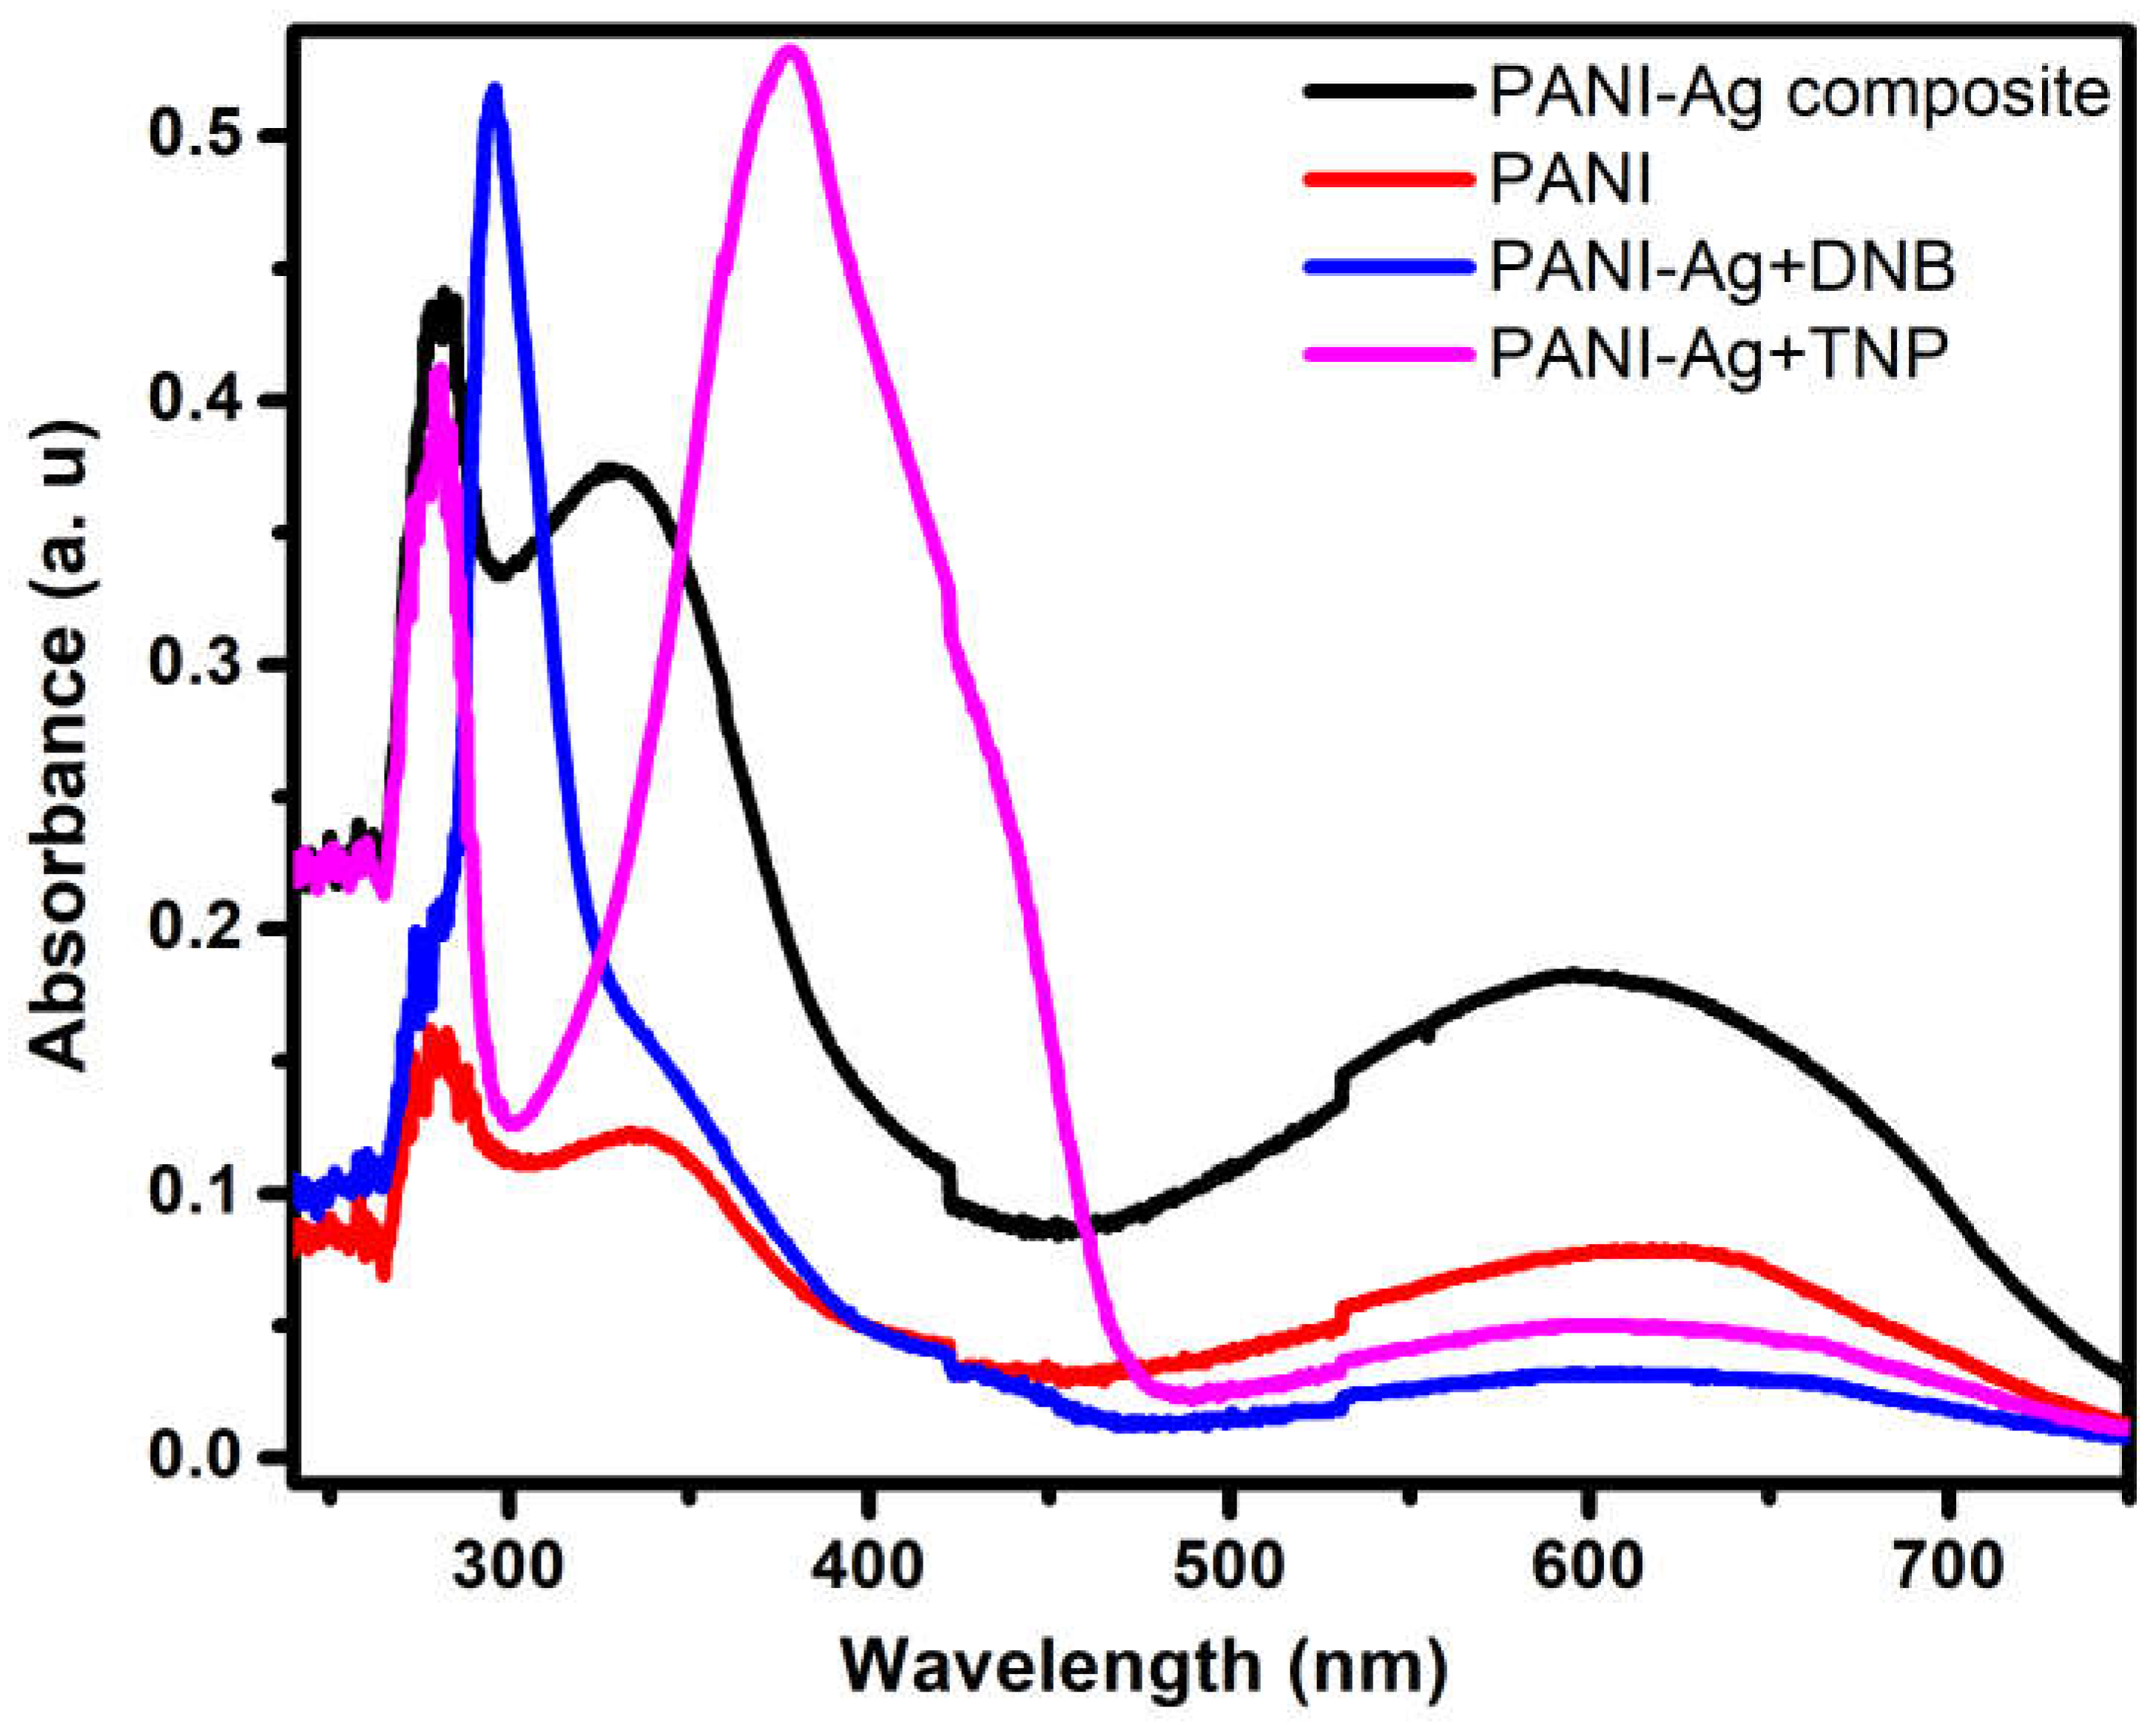
Figure 8 shows the absorption spectrum of the PANI-Ag composite in DMF. It indicates the presence of two absorption bands, a sharp intense peak at 333 nm and a broad peak at 597 nm, whereas PANI appears at 334 nm and 626 nm [40]. The intense peak at 333 nm corresponds to the benzenoid and quinoid units π to π* transition with a slight red shift caused by the silver nanoparticles. The peak at 597 nm is for the n to π* transition of polaron or a nonbonding electron, which increases due to the presence of silver. There is no noticeable peak shift in the PANI-Ag composite after the addition of TNP and DNB, confirming the lack of interaction between the NACs and the PANI-Ag composites in the ground state.

3.6. Fluorescence Study

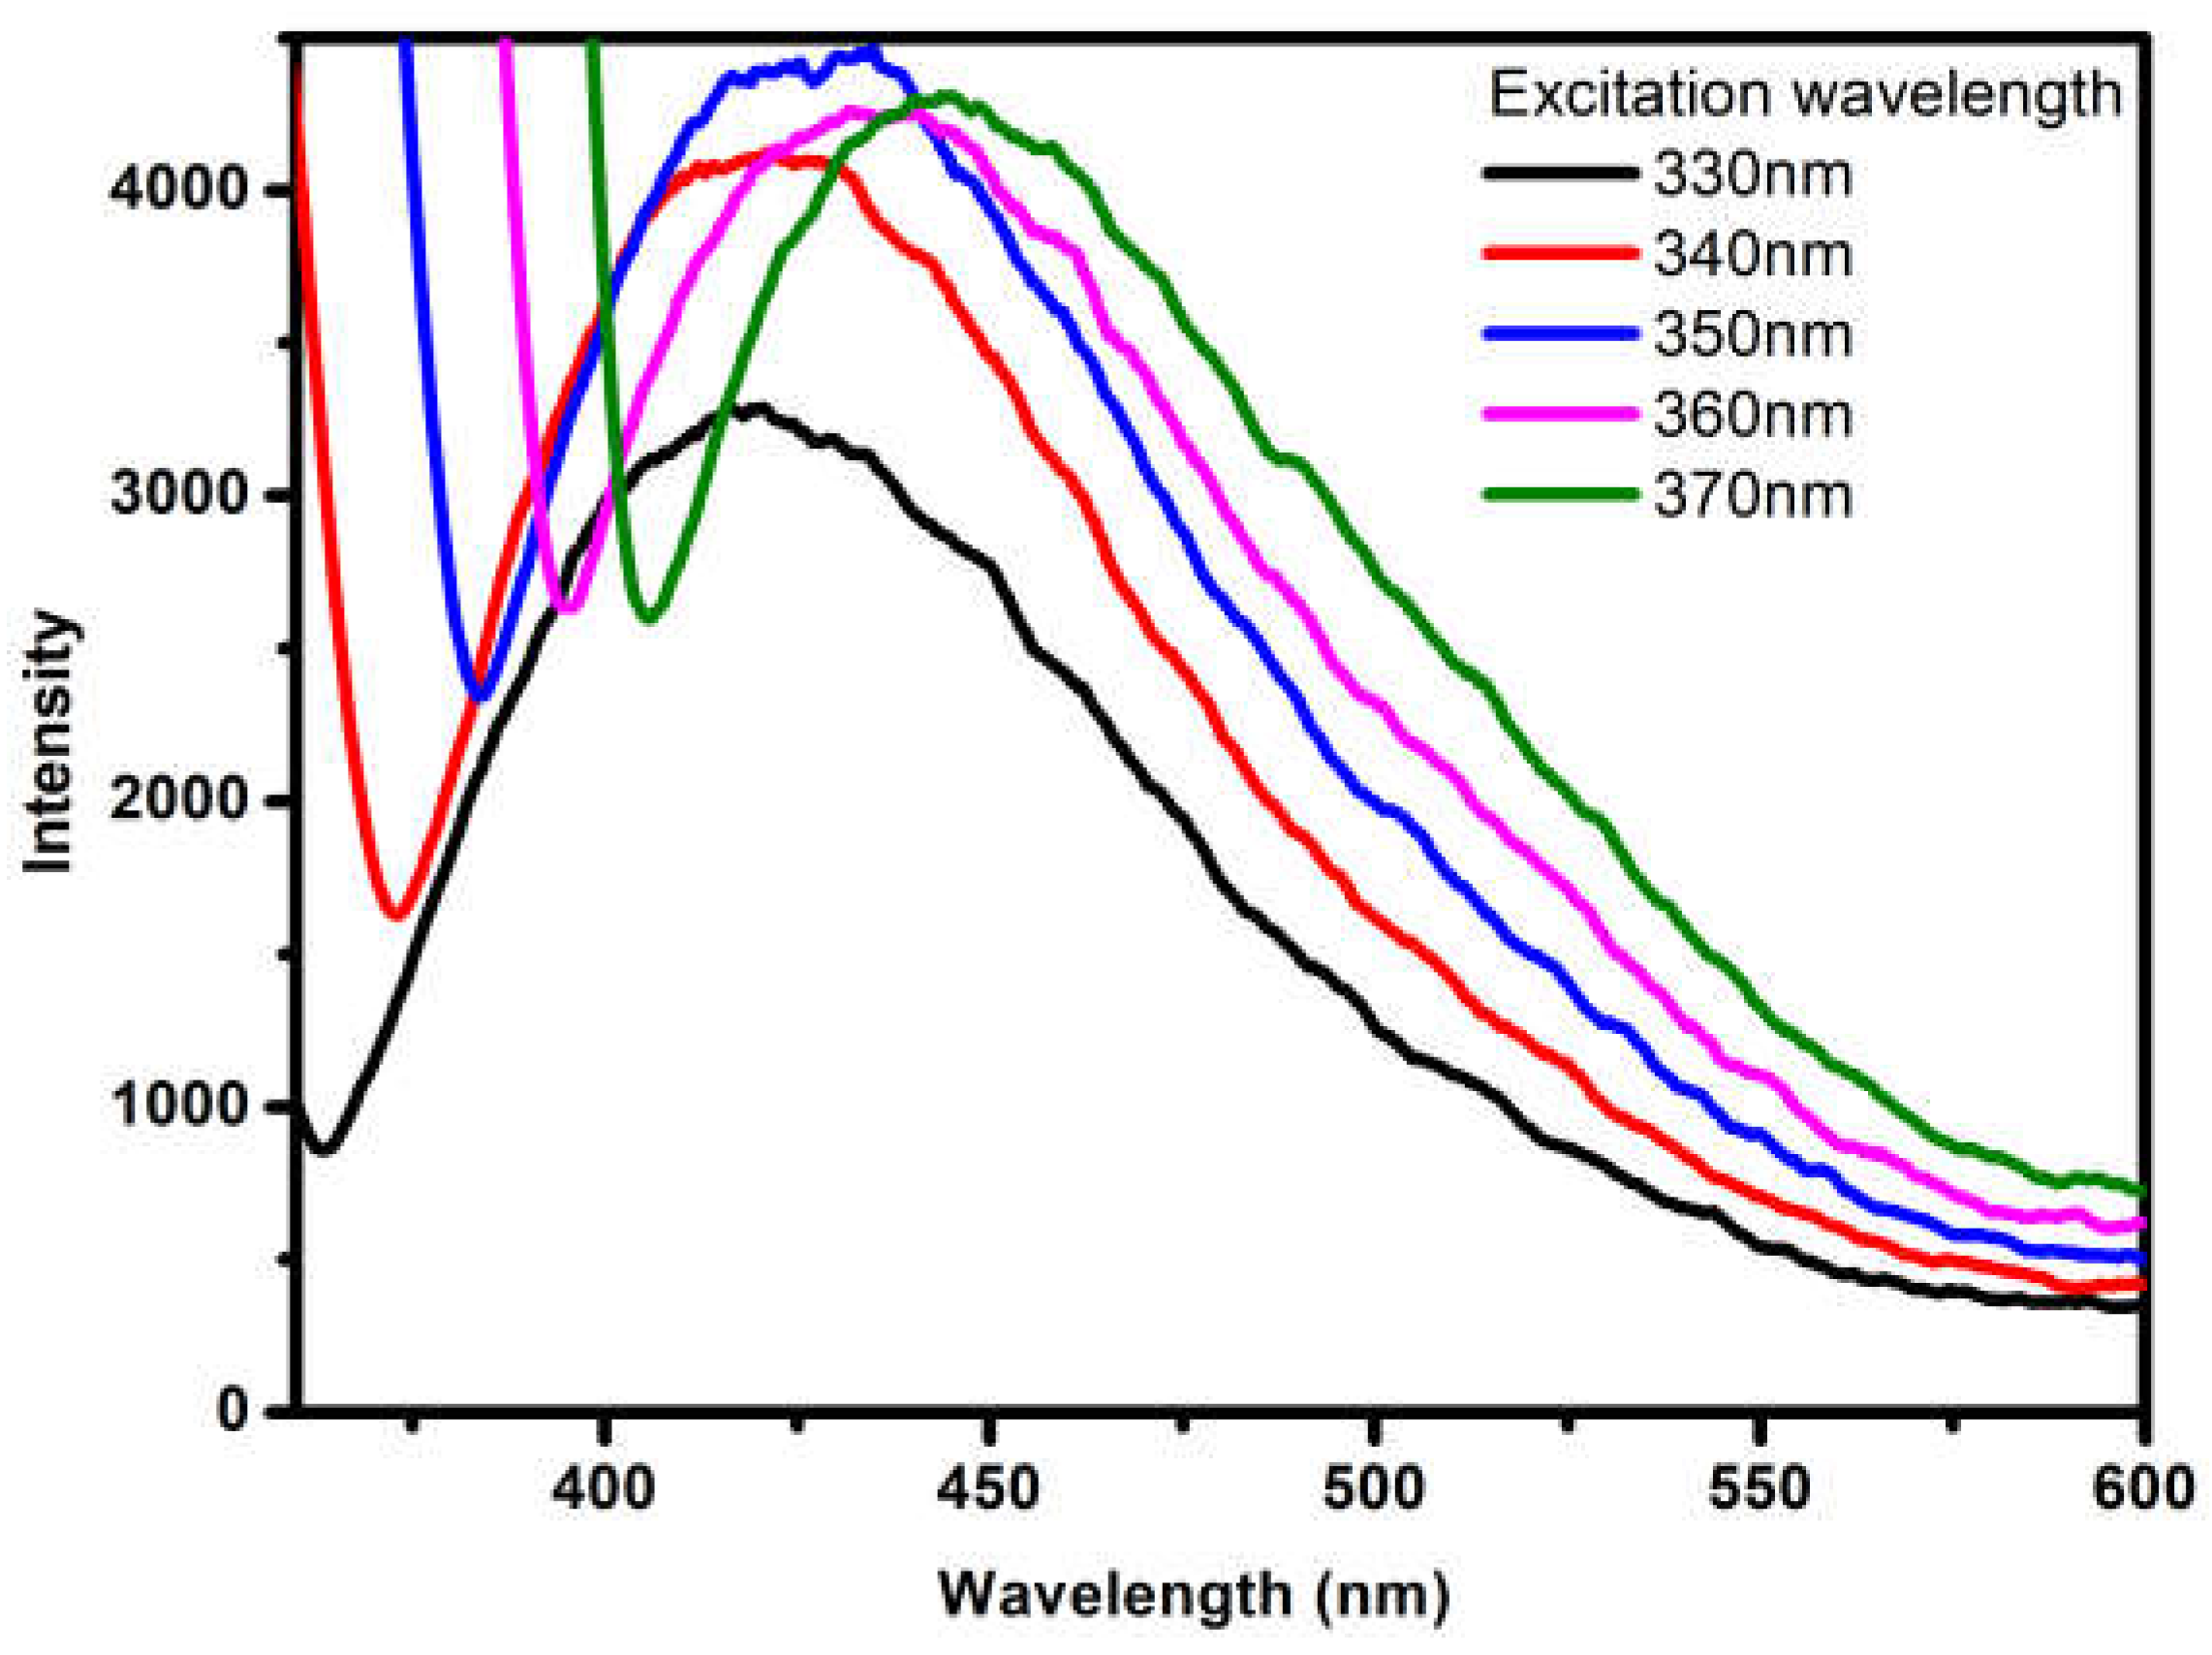
In this study, fluorescence quenching experiments were carried out for sensing nitroaromatic compounds. The nitroaromatic compounds TNP and DNB are used as a quencher and titrated against the PANI-Ag composite as a fluorophore at a constant concentration. A amount of 10 ppm of PANI-Ag composite, TNP, and DNB were prepared in DMF for fluorescence studies. Figure 9 shows the emission spectra of the fluorophore PANI-Ag composite when excited by different excitation wavelengths. The PANI-Ag composite exhibits higher fluorescence emission at an excitation wavelength of 350 nm, and this excitation wavelength is chosen for further quenching studies. The fluorescence in PANI is caused by the π– π* transition (HOMO to LUMO) of the benzenoid ring in the polymer chain. Figure 10a shows the emission spectra of the PANI-Ag composite with TNP and shows a maximum quenching of 70% achieved with the addition of 20 micromoles of TNP. Further addition of TNP does not show any fluorescence quenching. When TNP is added, the emission peak shifts slightly. This is due to the formation of an exciplex complex between TNP and the PANI-Ag composite, stabilizing the excited singlet state of the fluorophore by interaction with TNP. This exciplex is formed by the interaction of an excited PANI-Ag composite with an unexcited TNP molecule resulting in the shift in fluorescence [41]. Whereas Figure 10b shows the emission spectra of PANI-Ag composite with DNB and shows 74% quenching on the addition of 475 micromoles of DNB, further addition does not show any fluorescence quenching. From Figure 10b, it is observed that the emission peak does not shift with the addition of DNB, which confirms that there is no formation of the exciplex complex between the fluorophore PANI-Ag composite and DNB.
The Stern–Volmer plot (S–V plot) is also used to understand the mechanism and efficiency of quenching. I0/I Vs concentration is plotted in the S–V plot to obtain the Ksv value, also known as the Stern–Volmer constant or quenching efficiency [42], where I0 is the initial fluorescence intensity of the PANI-Ag composite and I is the intensity after the quencher has been added. Figure 10c,d show a straight line indicating quenching by a single mechanism, either a static or dynamic mechanism. Uv-vis spectroscopy shows that the absorbance wavelength of the PANI-Ag composite and the PANI-Ag composite with analyte TNP does not shift, confirming the absence of ground state interaction and reducing the possibility of static quenching. Exciplex formation in fluorescence emission spectroscopy, on the other hand, confirmed the possibility of dynamic quenching [43,44]. The slope of the S–V plot gives a Ksv value which is 0.1037 × 10⁶ M−1 for TNP and 0.161 × 10⁴ M−1 for DNB. The higher the value of Ksv, the better the efficiency of quenching [27,45,46,47]. The detection limit from Figure 10c,d was assessed by plotting intensity vs concentration and applying the formula LOD = 3 S/K, where S is the standard deviation and K is the slope [34]. The obtained LOD = 5.58 × 10⁻⁷ M (0.127 ppm) and LOD = 23.30 × 10⁻⁶ M (3.916 ppm) for TNP and DNB, respectively, indicate that the PANI-Ag composite is a better sensor for the nitro compound of TNP [26]. The -OH group in TNP interacts with the nitrogen of the composite resulting in the red shift in fluorescence [48]. These quenching constant and LODs values of the PANI-Ag composite of TNP are compared with our previous studies using different doped PANI, viz. CSA-PANI (6.14 × 10⁻⁷ M or 0.14 ppm) [26], BSA-PANI, and DBSA-PANI [49] (LOD = 1 × 10⁻⁶ M), indicating that the present results are better than previous works.
Recently, conjugated polymers, supramolecules, macromolecules, perovskite, quantum dots, and nanoclusters were used to study fluorescence quenching for TNP sensing. The conjugated fluorescent polymers include poly fluorene derivatives, benzo[c] [1,2,5] selenadiazole in polyfluorene backbone [50], anthracene-bridged poly(N-vinylpyrrolidone) [51], and macro molecular organic compounds include phenanthroimidazole derivatives [52], triarylamine-functionalized phenanthroline [53], quinoxaline-amine-based probe [54], novel triphenylamine-pyrenyl salicylic acid [55], perovskite like p-xylylenediamine capped CH3NH3PbBr3 perovskite [56], quantum dots of graphene quantum dots (GQD) [57], and nanocluster-like polyvinylpyrrolidone-templated copper nanoclusters [58]. The authors obtained various LODs (ranging from 10−6 M to 10−9 M) shown in Table 3 by employing the above fluorophores in organic solvents such as DMSO, THF, CH3CN, and mixed solvent with water.
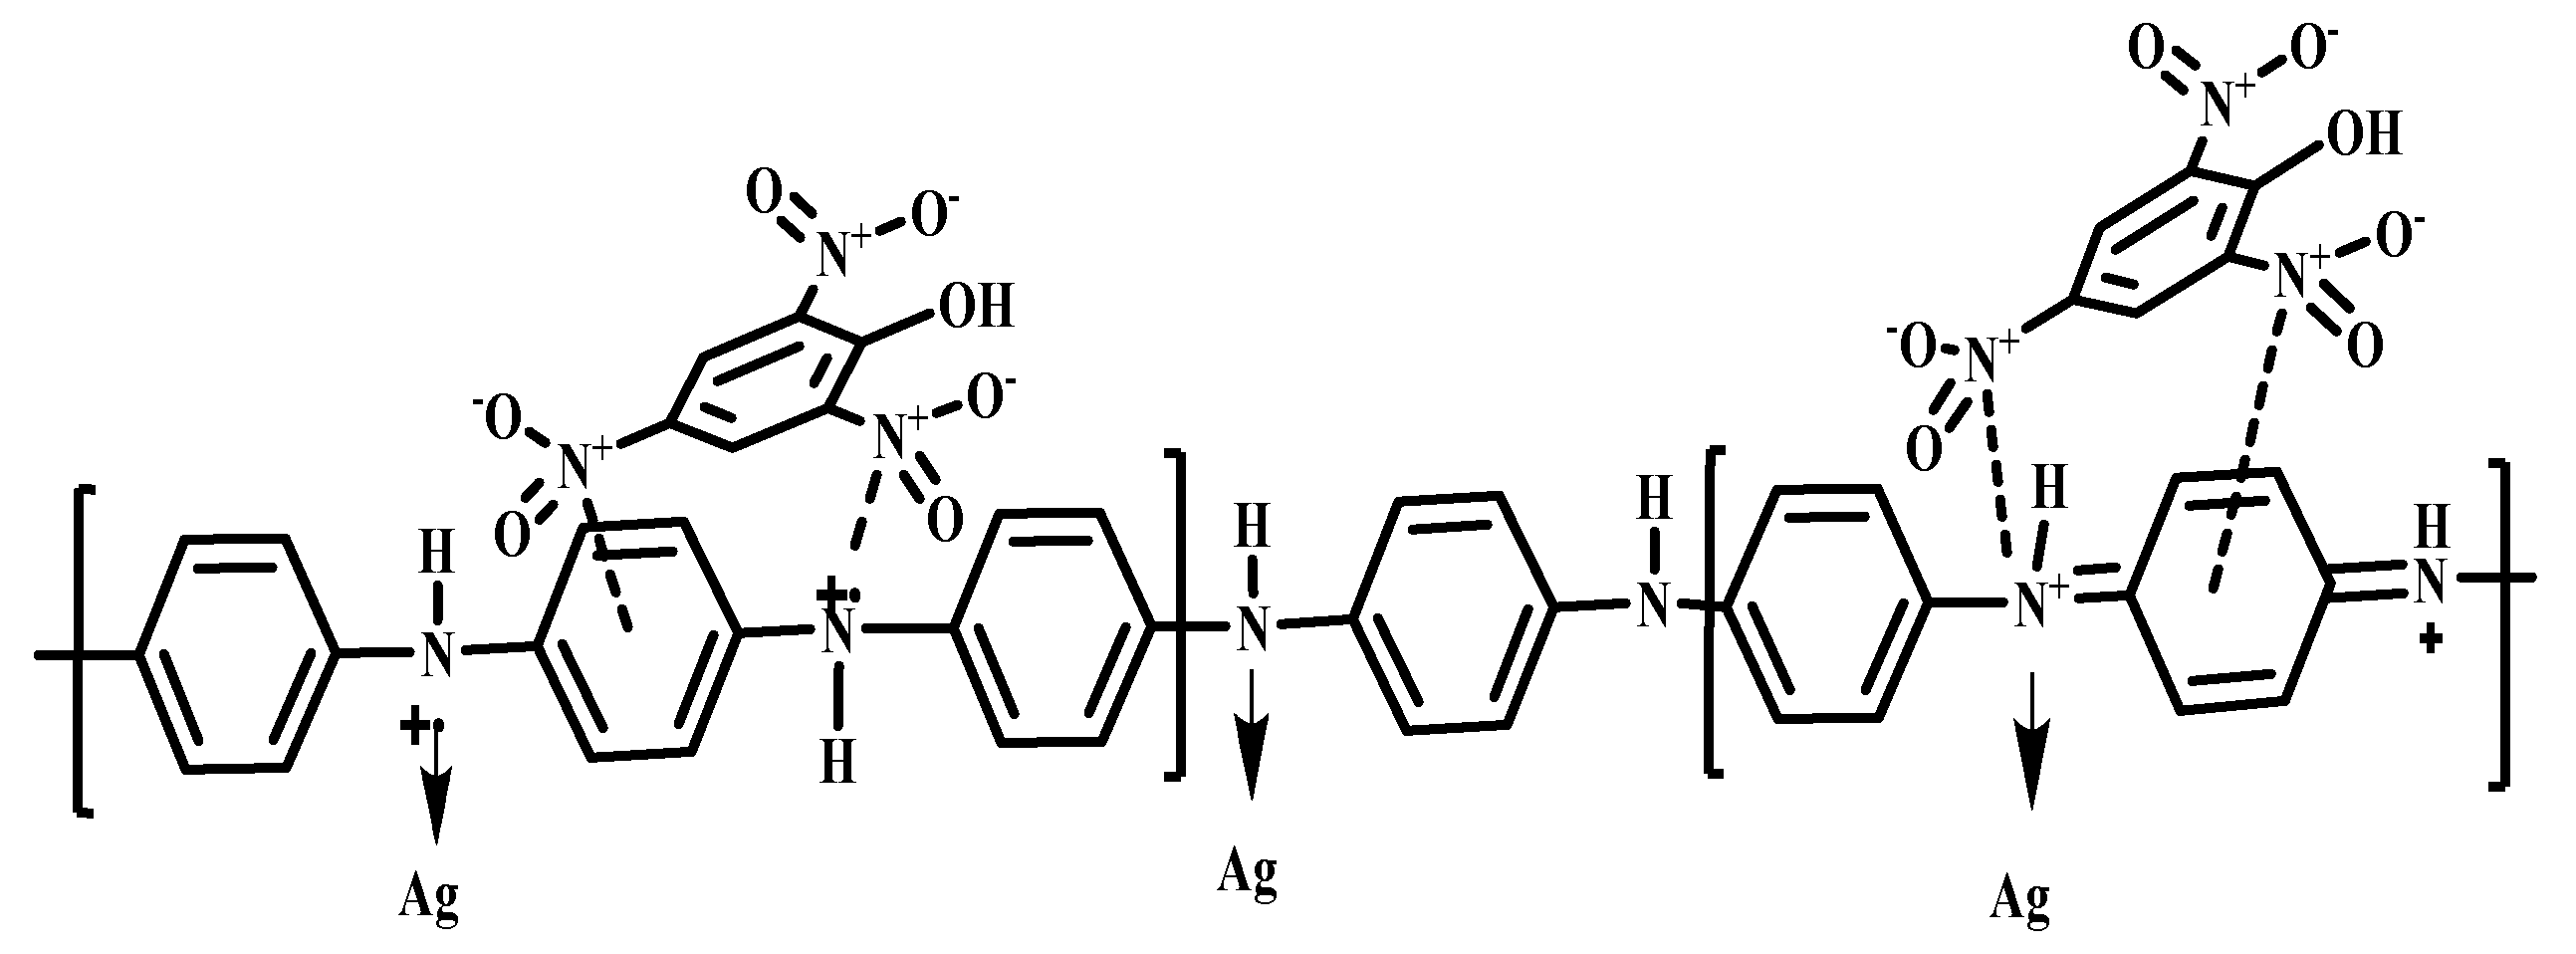
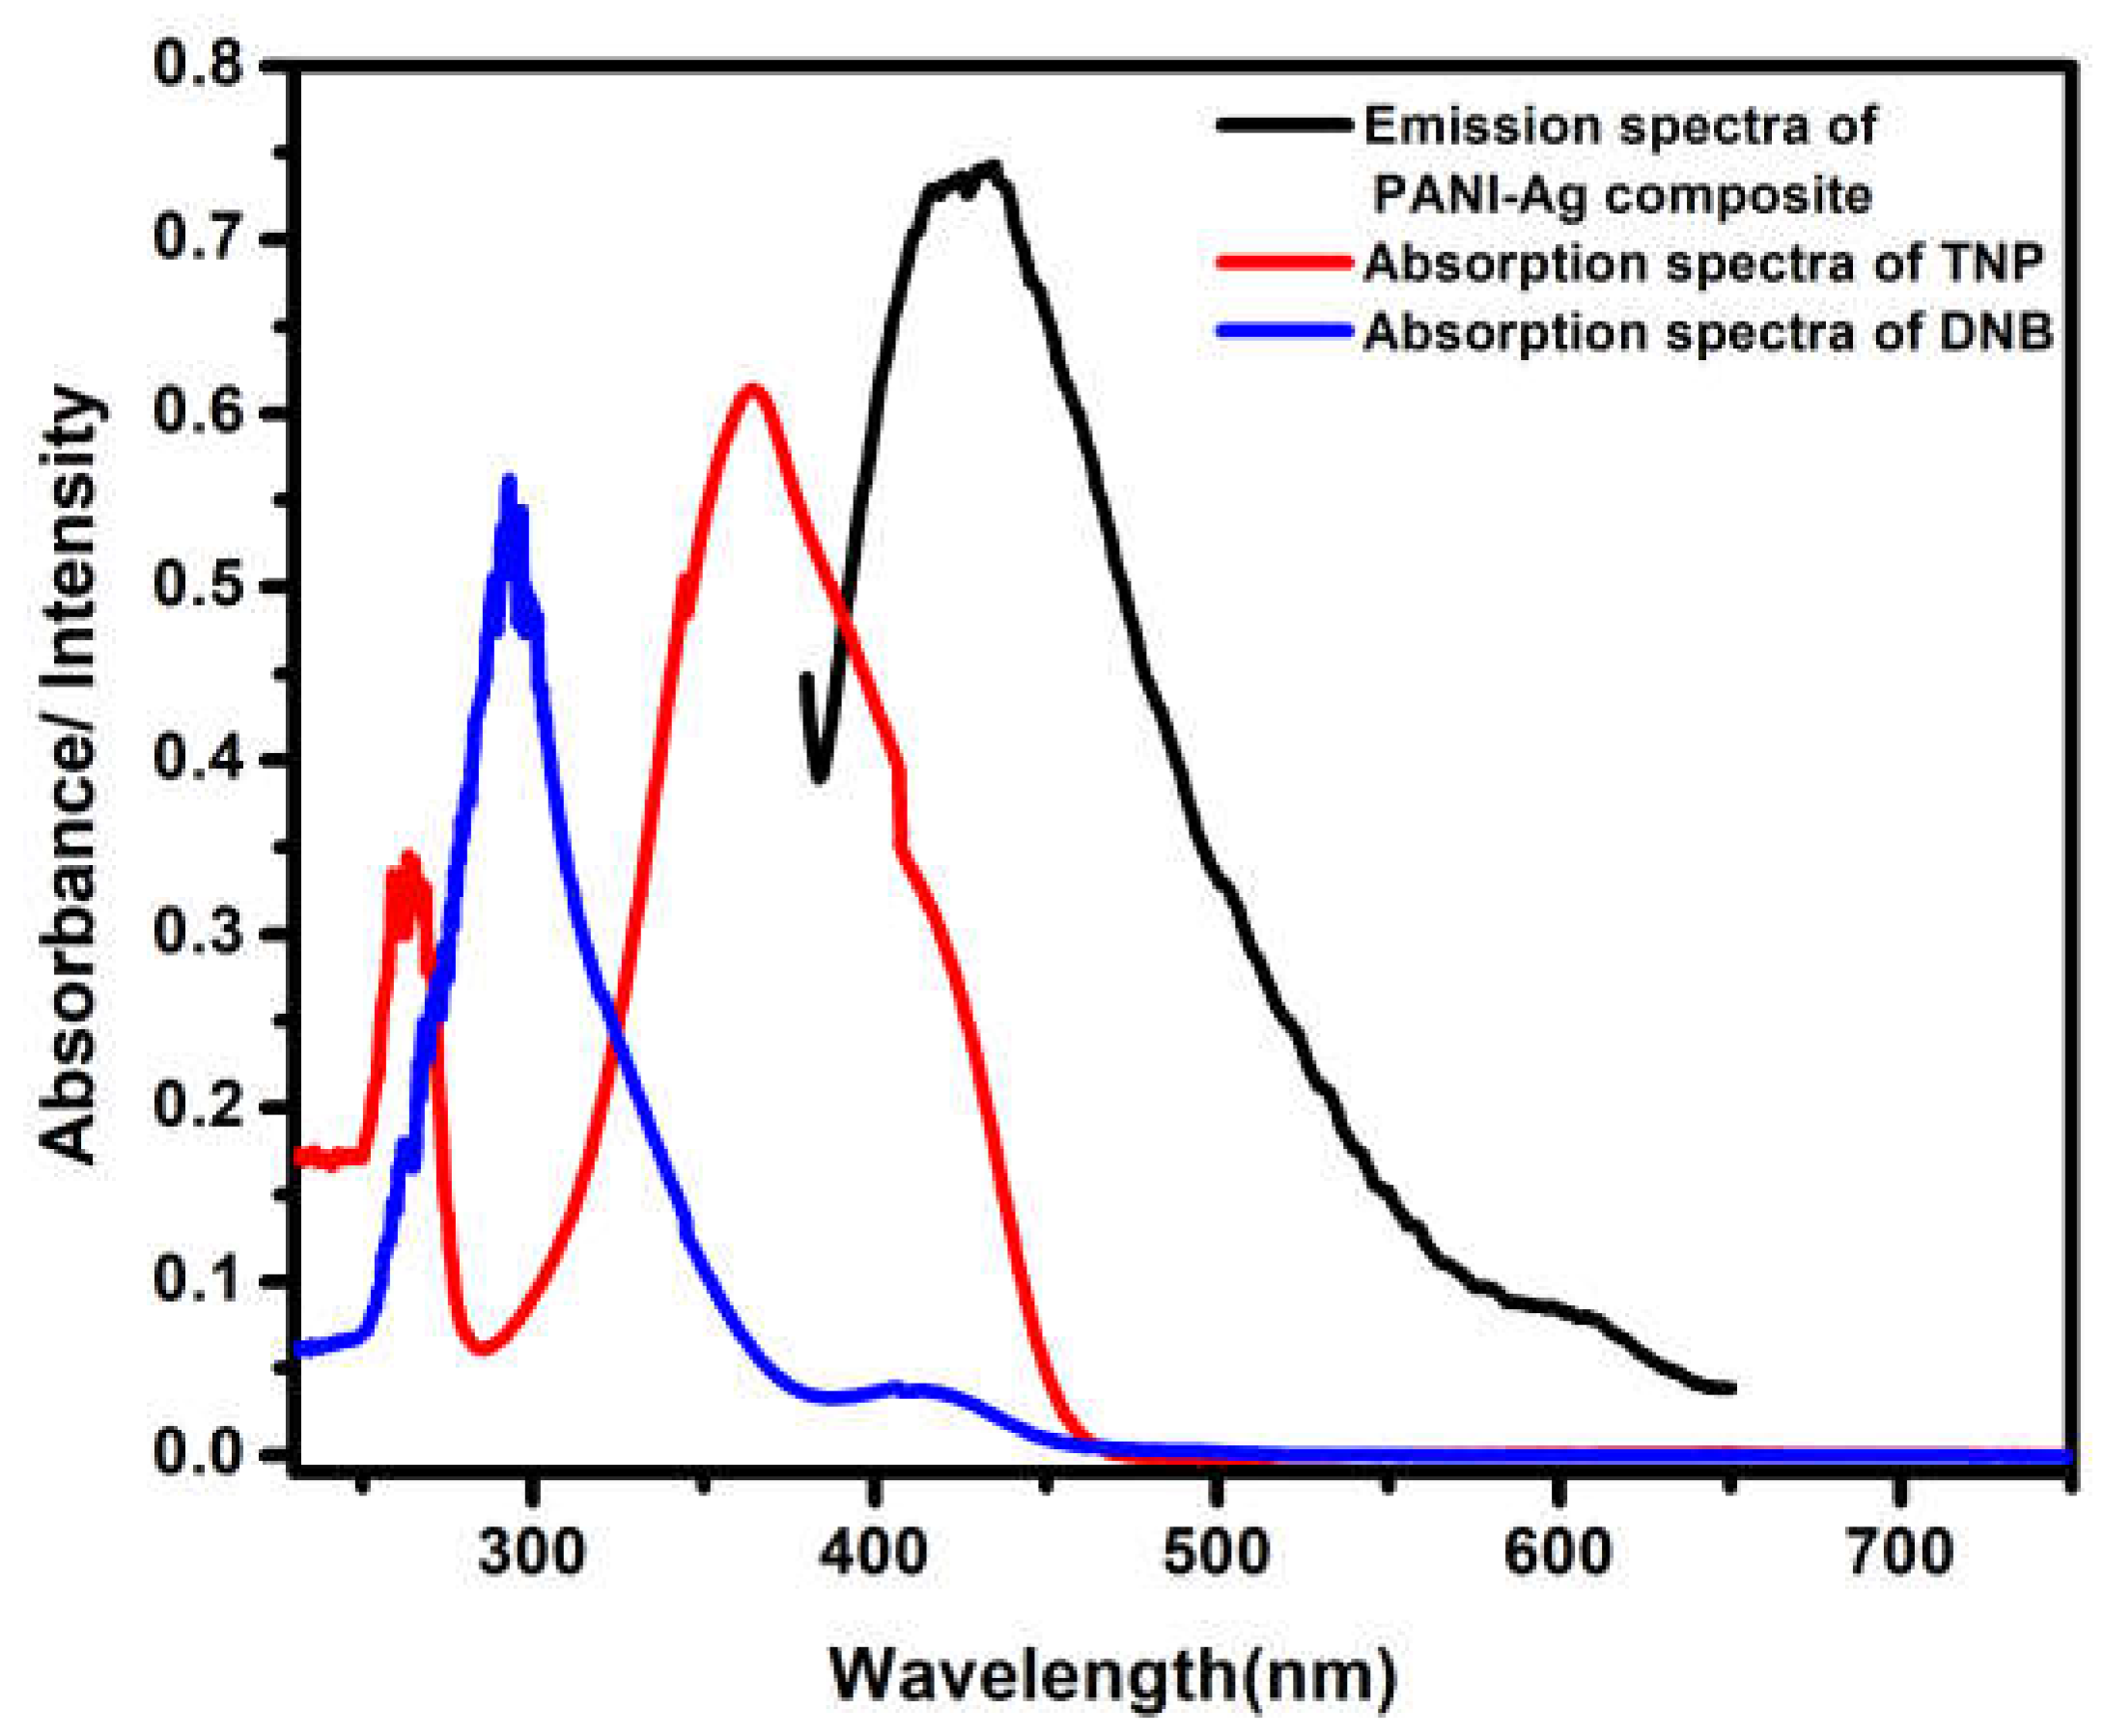
Furthermore, the presence of three nitro groups (electron-withdrawing group) in TNP makes TNP an electron-deficient molecule, reducing the energy gap between HOMO and LUMO of the analyte [59]. The fluorophores photo-excited electrons from HOMO to LUMO converts LUMO into HOMO during electron transfer and these electrons are transferred from the HOMO of the PANI-Ag composite to the LUMO of the TNP which is present at a lower energy state due to presence of the nitro group by which photoinduced electro transfer (PET) takes place during the quenching. The nitro groups interact with the nitrogen attached to the benzenoid and quinoid groups, i.e., secondary and tertiary amine groups as shown in Figure 11 [26,34]. Figure 12 shows the absorbance spectra of TNP and DNB with emission spectra of the PANI-Ag composite showing a small overlap between the absorbance of TNP and emission of a fluorophore due to the small presence of the FRET mechanism for quenching. Overall, these results show that the PANI-Ag composite acts as a potential fluorophore for the detection of nitro compounds (TNP) and can be used in optoelectronic devices.

4. Conclusions

A PANI-Ag composite was synthesized by interfacial polymerization using a chemical oxidation method. The XRD analysis revealed cubic crystalline silver with a crystallite size of 19.6 nm. The formation of the thermally stable PANI-Ag composite was confirmed by characterization techniques. The synthesized PANI-Ag composite was used as a fluorophore for detecting nitroaromatic compounds such as TNP and DNB in this study. The mechanism and efficiency of quenching were deduced from the studies. From the S–V plot, the quenching constant value Ksv of TNP and DNB were found to be 0.1037 × 10⁶ M−1 and 0.161 × 10⁴ M−1, respectively. Fluorescence quenching studies show the formation of the exciplex complex formed between the PANI-Ag composite with TNP which shows the dynamic quenching on the interaction with TNP following the PET mechanism. The LOD was found to be less for TNP = 5.58 × 10⁻⁷ M (0.127 ppm) compared with DNB = 23.30 × 10⁻⁶ M. The morphology and thermal studies show that the PANI-Ag composite has a large surface area with high stability, making it a potential material for sensing studies of high-energetic nitroaromatic compounds or explosives.

Author Contributions

S.A.T.: conducted the experiments, writing—original draft; S.D.P. and B.Z.Z.: visualization, writing—review and editing; V.A.: supervised and guided the research. All authors have read and agreed to the published version of the manuscript.

Funding

This research received no external funding.

Institutional Review Board Statement

Not applicable.

Informed Consent Statement

Not applicable.

Data Availability Statement

Not applicable.

Acknowledgments

The author, Satish Ashok Ture thank Ksteps, Dst., Govt. of Karnataka (Che-02:2021-22) for their financial support. The corresponding author expresses his thanks to UGC, New Delhi, for the BSR faculty fellowship (F.4-5(11)/2019(BSR)).

Conflicts of Interest

There is no conflict of interest.

References

  1. Shanmugaraju, S.; Joshi, S.A.; Mukherjee, P.S. Fluorescence and visual sensing of nitroaromatic explosives using electron rich discrete fluorophores. J. Mater. Chem. 2011, 21, 9130–9138. [Google Scholar] [CrossRef]
  2. Rong, M.; Lin, L.; Song, X.; Zhao, T.; Zhong, Y.; Yan, J.; Wang, Y.; Chen, X. A Label-Free Fluorescence Sensing Approach for Selective and Sensitive Detection of 2,4,6-Trinitrophenol (TNP) in Aqueous Solution Using Graphitic Carbon Nitride Nanosheets. Anal. Chem. 2015, 87, 1288–1296. [Google Scholar] [CrossRef] [PubMed]
  3. Moore, D.S. Instrumentation for trace detection of high explosives. Rev. Sci. Instrum. 2004, 75, 2499–2512. [Google Scholar] [CrossRef]
  4. Lehnert, A.L.; Kearfott, K.J. The Detection of Explosive Materials: Review of Considerations and Methods. Nucl. Technol. 2010, 172, 325–334. [Google Scholar] [CrossRef]
  5. Thomas, S.W.; Joly, G.D.; Swager, T.M. Chemical Sensors Based on Amplifying Fluorescent Conjugated Polymers. Chem. Rev. 2007, 107, 1339–1386. [Google Scholar] [CrossRef]
  6. Pandya, A.; Goswami, H.; Lodha, A.; Menon, S.K. A novel nanoaggregation detection technique of TNT using selective and ultrasensitive nanocurcumin as a probe. Analyst 2012, 137, 1771–1774. [Google Scholar] [CrossRef]
  7. Dasary, S.S.R.; Singh, A.K.; Lee, K.S.; Yu, H.; Ray, P.C. A miniaturized fiber-optic fluorescence analyzer for detection of Picric-acid explosive from commercial and environmental samples. Sens. Actuators B Chem. 2018, 255, 1646–1654. [Google Scholar] [CrossRef]
  8. Kartha, K.K.; Sandeep, A.; Praveen, V.K.; Ajayaghosh, A. Detection of Nitroaromatic Explosives with Fluorescent Molecular Assemblies and π-Gels. Chem. Rec. 2015, 15, 252–265. [Google Scholar] [CrossRef]
  9. Ghosh, S.; Praveen, V.K.; Ajayaghosh, A. The Chemistry and Applications of π-Gels. Annu. Rev. Mater. Res. 2016, 46, 235–262. [Google Scholar] [CrossRef]
  10. Xing, S.; Bing, Q.; Qi, H.; Liu, J.; Bai, T.; Li, G.; Shi, Z.; Feng, S.; Xu, R. Rational Design and Functionalization of a Zinc Metal–Organic Framework for Highly Selective Detection of 2,4,6-Trinitrophenol. ACS Appl. Mater. Interfaces 2017, 9, 23828–23835. [Google Scholar] [CrossRef]
  11. Zhang, Z.; Chen, S.; Shi, R.; Ji, J.; Wang, D.; Jin, S.; Han, T.; Zhou, C.; Shu, Q. A single molecular fluorescent probe for selective and sensitive detection of nitroaromatic explosives: A new strategy for the mask-free discrimination of TNT and TNP within same sample. Talanta 2017, 166, 228–233. [Google Scholar] [CrossRef]
  12. Ma, H.; Li, B.; Zhang, L.; Han, D.; Zhu, G. Targeted synthesis of core–shell porous aromatic frameworks for selective detection of nitro aromatic explosives via fluorescence two-dimensional response. J. Mater. Chem. A 2015, 3, 19346–19352. [Google Scholar] [CrossRef]
  13. Jiang, W.; Xia, L.; Li, D.; Wu, P.; Zou, T.; Yuan, X.; Wei, W.; Wang, J. An Ultrasensitive Picric Acid Sensor Based on a Robust 3D Hydrogen-Bonded Organic Framework. Biosensors 2022, 12, 682. [Google Scholar] [CrossRef]
  14. Zhang, F.; Chen, S.; Nie, S.; Luo, J.; Lin, S.; Wang, Y.; Yang, H. Waste PET as a Reactant for Lanthanide MOF Synthesis and Application in Sensing of Picric Acid. Polymers 2019, 11, 2015. [Google Scholar] [CrossRef]
  15. Banerjee, D.; Akkanaboina, M.; Ghosh, S.; Soma, V.R. Picosecond Bessel Beam Fabricated Pure, Gold-Coated Silver Nanostructures for Trace-Level Sensing of Multiple Explosives and Hazardous Molecules. Materials 2022, 15, 4155. [Google Scholar] [CrossRef]
  16. Prabu, H.G.; Talawar, M.B.; Mukundan, T.; Asthana, S.N. Studies on the utilization of stripping voltammetry technique in the detection of high-energy materials. Combust. Explos. Shock Waves 2011, 47, 87. [Google Scholar] [CrossRef]
  17. Bubniene, U.S.; Ratautaite, V.; Ramanavicius, A.; Bucinskas, V. Conducting Polymers for the Design of Tactile Sensors. Polymers 2022, 14, 2984. [Google Scholar] [CrossRef]
  18. Koster, L.J.A.; Mihailetchi, V.D.; Blom, P.W.M. Ultimate efficiency of polymer/fullerene bulk heterojunction solar cells. Appl. Phys. Lett. 2006, 88, 093511. [Google Scholar] [CrossRef]
  19. Bavatharani, C.; Muthusankar, E.; Wabaidur, S.M.; Alothman, Z.A.; Alsheetan, K.M.; Al-Anazy, M.M.; Ragupathy, D. Electrospinning technique for production of polyaniline nanocomposites/nanofibres for multi-functional applications: A review. Synth. Met. 2021, 271, 116609. [Google Scholar] [CrossRef]
  20. Huang, S.; He, Q.; Xu, S.; Wang, L. Polyaniline-Based Photothermal Paper Sensor for Sensitive and Selective Detection of 2,4,6-Trinitrotoluene. Anal. Chem. 2015, 87, 5451–5456. [Google Scholar] [CrossRef]
  21. Zhang, W.; Wu, Z.; Hu, J.; Cao, Y.; Guo, J.; Long, M.; Duan, H.; Jia, D. Flexible chemiresistive sensor of polyaniline coated filter paper prepared by spraying for fast and non-contact detection of nitroaromatic explosives. Sens. Actuators B Chem. 2020, 304, 127233. [Google Scholar] [CrossRef]
  22. Yuan, C.L.; Chang, C.P.; Hong, Y.S.; Sung, Y. Fabrication of MWNTs-PANI composite - a chemiresistive sensor material for the detection of explosive gases. Mater. Sci. 2009, 27, 509–520. [Google Scholar]
  23. Singh, A.; Samanta, S.; Roy, P.; Kar, P. Poly(m-aminophenol)/Silver Nanorod Composite Based Paper Strip for Chemo-Resistive Picric Acid Sensing. Sens. Lett. 2019, 17, 219–227. [Google Scholar] [CrossRef]
  24. Melnikov, P.; Bobrov, A.; Marfin, Y. On the Use of Polymer-Based Composites for the Creation of Optical Sensors: A Review. Polymers 2022, 14, 4448. [Google Scholar] [CrossRef]
  25. Mokhtar, N.A.I.M.; Zawawi, R.M.; Khairul, W.M.; Yusof, N.A. Electrochemical and optical sensors made of composites of metal–organic frameworks and carbon-based materials. A review. Environ. Chem. Lett. 2022, 20, 3099–3131. [Google Scholar] [CrossRef]
  26. Venkatappa, L.; Ture, S.A.; Yelamaggad, C.V.; Sundaram, V.N.N.; Martínez-Máñez, R.; Abbaraju, V. Mechanistic Insight into the Turn-Off Sensing of Nitroaromatic Compounds Employing Functionalized Polyaniline. ChemistrySelect 2020, 5, 6321–6330. [Google Scholar] [CrossRef]
  27. Ture, S.A.; Pattathil, S.D.; Patil, V.B.; Yelamaggad, C.V.; Martínez-Máñez, R.; Abbaraju, V. Synthesis and fluorescence sensing of energetic materials using benzenesulfonic acid-doped polyaniline. J. Mater. Sci. Mater. Electron. 2022, 33, 8551–8565. [Google Scholar] [CrossRef]
  28. Huang, H.; Wang, K.; Xiao, Y.; Zhai, Q.; An, D.; Huang, S.; Li, D. The amplified fluorescence quenching of heteroatomic conjugated polymers based on the “molecular wire” effects. Chin. Sci. Bull. 2003, 48, 1947–1951. [Google Scholar] [CrossRef]
  29. Bedre, M.D.; Basavaraja, S.; Salwe, B.D.; Shivakumar, V.; Arunkumar, L.; Venkataraman, A. Preparation and characterization of Pani and Pani-Ag nanocomposites via interfacial polymerization. Polym. Compos. 2009, 30, 1668–1677. [Google Scholar] [CrossRef]
  30. Mota, M.L.; Carrillo, A.; Verdugo, A.J.; Olivas, A.; Guerrero, J.M.; De la Cruz, E.C.; Noriega Ramírez, N. Synthesis and Novel Purification Process of PANI and PANI/AgNPs Composite. Molecules 2019, 24, 1621. [Google Scholar] [CrossRef]
  31. Morávková, Z.; Bober, P. Writing in a Polyaniline Film with Laser Beam and Stability of the Record: A Raman Spectroscopy Study. Int. J. Polym. Sci. 2018, 2018, 1797216. [Google Scholar] [CrossRef] [Green Version]
  32. Silva, J.E.P.D.; Temperini, M.L.A.; Torresi, S.I.C.D. Characterization of conducting polyaniline blends by Resonance Raman Spectroscopy. J. Braz. Chem. Soc. 2005, 16, 322–327. [Google Scholar] [CrossRef]
  33. Trchová, M.; Stejskal, J. Polyaniline: The infrared spectroscopy of conducting polymer nanotubes (IUPAC Technical Report). Pure Appl. Chem. 2011, 83, 1803. [Google Scholar] [CrossRef]
  34. Ture, S.A.; Patil, V.B.; Yelamaggad, C.V.; Martinez-Mañez, R.; Abbaraju, V. Understanding of Mechanistic Perspective in Sensing of Energetic Nitro Compounds through Spectroscopic and Electrochemical studies. J. Appl. Polym. Sci. 2021, 138, 50776. [Google Scholar] [CrossRef]
  35. Zhang, Y.; Liu, J.; Zhang, Y.; Liu, J.; Duan, Y. Facile synthesis of hierarchical nanocomposites of aligned polyaniline nanorods on reduced graphene oxide nanosheets for microwave absorbing materials. RSC Adv. 2017, 7, 54031–54038. [Google Scholar] [CrossRef]
  36. Meng, Y. A Sustainable Approach to Fabricating Ag Nanoparticles/PVA Hybrid Nanofiber and Its Catalytic Activity. Nanomaterials 2015, 5, 1124–1135. [Google Scholar] [CrossRef]
  37. Yang, X.; Du, Y.; Li, D.; Lv, Z.; Wang, E. One-step synthesized silver micro-dendrites used as novel separation mediums and their applications in multi-DNA analysis. Chem. Commun. 2011, 47, 10581–10583. [Google Scholar] [CrossRef]
  38. Sowmyya, T.; Lakshmi, G.V. Soymida febrifuga aqueous root extract maneuvered silver nanoparticles as mercury nanosensor and potential microbicide. World Sci. News 2018, 114, 84–105. [Google Scholar]
  39. Christensen, L.; Vivekanandhan, S.; Misra, M.; Kumar Mohanty, A. Biosynthesis of silver nanoparticles using murraya koenigii (curry leaf): An investigation on the effect of broth concentration in reduction mechanism and particle size. Adv. Mater. Lett. 2011, 2, 429–434. [Google Scholar] [CrossRef]
  40. Ahmed, S.M. Preparation and degradation of highly conducting polyaniline doped with picric acid. Eur. Polym. J. 2002, 38, 1151–1158. [Google Scholar] [CrossRef]
  41. Pramanik, S.; Hu, Z.; Zhang, X.; Zheng, C.; Kelly, S.; Li, J. A Systematic Study of Fluorescence-Based Detection of Nitroexplosives and Other Aromatics in the Vapor Phase by Microporous Metal–Organic Frameworks. Chem. A Eur. J. 2013, 19, 15964–15971. [Google Scholar] [CrossRef] [PubMed]
  42. Samworth, C.M.; Esposti, M.D.; Lenaz, G. Quenching of the intrinsic tryptophan fluorescence of mitochondrial ubiquinol—cytochrome-c reductase by the binding of ubiquinone. Eur. J. Biochem. 1988, 171, 81–86. [Google Scholar] [CrossRef] [PubMed]
  43. Li, Q.; Tan, X.; Fu, L.; Liu, Q.; Tang, W. A novel fluorescence and resonance Rayleigh scattering probe based on quantum dots for the detection of albendazole. Anal. Methods 2015, 7, 614–620. [Google Scholar] [CrossRef]
  44. Pattathil, D.S.; Ture, A.S.; Martinez-Manez, R.; Abbaraju, V. The Role of Polyvinylpyrrolidone as a Potential Fluorophore for the Detection of Nitroaromatic Explosives. Curr. Chin. Chem. 2022, 2, 43–49. [Google Scholar] [CrossRef]
  45. Sambyal, P.; Singh, A.P.; Verma, M.; Farukh, M.; Singh, B.P.; Dhawan, S.K. Tailored polyaniline/barium strontium titanate/expanded graphite multiphase composite for efficient radar absorption. RSC Adv. 2014, 4, 12614–12624. [Google Scholar] [CrossRef]
  46. Hengchang, M.; Zhongwei, Z.; Yuanyuan, J.; Lajia, Z.; Chunxuan, Q.; Haiying, C.; Zengming, Y.; Zhiwang, Y.; Ziqiang, L. Triphenylamine-decorated BODIPY fluorescent probe for trace detection of picric acid. RSC Adv. 2015, 5, 87157–87167. [Google Scholar] [CrossRef]
  47. Bhalla, V.; Gupta, A.; Kumar, M.; Rao, D.S.S.; Prasad, S.K. Self-Assembled Pentacenequinone Derivative for Trace Detection of Picric Acid. ACS Appl. Mater. Interfaces 2013, 5, 672–679. [Google Scholar] [CrossRef]
  48. Kaleeswaran, D.; Murugavel, R. Picric acid sensing and CO2 capture by a sterically encumbered azo-linked fluorescent triphenylbenzene based covalent organic polymer. J. Chem. Sci. 2018, 130, 1. [Google Scholar] [CrossRef]
  49. Lakshmidevi, V.; Yelamaggad, C.V.; Venkataraman, A. Studies on Fluorescence Quenching of DBSA-PANI-Employing Nitroaromatics. ChemistrySelect 2018, 3, 2655–2664. [Google Scholar] [CrossRef]
  50. Zhang, W.; Gao, B.; Guo, X.; Dong, W. Polyfluorene based fluorescent sensor for sensitive and selective detection of picric acid. Mater. Lett. 2022, 306, 130860. [Google Scholar] [CrossRef]
  51. Singh, R.; Mitra, K.; Singh, S.; Senapati, S.; Patel, V.K.; Vishwakarma, S.; Kumari, A.; Singh, J.; Sen Gupta, S.K.; Misra, N.; et al. Highly selective fluorescence ‘turn off’ sensing of picric acid and efficient cell labelling by water-soluble luminescent anthracene-bridged poly(N-vinyl pyrrolidone). Analyst 2019, 144, 3620–3634. [Google Scholar] [CrossRef]
  52. Ahmed, R.; Ali, A.; Ahmad, M.; Alsalme, A.; Khan, R.A.; Ali, F. Phenanthroimidazole derivatives as a chemosensor for picric acid: A first realistic approach. New J. Chem. 2020, 44, 20092–20100. [Google Scholar] [CrossRef]
  53. Parvathy, P.A.; Dheepika, R.; Abhijnakrishna, R.; Imran, P.K.M.; Nagarajan, S. Fluorescence quenching of triarylamine functionalized phenanthroline-based probe for detection of picric acid. J. Photochem. Photobiol. A Chem. 2020, 401, 112780. [Google Scholar] [CrossRef]
  54. Ghosh, D.; Basak, M.; Deka, D.; Das, G. Fabrication and photophysical assessment of quinoxaline based chemosensor: Selective determination of picric acid in hydrogel and aqueous medium. J. Mol. Liq. 2022, 363, 119816. [Google Scholar] [CrossRef]
  55. Santiwat, T.; Sornkaew, N.; Srikittiwanna, K.; Sukwattanasinitt, M.; Niamnont, N. Electrospun nanofiber sheets mixed with a novel triphenylamine-pyrenyl salicylic acid fluorophore for the selective detection of picric acid. J. Photochem. Photobiol. A Chem. 2023, 434, 114258. [Google Scholar] [CrossRef]
  56. Kumar, A.; Nath, P.; Kumar, V.; Kumar Tailor, N.; Satapathi, S. 3D printed optical sensor for highly sensitive detection of picric acid using perovskite nanocrystals and mechanism of photo-electron transfer. Spectrochim. Acta Part A Mol. Biomol. Spectrosc. 2023, 286, 121956. [Google Scholar] [CrossRef]
  57. Mukherjee, D.; Das, P.; Kundu, S.; Mandal, B. Engineering of graphene quantum dots by varying the properties of graphene oxide for fluorescence detection of picric acid. Chemosphere 2022, 300, 134432. [Google Scholar] [CrossRef]
  58. Lin, Q.; Chu, H.; Chen, J.; Gao, L.; Zong, W.; Han, S.; Li, J. Dual-emission ratiometric fluorescence probe based on copper nanoclusters for the detection of rutin and picric acid. Spectrochim. Acta Part A Mol. Biomol. Spectrosc. 2022, 270, 120829. [Google Scholar] [CrossRef]
  59. Tan, X.; Zhang, T.; Zeng, W.; He, S.; Liu, X.; Tian, H.; Shi, J.; Cao, T. A Fluorescence Sensing Determination of 2,4,6-Trinitrophenol Based on Cationic Water-Soluble Pillar[6]arene Graphene Nanocomposite. Sensors 2019, 19, 91. [Google Scholar] [CrossRef] [Green Version]
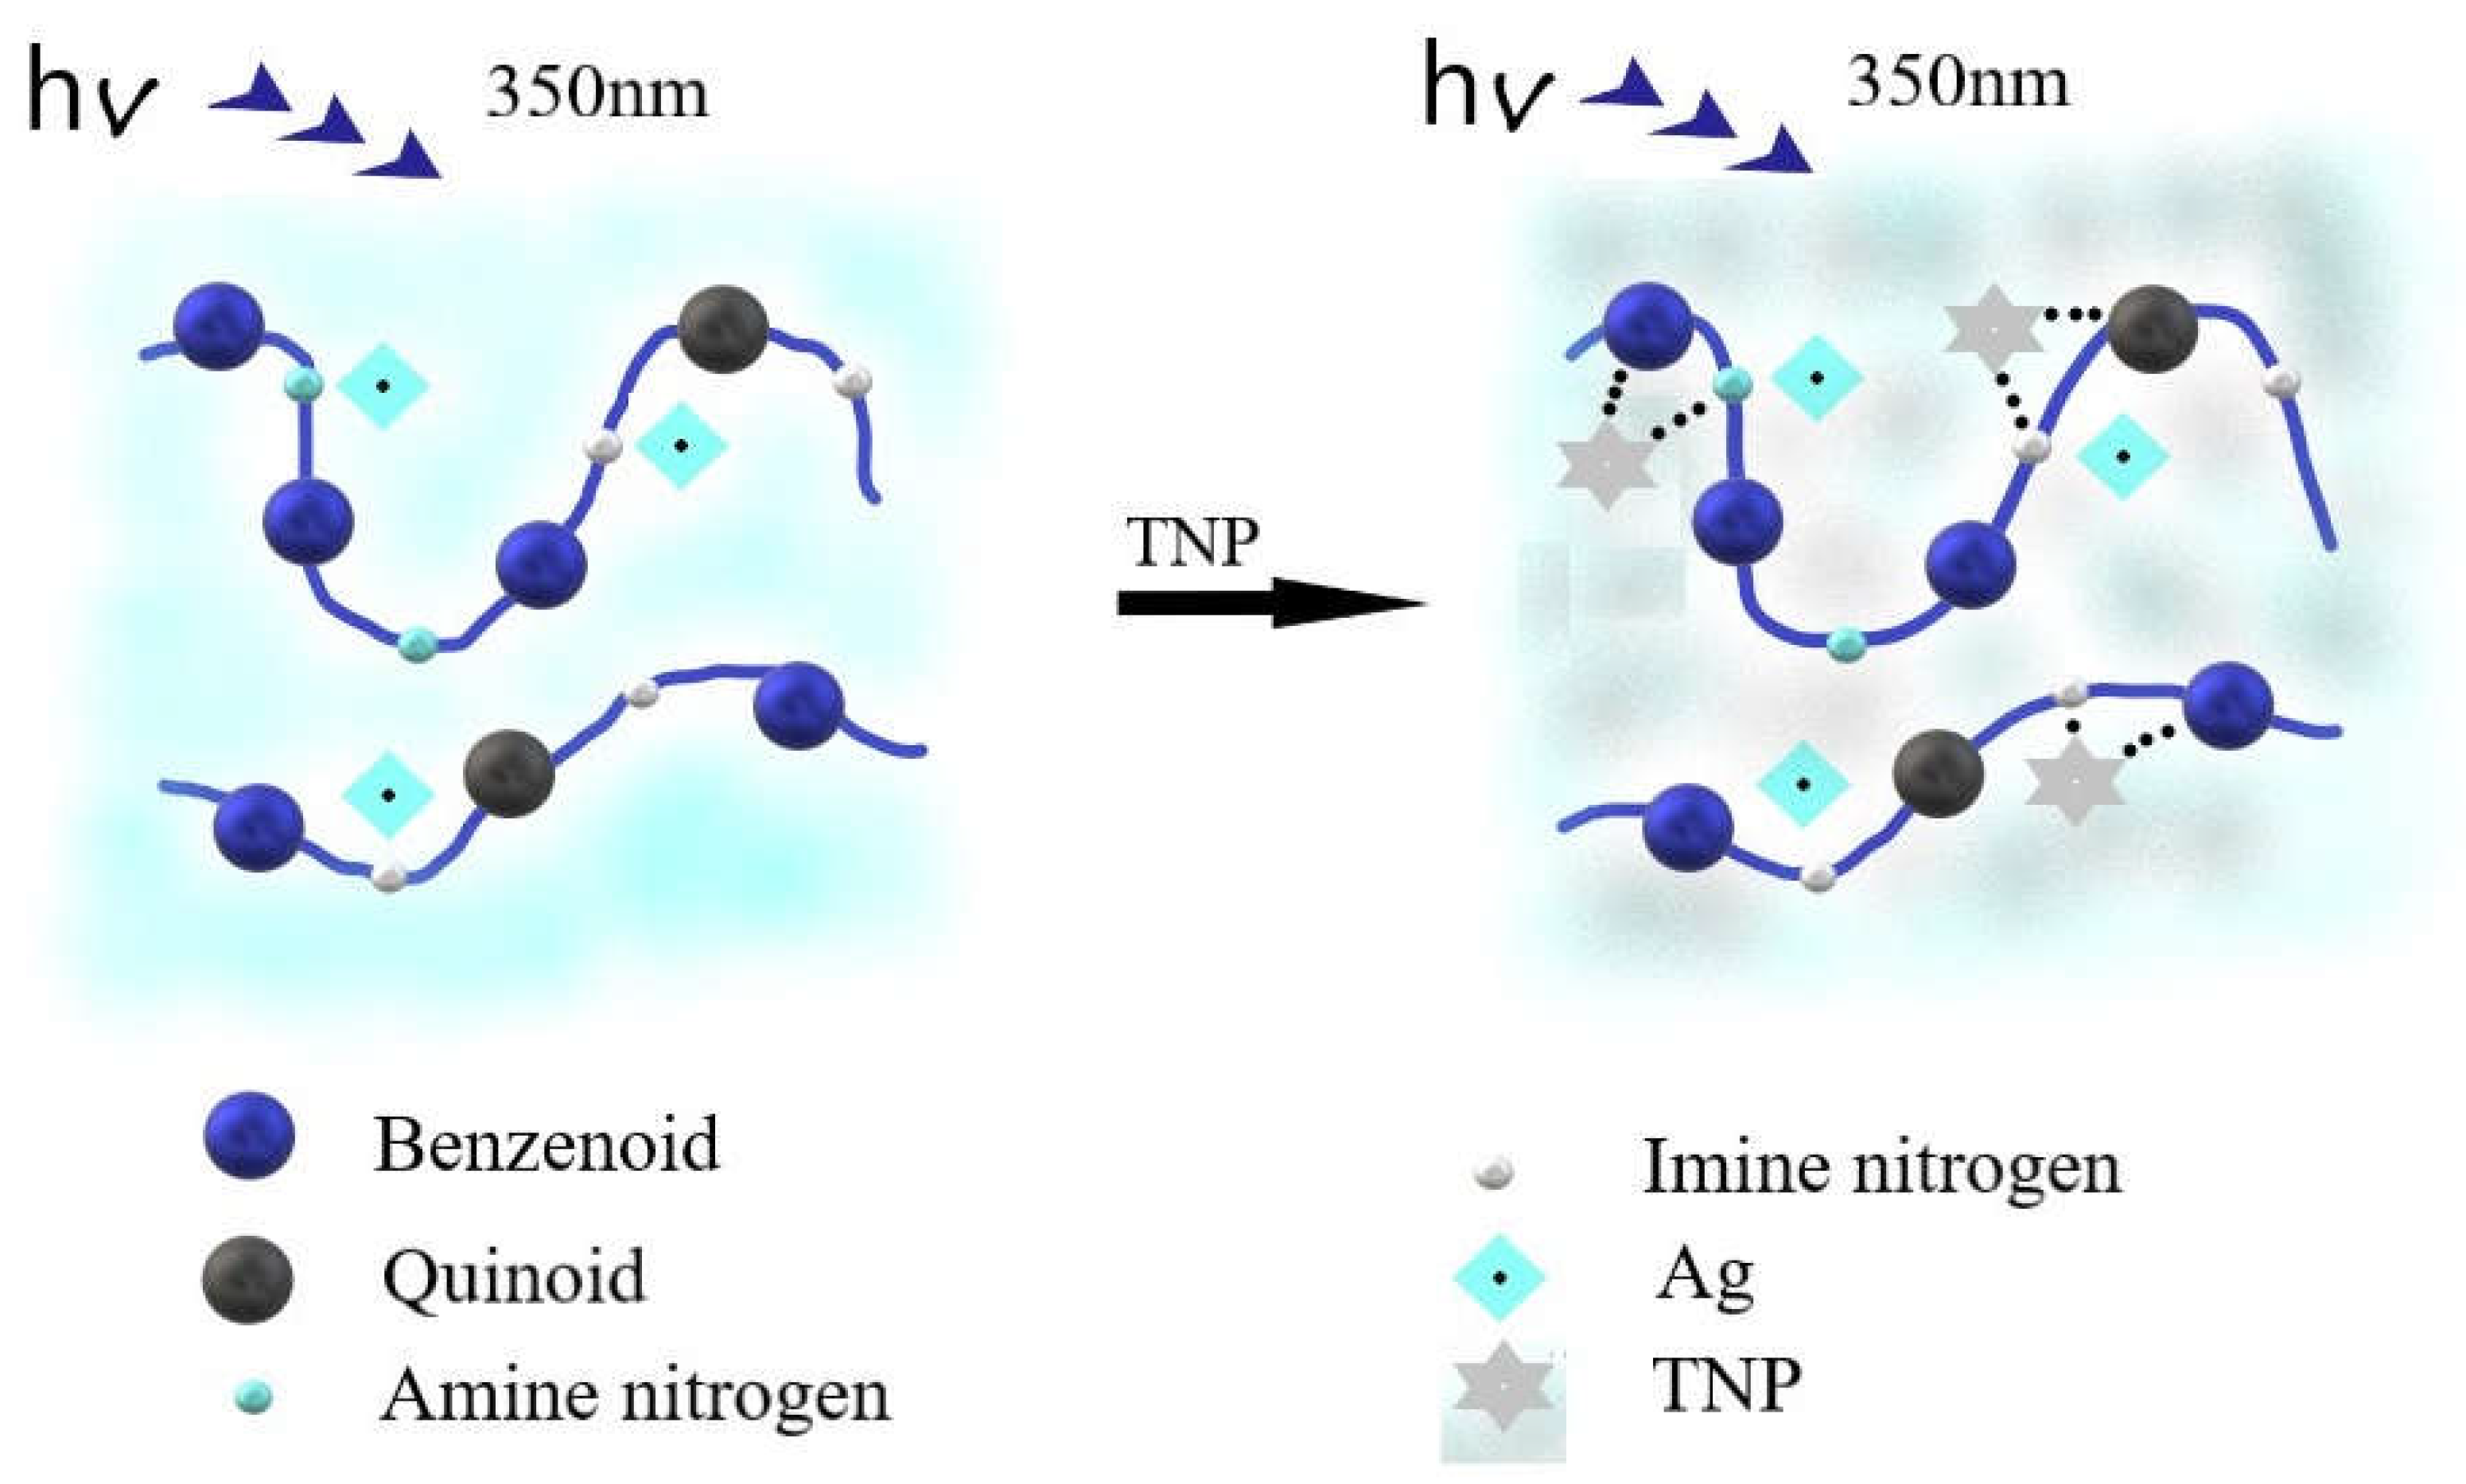
Figure 1. PANI-Ag composite and interaction of TNP with the PANI-Ag composite.
Micro 03 00016 g001
Figure 2. Flow chart for synthesis of the PANI-Ag composite.
Micro 03 00016 g002
Figure 3. FTIR spectra of PANI and the PANI-Ag composite.
Micro 03 00016 g003
Figure 4. SEM images of PANI and the PANI-Ag composite.
Micro 03 00016 g004
Figure 5. EDAX images of the PANI-Ag composite.
Micro 03 00016 g005
Figure 6. X-ray diffractogram of PANI and the PANI-Ag composite.
Micro 03 00016 g006
Figure 7. TGA thermograms of PANI and the PANI-Ag composite.
Micro 03 00016 g007
Figure 8. UV-vis spectra of PANI and the PANI-Ag composite.
Micro 03 00016 g008
Figure 9. Emission spectra of PANI-Ag composite at different excitation wavelengths.
Micro 03 00016 g009
Figure 10. (a) Fluorescence spectra of the PANI-Ag composite with TNP. (b) Fluorescence spectra of the PANI-Ag composite with DNB. (c) Stern–Volmer plot inserted with LOD plot of the PANI-Ag composite with TNP. (d) Stern–Volmer plot inserted with LOD plot of the PANI-Ag composite with DNB.
Micro 03 00016 g010
Figure 11. Interaction of TNP with the PANI-Ag composite.
Micro 03 00016 g011
Figure 12. Absorbance spectra of TNP and emission spectra of the PANI-Ag composite.
Micro 03 00016 g012
Table 1. FTIR spectral assignment for PANI and the PANI-Ag composite.
PANI PANI-AgAssignments
15581577N=Q=N Quinoid (Q) ring stretching
14791485N-B-N Benzenoid (B) ring stretching
1381C–N stretching in QBQ units
12941296(C–N) stretching of secondary aromatic amine
12381240(C–N) stretching of primary aromatic amine
11051109Q=NH+–B or B–NH+•–B
1008981HNO3/NO3 group on aromatic ring gamma (C–H) (1,4-disubstituted ring)/Q ring Deformation
875879HNO3, NO3
794794c(C–H) (monosubstituted or 1,2-disubstituted ring)
702702Out-of-plane ring bending (monosubstituted ring)
615594HNO3
Table 2. X-ray peaks of PANI and the PANI-Ag composite.
Sample(h k l) ValuesSample(h k l) Values
PANI9.2
15.4
20.3
25.4
43.9
64.3
//
(0 1 1)
(0 2 0)
(2 0 0)
//
//
PANI-Ag composite8.9
14.7
20.7
25.1
27.7
32.1
44
46.1
54.7
57.4
64.3
67
76
//
(0 1 1)
(0 2 0)
(2 0 0)
(2 1 0)
(1 1 1)
(2 0 0)
(2 3 1)
(1 4 2)
(2 4 1)
//
(2 2 0)
(3 1 1)
Table 3. Limit of detection of variable fluorescent probes with TNP.
Sl. No (Paper)Fluorescent ProbeLOD
50Poly fluorene derivatives0.27 ppm
51Anthracene-bridged poly (N-vinylpyrrolidone)6 × 10⁻⁶ M
52Phenanthroimidazole derivatives 0.64, 0.53 and 1.05 ppm
53Triarylamine-functionalized phenanthrolinemicromolar level
54Quinoxaline-amine-based probe5.21 ppm
55Triphenylamine-pyrenyl salicylic acid 0.57 × 10⁻⁶ M
56P-xylylene-diamine-capped CH3NH3PbBr3 perovskite0.3 × 10−6 M
57Graphene oxide (GO) on the synthesis of graphene quantum dots (GQD)1.2 × 10⁻⁶ M
58Polyvinylpyrrolidone-templated copper nanoclusters 0.84 × 10⁻⁶ M and 0.27 × 10⁻⁶ M
26CSA-PANI6.14 × 10−7 M
49DBSA-PANI1 × 10−6 M
Present workPANI-Ag composite5.58 × 10−7 M (0.127 ppm)
Disclaimer/Publisher’s Note: The statements, opinions and data contained in all publications are solely those of the individual author(s) and contributor(s) and not of MDPI and/or the editor(s). MDPI and/or the editor(s) disclaim responsibility for any injury to people or property resulting from any ideas, methods, instructions or products referred to in the content.