Abstract
(1) Background: Fixed-dose combination (FDC) improves patient convenience and therapeutic adherence by combining suitable drugs in a single dose form. This study examined the in vitro dissolution of an ibuprofen-loratadine FDC oral suspension to commercial reference formulations. (2) Methods: The FDC suspension (ibuprofen 200 mg/5 mL, loratadine 5 mg/5 mL) was tested against Fenbro 8 Plus and Lorid on USP Apparatus II at 50 rpm and 37 ± 0.5 °C. Dissolution testing was carried out in 900 mL of phosphate buffer (pH 7.2) for ibuprofen and 0.1 N HCl (pH 3.3) for loratadine. Quantification was performed using validated high-performance liquid chromatography linked with ultraviolet detector (HPLC-UV) procedures complying with the ICH Q2 (R2) guidelines. (3) Results: The linearity of the HPLC methods for ibuprofen and loratadine was (R2 > 0.99), accuracy (99.6–100.18%), and precision (%RSD < 2). For both loratadine and ibuprofen, the FDC suspension’s Q15, Q30, T50, T90, and DE% values nearly matched those of the commercial products. Over 95% of both drugs were released within 60 min. The dissolution equivalence between the FDC and the reference formulations was demonstrated by the calculated similarity (f2) and difference (f1) factors, which were f1 = 3 and f2 = 70 for ibuprofen, and f1 = 4 and f2 = 64 for loratadine. (4) Conclusions: The FDC suspension of ibuprofen and loratadine showed dissolving behavior comparable to commercial formulations, confirming its applicability for the practical and efficient treatment of allergy symptoms and inflammatory pain.
1. Introduction
In many clinical conditions, allergy is accompanied by pain, hence requiring the concomitant use of an antihistaminic drug and a painkiller. Loratadine, a long-acting H1 antihistamine, is commonly used to relieve the symptoms of urticaria, allergic rhinitis, and other allergic conditions [1], while ibuprofen, a non-steroidal anti-inflammatory drug (NSAID), has analgesic, antipyretic, and anti-inflammatory effects [2]. When pain, inflammation, and histaminergic allergy symptoms are present, a fixed-dose combination (FDC) of these two drugs may increase patient convenience, improve adherence, and deliver synergistic relief. Children are more prone to such ailments due to a compromised immune system [3,4]. FDC also needs to be formulated for the pediatric group in an appropriate dosage form [5].
According to recent research, the development of pediatric FDCs should emphasize palatability, age-appropriate excipients, and simplicity of administration in addition to efficacy, since these factors can significantly enhance adherence and therapeutic results [6,7].
However, there are formulation challenges when two active pharmaceutical ingredients (APIs) are combined in one oral suspension. Pharmacokinetic parameter evaluation in pediatrics is difficult due to ethical and practical concerns. Thus, the in vitro dissolution testing is becoming an essential tool for the prediction of in vivo performance, especially for BCS Class II drugs with dissolution-limited absorption [8,9]. In such circumstances, in vitro dissolution studies are of prime importance. Similarly, FDCs’ in vitro dissolution profiles of pharmaceutical suspensions must be similar to those of the separately marketed monotherapy suspensions [10].
Ibuprofen is classified as a class-II drug by the Biopharmaceutics Classification System (BCS, low solubility, high permeability) [11]. Ibuprofen has a carboxylic acid (–COOH) functional group and a pKa of about 4.4, which is responsible for its somewhat acidic character. This group ionizes at higher pH, increasing solubility, which is why it dissolves more readily in alkaline conditions [12]. Because loratadine’s molecular structure contains a tertiary amine nitrogen, which can take up a proton in an acidic environment to increase its solubility, it is a weakly basic chemical. Figure 1 shows the structural formulae of ibuprofen and loratadine. The tertiary amine group in loratadine is responsible for its weak basicity, while the –COOH group in ibuprofen is responsible for its acidic character [13].
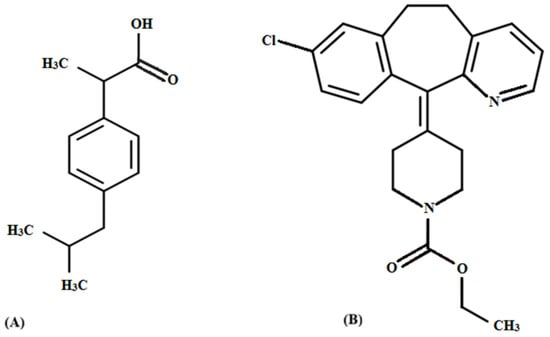
Figure 1.
Chemical structure of (A) ibuprofen and (B) loratadine.
Particle size [14], vehicle viscosity [15], surfactants [16], and the pH of the dissolution medium all have a significant impact on ibuprofen’s dissolution kinetics. Loratadine is also a BCS Class II drug [1], with lower water solubility making it difficult to dissolve [17]. Due to their different physicochemical properties, loratadine is more soluble in acidic environments, such as 0.1 N HCl (pH 3.3), while ibuprofen dissolves better in alkaline media, usually approximated using phosphate buffer (pH 7.2) [18].
For FDCs, dissolution media optimization is especially necessary in ensuring that each API fits its release requirements independently of the others, enabling credible in vitro–in vivo correlations and regulatory approval [19]. Thus, in order to assess in vitro performance, this study compares the dissolution profile of an ibuprofen–loratadine FDC suspension with that of commercially available ibuprofen and loratadine suspensions.
2. Materials and Methods
2.1. Reference and Test Formulations
The test formulation was a fixed-dose combination (FDC) suspension that contained 200 mg/5 mL of ibuprofen and 5 mg/5 mL of loratadine. The test formulation was made locally and kept at room temperature in 60 mL glass bottles with similar storage conditions.
The reference formulations included commercially available products that were bought from the local market, i.e., Stanley Pharmaceuticals’ Fenbro 8 Plus (batch number: L-677; ibuprofen 200 mg/5 mL) and Lorid (batch number: Q-854; loratadine 10 mg/5 mL) suspensions.
2.2. Dissolution Studies
2.2.1. Experimental Conditions and Apparatus
A USP paddle apparatus II (Erweka DT series) operating at 50 rpm and kept at 37 ± 0.5 °C was used to assess the dissolution behavior of ibuprofen and loratadine suspensions. Loratadine was tested in 900 mL of 0.1 N HCl (pH 3.3), whereas ibuprofen was dissolved in 900 mL of phosphate buffer (pH 7.2). To facilitate comparison release profiling, the test period for both formulations was 60 min.
2.2.2. Procedure for Sampling
To maintain consistent volume and sink conditions, aliquots (5 mL) were taken out at predetermined intervals of 0, 5, 10, 15, 20, 30, 45, and 60 min. They were then quickly filtered through 0.45 µm nylon syringe filters and replaced with an equivalent volume of fresh medium that was kept at 37 °C.
Before HPLC analysis, each sample was diluted with the corresponding mobile phase to reach concentrations within the linear calibration range. To guarantee precise drug release quantification, standard ibuprofen and loratadine solutions were made in the same media.
2.3. Dissolution Analysis Through High Performance Liquid Chromatography
2.3.1. Condition of Chromatography
The analysis was carried out using a PerkinElmer Series 200 high-performance liquid chromatography (HPLC) system (PerkinElmer Inc., Waltham, MA, USA) with a ultraviolet (UV) detector. A C18 column (250 mm × 4.6 mm, 5 µm) kept at room temperature for the entire period of the study was used to achieve separation. Acetonitrile and 0.01 M orthophosphoric acid (37:63, v/v) made up the mobile phase for ibuprofen. It was administered at a flow rate of 2.0 mL/min, with an injection volume of 10 µL and UV detection at 220 nm. For the preparation of the buffer for the loratadine assay, 500 mL of water was used to dissolve 1.277 g of disodium hydrogen phosphate (Na2HPO4) and 0.136 g of potassium dihydrogen phosphate (KH2PO4). Methanol and phosphate buffer were combined in an 800:200 (v/v) ratio to produce the mobile phase. An HPLC system with a UV detector set at 280 nm was used for detection.
2.3.2. Validation of HPLC Method
Calibration curves were generated using calibration standards made in the corresponding dissolution medium for ibuprofen and loratadine over concentration ranges of 5–250 µg/mL and 0.5–15 µg/mL, respectively.
Following ICH guidelines, the HPLC method was validated to assess its specificity, linearity, accuracy (measured as a percentage of recovery), precision (both intra- and inter-day), and limit of quantification (LOQ).
2.4. Evaluation of Dissolution Profile
2.4.1. Determination of Percent Release of Drug at Specific Time Points (Q15 and Q30)
The dissolution profiles were used to determine the percentage of drugs released at specific time points, usually 15 and 30 min (Q15 and Q30). These measurements are frequently used in fixed-dose combination assessments because they offer an early indication of drug release behavior.
2.4.2. Determination of Time for Percent Release (T50 and T90)
Using linear interpolation between the two sampling points right before and after the target release percentage, the time needed to reach 50% and 90% drug release (T50 and T90) was determined as follows:
In this equation, “X” means the target percent release of drug (i.e., 50% or 90%), “Y2” and “Y1” are the values of percent drug release immediately after and before the X, t2 and t1 are their corresponding time points. The median and late-stage drug release intervals can be accurately determined using this method.
2.4.3. Dissolution Efficiency (%)
By calculating the area under the dissolution curve (AUC) for a given time period (AUC0–60) and expressing it as a percentage of the total area that represents 100% drug release, dissolution efficiency (DE%) measures the formulation’s overall performance, as given by:
AUC0–60 can be calculated using the trapezoidal rule as given by:
In this equation, Ri and Ri+1 are the cumulative release of the drug in percentage at corresponding time points ti and ti+1, respectively. The technique has been used widely in dissolution studies and offers a single statistic that summarizes a formulation’s total drug release performance [7].
2.4.4. Similarity and Difference Factor
The dissolution profile was created by plotting the mean ± SD values (n = 6) against time and determining the percentage of drug released for each sampling point. The similarity factor (f2) was calculated by comparing the release characteristics of marketed (reference) and FDC (test) suspensions.
where n is the number of time points used for comparison in this equation, Jr is the cumulative percentage of drug released from the reference formulation at time p, and Jt is the cumulative percentage of drug released from the test formulation at the same time point. Moreover, in standard calculations, the optional weighting factor Wf is usually set to 1.
The range of f2 is 50–100. The following equation was used for the determination of the difference factor (f1):
In this equation, Jr is the indicative of dissolution value of reference at “t” time, while Jt is the dissolution value of the test at “t” time. Generally, the difference factor (f1) has a range of 00–15.
3. Results
3.1. HPLC Method Validation
Prior to dissolution studies, separate HPLC-UV techniques for quantifying ibuprofen and loratadine were validated. Both techniques demonstrated excellent linearity, accuracy, and recovery in/concentration ranges evaluated. Figure 2 presents the representative chromatograms of ibuprofen and loratadine, showing retention times of 4.45 min and 4.99 min, respectively. Furthermore, Figure 3 demonstrates that excellent linearity was achieved for ibuprofen over the concentration range of 2.5–250 µg/mL (R2 = 0.9971) and for loratadine over the range of 0.5–15 µg/mL (R2 = 0.9954). The limits of quantification (LOQ) were 0.8 µg/mL for ibuprofen and 0.2 µg/mL for loratadine, indicating adequate sensitivity for dissolution analysis.
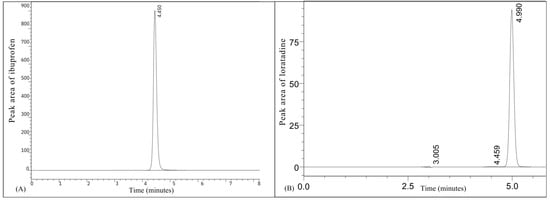
Figure 2.
Representative chromatograms of (A) ibuprofen and (B) loratadine.
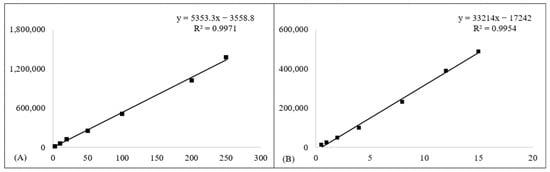
Figure 3.
Calibration curves for (A) ibuprofen and (B) loratadine. Square markers (■) show the measured calibration points, and solid lines represent the regression fits.
Four quality-control (QC) levels, i.e., LLOQ, LQC, MQC, and HQC, were used to assess accuracy and recovery. These levels correspond to 0.8, 2.5, 100, and 200 µg/mL for ibuprofen and 0.2, 0.5, 8, and 12 µg/mL for loratadine. All QC levels showed mean recoveries for loratadine ranging from 98.7% to 99.9%, whereas mean recoveries for ibuprofen ranged from 99.6% to 100.18%. Values for intra-day and inter-day precision (%RSD) remained below 2.0%, demonstrating the method’s robustness. These results showed that the HPLC–UV techniques that were developed were precise, accurate, and repeatable for application in dissolution studies (Table 1).

Table 1.
HPLC-UV method validation parameters for quantification of ibuprofen and loratadine.
3.2. Ibuprofen Dissolution Behavior
The dissolution of ibuprofen from the fixed-dose combination (FDC) suspension and the reference product (Fenbro 8 Plus) was tested using a USP-II apparatus at 50 rpm and 37 ± 0.5 °C in phosphate buffer (pH 7.2). Table 2 and Figure 4 show that the FDC suspension released 65.8 ± 3.3% and of ibuprofen within 15 and 97.2 ± 2.3 by 60 min, respectively, whereas the reference product released 67.5 ± 3.2% and 98.3 ± 1.9% during the same time intervals.
Table 2.
Ibuprofen release (%) from FDC and commercial suspension (Mean ± SD, n = 6).
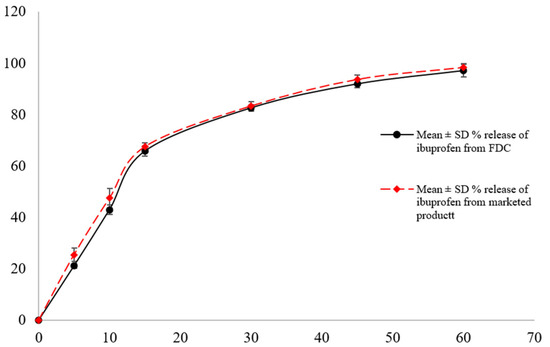
Figure 4.
Ibuprofen dissolution profile from FDC and marketed suspension in pH 7.2 phosphate buffer as dissolution media (mean ± SD, n = 6).
The dissolution profile equivalence was supported by the calculated difference (f1) and similarity (f2) factors, which were 3 and 70, respectively. These findings show that the dissolution kinetics of the FDC suspension were comparable to those of the commercial ibuprofen suspension, indicating that the addition of ibuprofen to the FDC formulation did not change its release properties.
3.3. Loratadine Dissolution Behavior
In order to simulate gastric conditions, the dissolution of loratadine was measured in 0.1 N HCl (pH 3.3). Within 15 min, 54.8 ± 3.2% of the loratadine was released from the FDC suspension, and by 60 min, 98.2 ± 1.2% had been released. This indicates a progressive release pattern. Table 3 and Figure 5 show that the marketed reference product, Lorid, has a similar release profile of 61.7 ± 3.8% and 98.5 ± 1.9%, respectively, for the same intervals.
Table 3.
Percentage loratadine release from FDC and marketed suspensions (Mean ± SD, n = 6).
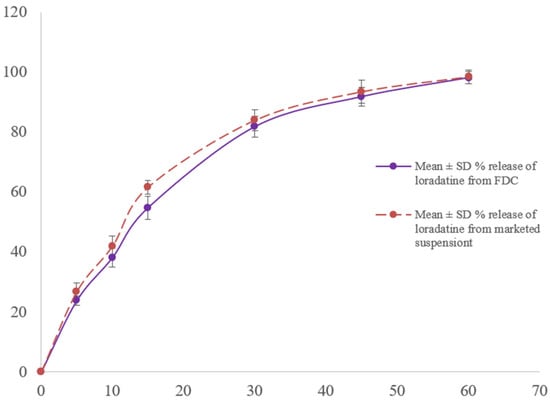
Figure 5.
Loratadine dissolution profile from FDC and marketed suspension in 0.1 N HCl as dissolution media (mean ± SD, n = 6).
The two products’ dissolution resemblance was confirmed by the obtained f1 and f2 values, which were 4 and 64, respectively. These results show that loratadine dissolution behavior was unaffected by its co-formulation with ibuprofen.
3.4. Evaluation of Dissolution Profiles
Table 4 summarizes that the dissolution behavior of ibuprofen and loratadine from the FDC suspension closely matches that of their respective marketed products. The FDC suspension demonstrated effective and comparable release of both drugs, as reflected by Q15, Q30, T50, T90, and DE% values. Additionally, all f2 values exceeded 50 and all f1 values were below 15, meeting regulatory criteria for profile similarity as shown in Table 5 [20]. These results confirm that the in-house developed FDC suspension exhibits acceptable in vitro performance equivalent to commercial monotherapy suspensions, ensuring adequate drug release without formulation-related interference.
Table 4.
Comparative dissolution performance of ibuprofen and loratadine from the FDC suspension and marketed formulations.
Table 5.
Comparison of dissolution profiles between the FDC suspension and the marketed formulation based on difference (f1) and similarity (f2) factors.
4. Discussion
Ibuprofen and loratadine were combined in a fixed-dose combination (FDC) suspension to provide a pediatric formulation that can manage pain, inflammation, and allergy symptoms. Because it offers flexible dosing and enhanced patient compliance, the suspension form is especially well-suited for the pediatric population [21,22]. An important measure for assessing in vitro drug release, ensuring consistency in formulation performance, and predicting in vivo bioavailability, is dissolution testing. Dissolution testing is increasing in importance for suspensions to evaluate the release behavior of dispersed drug particles and to prove product equivalency, while being traditionally used for solid oral dosage forms [8,23].
For measuring ibuprofen and loratadine in the dissolution samples, the validated HPLC–UV analytical techniques showed good linearity, precision, and accuracy across the studied concentration ranges. According to ICH Q2 (R2) criteria, accuracy and recovery were assessed at four quality control levels: LLOQ, LQC, MQC, and HQC, which were 0.2, 0.5, 8, and 12 µg/mL for loratadine; 0.8, 2.5, 100, and 200 µg/mL for ibuprofen, respectively, [24]. The precision in terms of % RSD values stayed below 2%, while the mean percentage recoveries fell between 98 and 100.18%, indicating high procedure repeatability. Since the dissolving samples’ quantification range did not necessitate measurements close to the lower limit of quantification, calibration curves were constructed using a variety of concentration levels, but they did not begin at the LLOQ. When concentrations are anticipated to stay above the LLOQ in dissolution tests, this type of selective calibration range design is appropriate and advised [25].
For both active constituents, the fixed-dose combination (FDC) suspension dissolution profiles showed excellent comparability with those of commercially available reference products. At 15 and 60 min, the ibuprofen release from the FDC suspension was roughly 65.8 ± 3.3 percent and 97.2 ± 2.3 percent, respectively, while the marketed suspension’s release was 67.5 ± 3.2 percent and 98.3 ± 1.9 percent. The calculated similarity (f2 = 70) and difference (f1 = 3) parameters verified equivalency (f2 > 50 and f1 < 15), which matched the regulatory acceptance standards [9]. Incorporating Ibuprofen, a BCS Class II medication with dissolution-limited absorption [11], into an FDC suspension did not alter its dissolution properties, suggesting that there was no substantial physicochemical interaction with loratadine or the excipients. In phosphate buffer (pH 7.2), ibuprofen from the FDC suspension showed dissolution values of Q15 = 65.8% and Q30 = 82.6%, closely matching the marketed product (67.5% and 83.3%, respectively). Likewise, in acidic medium (0.1 N HCl, pH 3.3), loratadine exhibited comparable release, with the FDC suspension achieving Q15 = 54.8% and Q30 = 81.8%, while the marketed formulation reached 61.7% and 84.0%, respectively. The time-based parameters also showed strong agreement, as ibuprofen demonstrated T50 = 11.5 min vs. 10.6 min, T90 = 41.8 min vs. 39.7 min, and DE% = 72.1% vs. 73.8% for the FDC and marketed product, respectively. Similarly, loratadine showed T50 = 13.5 min vs. 12.0 min, T90 = 42.2 min vs. 39.4 min, and DE% = 70.0% vs. 72.7%. The calculated similarity factors (f1 = 4 and f2 = 64) further confirmed a high degree of dissolution profile equivalence between the FDC suspension and the respective commercial formulations. Weakly basic and poorly water-soluble, loratadine is a BCS Class II chemical that is susceptible to pH-dependent solubility [1]. The similar dissolution behavior shows that the co-formulated ibuprofen did not prevent the solubilization of loratadine, demonstrating that the FDC compatibility was effectively optimized. The dissolution parameters presented in this study provide preliminary insight into potential in vitro-in vivo correlation (IVIVC), as dissolution data have been successfully used to predict in vivo performance in previous studies [26].
These findings are consistent with the recent studies showing that multi-API dosage forms can be successfully developed without sacrificing product performance or dissolution properties [6,19]. To maintain therapeutic efficacy and ensure bioequivalence, fixed-dose combos (FDCs) and their respective monotherapy formulations must have similar dissolution profiles [27,28]. The possibility of combining ibuprofen and loratadine, two drugs with different solubility profiles, into a single, pediatric-appropriate oral suspension is thus supported by the observed dissolution similarities.
5. Conclusions
This study efficiently developed and validated two reliable HPLC–UV techniques for the measurement of loratadine and ibuprofen in fixed-dose combination (FDC) suspension dissolution tests. ICH Q2 (R2) standards were met by the validation findings, which confirmed high accuracy, precision, and linearity within the stated ranges. Similar release profiles of both drugs from the FDC and commercial suspensions were shown by dissolution testing, and profile similarity was confirmed by f1 values less than 15 and f2 values more than 50. The slightly acidic and basic natures of ibuprofen and loratadine were suitably represented by the use of phosphate buffer (pH 7.2) and 0.1 N HCl (pH 3.3, respectively). The overall dissolution performance of the designed FDC suspension was comparable to that of individual reference products, indicating that it could be a patient-friendly formulation for the concurrent treatment of allergies, inflammation, and pain conditions. Future research will assess the FDC suspension’s palatability and acceptability to ensure adherence and ease of administration, supporting its suitability for pediatric use.
Author Contributions
Conceptualization, L.A. and M.F.; methodology, M.H.; software, L.A.; validation, M.F.; formal analysis, L.A.; investigation, M.F.; resources, M.H.; data curation, M.F.; writing—original draft preparation, writing—review and editing, L.A.; visualization, M.H.; supervision, L.A. All authors have read and agreed to the published version of the manuscript.
Funding
The research received no external funding.
Institutional Review Board Statement
Not applicable.
Informed Consent Statement
Not applicable.
Data Availability Statement
Data are contained in the article.
Acknowledgments
We are thankful to the University of Swabi and Legacy Pharmaceuticals (PVT) Ltd. for providing the research facilities.
Conflicts of Interest
The authors declare no conflicts of interest.
Abbreviations
The following abbreviations are used in this manuscript.
| BCS | Biopharmaceutics Classification System |
| FDC | Fixed-Dose Combination |
| HCl | Hydrochloric Acid |
| HPLC | High-Performance Liquid Chromatography |
| HQC | High-Quality Control |
| ICH | International Council for Harmonization |
| LLOQ | Lower Limit of Quantification |
| LQC | Low-Quality Control |
| LOD | Limit of Detection |
| LOQ | Limit of Quantification |
| MQC | Medium-Quality Control |
| NSAID | Nonsteroidal Anti-Inflammatory Drug |
| PBS | Phosphate-Buffered Solution |
| QC | Quality Control |
| RSD | Relative Standard Deviation |
| SD | Standard Deviation |
| UV | Ultraviolet |
| %RSD | Percent Relative Standard Deviation |
References
- Islam, N.; Khan, N.U.; Razzaq, A.; Menaa, F.; Khan, Z.U.; Hussain, A.; Rehman, S.U.; Iqbal, H.; Ni, J. Loratadine oral bioavailability enhancement via solid dispersion loaded oro-dispersible films: Formulation, characterization and pharmacokinetics. Colloids Surf. B Biointerfaces 2023, 230, 113526. [Google Scholar] [CrossRef]
- Rainsford, K.D. Ibuprofen: Pharmacology, efficacy and safety. Inflammopharmacology 2009, 17, 275–342. [Google Scholar] [CrossRef]
- Geppe, N.A.; Zaplatnikov, A.L.; Kondyurina, E.G.; Chepurnaya, M.M.; Kolosova, N.G. The Common Cold and Influenza in Children: To Treat or Not to Treat? Microorganisms 2023, 11, 858. [Google Scholar] [CrossRef]
- Eccles, R. Common cold. Front. Allergy 2023, 4, 1224988. [Google Scholar] [CrossRef]
- Malkawi, W.A.; AlRafayah, E.; AlHazabreh, M.; AbuLaila, S.; Al-Ghananeem, A.M. Formulation challenges and strategies to develop pediatric dosage forms. Children 2022, 9, 488. [Google Scholar] [CrossRef]
- Wilkins, C.A.; Hamman, H.; Hamman, J.H.; Steenekamp, J.H. Fixed-Dose Combination Formulations in Solid Oral Drug Therapy: Advantages, Limitations, and Design Features. Pharmaceutics 2024, 16, 178. [Google Scholar] [CrossRef]
- Marano, S.; Ghimire, M.; Missaghi, S.; Rajabi-Siahboomi, A.; Craig, D.Q.M.; Barker, S.A. Development of robust tablet formulations with enhanced drug dissolution profiles from centrifugally-spun micro-fibrous solid dispersions of itraconazole, a BCS class II drug. Pharmaceutics 2023, 15, 802. [Google Scholar] [CrossRef] [PubMed]
- Soares, T.D.S.P.; Souza, J.D.; Rosa, L.D.S.; Marques-Marinho, F.D. Dissolution test for oral suspension: An overview about use and importance. Braz. J. Pharm. Sci. 2022, 58, e19423. [Google Scholar] [CrossRef]
- Mekasha, Y.T.; Mekonen, A.W.; Nigussie, S.; Usure, R.E.; Feleke, M.G. Modeling and comparison of dissolution profiles for different brands of albendazole boluses. BMC Pharmacol. Toxicol. 2024, 25, 48. [Google Scholar] [CrossRef]
- Shah, V.P.; Amidon, G.L. A theoretical basis for a biopharmaceutic drug classification: The correlation of in vitro drug product dissolution and in vivo bioavailability. AAPS J. 2014, 16, 894–898. [Google Scholar] [CrossRef] [PubMed]
- García-Arieta, A.; Gordon, J.; Potthast, H. On the biopharmaceutics classification system biowaiver of ibuprofen. J. Pharm. Sci. 2015, 104, 2429–2432. [Google Scholar] [CrossRef] [PubMed]
- Levis, K.A.; Lane, M.E.; Corrigan, O.I. Effect of buffer media composition on the solubility and effective permeability coefficient of ibuprofen. Int. J. Pharm. 2003, 253, 49–59. [Google Scholar] [CrossRef]
- Hens, B.; Bermejo, M.; Augustijns, P.; Cristofoletti, R.; Amidon, G.E.; Amidon, G.L. Application of the Gastrointestinal Simulator (GIS) Coupled with In Silico Modeling to Measure the Impact of Coca-Cola® on the Luminal and Systemic Behavior of Loratadine (BCS Class 2b). Pharmaceutics 2020, 12, 566. [Google Scholar] [CrossRef]
- Costa, F.; Pais, A.; Sousa, J. Analysis of formulation effects in the dissolution of ibuprofen pellets. Int. J. Pharm. 2004, 270, 9–19. [Google Scholar] [CrossRef]
- Navas-Bachiller, M.; Persoons, T.; D’ARcy, D.M. In vitro and in silico methods to investigate the effect of moderately increasing medium viscosity and density on ibuprofen dissolution rate. Eur. J. Pharm. Biopharm. 2023, 193, 74–88. [Google Scholar] [CrossRef]
- Razvi, N.; Siddiqui, S.A.; Khan, L.G. The effect of surfactant on the dissolution rate of ibuprofen tablets. Int. Chem. Pharm. Med. J. 2005, 2, 213–216. [Google Scholar]
- Khan, M.Z.I.; Raušl, D.; Zanoški, R.; Zidar, S.; Mikulčić, J.H.; Krizmanić, L.; Eškinja, M.; Mildner, B.; Knežević, Z. Classification of loratadine based on the biopharmaceutics drug classification concept and possible in vitro–in vivo correlation. Biol. Pharm. Bull. 2004, 27, 1630–1635. [Google Scholar] [CrossRef]
- Popović, G.; Čakar, M.; Agbaba, D. Acid–base equilibria and solubility of loratadine and desloratadine in water and micellar media. J. Pharm. Biomed. Anal. 2009, 49, 42–47. [Google Scholar] [CrossRef] [PubMed]
- Desai, D.; Wang, J.; Wen, H.; Li, X.; Timmins, P. Formulation design, challenges, and development considerations for fixed dose combination (FDC) of oral solid dosage forms. Pharm. Dev. Technol. 2013, 18, 1265–1276. [Google Scholar] [CrossRef]
- Moore, J.W.; Flanner, H.H. Mathematical comparison of dissolution profiles. Pharm. Technol. 1996, 20, 64–74. [Google Scholar]
- Ivanovska, V. Priority Medicines for Children Exploring Age-Appropriate Medicines and Antibiotic Use in Children. Ph.D. Thesis, Utrecht University, Utrecht, The Netherlands, 2017. [Google Scholar]
- Walsh, J.; Cram, A.; Woertz, K.; Breitkreutz, J.; Winzenburg, G.; Turner, R.; Tuleu, C. Playing hide and seek with poorly tasting paediatric medicines: Do not forget the excipients. Adv. Drug Deliv. Rev. 2014, 73, 14–33. [Google Scholar] [CrossRef] [PubMed]
- Shah, V.P.; Siewert, M.; Dressman, J.; Moeller, H.; Brown, C. Dissolution/in vitro release testing of novel/special dosage forms. Dissolution Technol. 2002, 9, 6–11. [Google Scholar] [CrossRef]
- Guideline, I.H. Bioanalytical Method Validation and Study Sample Analysis M10; ICH Harmonised Guideline: Geneva, Switzerland, 2022. [Google Scholar]
- Basu, S.; Basit, A.; Ravindran, S.; Patel, V.B.; Vangala, S.; Patel, H. Split calibration curve: An approach to avoid repeat analysis of the samples exceeding ULOQ. Bioanalysis 2012, 4, 2375–2389. [Google Scholar] [CrossRef]
- Coutinho, A.L.; Adhikari, A.; Krug, S.; Kane, M.; Hollenbeck, R.G.; Hoag, S.W.; Polli, J.E. In Vitro-In Vivo Correlation Of Amorphous Solid Dispeofion Enabled Itraconazole Tablets. Pharm. Res. 2025, 42, 485–502. [Google Scholar] [CrossRef] [PubMed]
- Crowley, P.J.; Maglennon, S.M.; Martini, L.G.; Templeton, D. Development Programs for Oral Fixed Dose Combination Products. In Specialised Pharmaceutical Formulation: The Science and Technology of Dosage Forms; Royal Society of Chemistry: London, UK, 2022. [Google Scholar]
- Dharmagadda, S. Fixed-Dose Combinations: Innovations and Research. In Recent Advances in Pharmaceutical Innovation and Research; Springer: Berlin/Heidelberg, Germany, 2023; pp. 437–446. [Google Scholar]
Disclaimer/Publisher’s Note: The statements, opinions and data contained in all publications are solely those of the individual author(s) and contributor(s) and not of MDPI and/or the editor(s). MDPI and/or the editor(s) disclaim responsibility for any injury to people or property resulting from any ideas, methods, instructions or products referred to in the content. |
© 2025 by the authors. Licensee MDPI, Basel, Switzerland. This article is an open access article distributed under the terms and conditions of the Creative Commons Attribution (CC BY) license (https://creativecommons.org/licenses/by/4.0/).