Abstract
The System of Rice Intensification which promotes agro-ecological practices like alternate wetting and drying (AWD) to enhance root growth and resource efficiency, relies on the genotypic capacity of rice varieties to undergo physiological adaptation. This study elucidates the molecular basis of such adaptation by investigating the transcriptomic profile of four rice varieties to continuous flooding (CF) and AWD at 50 days after transplanting. Our analysis revealed distinct, organ-specific acclimation strategies. Roots underwent extensive transcriptional reprogramming, underscoring their role as the primary site of plasticity. Under CF, a conserved response involving cell wall reinforcement was accompanied by variety-specific strategies, ranging from sustained growth to enhanced anaerobic metabolism. Under AWD, roots shifted toward water stress management, with varieties employing distinct defensive (e.g., diterpenoid biosynthesis) and metabolic programs. Associated transcription factors (TFs) enriched under CF included Dof and MYB, whereas bZIP, HSF, and WRKY factors predominated under AWD. In leaves, acclimation to AWD involved more targeted adjustments, including modulation of nitric oxide signaling and photoprotective pathways, regulated by TFs such as WRKY, NAC, and HSF. Varieties with robust TF responses, such as IR64 and Hitachi hatamochi, showed comprehensive regulatory shifts, while others exhibited more constrained profiles. Overall, this study provides a molecular framework for understanding variety-specific adaptation to SRI-relevant water management practices and identifies key TFs as promising candidates for breeding climate-resilient rice.
1. Introduction
Rice is one of the most important staple crops globally, supplying approximately 50% of the dietary caloric intake for billions of people [1,2,3]. However, it faces significant threats from climate change and increasing water scarcity due to its heavy reliance on irrigation. Projections indicate that by 2050, irrigated rice yields could decline by up to 7%, underscoring the urgent need for more resilient and resource-efficient cultivation systems [4]. A principal challenge is how to enhance crop productivity while minimizing environmental footprints, particularly the extensive water use and methane emissions associated with traditional continuously flooded (CF) paddies [5,6].
In this context, the System of Rice Intensification (SRI) has emerged as a promising agro-ecological approach. SRI integrates multiple principles including transplanting young seedlings (less than 15 days old) to stimulate early vigor; wider spacing (25 × 25 cm) to reduce plant density and minimize competition; improving soil fertility by incorporating organic matter instead of chemical fertilizers; managing water through alternate wetting and drying (AWD) to avoid root hypoxia; and controlling weeds using manual methods which also aerates the soil and incorporates the weeds as green manure [4,5,6,7,8,9,10]. Moreover, the adaptability of SRI practices to various environmental conditions highlights its potential to mitigate the adverse effects of climate change on rice production. Its efficient water use and the enhanced root systems it promotes further position SRI as a critical tool for farmers facing these challenges.
A cornerstone of SRI is its Alternate Wetting and Drying (AWD) water management strategy, which involves cyclic irrigation in which fields are allowed to dry to specific moisture thresholds before re-irrigation, rather than being maintained under continuous flooding (CF) [11,12,13,14]. Field studies across diverse agroecological zones have demonstrated that AWD can enhance root and shoot growth in rice plants, resulting in higher grain yields [15,16,17,18,19]. For example, a study conducted in China showed that an alternate wetting and moderate soil drying (WMD) regime significantly increased root oxidation activity, cytokinin concentrations in roots and shoots, leaf photosynthetic rates, and activities of enzymes involved in sucrose-to-starch conversion in grains, leading to an 11% increase in grain yield compared with continuously flooded fields [20]. Similarly, Norton et al. investigated the impacts of AWD on rice physiology, grain production, and grain quality, and found that AWD improved rice physiology and grain production, without causing significant yield losses compared to CF [21]. Beyond resource conservation, AWD induces physiological modifications including enhanced root architecture, improved photosynthetic efficiency during moist phases, and delayed senescence, collectively contributing to improved plant performance under water-limited conditions [22,23,24].
Rice exhibits remarkable genetic diversity in its adaptation to different irrigation systems, primarily distinguished between lowland (irrigated and rainfed lowland) and upland (aerobically cultivated) ecotypes. Lowland rice, including varieties like IR64, has evolved sophisticated adaptations to flooded conditions, including the development of aerenchyma tissue for internal oxygen transport, metabolic adaptations to hypoxia, and specific genetic mechanisms such as the SUB1 genes that regulate internode elongation and submergence tolerance [25,26,27]. Conversely, upland rice varieties (e.g., Azucena) have evolved under non-flooded conditions, developing deep root systems, enhanced water conductivity, and physiological drought resistance mechanisms [28,29,30]. Molecular studies have identified numerous genes associated with these divergent adaptations, including DRO1, which controls root growth angle in upland varieties, DREB transcription factors, which regulate drought-responsive gene networks, and various aquaporins and transporters managing water and nutrient uptake under differing soil moisture conditions [31,32,33].
Plants respond to water stress through complex transcriptional reprogramming mediated by multiple signaling pathways and regulatory networks. Under drought conditions, plants typically activate ABA-dependent signaling pathways involving transcription factors such as AREB/ABF, NAC, and MYB families, while also employing ABA-independent pathways regulated by DREB/CBF transcription factors [34,35,36,37]. These transcriptional regulators coordinate the expression of downstream genes involved in osmolyte biosynthesis (e.g., proline, sugars), antioxidant defense, stomatal regulation, and modifications to root architecture. Previous transcriptomic studies have identified numerous stress-responsive genes showing differential expression between drought-tolerant and drought-susceptible genotypes, with tolerant varieties often exhibiting earlier and more coordinated activation of protective mechanisms [34,38,39]. However, a significant knowledge gap remains regarding how the transcriptional responses are coordinated between roots, the primary site of water perception—and leaves, which regulate whole-plant physiological processes.
This study aims to address this gap by characterizing the transcriptional basis of adaptation to different water management systems in four genetically distinct rice varieties representing both lowland and upland ecotypes. We hypothesize that AWD induces distinct transcriptional programs in lowland and upland varieties, reflecting their evolutionary adaptation to contrasting irrigation systems. To test this, we present a comparative transcriptomic analysis of four rice varieties with contrasting water adaptations under CF and AWD at 50 days after transplanting (DAT). The objective is descriptive and exploratory; the analysis is focused solely on differentially expressed genes (DEGs) at a single time point, without additional molecular validation.
2. Results
The present study investigated the transcriptomic profiles in the root and leaf tissues of four rice varieties (V1: IR64, V2: Hitachi hatamochi, V3: Azucena, and V4: Akita komachi) under two contrasting water management regimes. In the conventional rice cultivation method, continuous flooding (CF) was maintained throughout the experimental period, creating persistent anaerobic conditions. Conversely, the SRI method employed alternate wetting and drying (AWD), in which the soil water potential was allowed to reach −30 kPa before rewetting to 0 kPa, with no standing water at any time during the experiment, thereby creating predominantly aerobic conditions. V1 is an indica variety, whereas the other three rice varieties are japonica types. V3 is classified as tropical japonica, while V2 and V4 are temperate japonica. V2 and V3 are upland varieties, while V1 and V4 are lowland varieties.
In the present study, four rice genotypes were grown under SRI and conventional continuous flooding (CF) systems. While both systems utilized young seedlings, single-seedling planting, and comparable organic matter amendments or chemical fertilizer, their primary distinction lay in water management: the flooding system maintained continuous standing water (CF), whereas the SRI method employed AWD throughout the growing season. This difference in water management introduced soil moisture fluctuations that are expected to influence gene expression associated with water deficit stress responses.
2.1. PCA Plot
A principal component analysis (PCA) was conducted on the normalized expression values of all expressed genes for root samples (22 samples) and leaf samples (18 samples) to evaluate transcriptional variation between the CF and AWD across four rice varieties. In Figure 1a, the PCA of the root samples shows clear differences between treatments, with PC1 accounting for 35% of the total variance and PC2 explaining 29%, together capturing 64% of the dataset’s variability. The irrigation system is identified as the primary factor influencing variation in gene expression in root, accounting for 35% of total variance along PC1. This significant separation along PC1 clearly differentiates traditional flooding (CF) from SRI management (AWD). The varietal differences (Aktia komachi, Azucena, Hitachi hatomochi and IR64) explain 29% of the variance along PC2, demonstrating that genotype exerts a secondary but still notable influence on transcriptomic variation.
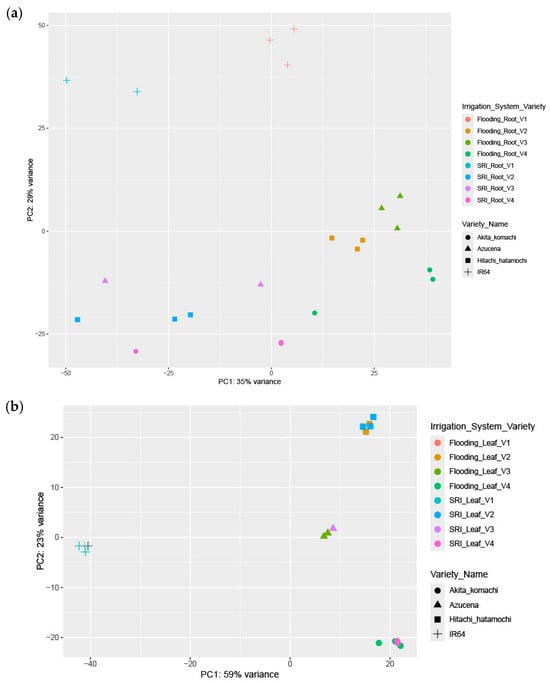
Figure 1.
PCA plots for (a) root samples and (b) leaf samples.
The PCA plot in Figure 1b shows clear differences in leaf samples. PC1, which explains 59% of the variance, primarily separates the samples based on varietal identity (IR64, Hitachi hatamochi, Azucena and Akita komachi), with clear clustering patterns across irrigation regimes, suggesting stable genotype-specific physiological signatures. PC2, accounting for 23% of the variance, reflects irrigation-driven divergence (CF versus AWD) within cultivars, indicating genetically dependent phenotypic responses to changes in environmental conditions. Overall, these results suggest that varietal differences in leaf traits exert a much stronger influence than water management (59% vs. 23%), and that all genotypes display a consistent, though limited, response to differences in irrigation regime.
2.2. Differential Gene Expression (DEGs) for Rice Varieties in Root and Leaf Samples
Transcriptome analysis of root responses to water management revealed distinct varietal adaptation strategies (Figure 2a). In this study, upregulated genes are defined as those with higher expression levels under CF, whereas downregulated genes exhibit higher expression levels under AWD. IR64 (V1) showed the largest transcriptional shift, with 3656 DEGs (2104 upregulated and 1552 downregulated), indicating a broad-spectrum response to water-related stress. Hitachi hatamochi (V2) showed a predominantly downregulation-driven adaptation strategy, with 2772 DEGs (970 upregulated and 1802 downregulated); Azucena (V3) showed moderate downregulation bias (1657 DEGs; 470 upregulated and 1187 downregulated). In contrast, Akita komachi (V4) displayed relatively limited transcriptional change (415 DEGs; 180 upregulated and 235 downregulated), suggesting a more stable and pre-adapted state under fluctuating soil moisture conditions.
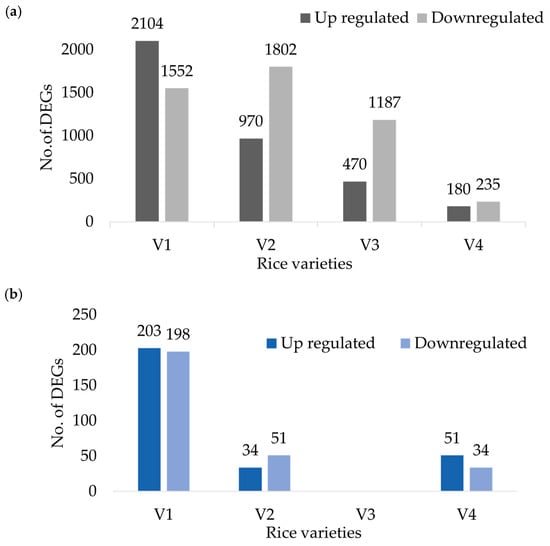
Figure 2.
Differentially Expressed Genes for four rice varieties (a) root samples and (b) leaf samples.
In leaf tissues, the number of DEGs was markedly lower across all varieties. (Figure 2b). DEGs are presented for varieties V1, V2, and V4, while variety V3 is excluded due to insufficient replicates for statistical analysis. Upregulated genes are defined as those with higher expression levels under CF, whereas downregulated genes exhibit higher expression levels in AWD. IR64 (V1) showed the highest number of DEGS (401), comprising 203 upregulated and 198 downregulated genes, indicating a relatively balanced transcriptional adjustment. In contrast, Hitachi hatamochi (V2) and Akita komachi (V4) exhibited minimal transcriptional shifts (85 DEGs each), though in opposite directions: V2 displayed a slight downregulation bias, whereas V4 showed a predominant upregulation bias.
2.3. Venn Diagram for Root and Leaf Samples
Figure 3a,b and Figure 3c,d show the Venn diagrams for root and leaf samples, respectively. The Venn analysis of root samples showed that the varietal responses to different water regimes were largely driven by genotype, with little overlap between varieties. For instance, IR64 showed a significant increase in flood-responsive gene expression, with 1481 uniquely upregulated genes. In contrast, Hitachi hatamochi exhibited strong AWD-induced downregulation, with 920 uniquely downregulated genes. Only 45 genes were consistently upregulated under CF, while 69 were consistently downregulated under AWD conditions. IR64 was also involved in extensive co-regulatory networks, sharing 326 co-upregulated genes with Hitachi hatamochi, whereas other varieties, like Azucena and Akita komachi, showed minimal overlap, with only nine shared genes. These findings highlight a clear genetic differentiation in transcriptional responses to water stress among the rice varieties.
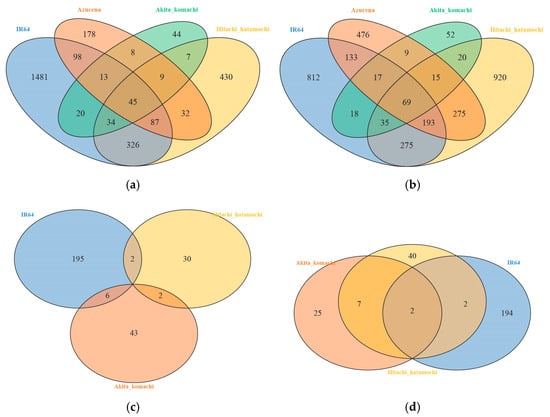
Figure 3.
Venn diagrams for (a,b) root samples showing upregulated and downregulated genes, respectively, and (c,d) leaf samples showing upregulated and downregulated genes, respectively. The numbers in each section indicate the counts of unique and shared DEGs.
Leaf samples exhibited predominantly variety-specific transcriptional responses to water treatments, with very few shared DEGs across genotypes. IR64 showed strong responses to both flooding (195 upregulated genes) and AWD (194 downregulated genes). In contrast, the two other varieties showed more moderate adaptation. Only a negligible number of genes were shared across all three varieties, with the strongest overlap occurring between Hitachi hatamochi and Akita komachi, which shared seven downregulated genes. IR64 shared very few genes with the other two varieties (≤6 overlaps). These results indicate that each variety adapts to water stress through largely distinct genetic mechanisms in its leaves.
2.4. Functional Enrichment Analysis
To further investigate the rice varieties adapted to different water management, all qualifying DEGs were subjected to Gene Ontology (GO) enrichment analysis and KEGG pathway analysis using ShinyGO. GO enrichment results were categorized into three main GO categories: (i) Biological Processes (BP) that describe the broader biological roles and pathways involving a gene product; (ii) Cellular Components (CC) that indicate the cellular locations of gene product activity; and (iii) Molecular Function (MF) detailing the biochemical activities performed by the gene products. The top 15 GO terms associated with upregulated (CF-responsive) and downregulated (AWD-responsive) genes were selected for both leaf and root tissues. It should be noted that these interpretations are based solely on in silico enrichment of DEGs and they require further experimental validation.
2.4.1. Transcriptional Profiles in Roots Under Continuous Flooding (CF)
Functional enrichment analysis of root DEGs at 50 days after transplanting (DAT) revealed distinct genotype-specific transcriptional programs associated with long-term adaptation to CF (Figure 4).
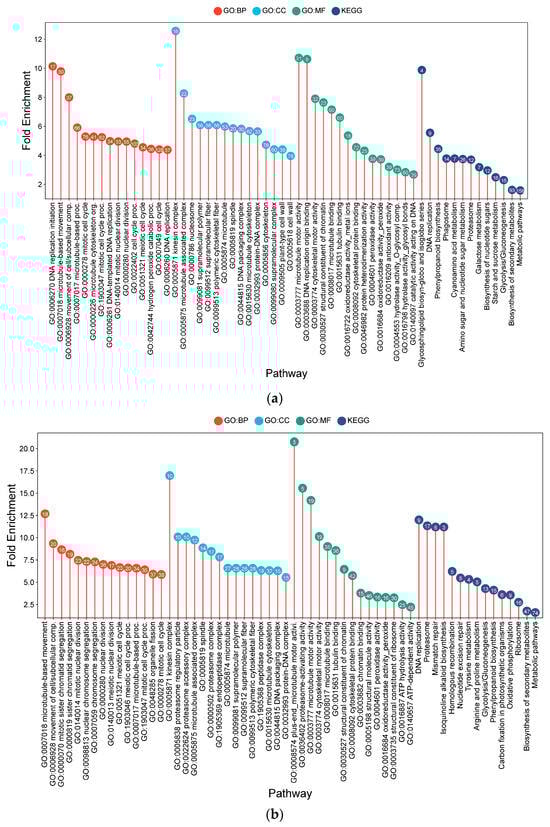
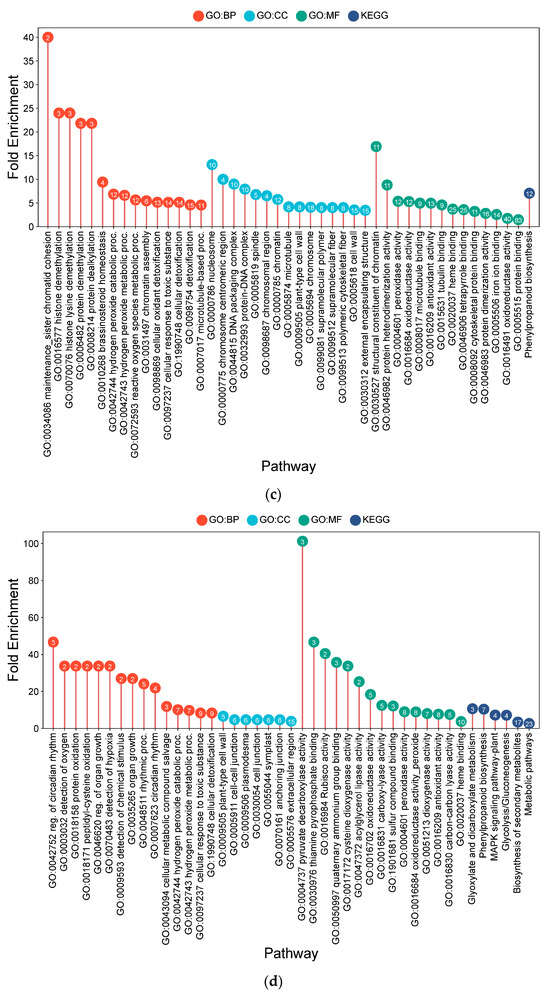
Figure 4.
Lollipop charts showing the top 15 Gene Ontology (GO) terms for each GO category (BP—biological process; CC—cellular components; MF—molecular function) and KEGG for root samples under CF conditions, plotted by fold enrichment. Numbers within circles indicate the number of genes in each pathway overlapping with the gene list. (a) IR64; (b) Hitachi hatamochi; (c) Azucena; (d) Akita komachi.
IR64 exhibited an enrichment profile consistent with cellular proliferation and structural modification. This was suggested by the prominence of terms related to DNA replication initiation (10.13-fold), the mitotic cell cycle (5.30-fold), and nuclear division (4.95-fold), which were supported by the upregulation of microtubule motor activity (10.71-fold). Concurrently, pathways related to oxidative stress mitigation, such as peroxidase activity (3.76-fold) and H2O2 catabolism (4.44-fold), were prominent. Metabolic shifts included phenylpropanoid biosynthesis (4.45-fold), potentially contributing to cell wall fortification, and glycosphingolipid production (9.87-fold).
The Hitachi hatamochi roots displayed an enrichment profile emphasizing macromolecular protection and cytoskeletal reorganization. A strong emphasis on protein and DNA maintenance was inferred from the induction of ubiquitin-mediated proteolysis (proteasome complex: 15.6-fold) and DNA repair pathways (mismatch repair: 11.2-fold). Cytoskeletal terms, including microtubule-based movement (12.7-fold), were also prominent. The enrichment of glycolysis (4.3-fold) suggests a shift toward anaerobic energy generation, accompanied by phenylpropanoid biosynthesis (4.1-fold) and peroxidase activity (3.3-fold). These results point to a stress response strategy focused on damage control and structural reinforcement under prolonged hypoxia.
In Azucena, the transcriptional signature suggested a survival-oriented adaptation involving potential cell cycle regulation and oxidative defense. The notable enrichment of chromatin organization pathways, including sister chromatid cohesion (40.0-fold) and histone demethylation (24.0-fold), suggests possible modulation of the cell cycle. Robust enrichment of ROS detoxification terms, such as peroxidase activity (5.4-fold) and H2O2 catabolism (6.9-fold), was evident. Structural adaptations were supported by enrichments in microtubule processes (4.6–5.0-fold) and cell wall modification (4.2-fold), alongside a strong induction of phenylpropanoid biosynthesis (7.1-fold) and brassinosteroid homeostasis (9.4-fold).
Akita komachi exhibited a pronounced shift towards anaerobic metabolism and systemic transcriptional reprogramming. Fermentation pathways were strongly enriched, including pyruvate decarboxylase activity (101.3-fold) and glycolysis (7.2-fold), were observed. Circadian rhythm processes were also highly enriched (46.7-fold), suggesting a potential re-synchronization of stress-regulated physiological roles. This was accompanied by strong induction of oxidative defense pathways (peroxidase: 9.1-fold), cell wall integrity processes (6.6-fold) and phenylpropanoid biosynthesis (10.4-fold). The inferred strategy for Akita komachi reflects a reliance on emergency energy production combined with enhanced structural and oxidative resilience. Across all genotypes, phenylpropanoid biosynthesis and peroxidase activity were consistently enriched, indicating that reinforcement of cell wall structure and mitigation of oxidative stress are core components of the long-term adaptive response to flooding stress.
2.4.2. Distinct Transcriptional Programs Underpin Root Adaptation to Alternate Wetting and Drying (AWD)
Under AWD conditions at 50 DAT, the enrichment profiles shifted from hypoxia adaptation to strategies centered on defense and metabolic adjustment, revealing genotypic differences (Figure 5).
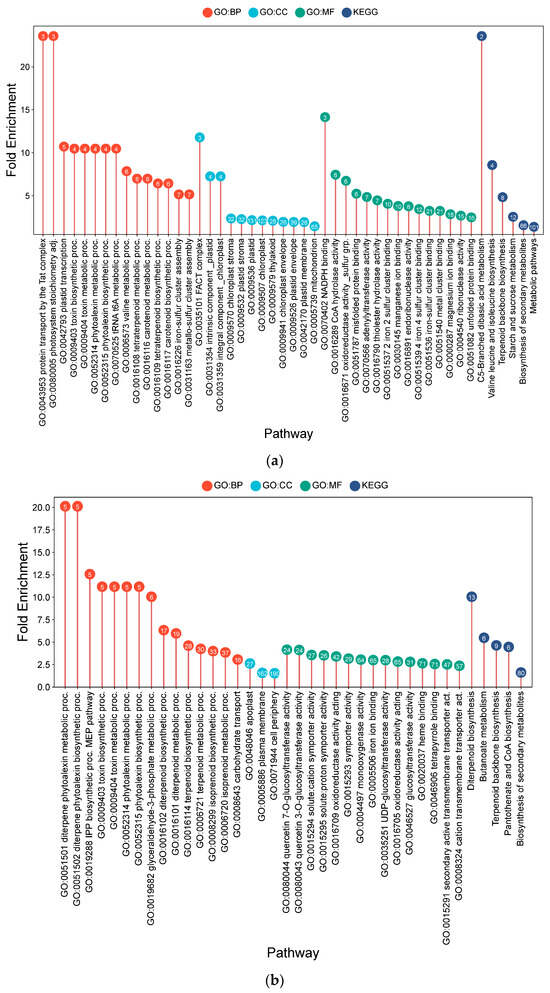
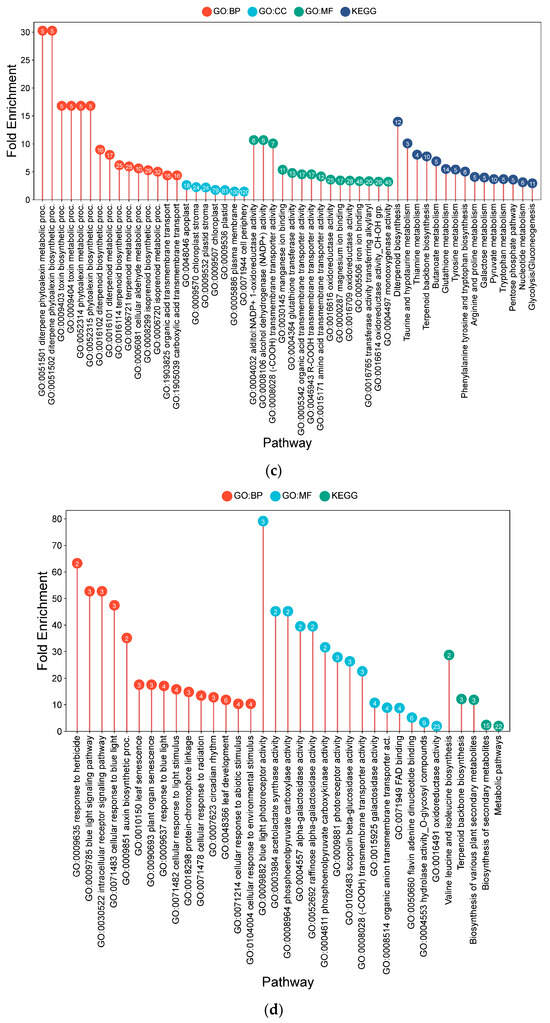
Figure 5.
Lollipop charts showing the top 15 Gene Ontology (GO) terms for each GO category (BP—biological process; CC—cellular components; MF—molecular function) and KEGG for root samples under AWD conditions, plotted by fold enrichment. Numbers in circles indicate the number of genes in each pathway that overlap with the gene list. (a) IR64; (b) Hitachi hatamochi; (c) Azucena; (d) Akita komachi.
The IR64 transcriptional profile was associated with plastid functionality and defense metabolism. Enrichment of terms like photosystem stoichiometry adjustment (23.58-fold) and plastid transcription (10.72-fold) suggested a focus on chloroplast maintenance. The production of specialized metabolites was indicated by the enrichment of toxin and phytoalexin biosynthesis (10.48-fold). Metabolic plasticity was further suggested by shifts in valine (7.86-fold) and CoA metabolism (7.45-fold).
In Hitachi hatamochi, the profile was dominated by the biosynthesis of specialized antimicrobial compounds. This was evidenced by strong enrichments in diterpenoid phytoalexin biosynthesis (20.11-fold) and the MEP pathway for terpenoid precursors (12.57-fold). The enrichment of solute transporters (3.57-fold) suggested a coordinated effort in the synthesis and potential transport of these defense compounds.
Similarly, the Azucena profile indicated a comprehensive chemical defense and detoxification strategy. The most significant enrichment was again in diterpenoid phytoalexin biosynthesis (30.3-fold), supported by a robust detoxification system involving NADP+-dependent oxidoreductases (10.7-fold) and glutathione metabolism (5.5-fold). Enrichment of organic acid and amino acid transporters (4.5-fold and 4.2-fold, respectively) pointed towards metabolic redistribution, while taurine/hypotaurine metabolism (10.1-fold) suggested a role in osmoprotection.
The Akita komachi transcriptional profile under AWD was unique, suggesting a light-synchronized adaptive strategy. A profound enrichment in blue light signaling (52.7-fold) and photoreceptor activity (27.9-fold) was observed. Metabolically, the profile indicated enhanced carbon fixation potential (phosphoenolpyruvate carboxylase: 45.2-fold) and osmoprotection (raffinose hydrolysis: 39.6-fold). The strong induction of processes associated with herbicide response (63.3-fold) may point to a mechanism of cross-tolerance to abiotic stressors. This profile implies a complex adaptation where light signals are integrated with profound metabolic reprogramming.
In summary, Hitachi hatamochi and Azucena presented a strong “chemical defense” phenotype, with a major investment in the biosynthesis of diterpenoid phytoalexins and associated detoxification systems. On the other side, IR64 and Akita komachi exhibited strategies centered on metabolic and systemic signaling. IR64’s profile suggested an adaptation focused on plastid retrograde signaling and metabolic flexibility, while Akita komachi displayed a unique, light-synchronized reprogramming, integrating photoreceptor signaling with carbon and nitrogen metabolism to manage water stress.
2.4.3. Functional Enrichment of Differentially Expressed Genes in Leaf Samples Under CF
Under CF conditions, IR64 leaf DEGs were significantly enriched for processes related to nucleotide salvage and proteostasis (Figure 6a). High fold-enrichment was observed in pathways for CDP biosynthesis (88.60) and UDP metabolism (59.07), supported by molecular functions such as CMP kinase activity (88.60). Targeted proteolysis also appeared to be activated, as evidenced by ubiquitin-conjugating enzyme activity (22.72-fold) and polyubiquitination (10.81-fold). Additional enrichments suggested cytoskeletal stabilization (actin filament binding: 9.45-fold) and mobilization of cofactors (metal ion transport: 5.08-fold).
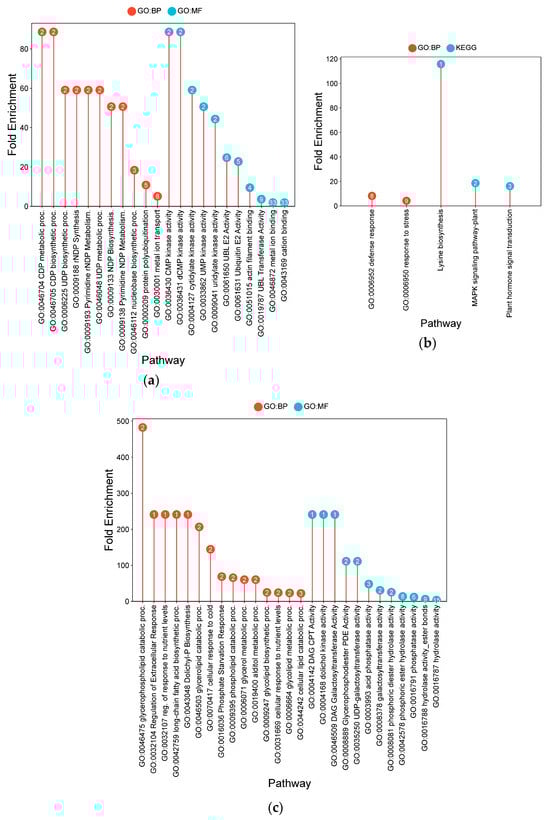
Figure 6.
Lollipop charts showing the top 15 Gene Ontology (GO) terms for each GO category (BP—biological process; CC—cellular components; MF—molecular function) and KEGG for leaf samples under CF conditions, plotted by fold enrichment. Numbers in circles refer to the number of genes in each pathway that overlap with the gene list. (a) IR64; (b) Hitachi hatamochi; (c) Akita komachi.
In contrast, in Hitachi hatamochi CF-responsive DEGs were primarily associated with signaling and defense coordination (Figure 6b). Key enrichments included MAPK cascade (18.61-fold) and plant hormone signal transduction (16.20-fold), with specific DEGs encoding pathogenesis-related protein 1b (OsPR1b, LOC_Os01g03820) and an ethylene-insensitive protein (OsEIL4, LOC_Os08g05087). Broader categories related to defense (8.24-fold) and stress response (4.21-fold) were also enriched. A single-gene enrichment was detected for lysine biosynthesis (115.82-fold), though its functional relevance remains unclear.
For Akita komachi, the most significant CF-associated DEG enrichments were linked to lipid metabolism processes (Figure 6c). These were dominated by pathways for glycerophospholipid catabolism (482.2-fold) and glycerolipid catabolism (206.7-fold), alongside long-chain fatty acid biosynthesis (241.1-fold), collectively indicating substantial remodeling of membrane lipid composition. This was accompanied by significant enrichments in cold-response pathways (144.7-fold) and phosphate-starvation responses (68.9-fold), suggesting activation of shared stress-protective mechanisms. Molecular functions such as diacylglycerol phosphotransferase (241.1-fold) and acid phosphatase activity (48.2-fold) were also notably enriched.
2.4.4. Transcriptional Profiles Under Alternate Wetting and Drying (AWD)
Under AWD irrigation, IR64 displayed DEG enrichments associated primarily with photosynthetic modulation and defense responses (Figure 7a). Notable terms included catabolism of the PSII light-harvesting complex (72.33-fold) and photo-inhibition (60.27-fold). Defense-related enrichments were also observed, including chitin catabolism (38.07-fold) and chitinase activity (19.65-fold). Additional metabolic adjustments were implied by the enrichment of sucrose alpha-glucosidase activity (36.16-fold).
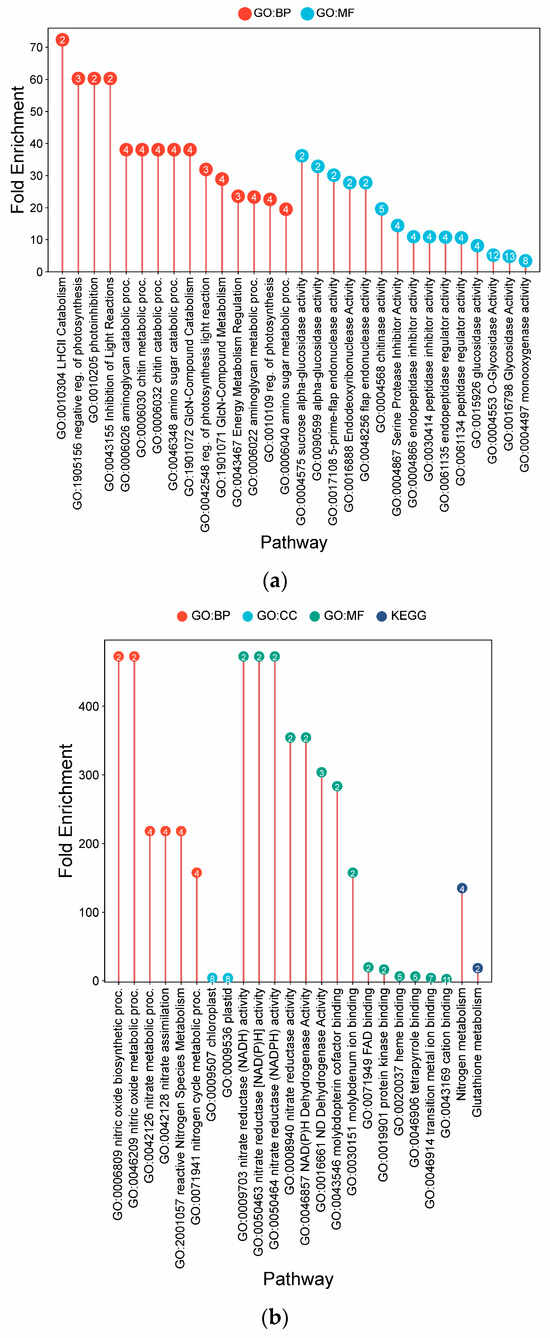
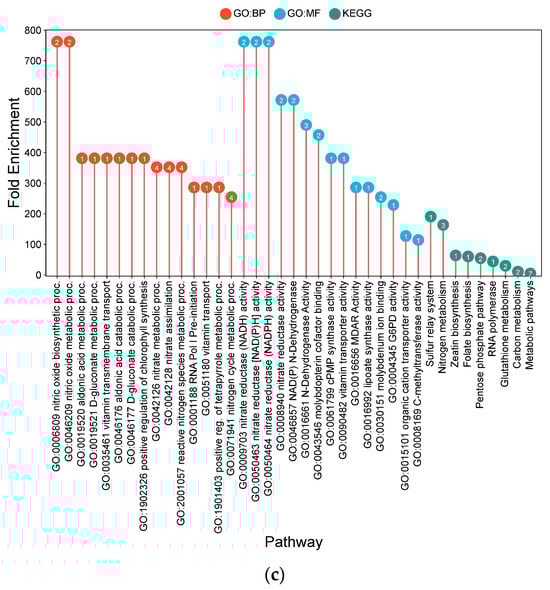
Figure 7.
Lollipop charts showing the top 15 Gene Ontology (GO) terms for each GO category (BP—biological process; CC—cellular components; MF—molecular function) and KEGG for leaf samples under AWD conditions, plotted by fold enrichment. Numbers in circles refer to the number of genes in each pathway that overlap with the gene list. (a) IR64; (b) Hitachi hatamochi; (c) Akita komachi.
In Hitachi hatamochi, AWD-responsive DEGs were enriched for pathways associated with nitrogen and nitric oxide (NO) metabolism (Figure 7b). Strong co-enrichment was detected for NO biosynthetic process (472.5-fold), nitrate assimilation (218.1-fold), and nitrate reductase activity (472.5-fold). The molecular function of molybdenum cofactor binding (283.5-fold) was also enriched, as was glutathione metabolism (18.4-fold).
Akita komachi the most prominent enrichments under AWD were associated with NO and nitrogen pathways (Figure 7c). Very high fold-enrichments were observed for NO biosynthesis (762.2-fold), nitrate reductase activity (762.2-fold), and nitrate assimilation (351.8-fold). Other enriched terms included monodehydroascorbate reductase activity (285.8-fold), vitamin-cofactor-related pathways (381.1-fold), chlorophyll metabolism (381.1-fold), molybdenum cofactor binding (457.3-fold), and zeatin biosynthesis (63.5-fold).
2.4.5. Transcription Factor Enrichment Analysis
Transcription factor enrichment of differentially expressed genes (DEGs) revealed large differences in the putative regulatory networks across the four rice varieties under the contrasting water regimes in both root and leaf tissue at 50 DAT.
Root tissues showed the greatest differences in TF enrichment patterns. IR64 (V1) and Hitachi hatamochi (V2) exhibited the most extensive and statistically significant TF enrichment. In V1, CF-upregulated DEGs were significantly enriched for binding sites of TFs from the Dof, BBR-BPC, and MYB families, whereas AWD-upregulated DEGs were significantly enriched for binding sites associated with bZIP, HSF, and ERF. In V2, CF-upregulated DEGs showed significant enrichment for Dof, TCP, and BBR-BPC TFs, while AWD-upregulated DEGs were enriched for binding sites associated with Dof, WRKY, and C2H2 families.
In contrast, Azucena (V3) and Akita Komachi (V4) showed more limited TF enrichment profiles. In V3, CF-upregulated DEGs were significantly enriched for BBR-BPC, WRKY, and NAC families, whereas AWD-upregulated DEGs were significantly enriched for Dof, C2H2 and bZIP binding sites. In V4, CF-upregulated DEGs showed significant enrichment for MYB and Dof TFs, while AWD-upregulated DEGs were enriched for binding sites associated with bZIP and BES1 families.
Leaf tissue exhibited similar variety-specific transcription factor binding site (TFBS) enrichment patterns. In V1, genes upregulated under CF were enriched for TCP family binding sites, while genes upregulated under AWD were significantly associated with WRKY family binding sites. In contrast, V2 showed a more limited enrichment profile, with CF-upregulated genes linked to MYB and G2-like TFs, and AWD-upregulated genes enriched for bZIP binding sites. V4 showed a different profile, with CF-responsive genes associated with G2-like TFs, while AWD-responsive genes were associated with stress-related HSF and NAC TFs. The detailed results of all transcription factor enrichment analyses have been included as Supplementary Data.
3. Discussion
This study provides a comprehensive transcriptomic analysis of four rice varieties at 50 days after transplanting (DAT), capturing the molecular signatures of sustained acclimation to long-term water management regimes. The findings indicate that adaptation to continuous flooding (CF) and alternate wetting and drying (AWD) is mediated through distinct, organ-specific transcriptional strategies that vary considerably among genotypes. The interpretations presented here are based primarily on differential gene expressions and in silico functional enrichment analyses, and they suggest putative adaptive mechanisms that provide a framework for future hypothesis-driven research.
A key result was the large contrast in transcriptional scale between roots and leaves. Roots exhibited extensive reprogramming, with far more differentially expressed genes (DEGs), highlighting this organ as the primary site of plasticity for long-term adaptation to soil water conditions. In leaves, the more limited transcriptional response suggests that mature foliage achieves a new homeostatic state through more subtle adjustments, potentially via physiological fine-tuning or post-transcriptional regulation established earlier.
Under CF, the root transcriptomes revealed a conserved core response and genotype-specific specializations. All four varieties showed upregulation of pathways for phenylpropanoid biosynthesis and peroxidase activity, consistent with reinforced cell walls and controlled oxidative stress as fundamental components of long-term hypoxia tolerance. However, beyond these shared responses, distinct genotype-specific patterns were also observed. IR64 displayed a profile consistent with maintained growth under CF, characterized by enrichments in pathways related to cell cycle and cytoskeletal organization. In contrast, Hitachi hatamochi and Azucena showed a transcriptional bias towards cellular maintenance, with upregulation of DNA repair and proteasomal degradation pathways. Akita komachi showed the most targeted response, with strong enrichment in anaerobic fermentation and circadian rhythm genes, suggesting a metabolically efficient and pre-tuned strategy for low-oxygen conditions. These observations are consistent with previous studies reporting enrichment of DEGs in pathways related to energy metabolism, aerenchyma formation, ROS dynamics, cell wall modification, and phytohormone signaling [40,41]. Notably, under CF the gene RBOHH, associated with aerenchyma formation [42] was upregulated in all varieties except the tolerant cultivar Azucena, whereas it was not differentially expressed under AWD, suggesting this hypoxia-responsive pathway is not activated under fluctuating soil moisture conditions.
Under AWD, the transcriptional profile shifted from hypoxia adaptation to strategies associated with intermittent soil drying. In roots, both Hitachi hatamochi and Azucena showed strong enrichment for diterpenoid phytoalexin biosynthesis, suggesting that a key part of their long-term acclimation to drying soil may involve heightened chemical defense readiness, possibly anticipating pathogen challenge. Conversely, IR64 and Akita komachi showed enrichment of pathways in branched-chain amino acid and terpenoid biosynthesis, respectively, indicating alternative metabolic strategies. Also, IR64 displayed enrichment of plastid-related functions and secondary metabolism, while Akita komachi showed putative involvement of blue light signaling and photoreception in its root response to AWD.
Transcription factor (TF) enrichment analysis provided further insight into the regulatory logic underlying these variety-specific responses. IR64 and Hitachi hatamochi exhibited robust, conditions-specific TF enrichments: CF was associated with growth-related TFs (e.g., Dof, MYB), whereas AWD induced distinct stress-responsive networks (e.g., bZIP/HSF/ERF in IR64; WRKY/C2H2 in Hitachi hatamochi). In contrast, Azucena and Akita komachi displayed narrower TF enrichment profiles, implying reliance on more constrained transcriptional adjustments or alternative regulatory mechanisms. Significant enrichment was observed for bZIP TFs, including BZIP46, OsbZIP72, and BZIP12, consistent with the established role of bZIPs in rice, which preferentially bind to abscisic acid (ABA)-responsive elements (ABREs) to activate stress-responsive pathways, with their overexpression being consistently linked to enhanced drought and osmotic stress tolerance [43,44,45]. Enrichment of WRKY51 also suggests a potential role in stress acclimation, complementing prior evidence of WRKY-family involvement in pathogen-responsive signaling, like OsWRKY71 which is known to be upregulated by pathogen infection [46,47].
In leaves, acclimation was characterized by targeted, variety-specific pathways. Under CF, IR64 showed enrichment in nucleotide salvage, Hitachi hatamochi in sustained MAPK and hormone signaling, and Akita komachi in lipid catabolism, representing distinct routes to stable physiological function. Under AWD, Hitachi hatamochi and Akita komachi exhibited significant and sustained enrichment for nitric oxide (NO) biosynthesis and nitrate assimilation, consistent with a shared strategy for maintaining redox homeostasis and fine-tuning stomatal regulation during repeated drying cycles. Nitric oxide (NO) is a key regulator of stomatal movement, particularly in mediating stomatal closure [48]. IR64, however, did not share this profile, instead showing enrichment in pathways related to photosystem II catabolism and chitinase activity, implying a divergent acclimation path focused on photoprotection and defense. TF enrichment analysis further clarified the regulatory basis for these physiological adaptations, indicating variety-specific strategies including WRKY-dominated stress response in IR64, bZIP-mediated acclimation in Hitachi hatamochi, and a clear dichotomy between photosynthetic (G2-like) and stress defense (HSF/NAC) TF networks in Akita komachi.
A key consideration when interpreting our results is the scope of this study, which was designed to provide a transcriptomic snapshot of long-term acclimation. While we have identified distinct, organ-specific transcriptional strategies, these molecular profiles were not accompanied by measurements of key agronomic traits, such as yield or plant architecture. Future studies should try to combine gene-level molecular analysis with yield and agronomic trait data from crops grown under the treatment conditions. Furthermore, the use of the bulk RNA-seq approach limits our ability to determine whether the observed transcriptomic patterns reflect regulatory changes within specific cell types or shifts in cell-type composition within the sampled tissues. As a result, while the data allows us to infer potential mechanistic priorities—such as the pronounced transcriptional plasticity in roots—we cannot establish direct links between these molecular responses and agronomic performance, nor can we pinpoint their precise cellular origins.
A central question that emerges from these findings is the extent to which the observed root-level transcriptional reprogramming contributes to stress resilience and yield stability. Addressing this issue will require integrated phenotyping that couples transcriptomic data with physiological and agronomic outcomes, ideally complemented by single-cell or spatial transcriptomics to determine which of the identified molecular signatures are functionally important for crop performance at both the tissue and cellular levels. While single-cell and spatial transcriptomics provide detailed insights into gene activity, these methods fall short of demonstrating how cells communicate with one another. To gain a comprehensive understanding of cell-to-cell communication during stress adaptation, future research should prioritize in situ 3D analysis that can visualize proteins and signals within the actual tissue architecture.
4. Materials and Methods
The study was conducted at the lysimeter facility of Meiji University in Kawasaki, Kanagawa, Japan (35°61′ N, 139°54′ E) from May to October 2023. The facility comprised six plots of lysimeters, each measuring 4 m2 (2 m × 2 m), and was protected by a transparent roof that remained sealed for the duration of the study. The upper soil layer (0–0.35 m depth) consisted of low-humic Andosol, with an underlying layer (0.35–1.75 m depth) of Kanto loam. Prior to transplanting, rice straw, along with farmyard manure (10 tons per hectare), and a fertilizer mixture (N: P2O5:K2O in the ratio of 60:60:60 kg per hectare) were incorporated into the soil through plowing. Drainage pipes were installed at the base and between the soil layers at 0.4 m intervals to facilitate water drainage and regulate hydrological levels. The facility was equipped with sensors to continuously monitor soil moisture, temperature, and redox potential throughout the experiment.
4.1. Experimental Design
Four rice varieties were selected for the experiment: IR64 (indica, lowland), Akita komachi (temperate japonica, lowland), Azucena (tropical japonica, upland), and Hitachi hatamochi (temperate japonica, upland). The rice seeds were obtained from the Crop Science Laboratory at Meiji University (Kawasaki, Japan). They were disinfected in a benomyl hydrate solution (1 g per 1000 mL of water) for 24 h. Then, the seeds were cleaned and immersed in tap water at 32 °C for 4 days before being sown in greenhouse seedling trays that contained a 1:1 mixture of compost and soil. The soil was maintained at an appropriate moisture level by watering every two days, avoiding standing water. After six days, the nursery bed was immersed in water to a depth of 2 cm, and the seedlings were transplanted to the lysimeter plots 15 days after sowing.
The experiment was arranged in a completely randomized block design with three replications for each of the two irrigation treatments: continuous flooding (CF) and alternate wetting and drying (AWD). Each plot consisted of eight rows, each 200 cm in length and spaced 25 cm apart. Within each plot, the four rice varieties were randomly assigned to pairs of rows, with each variety occupying two rows (approximately 16 plants per variety per plot).
Water management for all the plots began by establishing a 2–6 cm flood after transplanting. Thereafter, two distinct irrigation regimes were applied: Continuous Flooding (CF) and Alternate Wetting and Drying (AWD). The CF treatment maintained a water depth of >5 cm from transplanting to harvest, to ensure anaerobic soil conditions. In contrast, the AWD treatment commenced at 20 days after transplanting (DAT), following a cyclical irrigation pattern in which water was allowed to drain until the soil matric potential at 20 cm depth reached −30 kPa, as measured by a tensiometer, after which the plots were re-irrigated to 0 kPa. To ensure consistency across all replicates, re-irrigation was applied synchronously to all AWD plots once the last plot reached the −30 kPa threshold, resulting in variable soil moisture deficits among plots prior to watering. This cycle was repeated until harvest, maintaining the AWD plots in an aerobic soil state without standing water throughout the growing season.
4.2. RNA Extraction and Sequencing
Leaf and root samples were collected from each rice variety across all six plots at 50 days after transplanting (DAT). The sampling occurred when the AWD plots had reached a soil water potential of −30 kPa during the second AWD cycle and just before the plots were re-irrigated. By this time, the plants in the AWD treatment had undergone one full drying-rewetting cycle (drying to −30 kPa followed by rewatering). Two methodological considerations are important for interpreting these samples. First, because the varieties have differing heading dates, sampling on a fixed calendar date means they were likely at different physiological stages at the time of sampling. The heading dates are provided with the Supplementary Data. Second, due to the synchronized re-irrigation protocol for the AWD treatment, the soil water potential at the time of sampling varied among the AWD plots, although all plots had reached or exceeded the −30 kPa threshold.
Immediately after collection, samples were flash-frozen in liquid nitrogen and stored at −80 °C until processing. Total RNA was extracted from roots and leaves using the QIAGEN RNeasy Plant Mini Kit (Qiagen, Hilden, Germany) according to the manufacturer’s instructions. RNA concentration and integrity were assessed using the Quant-iT™ RiboGreen RNA Assay Kit (Thermo Fisher Scientific, Waltham, MA, USA) and an Agilent 2100 Bioanalyzer (Agilent Technologies, Santa Clara, CA, USA), respectively. Only high-quality RNA samples were used for subsequent RNA sequencing, which was performed by Macrogen Corp. (Tokyo, Japan).
4.3. Library Preparation and RNA Sequencing
Libraries were prepared using the TruSeq Stranded mRNA kit (Illumina, San Diego, CA, USA), which isolates mRNA from total RNA. The process involved purifying poly-A-containing mRNA using magnetic beads with poly-T oligonucleotides, fragmenting it using divalent cations at elevated temperature and converting it into cDNA. The first strand of cDNA was synthesized using random hexamers, and actinomycin D-contained in the First Strand Synthesis Act D mix (FSA)-was included to inhibit undesired DNA synthesis and enhance strand specificity.
The second strand of cDNA was subsequently synthesized, during which dUTP was incorporated to inhibit its amplification. This was followed by 3′-end adenylation to enable sequencing adapter ligation. PCR amplification was then performed to generate sufficient quantities of the final cDNA library in accordance with the manufacturer’s recommendations. The final library concentrations were quantified using a Qubit™ dsDNA Quantification Assay on a Qubit Fluorometer (Thermo Fisher Scientific, Waltham, MA, USA). Library integrity and fragment size distributions were evaluated with the 4200 TapeStation D1000 Screen Tape System (Agilent Technologies, Santa Clara, CA, USA). Sequence libraries were normalized and pooled to ensure uniform concentrations across samples prior to sequencing on an Illumina Novaseq 6000 platform (Illumina, San Diego, CA, USA) which produced 150 bp paired end reads. Base calling was carried out using the Real Time Analysis (RTA3) software, after which the BCL/cBCL (base call) binary files were converted to FASTQ files using the bcl2fastq v2.20 software provided by Illumina.
4.4. Transcriptome Analysis
FastQC was used to evaluate raw sequencing quality, and Trimmomatic was used to remove adapter sequences, filter out low-quality reads, and eliminate ambiguous nucleotides. High-quality data of RNA-seq reads were then mapped to the Oryza sativa Japonica- Nipponbare reference genome (IRGSP-1.0) using HISAT2 [49]. The mapped reads were then assembled into transcripts and quantified to estimate gene expression levels. Differential expression analysis was performed by DESeq2 (version 1.6.3) [50] using gene count values, and genes with a false discovery rate (FDR) ≤ 0.01 were considered to be differentially expressed [51]. No minimum fold-change cutoff was implemented, allowing for the detection of the full spectrum of statistically significant transcriptional adjustments, including subtle regulatory changes that may be biologically important [52]. Significantly expressed genes were subsequently categorized based on the direction of change, with those exhibiting a log2FoldChange ≥ 0 classified as upregulated and those with a log2FoldChange < 0 classified as downregulated. DEGs analysis in leaf tissues was performed on varieties V1, V2, and V4; V3 was excluded from this analysis due to an insufficient number of biological replicates, which prevented a statistically robust comparison using DESeq2.
Functional enrichment analysis of significant DEGs was carried out using ShinyGO v0.85 [53], with the Oryza sativa Japonica genome serving as the background gene set. Pathway enrichment was evaluated using a hypergeometric test, and statistical significance was defined as a False Discovery Rate (FDR) of less than 0.05. Effect sizes were expressed as fold enrichment. Pathways deemed too large or too small to offer meaningful insights were excluded from consideration. The significant pathways (FDR < 0.05) were initially ranked by FDR, and the top 30 were then sorted by fold enrichment. Redundant pathways were eliminated to improve clarity. The final results, which showcase the top 15 most significantly enriched biological processes and pathways, were visualized as a vertical lollipop chart using the SRPlot [54] online toolkit. Transcription factor (TFs) enrichment was performed using PlantRegMap [55,56] with a threshold of p-value < 0.01.
5. Conclusions
In conclusion, our integrated analysis demonstrates that long-term adaptation to contrasting water management in rice involves a coordinated yet variety-specific reconfiguration of transcriptional programs across organs. The root system serves as the main locus of transcriptional plasticity, whereas leaves achieve acclimation through more focused and selective adjustments. The TF enrichment patterns identified here provide a valuable, hypothesis-generating framework, highlighting candidate regulatory genes and pathways—such as WRKY, bZIP, and HSF families—that may underline variety-specific adaptive traits. Future research incorporating mutant analyses, transcriptional manipulation, including cell-type-specific dynamics of adaptation at several time points, and detailed physiological measurements will be essential to validate the functional significance of these putative mechanisms and to establish causal relationships between the observed transcriptional changes and acclimation phenotypes.
Supplementary Materials
The following supporting information can be downloaded at: https://www.mdpi.com/article/10.3390/crops5060092/s1, Supplementary Data.
Author Contributions
Conceptualization, methodology, investigation, validation, formal analysis, visualization, writing—original draft preparation, N.Y.; resources, writing—review and editing, supervision, F.S.; writing—review and editing, I.M.; formal analysis, visualization, data curation, W.A.; validation, resources, supervision, writing—review and editing, J.L.S. and S.W.; methodology, validation, writing—review and editing, K.Y.; resources, validation, supervision, writing—review and editing, funding acquisition, project administration, K.N. All authors have read and agreed to the published version of the manuscript.
Funding
This research was funded by JSPS Grant in Aid for Challenging Research (Exploratory) (grant# 22K19230) and JST SICORP (grant# JPMJSC23E3).
Data Availability Statement
All the relevant information is in this document. All the raw data of RNA sequencing has been uploaded to the NCBI database with BioProject number is PRJNA1365461 and 40 SRA accession number (SRR36068243, SRR36068242, SRR36068231, SRR36068220, SRR36068209, SRR36068208, SRR36068207, SRR36068206, SRR36068205, SRR36068204, SRR36068241, SRR36068240, SRR36068239, SRR36068238, SRR36068237, SRR36068236, SRR36068235, SRR36068234, SRR36068233, SRR36068232, SRR36068230, SRR36068229, SRR36068228, SRR36068227, SRR36068226, SRR36068225, SRR36068224, SRR36068223, SRR36068222, SRR36068221, SRR36068219, SRR36068218, SRR36068217, SRR36068216, SRR36068215, SRR36068214, SRR36068213, SRR36068212, SRR36068211, SRR36068210).
Acknowledgments
The authors thank the members of Land Resource Science and Crop Science, Meiji University, for participating in land preparation and sample collection. During the preparation of this manuscript, the author used DeepSeek, version 3.2, for the purposes of interpretation of data and refinement. The authors have reviewed and edited the output and take full responsibility for the content of this publication.
Conflicts of Interest
Kentaro Yano was employed by the company WellGreen-i Co. Ltd. The authors declare no conflicts of interest.
Abbreviations
The following abbreviations are used in this manuscript:
| SRI | System of Rice Intensification |
| AWD | Alternate Wetting and Drying |
| DAT | Days after transplanting |
| CF | Continuous flooding |
| TFs | Transcription factor |
| ABA | Abscisic acid |
| bZIP | Basic Leucine Zipper |
| DREB | Dehydration-responsive element-binding |
| AP2/ERF | APETALA2/ethylene-responsive factor transcription factors |
| WRKY | A group of transcription factors containing a conserved WRKY domain |
| USA | United States of America. |
References
- Muthayya, S.; Sugimoto, J.D.; Montgomery, S.; Maberly, G.F. An Overview of Global Rice Production, Supply, Trade, and Consumption. Ann. N. Y. Acad. Sci. 2014, 1324, 7–14. [Google Scholar] [CrossRef]
- Bin Rahman, A.N.M.R.; Zhang, J. Trends in Rice Research: 2030 and Beyond. Food Energy Secur. 2023, 12, e390. [Google Scholar] [CrossRef]
- Tyagi, A.; Kumar, S.; Mohapatra, T. Biochemical, Physiological and Molecular Responses of Rice to Terminal Drought Stress: Transcriptome Profiling of Leaf and Root Reveals the Key Stress-Responsive Genes. J. Plant Biochem. Biotechnol. 2025, 34, 191–210. [Google Scholar] [CrossRef]
- Saud, S.; Wang, D.; Fahad, S.; Alharby, H.F.; Bamagoos, A.A.; Mjrashi, A.; Alabdallah, N.M.; AlZahrani, S.S.; AbdElgawad, H.; Adnan, M.; et al. Comprehensive Impacts of Climate Change on Rice Production and Adaptive Strategies in China. Front. Microbiol. 2022, 13, 926059. [Google Scholar] [CrossRef]
- Tseng, M.-C.; Roel, A.; Deambrosi, E.; Terra, J.A.; Zorrilla, G.; Riccetto, S.; Pittelkow, C.M. Towards Actionable Research Frameworks for Sustainable Intensification in High-Yielding Rice Systems. Sci. Rep. 2020, 10, 9975. [Google Scholar] [CrossRef]
- Rockström, J.; Williams, J.; Daily, G.; Noble, A.; Matthews, N.; Gordon, L.; Wetterstrand, H.; DeClerck, F.; Shah, M.; Steduto, P.; et al. Sustainable Intensification of Agriculture for Human Prosperity and Global Sustainability. Ambio 2017, 46, 4–17. [Google Scholar] [CrossRef]
- Uphoff, N. SRI: An Agroecological Strategy to Meet Multiple Objectives with Reduced Reliance on Inputs. Agroecol. Sustain. Food Syst. 2017, 41, 825–854. [Google Scholar] [CrossRef]
- Thakur, A.K.; Mandal, K.G.; Mohanty, R.K.; Uphoff, N. How Agroecological Rice Intensification Can Assist in Reaching the Sustainable Development Goals. Int. J. Agric. Sustain. 2022, 20, 216–230. [Google Scholar] [CrossRef]
- Uphoff, N. Higher Yields with Fewer External Inputs? The System of Rice Intensification and Potential Contributions to Agricultural Sustainability. Int. J. Agric. Sustain. 2003, 1, 38–50. [Google Scholar] [CrossRef]
- Moore, M.; Razafindrina, K.; Méndez, V.E.; Niles, M.T. An Analysis of the Adoption of the “System of Rice Intensification” (SRI): Why a Homegrown Technique Has yet to Take Seed among Rice Farmers in Madagascar. Cogent Food Agric. 2024, 10, 2319932. [Google Scholar] [CrossRef]
- Bwire, D.; Saito, H.; Sidle, R.C.; Nishiwaki, J. Water Management and Hydrological Characteristics of Paddy-Rice Fields under Alternate Wetting and Drying Irrigation Practice as Climate Smart Practice: A Review. Agronomy 2024, 14, 1421. [Google Scholar] [CrossRef]
- Dahlgreen, J.; Parr, A. Exploring the Impact of Alternate Wetting and Drying and the System of Rice Intensification on Greenhouse Gas Emissions: A Review of Rice Cultivation Practices. Agronomy 2024, 14, 378. [Google Scholar] [CrossRef]
- Ishfaq, M.; Farooq, M.; Zulfiqar, U.; Hussain, S.; Akbar, N.; Nawaz, A.; Anjum, S.A. Alternate Wetting and Drying: A Water-Saving and Ecofriendly Rice Production System. Agric. Water Manag. 2020, 241, 106363. [Google Scholar] [CrossRef]
- Xu, Y.; Gu, D.; Li, K.; Zhang, W.; Zhang, H.; Wang, Z.; Yang, J. Response of Grain Quality to Alternate Wetting and Moderate Soil Drying Irrigation in Rice. Crop Sci. 2019, 59, 1261–1272. [Google Scholar] [CrossRef]
- Carrijo, D.R.; Lundy, M.E.; Linquist, B.A. Rice Yields and Water Use under Alternate Wetting and Drying Irrigation: A Meta-Analysis. Field Crops Res. 2017, 203, 173–180. [Google Scholar] [CrossRef]
- Howell, K.R.; Shrestha, P.; Dodd, I.C. Alternate Wetting and Drying Irrigation Maintained Rice Yields despite Half the Irrigation Volume, but Is Currently Unlikely to Be Adopted by Smallholder Lowland Rice Farmers in Nepal. Food Energy Secur. 2015, 4, 144–157. [Google Scholar] [CrossRef] [PubMed]
- Zhang, Q.; Liu, X.; Yu, G.; Duan, B.; Wang, H.; Zhao, H.; Feng, D.; Gu, M.; Hu, Y.; Chen, Y.; et al. Alternate Wetting and Moderate Soil Drying Could Increase Grain Yields in Both Main and Ratoon Rice Crops. Crop Sci. 2022, 62, 2413–2427. [Google Scholar] [CrossRef]
- Ullah, H.; Mohammadi, A.; Datta, A. Growth, Yield and Water Productivity of Selected Lowland Thai Rice Varieties under Different Cultivation Methods and Alternate Wetting and Drying Irrigation. Ann. Appl. Biol. 2018, 173, 302–312. [Google Scholar] [CrossRef]
- Chu, G.; Wang, Z.; Zhang, H.; Liu, L.; Yang, J.; Zhang, J. Alternate Wetting and Moderate Drying Increases Rice Yield and Reduces Methane Emission in Paddy Field with Wheat Straw Residue Incorporation. Food Energy Secur. 2015, 4, 238–254. [Google Scholar] [CrossRef]
- Zhang, H.; Xue, Y.; Wang, Z.; Yang, J.; Zhang, J. An Alternate Wetting and Moderate Soil Drying Regime Improves Root and Shoot Growth in Rice. Crop Sci. 2009, 49, 2246–2260. [Google Scholar] [CrossRef]
- Norton, G.J.; Shafaei, M.; Travis, A.J.; Deacon, C.M.; Danku, J.; Pond, D.; Cochrane, N.; Lockhart, K.; Salt, D.; Zhang, H.; et al. Impact of Alternate Wetting and Drying on Rice Physiology, Grain Production, and Grain Quality. Field Crops Res. 2017, 205, 1–13. [Google Scholar] [CrossRef]
- Fu, Y.-Q.; Shen, H.; Yang, X.-J. Root-based mechanism of stimulated formation of reddish-brown iron plaque on rice root surface by moderate alternate wetting and drying. Zhiwu Shengli Xuebao Plant Physiol. J. 2017, 53, 2167–2180. [Google Scholar] [CrossRef]
- Wang, Q.; Wang, H.; Liu, Q.; Zhu, T.; Xu, H.; Ren, H.; Yang, R.; Wu, L.; Zhang, Q.; Ke, J.; et al. Moderate Alternate Wetting and Drying Irrigation Enhances Drought-resistance Abilities by Improving Structural Mesophyll Conductance of Water-saving and Drought-resistant Rice under Severe Drought. Physiol. Plant. 2024, 176, e14518. [Google Scholar] [CrossRef] [PubMed]
- Wang, Z.; Guo, X.; Yang, J.; Chen, S.; Huang, S.; Wang, F.; Qiu, R.; Liu, C.; Cao, X.; Zhu, J.; et al. Effect of alternate flooding and drought stress on biomass production, distribution and lodging characteristic of rice. Nongye Gongcheng Xuebao 2016, 32, 114–123. [Google Scholar] [CrossRef]
- Mackill, D.J.; Khush, G.S. IR64: A High-Quality and High-Yielding Mega Variety. Rice 2018, 11, 18. [Google Scholar] [CrossRef] [PubMed]
- Yamauchi, T.; Nakazono, M. Modeling-Based Age-Dependent Analysis Reveals the Net Patterns of Ethylene-Dependent and -Independent Aerenchyma Formation in Rice and Maize Roots. Plant Sci. 2022, 321, 111340. [Google Scholar] [CrossRef]
- Singh, T.; Pun, K.B.; Bhagat, K.; Lal, B.; Satapathy, B.S.; Sadawarti, M.; Katara, J.; Lenka, S.; Gautam, P. Abiotic Stress in Rice: Mechanism of Adaptation. In Challenges and Prospective of Plant Abiotic Stress; Today & Tomorrow’s Printers and Publishers: New Delhi, India, 2015; Volume 1, pp. 259–360. ISBN 81-7019-503-5. [Google Scholar]
- Alou, I.N.; Steyn, J.M.; Annandale, J.G.; van der Laan, M. Growth, Phenological, and Yield Response of Upland Rice (Oryza sativa L. cv. Nerica 4®) to Water Stress during Different Growth Stages. Agric. Water Manag. 2018, 198, 39–52. [Google Scholar] [CrossRef]
- Deka, M.; Baruah, K.K. Comparable Studies of Rainfed Upland Winter Rice (Oryza sativa) Cultivars for Drought Tolerance. Indian J. Agric. Sci. 2000, 70, 135–139. [Google Scholar]
- Kawakatsu, T.; Teramoto, S.; Takayasu, S.; Maruyama, N.; Nishijima, R.; Kitomi, Y.; Uga, Y. The Transcriptomic Landscapes of Rice Cultivars with Diverse Root System Architectures Grown in Upland Field Conditions. Plant J. 2021, 106, 1177–1190. [Google Scholar] [CrossRef]
- Abdirad, S.; Ghaffari, M.R.; Majd, A.; Irian, S.; Soleymaniniya, A.; Daryani, P.; Koobaz, P.; Shobbar, Z.-S.; Farsad, L.K.; Yazdanpanah, P.; et al. Genome-Wide Expression Analysis of Root Tips in Contrasting Rice Genotypes Revealed Novel Candidate Genes for Water Stress Adaptation. Front. Plant Sci. 2022, 13, 792079. [Google Scholar] [CrossRef]
- Ahmdikhah, A.; Safaeizadeh, M.; Tehranian, A.S. Responses of Rice Plant to Multiple Abiotic Stresses Revealed by Transcriptome Meta-Analysis and Identification of Novel Genetic Factors. Sci. Rep. 2025, 15, 8248. [Google Scholar] [CrossRef]
- Azad, M.; Tohidfar, M.; Ghanbari Moheb Seraj, R.; Mehralian, M.; Esmaeilzadeh-Salestani, K. Identification of Responsive Genes to Multiple Abiotic Stresses in Rice (Oryza sativa): A Meta-Analysis of Transcriptomics Data. Sci. Rep. 2024, 14, 5463. [Google Scholar] [CrossRef]
- Du, H.; Huang, F.; Wu, N.; Li, X.; Hu, H.; Xiong, L. Integrative Regulation of Drought Escape through ABA-Dependent and -Independent Pathways in Rice. Mol. Plant 2018, 11, 584–597. [Google Scholar] [CrossRef]
- Al-Jawaheri, A.J.B.; Alogaidi, F.F. Effect of Abscisic Acid (ABA) on Yield and Its Components of Four Rice Varieties (Oryza sativa L.) under Aerobic Conditions. Plant Arch. 2020, 20, 1071–1076. [Google Scholar]
- Darwish, E.; Rehman, S.U.; Mao, X.; Jing, R. A Wheat Stress Induced WRKY Transcription Factor TaWRKY32 Confers Drought Stress Tolerance in Oryza sativa. Asian J. Agric. Biol. 2021, 2021, 1–7. [Google Scholar] [CrossRef]
- Singh, D.; Laxmi, A. Transcriptional Regulation of Drought Response: A Tortuous Network of Transcriptional Factors. Front. Plant Sci. 2015, 6, 895. [Google Scholar] [CrossRef]
- Baldoni, E.; Frugis, G.; Martinelli, F.; Benny, J.; Paffetti, D.; Buti, M. A Comparative Transcriptomic Meta-Analysis Revealed Conserved Key Genes and Regulatory Networks Involved in Drought Tolerance in Cereal Crops. Int. J. Mol. Sci. 2021, 22, 13062. [Google Scholar] [CrossRef] [PubMed]
- Azameti, M.K.; Dauda, W.P.; Panzade, K.P.; Vishwakarma, H. Identification and Characterization of Genes Responsive to Drought and Heat Stress in Rice (Oryza sativa L.). Vegetos 2021, 34, 309–317. [Google Scholar] [CrossRef]
- Liu, J.; Hasanuzzaman, M.; Sun, H.; Zhang, J.; Peng, T.; Sun, H.; Xin, Z.; Zhao, Q. Comparative Morphological and Transcriptomic Responses of Lowland and Upland Rice to Root-Zone Hypoxia. Environ. Exp. Bot. 2020, 169, 103916. [Google Scholar] [CrossRef]
- Song, T.; Das, D.; Yang, F.; Chen, M.; Tian, Y.; Cheng, C.; Sun, C.; Xu, W.; Zhang, J. Genome-Wide Transcriptome Analysis of Roots in Two Rice Varieties in Response to Alternate Wetting and Drying Irrigation. Crop J. 2020, 8, 586–601. [Google Scholar] [CrossRef]
- Yamauchi, T.; Yoshioka, M.; Fukazawa, A.; Mori, H.; Nishizawa, N.K.; Tsutsumi, N.; Yoshioka, H.; Nakazono, M. An NADPH Oxidase RBOH Functions in Rice Roots during Lysigenous Aerenchyma Formation under Oxygen-Deficient Conditions. Plant Cell 2017, 29, 775–790. [Google Scholar] [CrossRef]
- Zhang, C.; Li, C.; Liu, J.; Lv, Y.; Yu, C.; Li, H.; Zhao, T.; Liu, B. The OsABF1 Transcription Factor Improves Drought Tolerance by Activating the Transcription of COR413-TM1 in Rice. J. Exp. Bot. 2017, 68, 4695–4707. [Google Scholar] [CrossRef]
- Chang, Y.; Nguyen, B.H.; Xie, Y.; Xiao, B.; Tang, N.; Zhu, W.; Mou, T.; Xiong, L. Co-Overexpression of the Constitutively Active Form of OsbZIP46 and ABA-Activated Protein Kinase SAPK6 Improves Drought and Temperature Stress Resistance in Rice. Front. Plant Sci. 2017, 8, 1102. [Google Scholar] [CrossRef]
- Xiang, Y.; Tang, N.; Du, H.; Ye, H.; Xiong, L. Characterization of OsbZIP23 as a Key Player of the Basic Leucine Zipper Transcription Factor Family for Conferring Abscisic Acid Sensitivity and Salinity and Drought Tolerance in Rice. Plant Physiol. 2008, 148, 1938–1952. [Google Scholar] [CrossRef]
- Gammanpila, H.; Sashika, M.A.N.; Priyadarshani, S.V.G.N. Transcription Factors in Rice (Oryza sativa) Agriculture: Enhancing Resilience to Environmental Stress and Global Food Security. Stresses 2025, 5, 55. [Google Scholar] [CrossRef]
- Li, T.; Li, B.; Wang, Y.; Xu, J.; Li, W.; Chen, Z.; Mou, W.; Xue, D. WRKY Transcription Factors in Rice: Key Regulators Orchestrating Development and Stress Resilience. Plant Cell Environ. 2025, 48, 8388–8406. [Google Scholar] [CrossRef]
- Sun, L.R.; Yue, C.M.; Hao, F.S. Update on Roles of Nitric Oxide in Regulating Stomatal Closure. Plant Signal. Behav. 2019, 14, e1649569. [Google Scholar] [CrossRef]
- Kim, D.; Paggi, J.M.; Park, C.; Bennett, C.; Salzberg, S.L. Graph-Based Genome Alignment and Genotyping with HISAT2 and HISAT-Genotype. Nat. Biotechnol. 2019, 37, 907–915. [Google Scholar] [CrossRef]
- Love, M.I.; Huber, W.; Anders, S. Moderated Estimation of Fold Change and Dispersion for RNA-Seq Data with DESeq2. Genome Biol. 2014, 15, 550. [Google Scholar] [CrossRef] [PubMed]
- Corchete, L.A.; Rojas, E.A.; Alonso-López, D.; De Las Rivas, J.; Gutiérrez, N.C.; Burguillo, F.J. Systematic Comparison and Assessment of RNA-Seq Procedures for Gene Expression Quantitative Analysis. Sci. Rep. 2020, 10, 19737. [Google Scholar] [CrossRef] [PubMed]
- McCarthy, D.J.; Smyth, G.K. Testing Significance Relative to a Fold-Change Threshold Is a TREAT. Bioinformatics 2009, 25, 765–771. [Google Scholar] [CrossRef] [PubMed]
- Ge, S.X.; Jung, D.; Yao, R. ShinyGO: A Graphical Gene-Set Enrichment Tool for Animals and Plants. Bioinformatics 2020, 36, 2628–2629. [Google Scholar] [CrossRef]
- Tang, D.; Chen, M.; Huang, X.; Zhang, G.; Zeng, L.; Zhang, G.; Wu, S.; Wang, Y. SRplot: A Free Online Platform for Data Visualization and Graphing. PLoS ONE 2023, 18, e0294236. [Google Scholar] [CrossRef]
- Jin, J.; Tian, F.; Yang, D.-C.; Meng, Y.-Q.; Kong, L.; Luo, J.; Gao, G. PlantTFDB 4.0: Toward a Central Hub for Transcription Factors and Regulatory Interactions in Plants. Nucleic Acids Res. 2017, 45, D1040–D1045. [Google Scholar] [CrossRef] [PubMed]
- Tian, F.; Yang, D.-C.; Meng, Y.-Q.; Jin, J.; Gao, G. PlantRegMap: Charting Functional Regulatory Maps in Plants. Nucleic Acids Res. 2019, 48, gkz1020. [Google Scholar] [CrossRef] [PubMed]
Disclaimer/Publisher’s Note: The statements, opinions and data contained in all publications are solely those of the individual author(s) and contributor(s) and not of MDPI and/or the editor(s). MDPI and/or the editor(s) disclaim responsibility for any injury to people or property resulting from any ideas, methods, instructions or products referred to in the content. |
© 2025 by the authors. Licensee MDPI, Basel, Switzerland. This article is an open access article distributed under the terms and conditions of the Creative Commons Attribution (CC BY) license (https://creativecommons.org/licenses/by/4.0/).