Article

Fipexide Rapidly Induces Callus Formation in Medicago sativa by Regulating Small Auxin Upregulated RNA (SAUR) Family Genes

1
School of Grassland Science, Beijing Forestry University, Beijing 100083, China
2
School of Ecology and Nature Conservation, Beijing Forestry University, Beijing 100083, China
*
Authors to whom correspondence should be addressed.
These authors contributed equally to this work.
Crops 2025, 5(3), 28; https://doi.org/10.3390/crops5030028
Submission received: 24 February 2025 / Revised: 15 April 2025 / Accepted: 18 April 2025 / Published: 9 May 2025

Abstract

The small-molecule compound fipexide (FPX) has been shown to promote callus formation in several plants, but its effects on forage crops remain unexplored, and its molecular mechanism is not yet fully understood. In this study, we evaluated FPX-induced callus formation from seeds for up to four weeks in four elite cultivars of Medicago sativa, finding it to be faster than the classical 2,4-D/6-BA treatment for the first two weeks. Notably, the cellular organization of FPX-induced calli differed from those induced by 2,4-D/6-BA by showing almost no conducting tissues. Comparative transcriptome analysis revealed dynamic gene expression changes during the early and late stages of callus induction, such as multicellular organism development and response to auxin. Interestingly, in both M. sativa and Arabidopsis, FPX regulates a group of small auxin upregulated RNA (SAUR) family genes, which are known to fine-tune growth in response to internal and external signals. This suggests a potential evolutionary conserved molecular mechanism underlying FPX-induced callus formation across plant species.

1. Introduction

Plant genetic engineering has boosted global crop production for over four decades, offering higher yields, enhanced nutritional value, and environmental benefits, thus contributing to global food security [1,2,3]. At the core of plant genetic engineering lies genetic transformation. Although recent advancements have introduced direct transformation methods, most current approaches still rely on tissue culture [4]. Based on the totipotency of plant cells, plant tissue culture techniques enable the regeneration of complete plants from single cells, tissues, or organs under aseptic conditions using synthetic media [5]. Growth regulators are the primary components of these synthetic media and are broadly classified into auxins and cytokinins. Typically, both types of growth regulators are used throughout the tissue culture process, with their ratios varying depending on the stage (e.g., callus induction, shooting, and rooting). Optimizing these ratios is critical but often challenging for certain plant species or genotypes, leading researchers to explore more efficient and easily applicable growth regulators.
Nearly one hundred years ago, the ability to generate callus artificially in vitro was discovered [6,7,8]. Exogenous application of auxin and cytokinin can induce callus formation in various plant species [9]. Typically, an intermediate auxin-to-cytokinin ratio promotes callus induction, while a high ratio of auxin-to-cytokinin or cytokinin-to-auxin induces root and shoot regeneration, respectively [9,10]. Callus induction involves the rapid growth of cells from a single differentiated cell, requiring extensive changes in gene expression to regulate cell differentiation and dedifferentiation [9].
A repurposed compound, fipexide (FPX) (Figure S1A), was recently identified through a chemical library screen for its ability to inhibit hypocotyl elongation in Arabidopsis [11]. Its structure closely resembles that of 2,4-Dichlorophenoxyacetic acid (2,4-D) (Figure S1B). Remarkably, FPX has demonstrated dose-dependent callus formation activity and induced distinct cellular organization in calli from root explants compared to traditional auxin/cytokinin treatments [11]. FPX also promotes shoot regeneration from calli [11]. Beyond Arabidopsis, FPX has proven effective in promoting callus formation and shoot regeneration in monocots (e.g., Oryza sativa and Brachypodium distachyon), woody plants (e.g., Populus tremula), vegetable crops (e.g., Glycine max L. ‘Tsurunoko’, Solanum lycopersicum L. ‘Micro-Tom’, and Cucumis sativus L. ‘Natsusuzumi’), and ornamental plants (e.g., Matthiola incana) [11,12]. However, FPX has yet to be tested on forage plants. In addition, the mechanism by which FPX promotes callus formation in different species is still not fully understood.
Medicago sativa, commonly known as alfalfa, often referred to as the “king of forages”, is one of the most important Fabaceae forages globally due to its high nutritional value and palatability. As an autotetraploid plant (2n = 4x = 32) with a genome size of 800–900 Mbp, M. sativa faces challenges in breeding due to self-incompatibility, inbreeding depression, and reliance on insect-assisted pollination [13,14]. Traditional crossbreeding methods are, therefore, limited, but transgenic technology offers great potential for improving its agronomic traits. Unfortunately, tissue culture difficulties have restricted transformation to only a few genotypes, excluding some elite ones such as 4020, 4030, Dite, and Spyder [15]. As M. sativa belongs to the same family as Glycine max, we hypothesize that FPX may also induce callus in M. sativa. In this study, we investigated the use of FPX to induce callus formation in four elite cultivars of M. sativa and optimized its dosage for callus induction. We compared the efficiency of FPX with traditional auxin/cytokinin treatments and analyzed the morphological differences in calli induced by each method. Additionally, given that FPX is structurally similar to auxin, we hypothesized that it may regulate auxin-related genes. Through transcriptome analysis, which provides molecular-level evidence for understanding callus induction mechanisms, we examined the transcriptional dynamics in M. sativa cells in response to FPX and traditional growth regulators, offering insights into the mechanisms underlying FPX-mediated callus formation.

2. Materials and Methods

2.1. Plant Materials and Growth Conditions

Four M. sativa varieties—4020, 4030, Dite, and Spyder—were used. For treatments involving plant growth regulators (PGRs), 25 M. sativa seeds per variety were sown on plates containing Murashige and Skoog (MS) [16] medium enriched with 3% sucrose and the respective growth regulators. The M. sativa seeds and plants were cultivated at 25 °C under white light, following a 16 h light/8 h dark cycle.

2.2. Callus Induced by Different PGRs

The alfalfa seeds were sterilized by 10% Clorox for 15 min, sterilized by water three times, and then sown on MS medium supplemented with FPX at concentrations of 10 μM, 20 μM, 30 μM, 40 μM, and 50 μM. MS medium without growth regulators served as a blank control, while MS medium containing 2,4-D/6-Benzylaminopurine (6-BA) (at concentrations of 4 μg/L and 0.2 μg/L, respectively) was used as a comparative treatment. A combination of FPX and 2,4-D/6-BA (at concentrations of 4 μg/L and 0.2 μg/L, respectively) was also used. The hypocotyl length and induced callus area were measured to assess the effect of FPX on callus induction. Each experiment was replicated three times.

2.3. Paraffin Observation of FPX-Treated and Auxin- and Cytokinin-Treated Callus

Callus tissue grown from M. sativa ‘4030’ seed was cultured on MS medium supplemented with FPX (30 μM) and 2,4-D/6-BA (at concentrations of 4 μg/L and 0.2 μg/L, respectively) for four weeks. The tissue was then processed for paraffin sectioning, stained with toluidine blue, and observed under light microscopy.

2.4. RNA-seq Analysis of FPX-Treated Callus

Callus of M. sativa ‘4030’ grown on MS medium containing 30 μM FPX for 2 and 15 days was used, and those grown on MS medium not containing FPX were used as a control for transcriptome sequencing. Each treatment was repeated three technical times. The raw sequencing data were processed using fastp v0.23.4 [17]. The clean reads were aligned to the Zhongmu No. 1 genome using HISAT2 [18] and SAMtools v1.6 [19]. The reference genome annotation file in GFF format was converted into GTF format using GffRead [20], and FeatureCounts was used to quantify the aligned reads [21]. Differentially expressed gene (DEG) analysis was conducted using DESeq2 based on FPKM [22]. The false discovery rate (FDR) was controlled using the Benjamini and Hochberg (1995) [23] correction method, with significant DEGs defined as those with |log2FoldChange| ≥ 1 and Padj < 0.05. A heatmap was plotted using the OmicStudio platform [24]. KEGG enrichment analysis was performed using the online tool available at https://modms.lzu.edu.cn (accessed on 14 April 2024).
Gene expression data for Arabidopsis under FPX treatment on days 2 and 8 were obtained through easyGEO (https://tau.cmmt.ubc.ca/eVITTA/easyGEO/, accessed on 11 November 2024), with accession number GSE116939. A heatmap was plotted using the OmicStudio platform.

2.5. Quantitative Real-Time PCR

Total RNA of the callus forming from alfalfa variety ‘4030’ was extracted using the TRI Gene reagent (GenStar, Beijing, China). First-strand cDNA was synthesized using the BeyoRT™ II First Strand cDNA Synthesis Kit with gDNA Eraser (Beyotime Biotechnology, Shanghai, China) and served as the template for RT-PCR. Primers were designed with Beacon Designer (PREMIER Biosoft, San Francisco, CA, USA). Quantitative real-time PCR was performed using a three-step method with BeyoFast SYBR Green qPCR Mix (Beyotime Biotechnology, Shanghai, China). The sequences of the gene-specific primers used for real-time PCR are listed in Table S1. The primers were designed by Beacon Designer v. 8.12. The amplification cycling protocol included an initial enzyme activation step at 95 °C for 2 min, followed by 40 cycles of 95 °C for 15 s (denaturation), 60 °C for 30 s (annealing), and 72 °C for 30 s (extension).

2.6. Statistical Analysis

Callus areas and hypocotyl lengths were measured using ImageJ v1.54g [25], with each experiment replicated three times. Data, including callus area, hypocotyl length, and RT-PCR gene expression levels, were organized and processed in Microsoft Excel 2019. Standard deviation calculations and bar plot generation were performed using GraphPad Prism 10.4.1. RNA-seq raw data were also organized using Microsoft Excel 2019.

2.7. Phylogenetic Analysis

We identified SAUR proteins in M. sativa using DIAMOND v0.9.21 [26], with 79 SAURs of Arabidopsis as queries with an e-value threshold of 1 × 10⁻⁵ and a sequence identity of at least 50%. The protein sequences of M. sativa were obtained from the reference genome of Zhongmu No. 1 [27]. The retrieved homologs and Arabidopsis SAURs were aligned using MAFFT v7.487 [28]. The protein alignment was then converted into a codon-based nucleotide format with pal2nal v14 [29]. TrimAl v1.2rev59 [30] was applied using a strict model to refine the alignment and remove poorly aligned regions. We selected the best-fit nucleotide substitution model using MEGA X [31]. A maximum likelihood phylogenetic tree was constructed using RAxML v8.2.12 [32], applying the GTR + GAMMA + I model with bootstrap support calculated from 1000 replicates. The resulting phylogenetic tree was visualized and edited using the Interactive Tree Of Life (iTOL) online tool [33].

3. Results

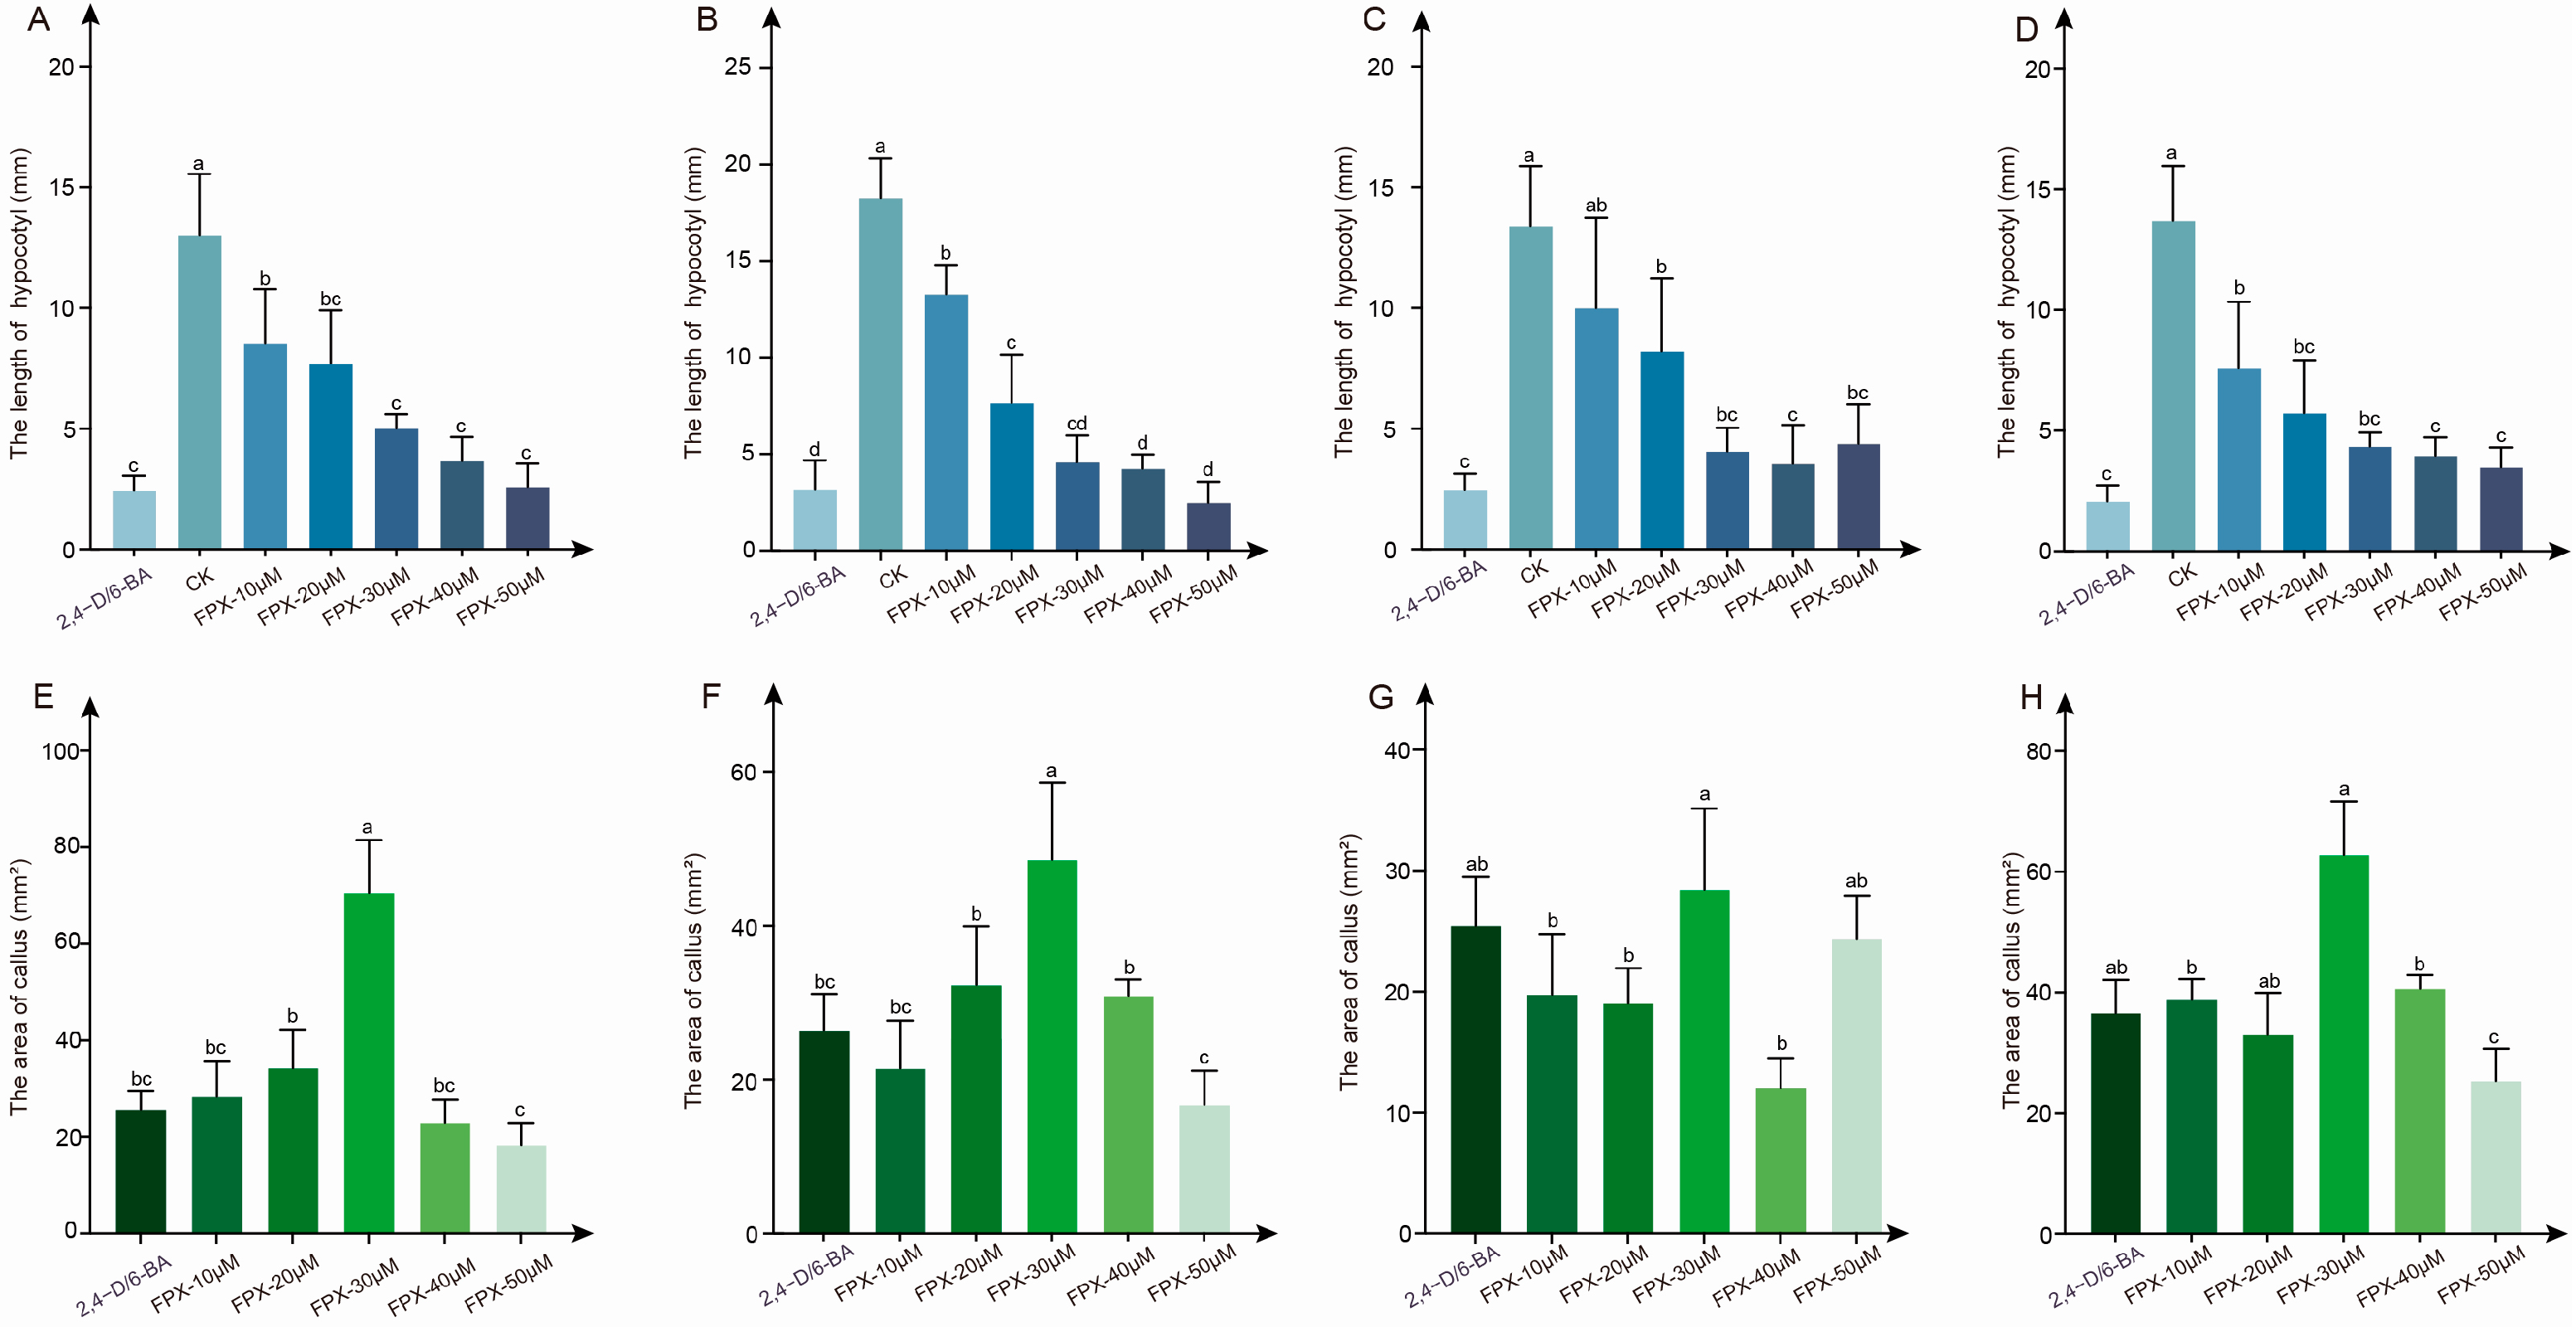
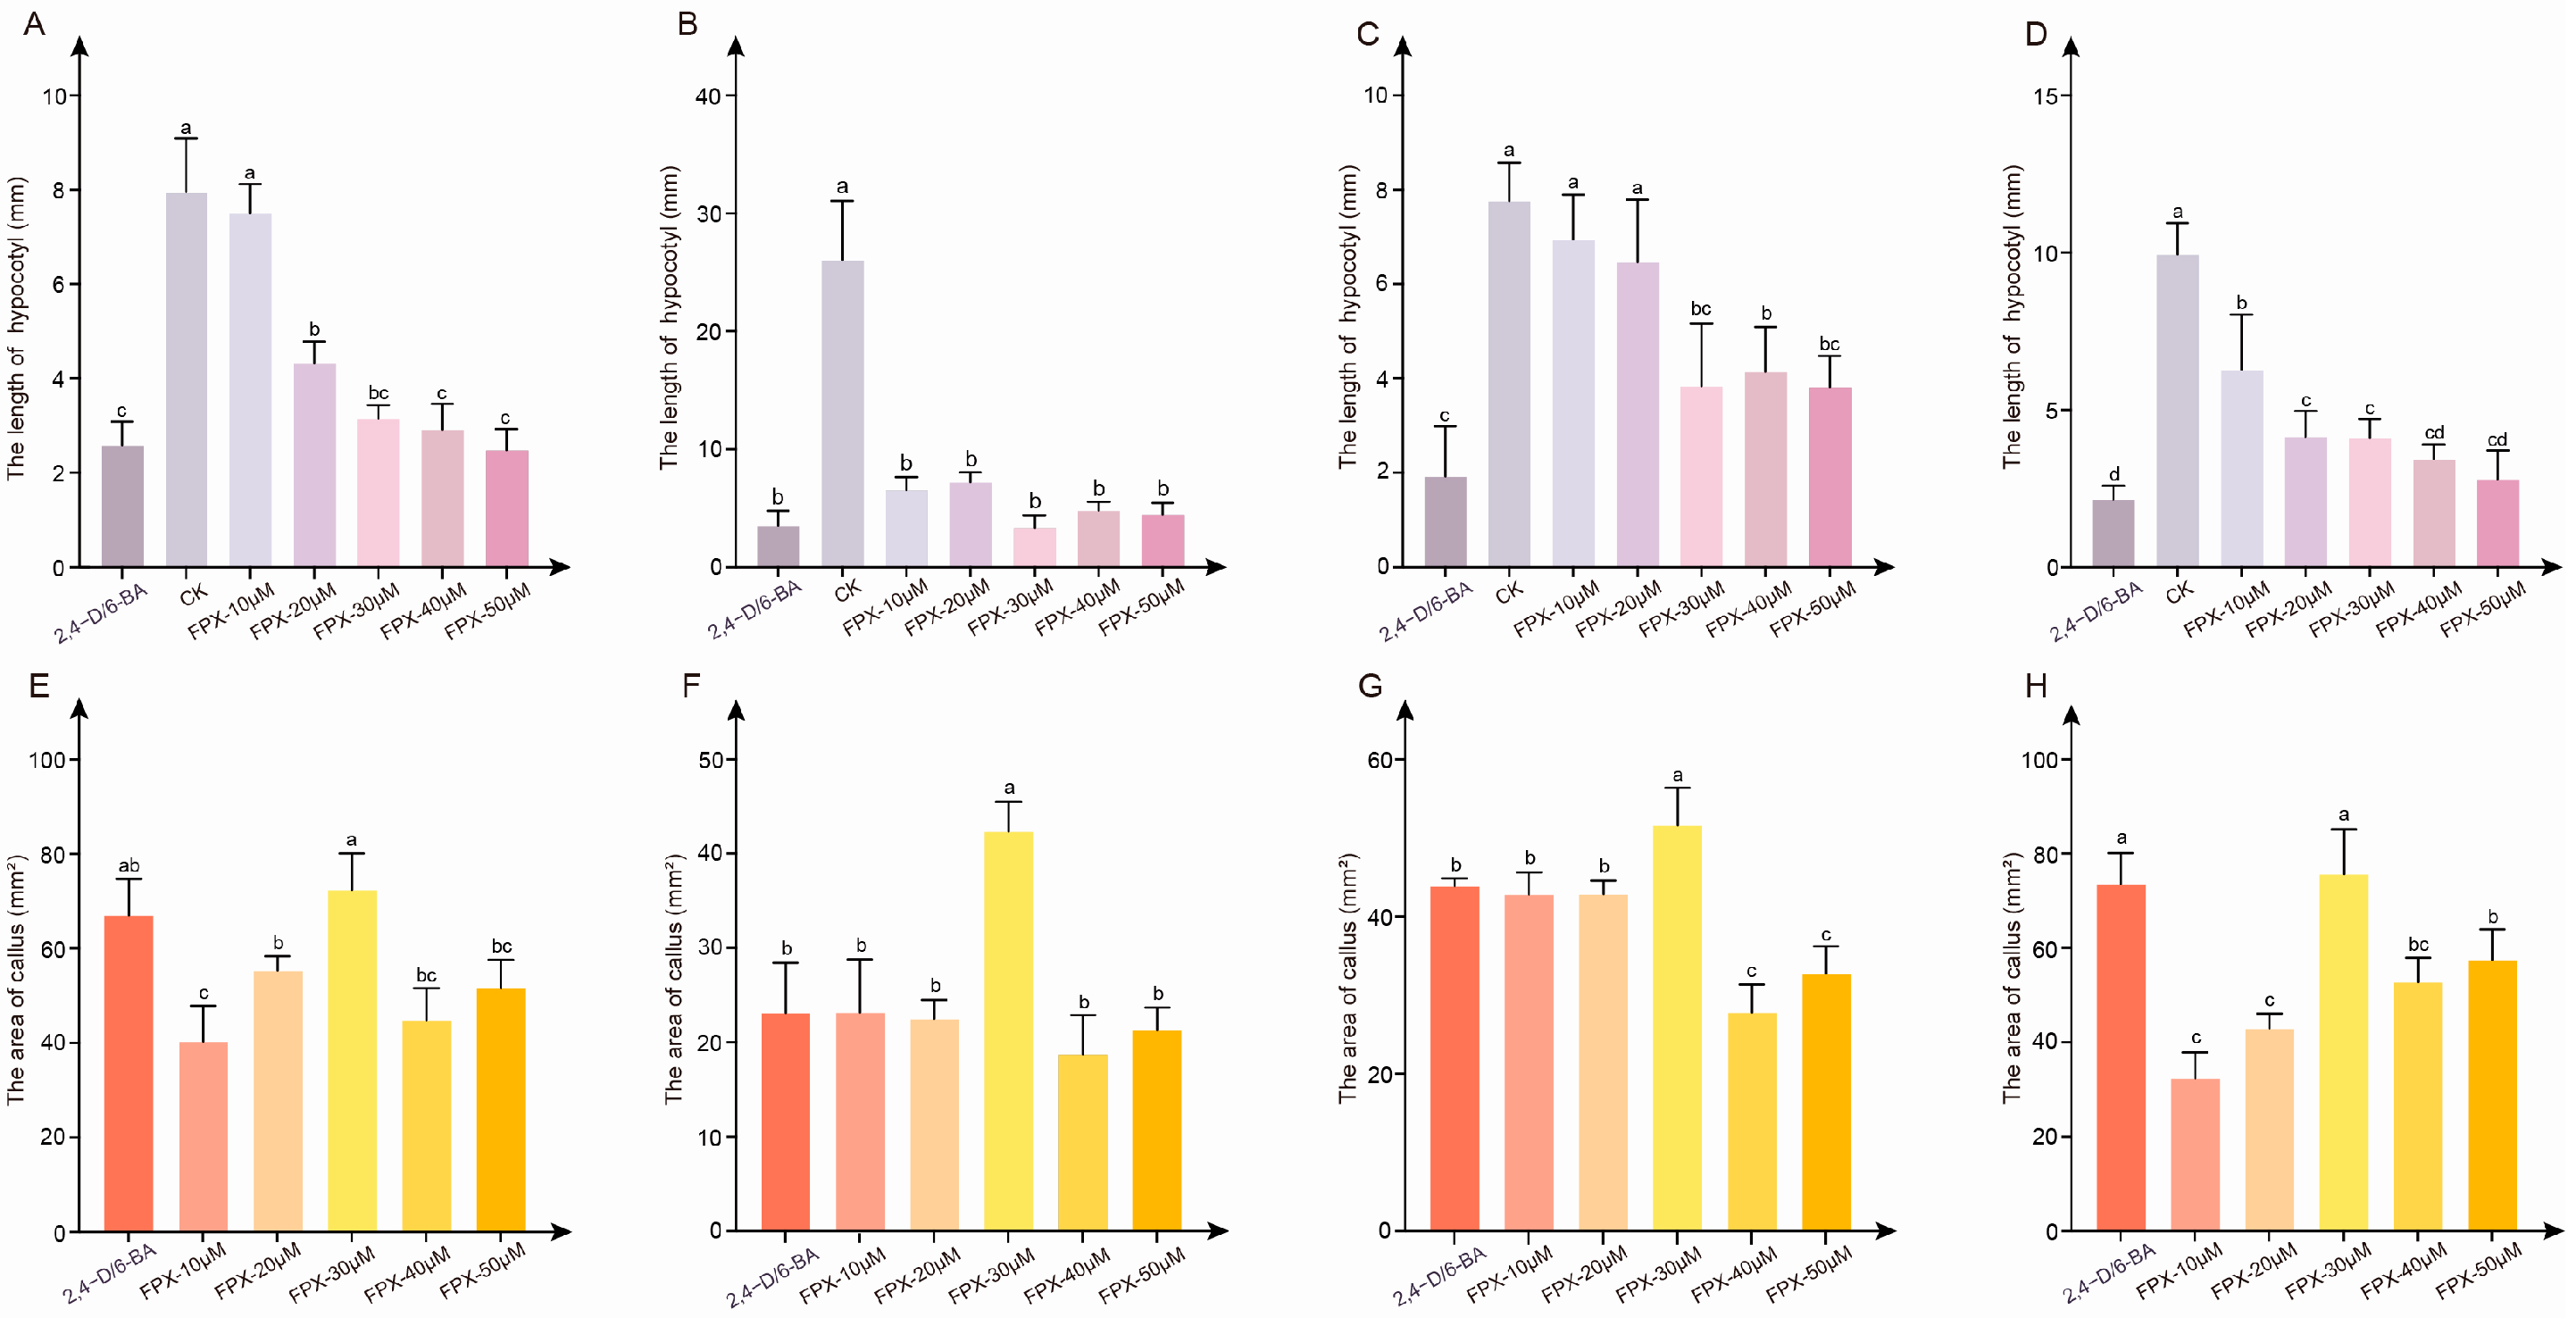
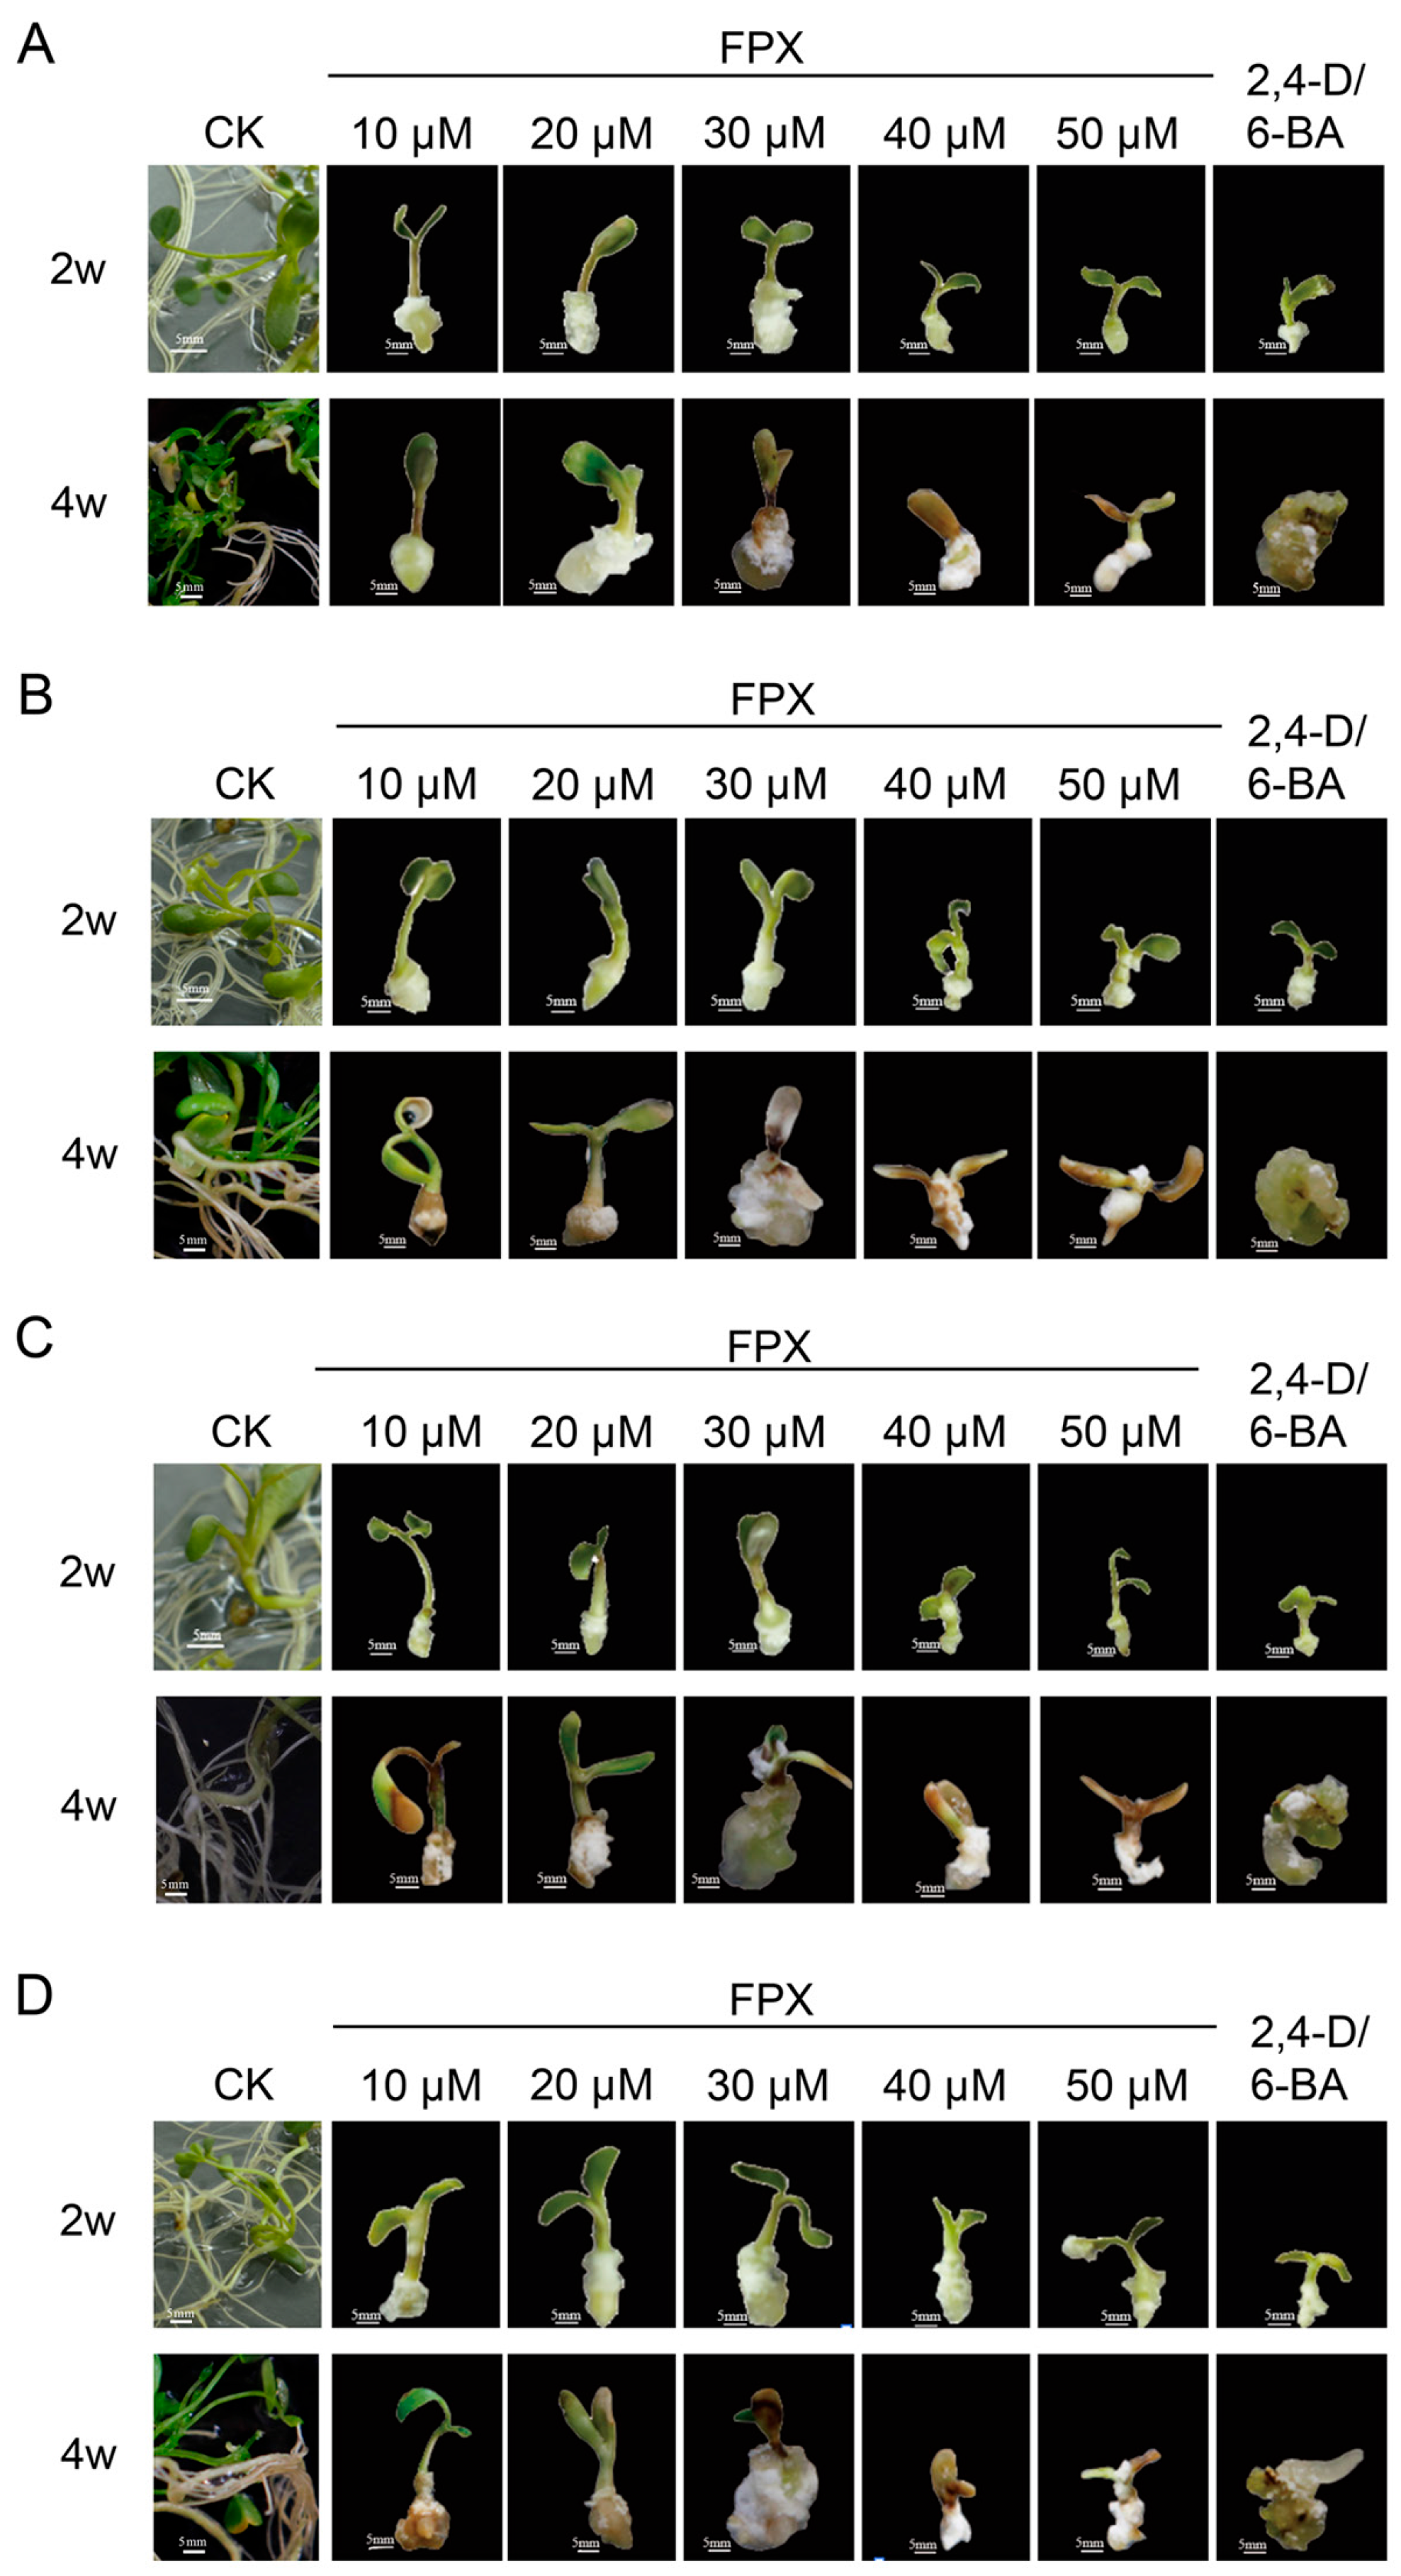
3.1. FPX Treatment Rapidly Induced Callus Formation

To investigate the effects of varying FPX concentrations on callus induction in M. sativa and identify the optimal concentration, we conducted an experiment using four M. sativa varieties: ‘4020’, ‘4030’, ‘Dite’, and ‘Spyder’. Our results show that the callus growth in response to the FPX concentration varied among M. sativa varieties. However, after two weeks, 30 μM FPX was found to be the most effective for callus induction across all varieties (Figure 1). In addition, after four weeks, 30 μM FPX was still found to have the best results (Figure 2). Increasing the FPX concentrations resulted in greater inhibition of hypocotyl elongation, while the callus area expanded over time (Figure 3A–D). Compared to FPX, 2,4-D/6-BA exhibited a stronger inhibitory effect on hypocotyl elongation but showed a comparable ability to promote callus growth (Figure 2A–D).

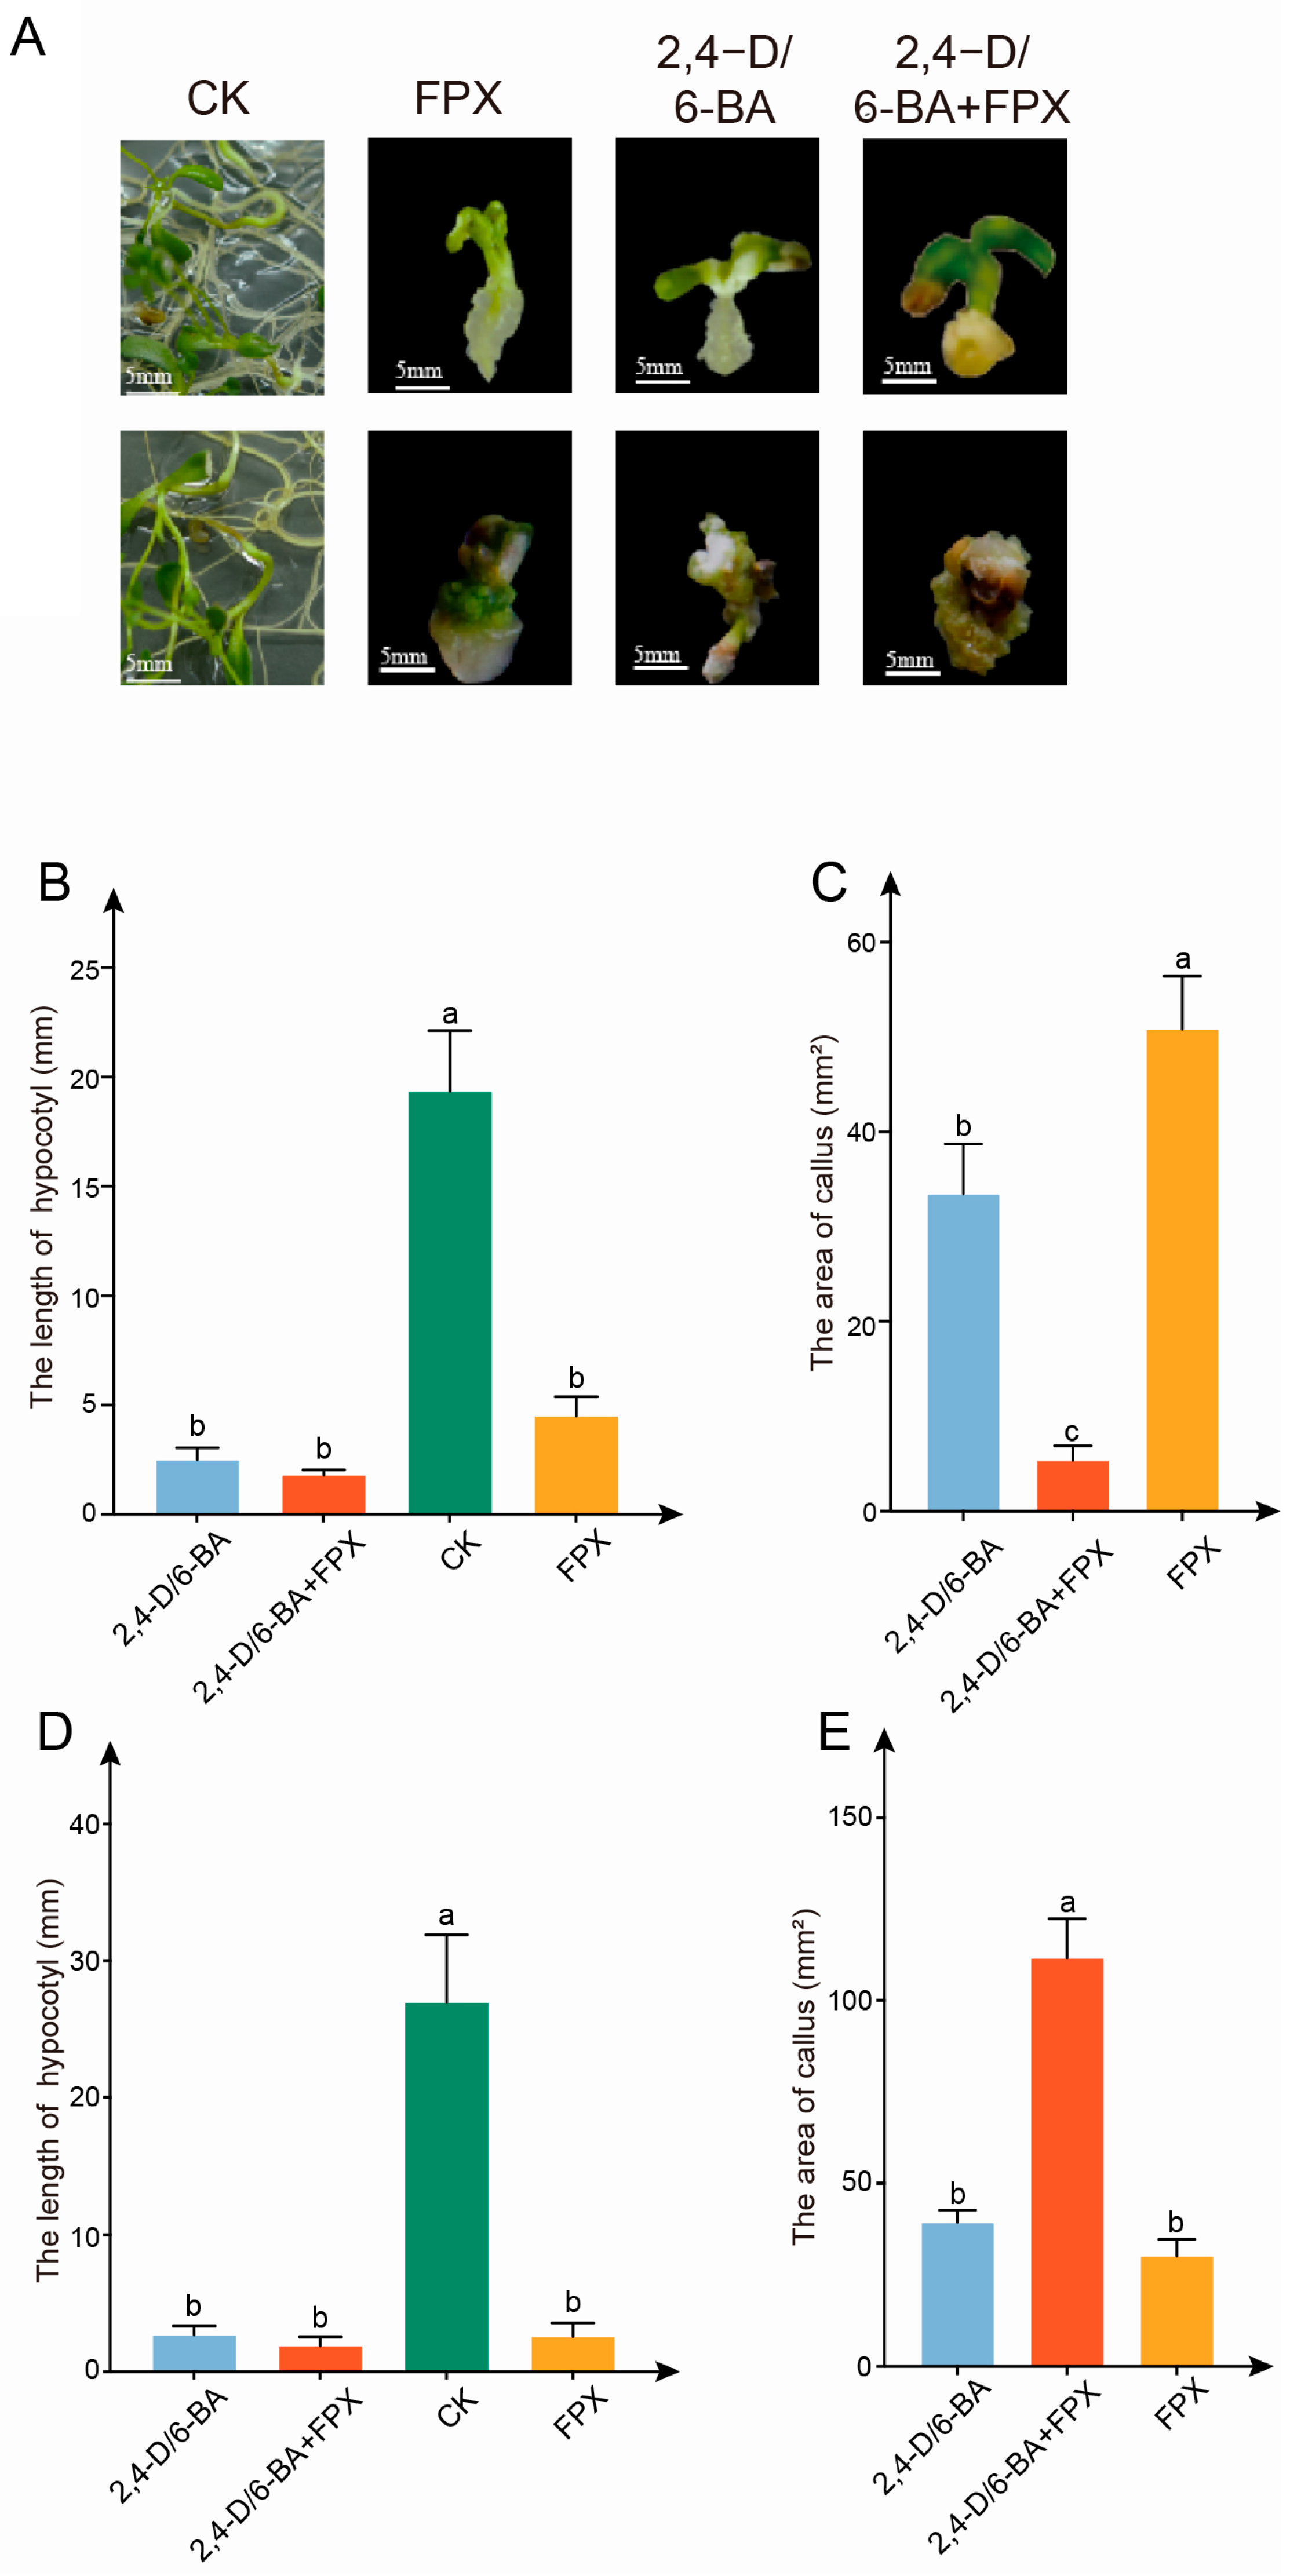
3.2. The Effect of FPX-Auxin/Cytokinin Combined Treatment Is Better than Single Growth Regulator Treatment

We next investigated the effects of combining FPX with 2,4-D/6-BA on callus induction in M. sativa. As 4030 showed a better response to FPX, we selected it for further studies. Sterilized ‘4030’ M. sativa seeds were sown on MS medium supplemented with different PGRs. The experimental treatments included 30 μM FPX, 2,4-D/6-BA, and a combination of 30 μM FPX with 2,4-D/6-BA. MS medium without growth regulator served as a blank control (Figure 4A).
After two weeks, the combined FPX and auxin/cytokinin treatment exhibited the most significant inhibition on hypocotyl elongation (Figure 4B). The largest callus was observed with 30 μM FPX alone, while the smallest callus area occurred under the 2,4-D/6-BA treatment (Figure 4C). After four weeks, the combined FPX and auxin/cytokinin treatment had the most pronounced inhibitory effect on hypocotyl elongation (Figure 4D). Notably, the largest callus was produced under the combined FPX-2,4-D/6-BA treatment, whereas the smallest was observed with 30 μM FPX alone (Figure 4E). Together, these results suggest that combining 30 μM FPX with 2,4-D/6-BA enhances callus formation more effectively than using FPX alone.

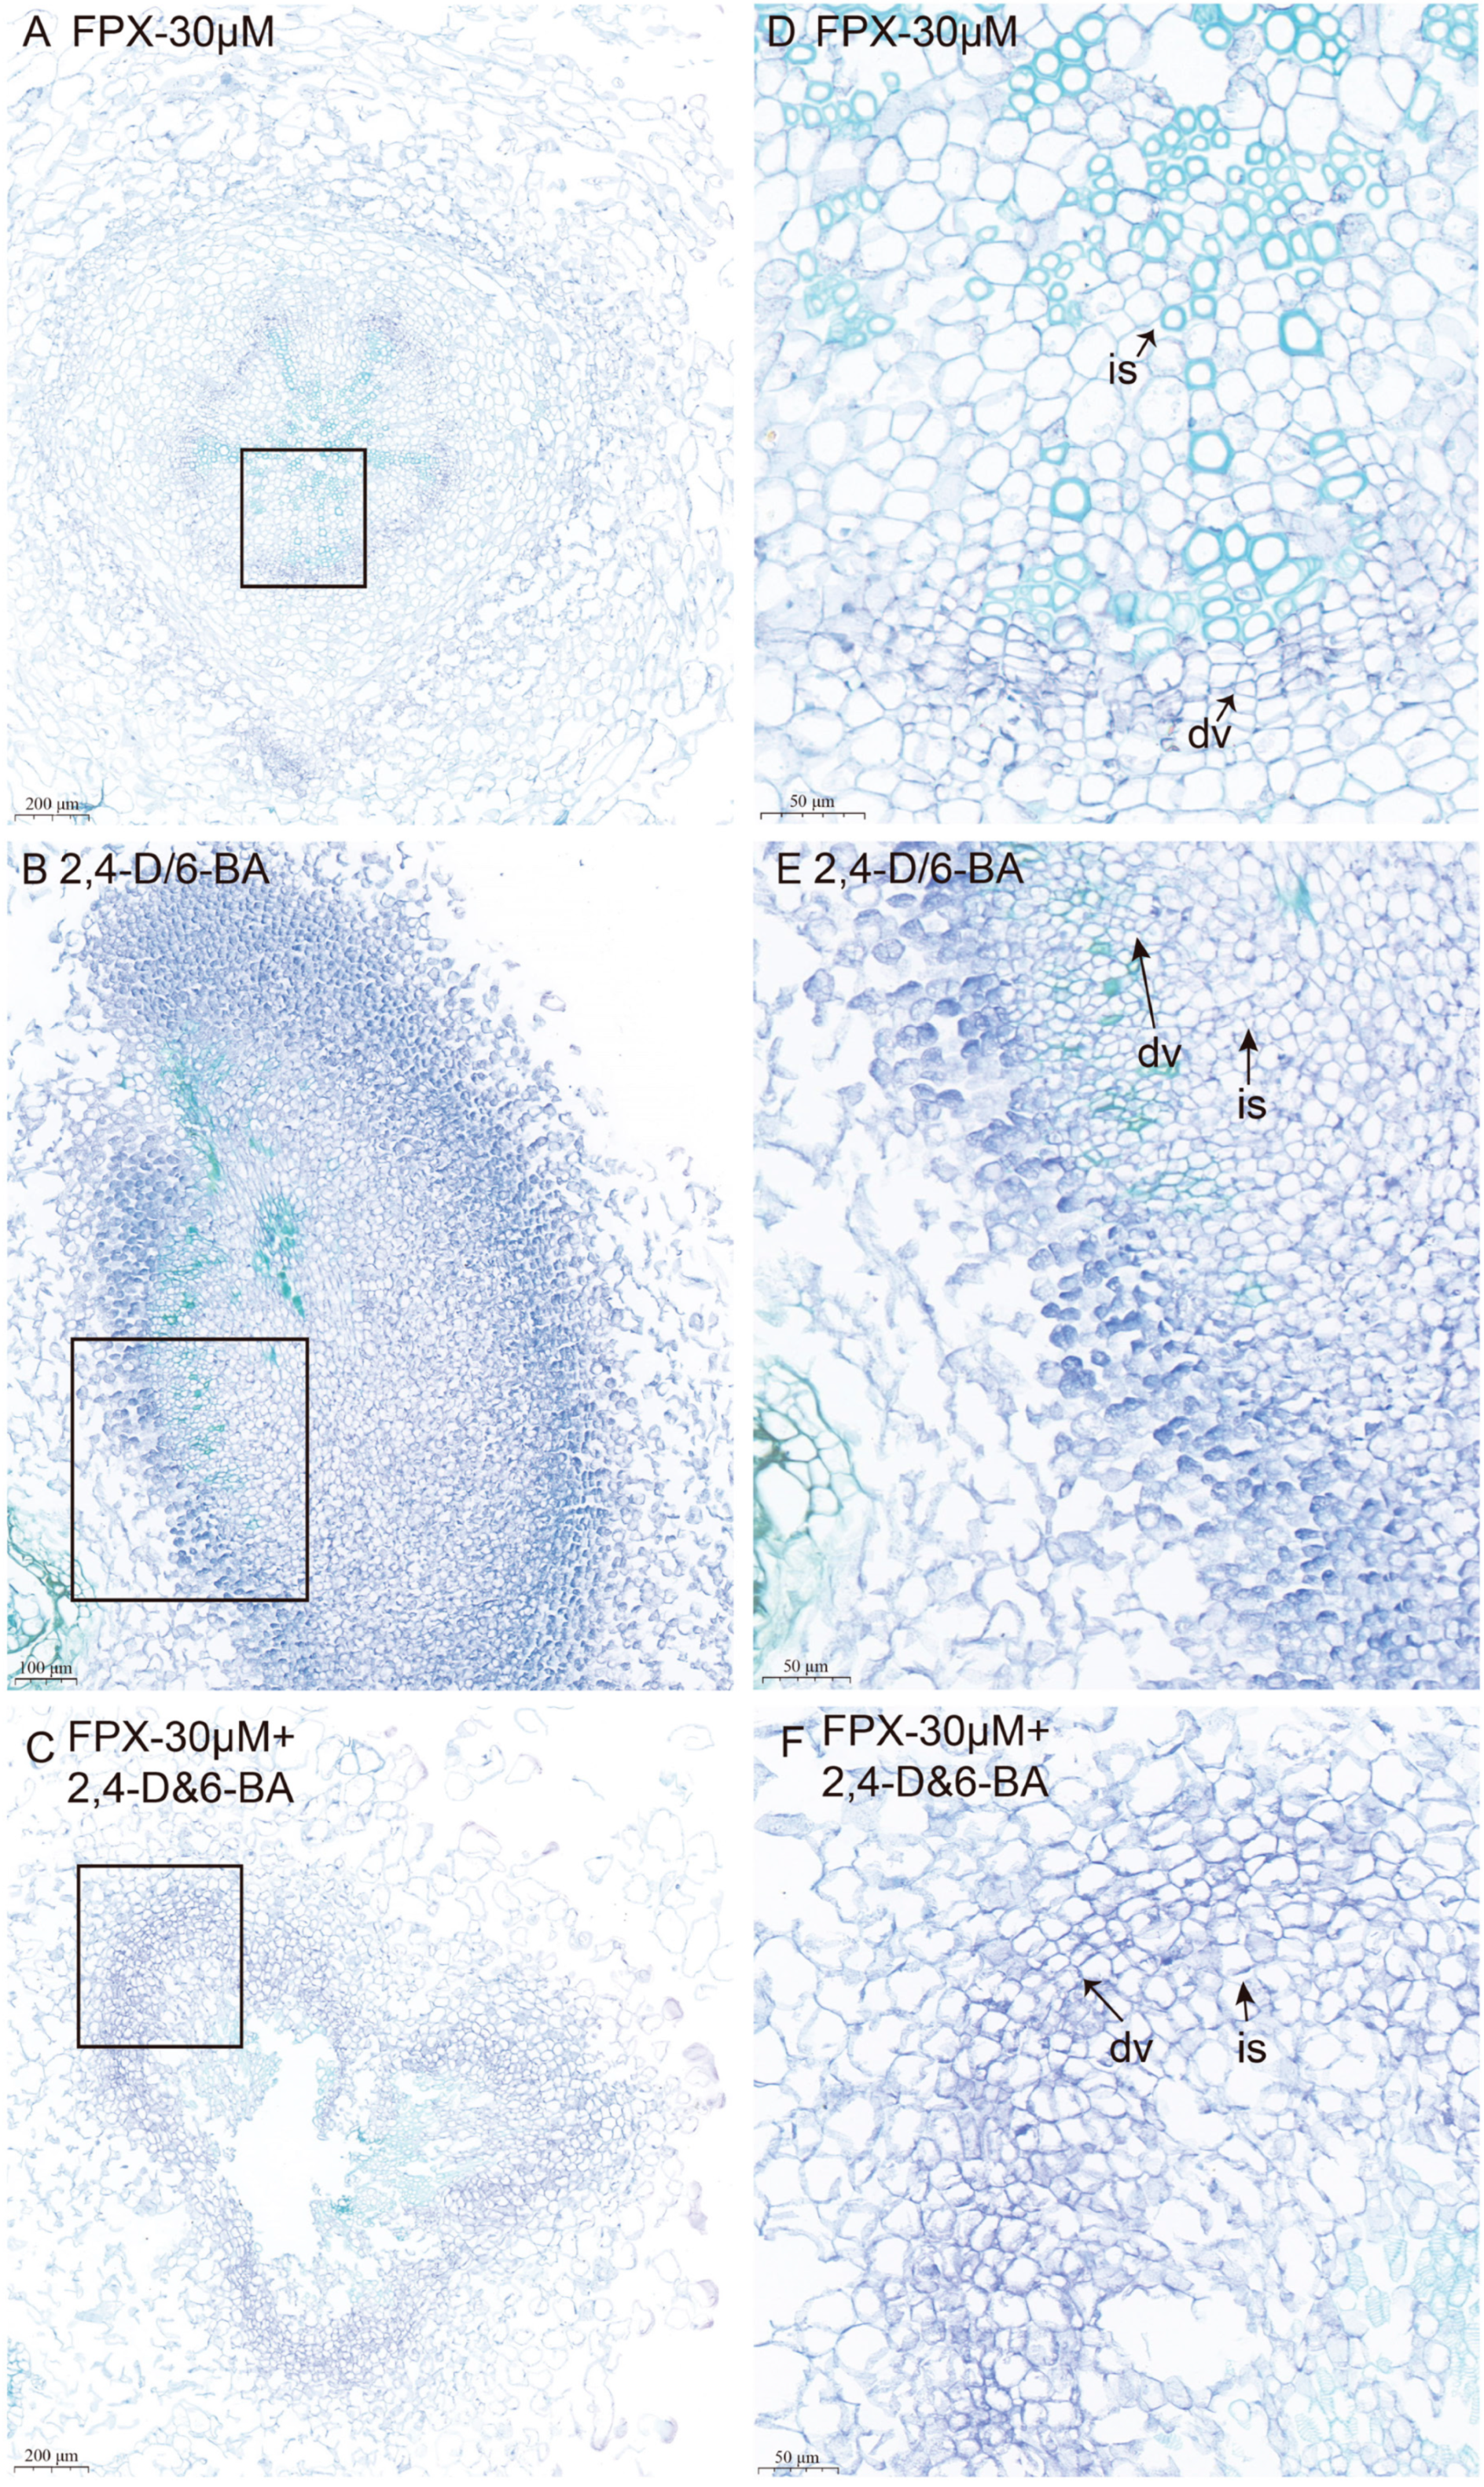
3.3. The Cellular Organization of Callus of Seeds or Hypocotyl Differs Between FPX and Auxin/Cytokinin Treatments

In order to analyze the cellular organization characteristics of callus induced by FPX and auxin/cytokinin separately and in combination in detail, we selected three experimental treatments: 30 μM FPX, 2,4-D/6-BA, and 30 μM FPX combined with 2,4-D/6-BA. Calli induced by these treatments were cross-sectioned and observed under light microscopy. Our results show that after four weeks, calli induced with FPX combined with 2,4-D/6-BA had more actively divided regions than FPX alone or 2,4-D/6-BA; however, it also showed much larger intercellular spaces than the other two treatments (Figure 5). Interestingly, there were more conducting tissues in the 2,4-D/6-BA-treated calli than those treated with FPX, but nearly invisible in those treated with FPX combined with 2,4-D/6-BA. These observations suggest that the cellular organization of FPX-induced calli differs from that of auxin/cytokinin-induced calli.

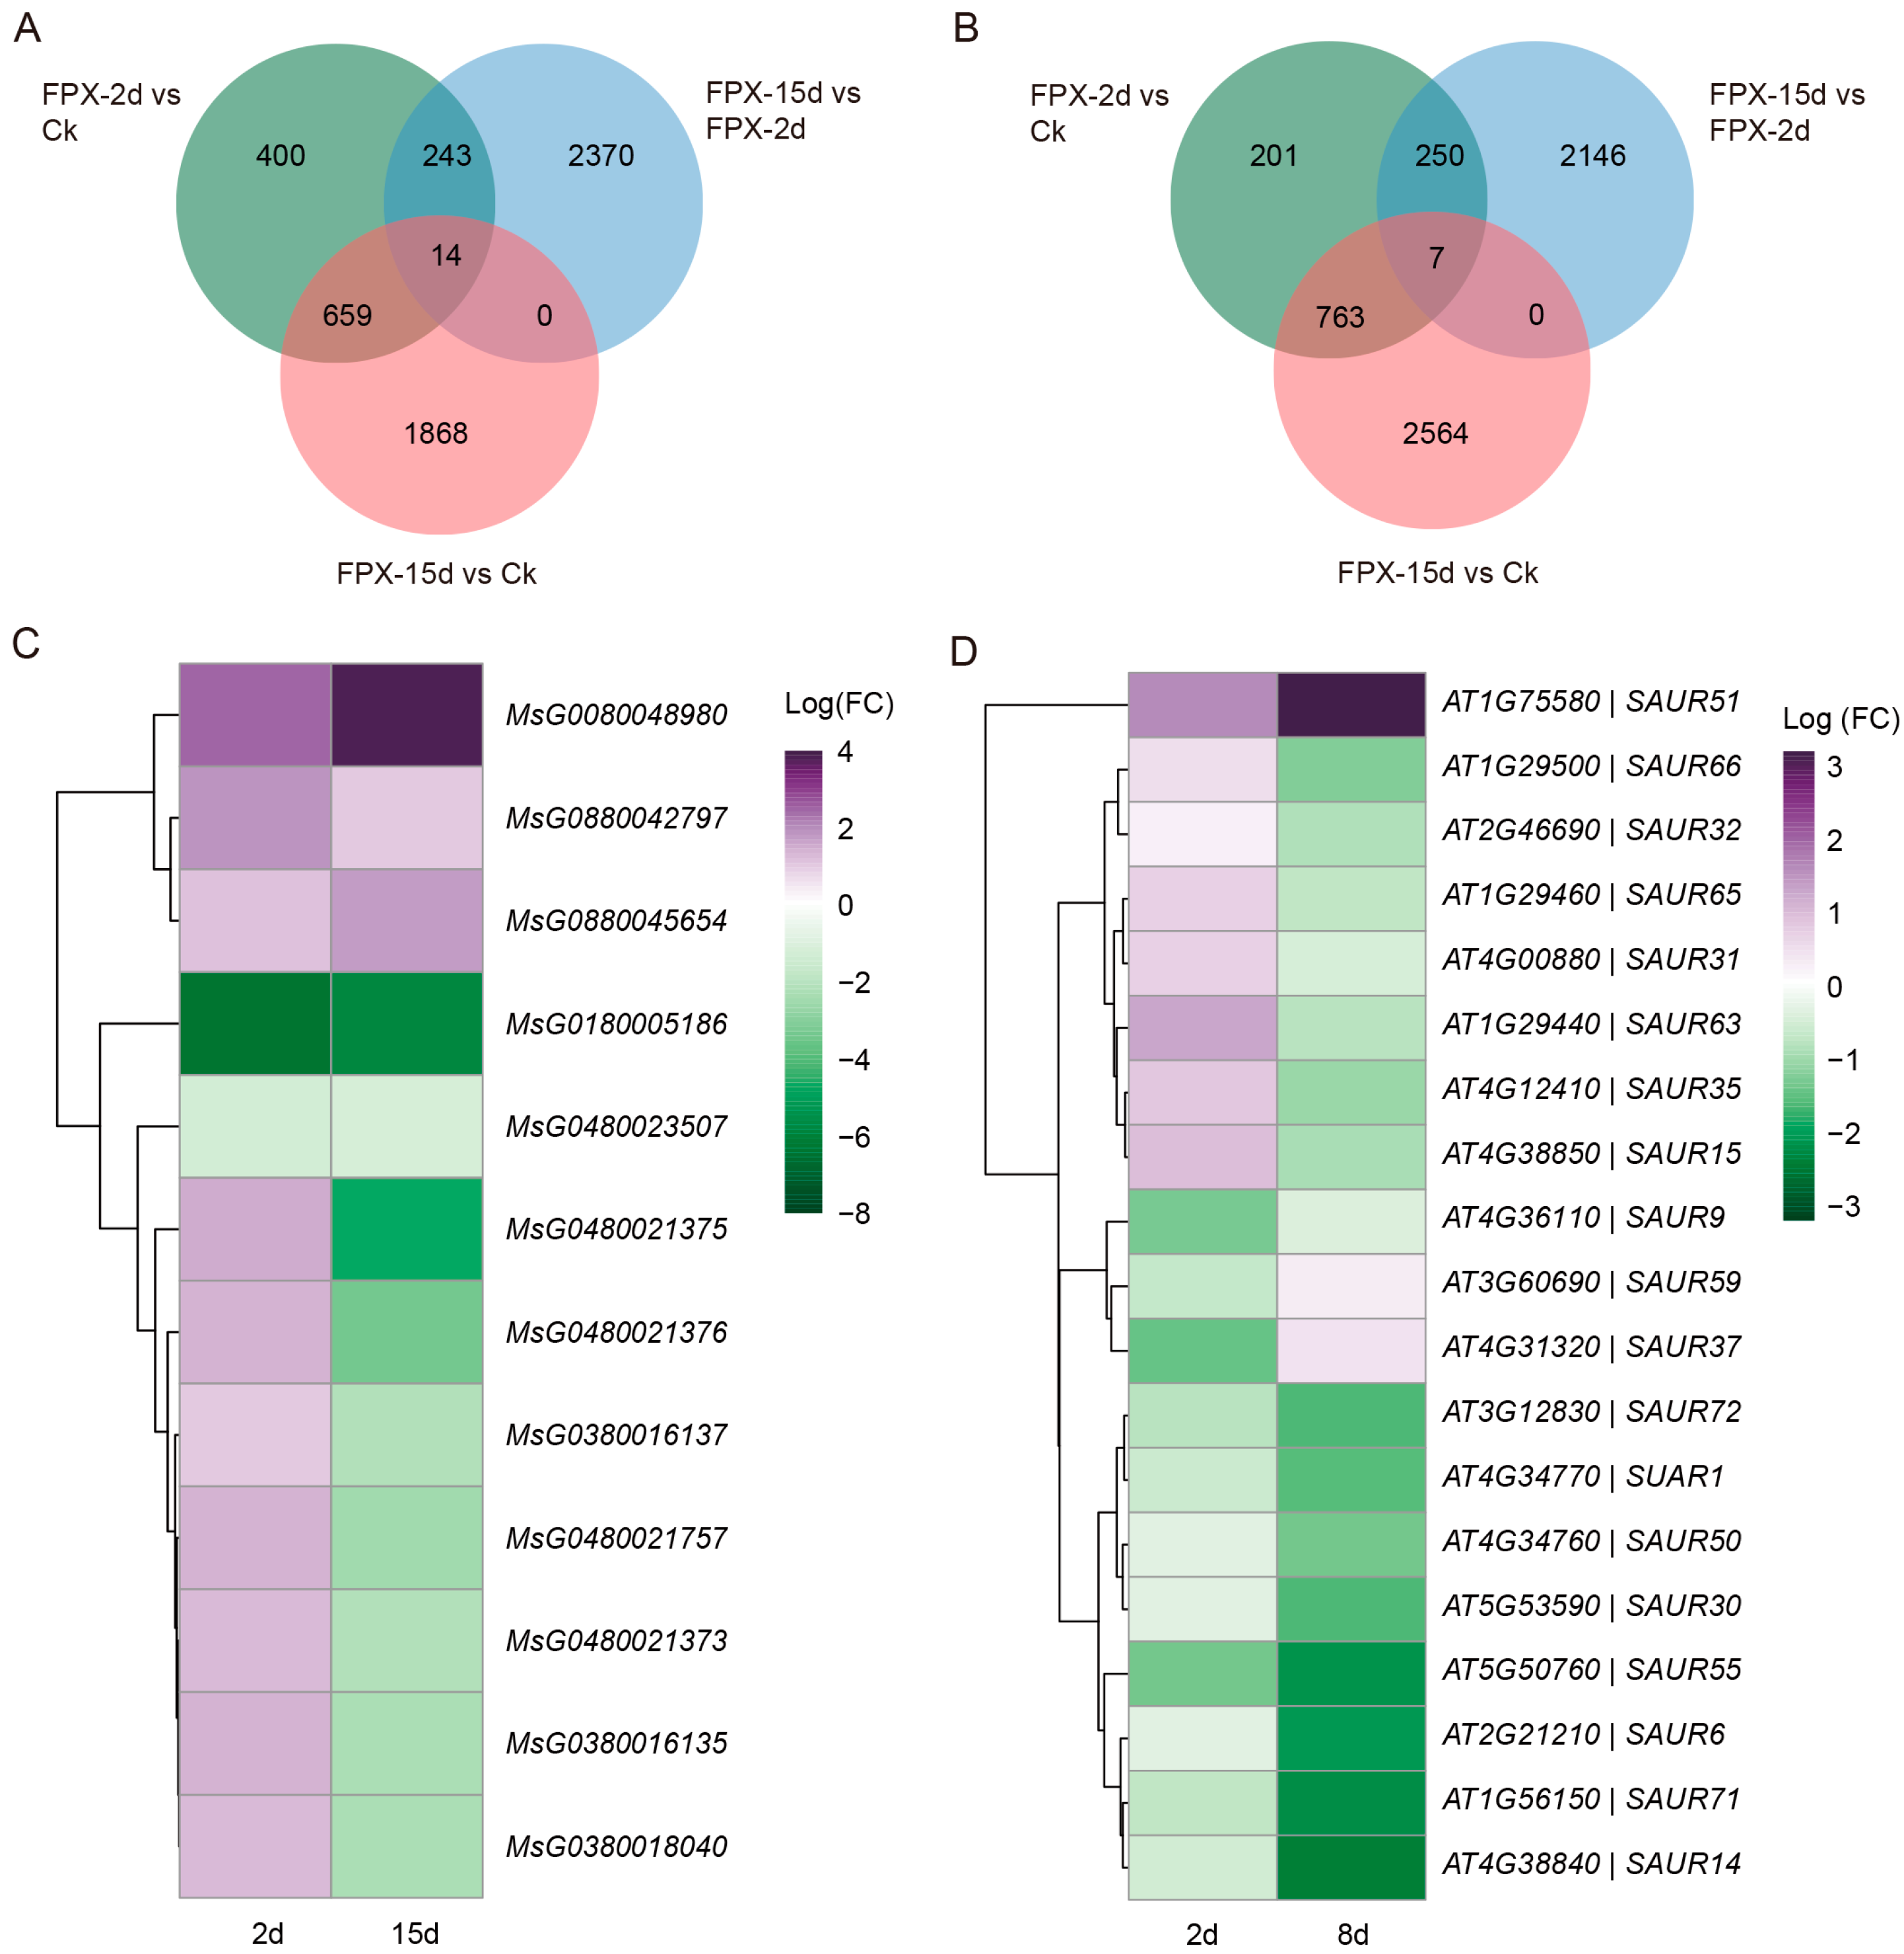
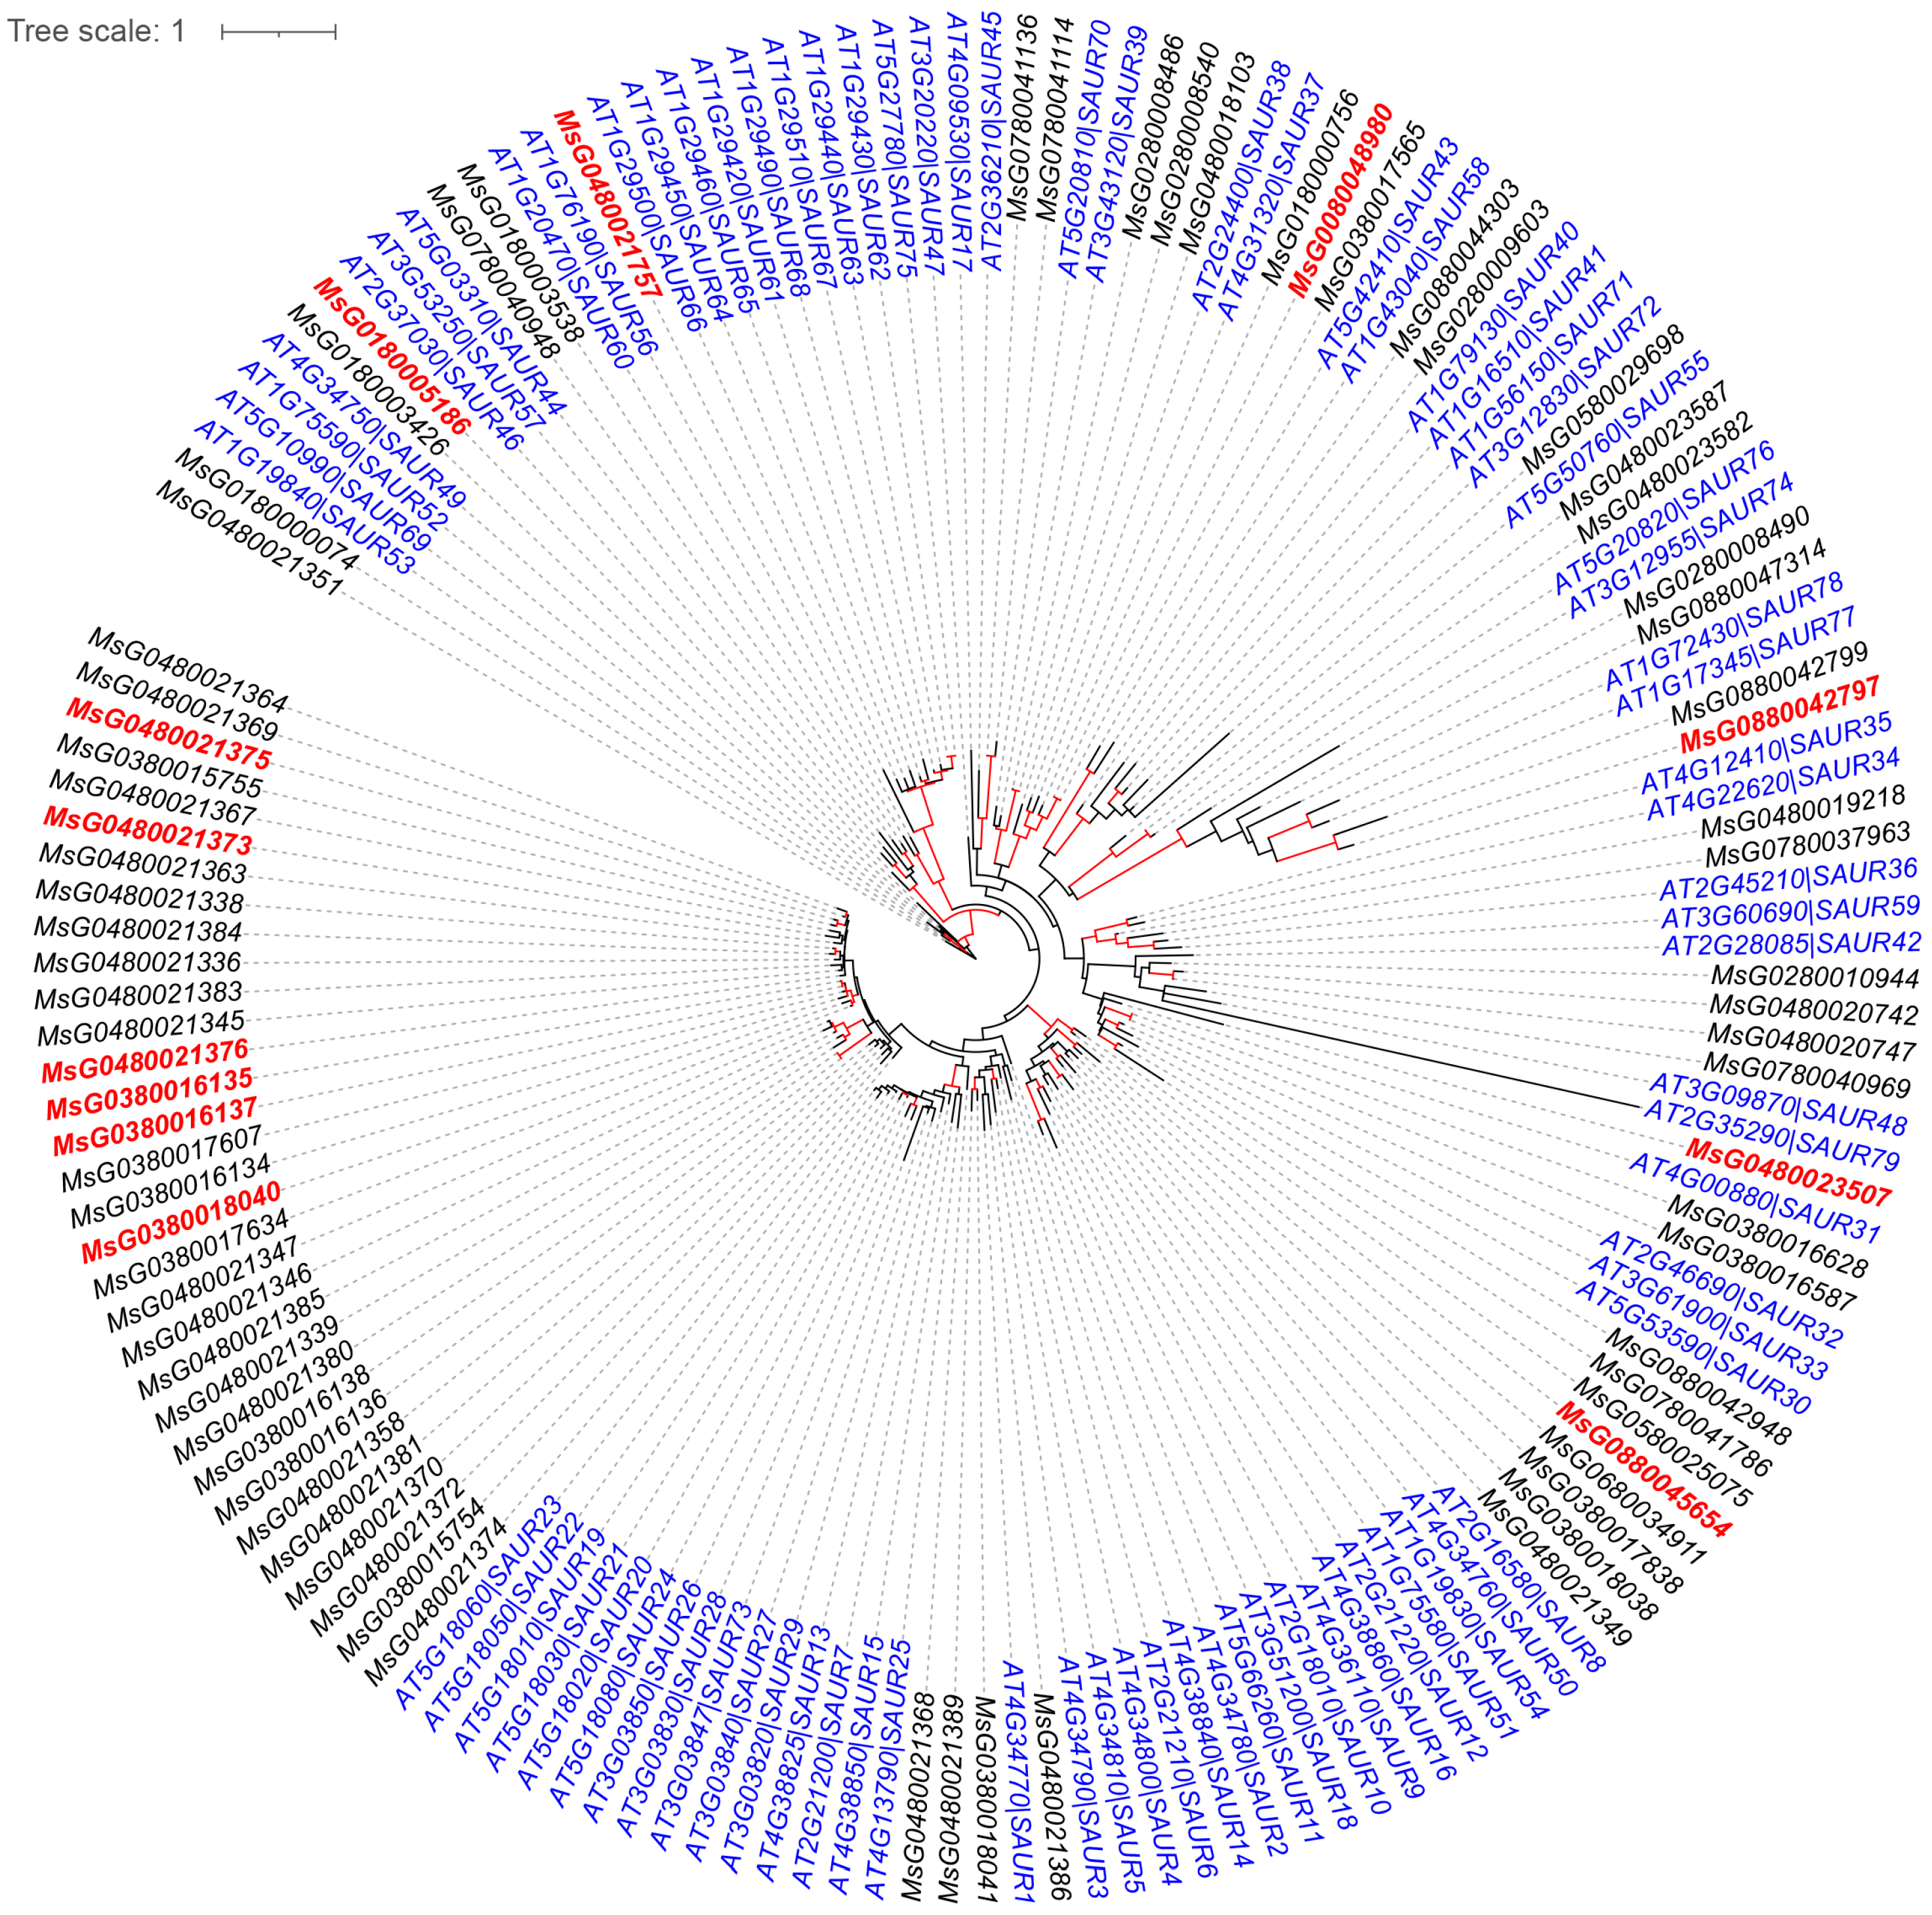
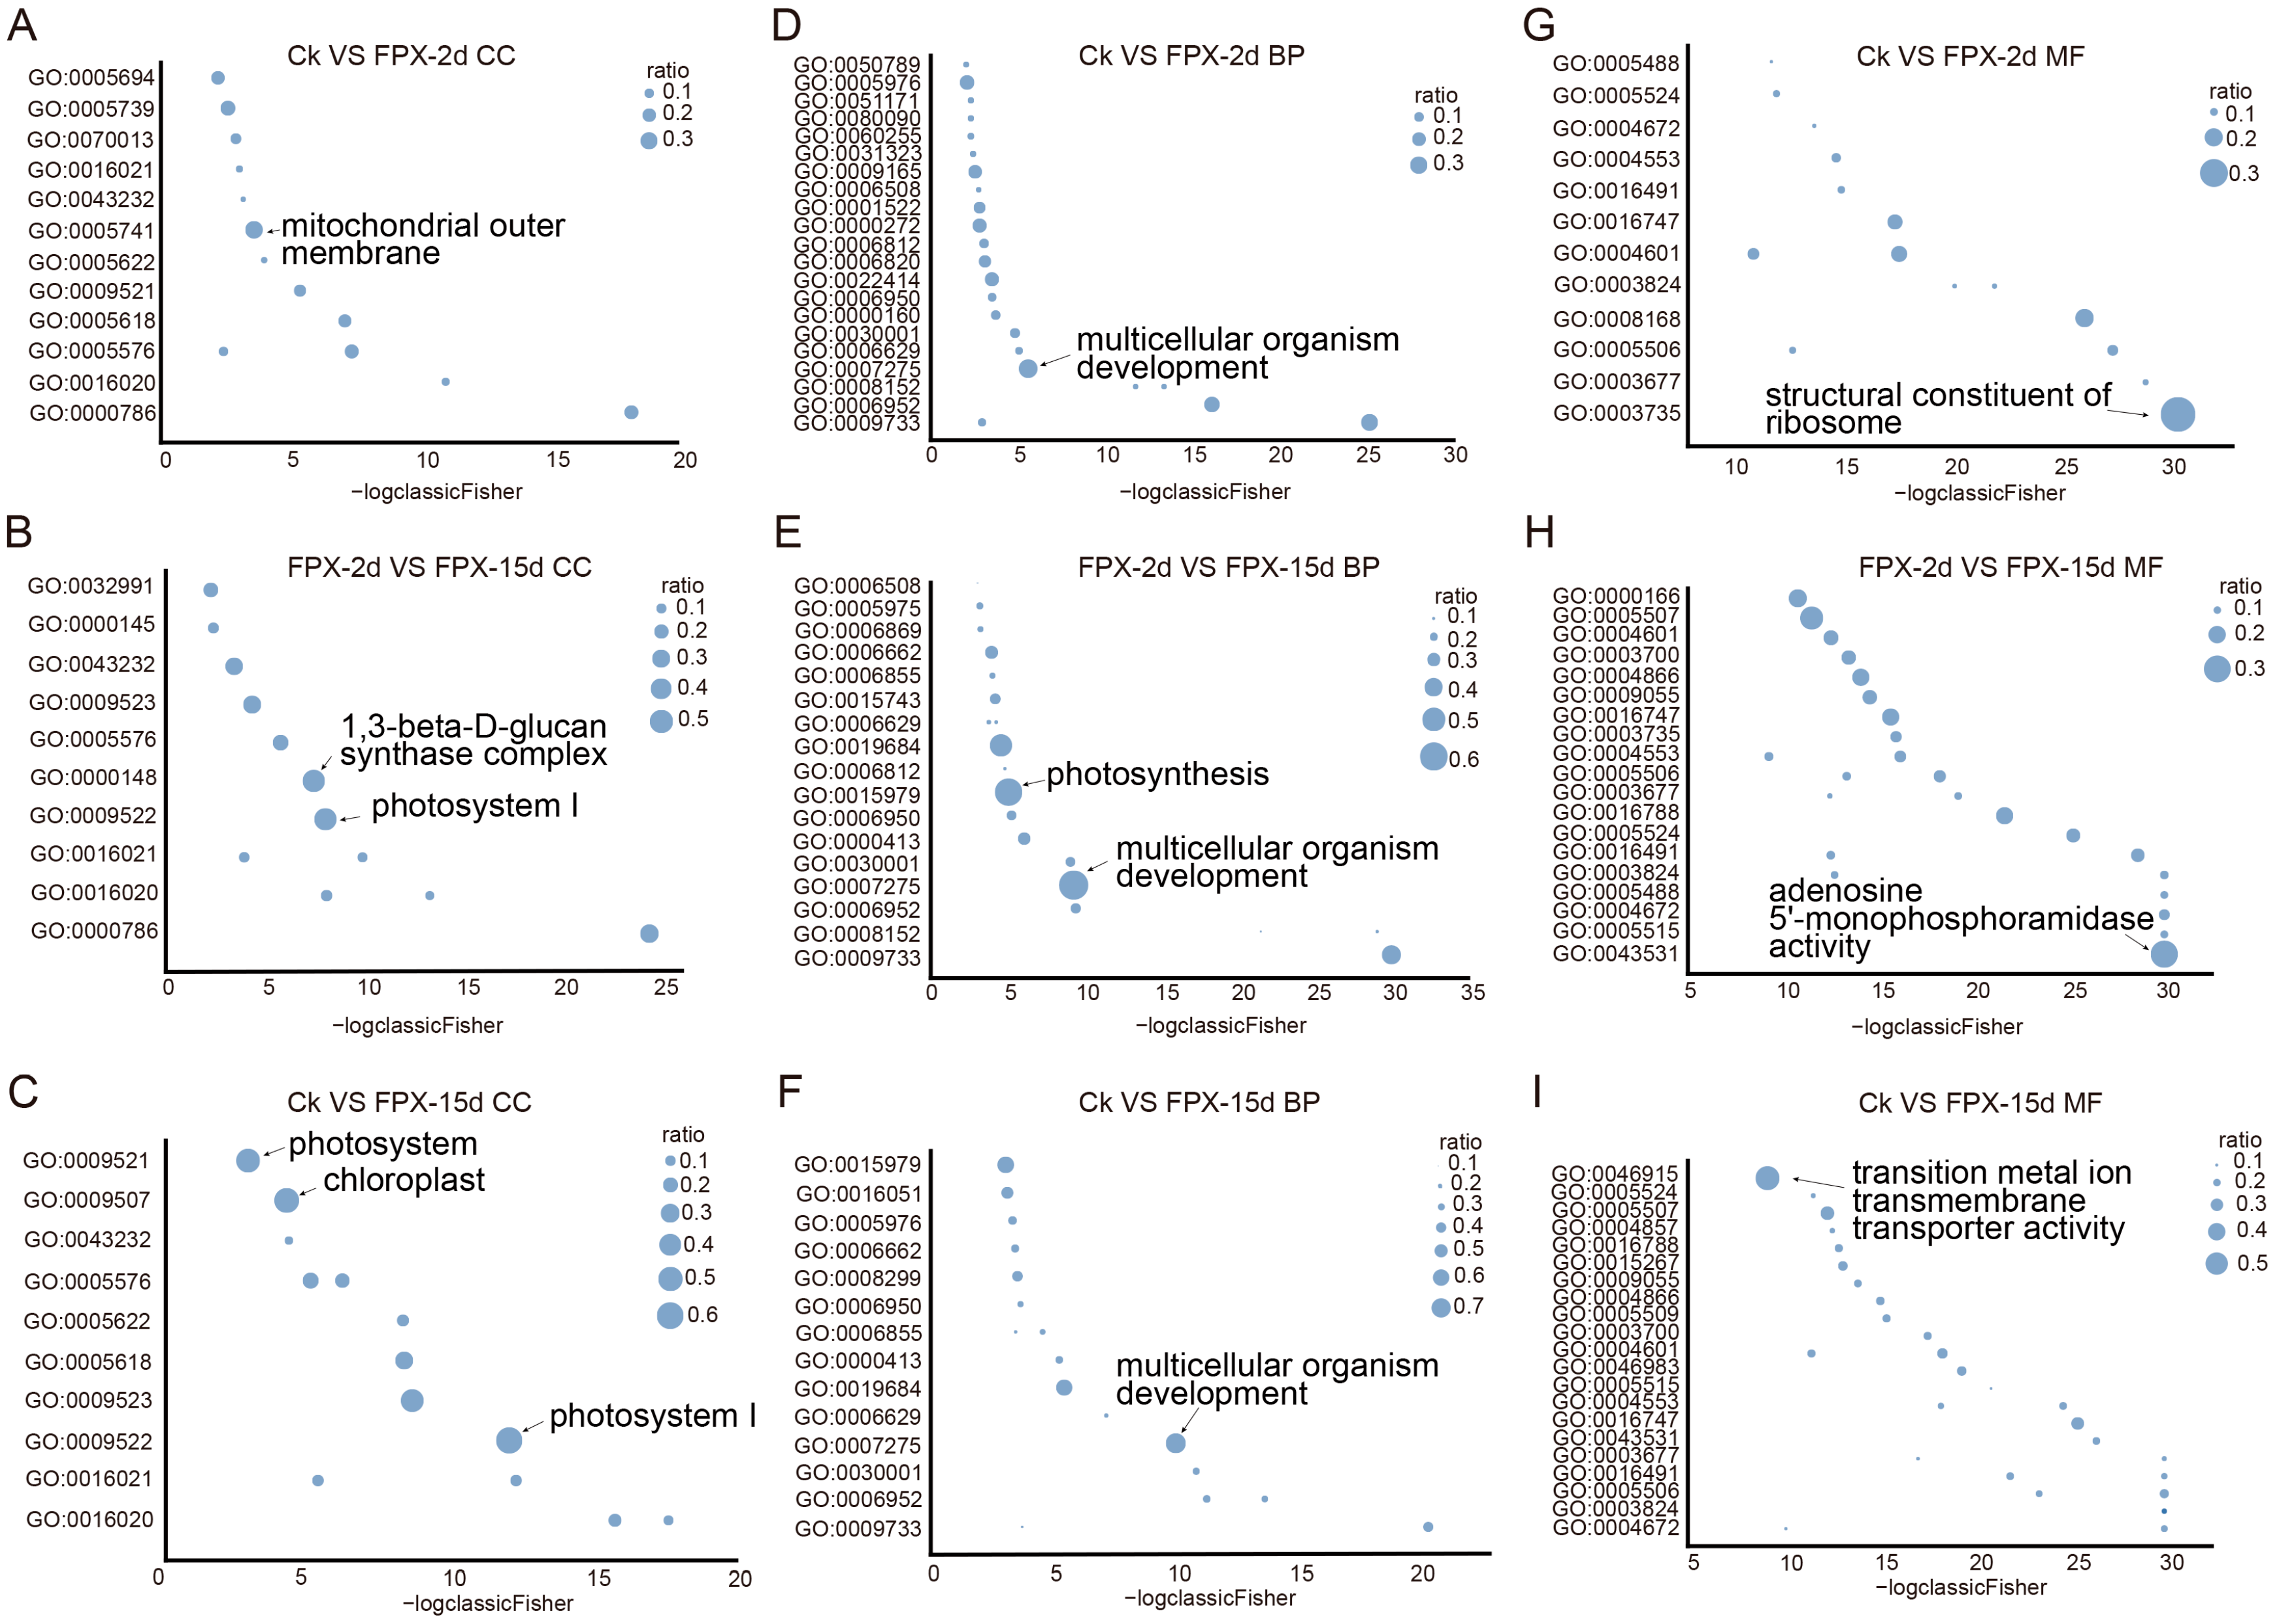
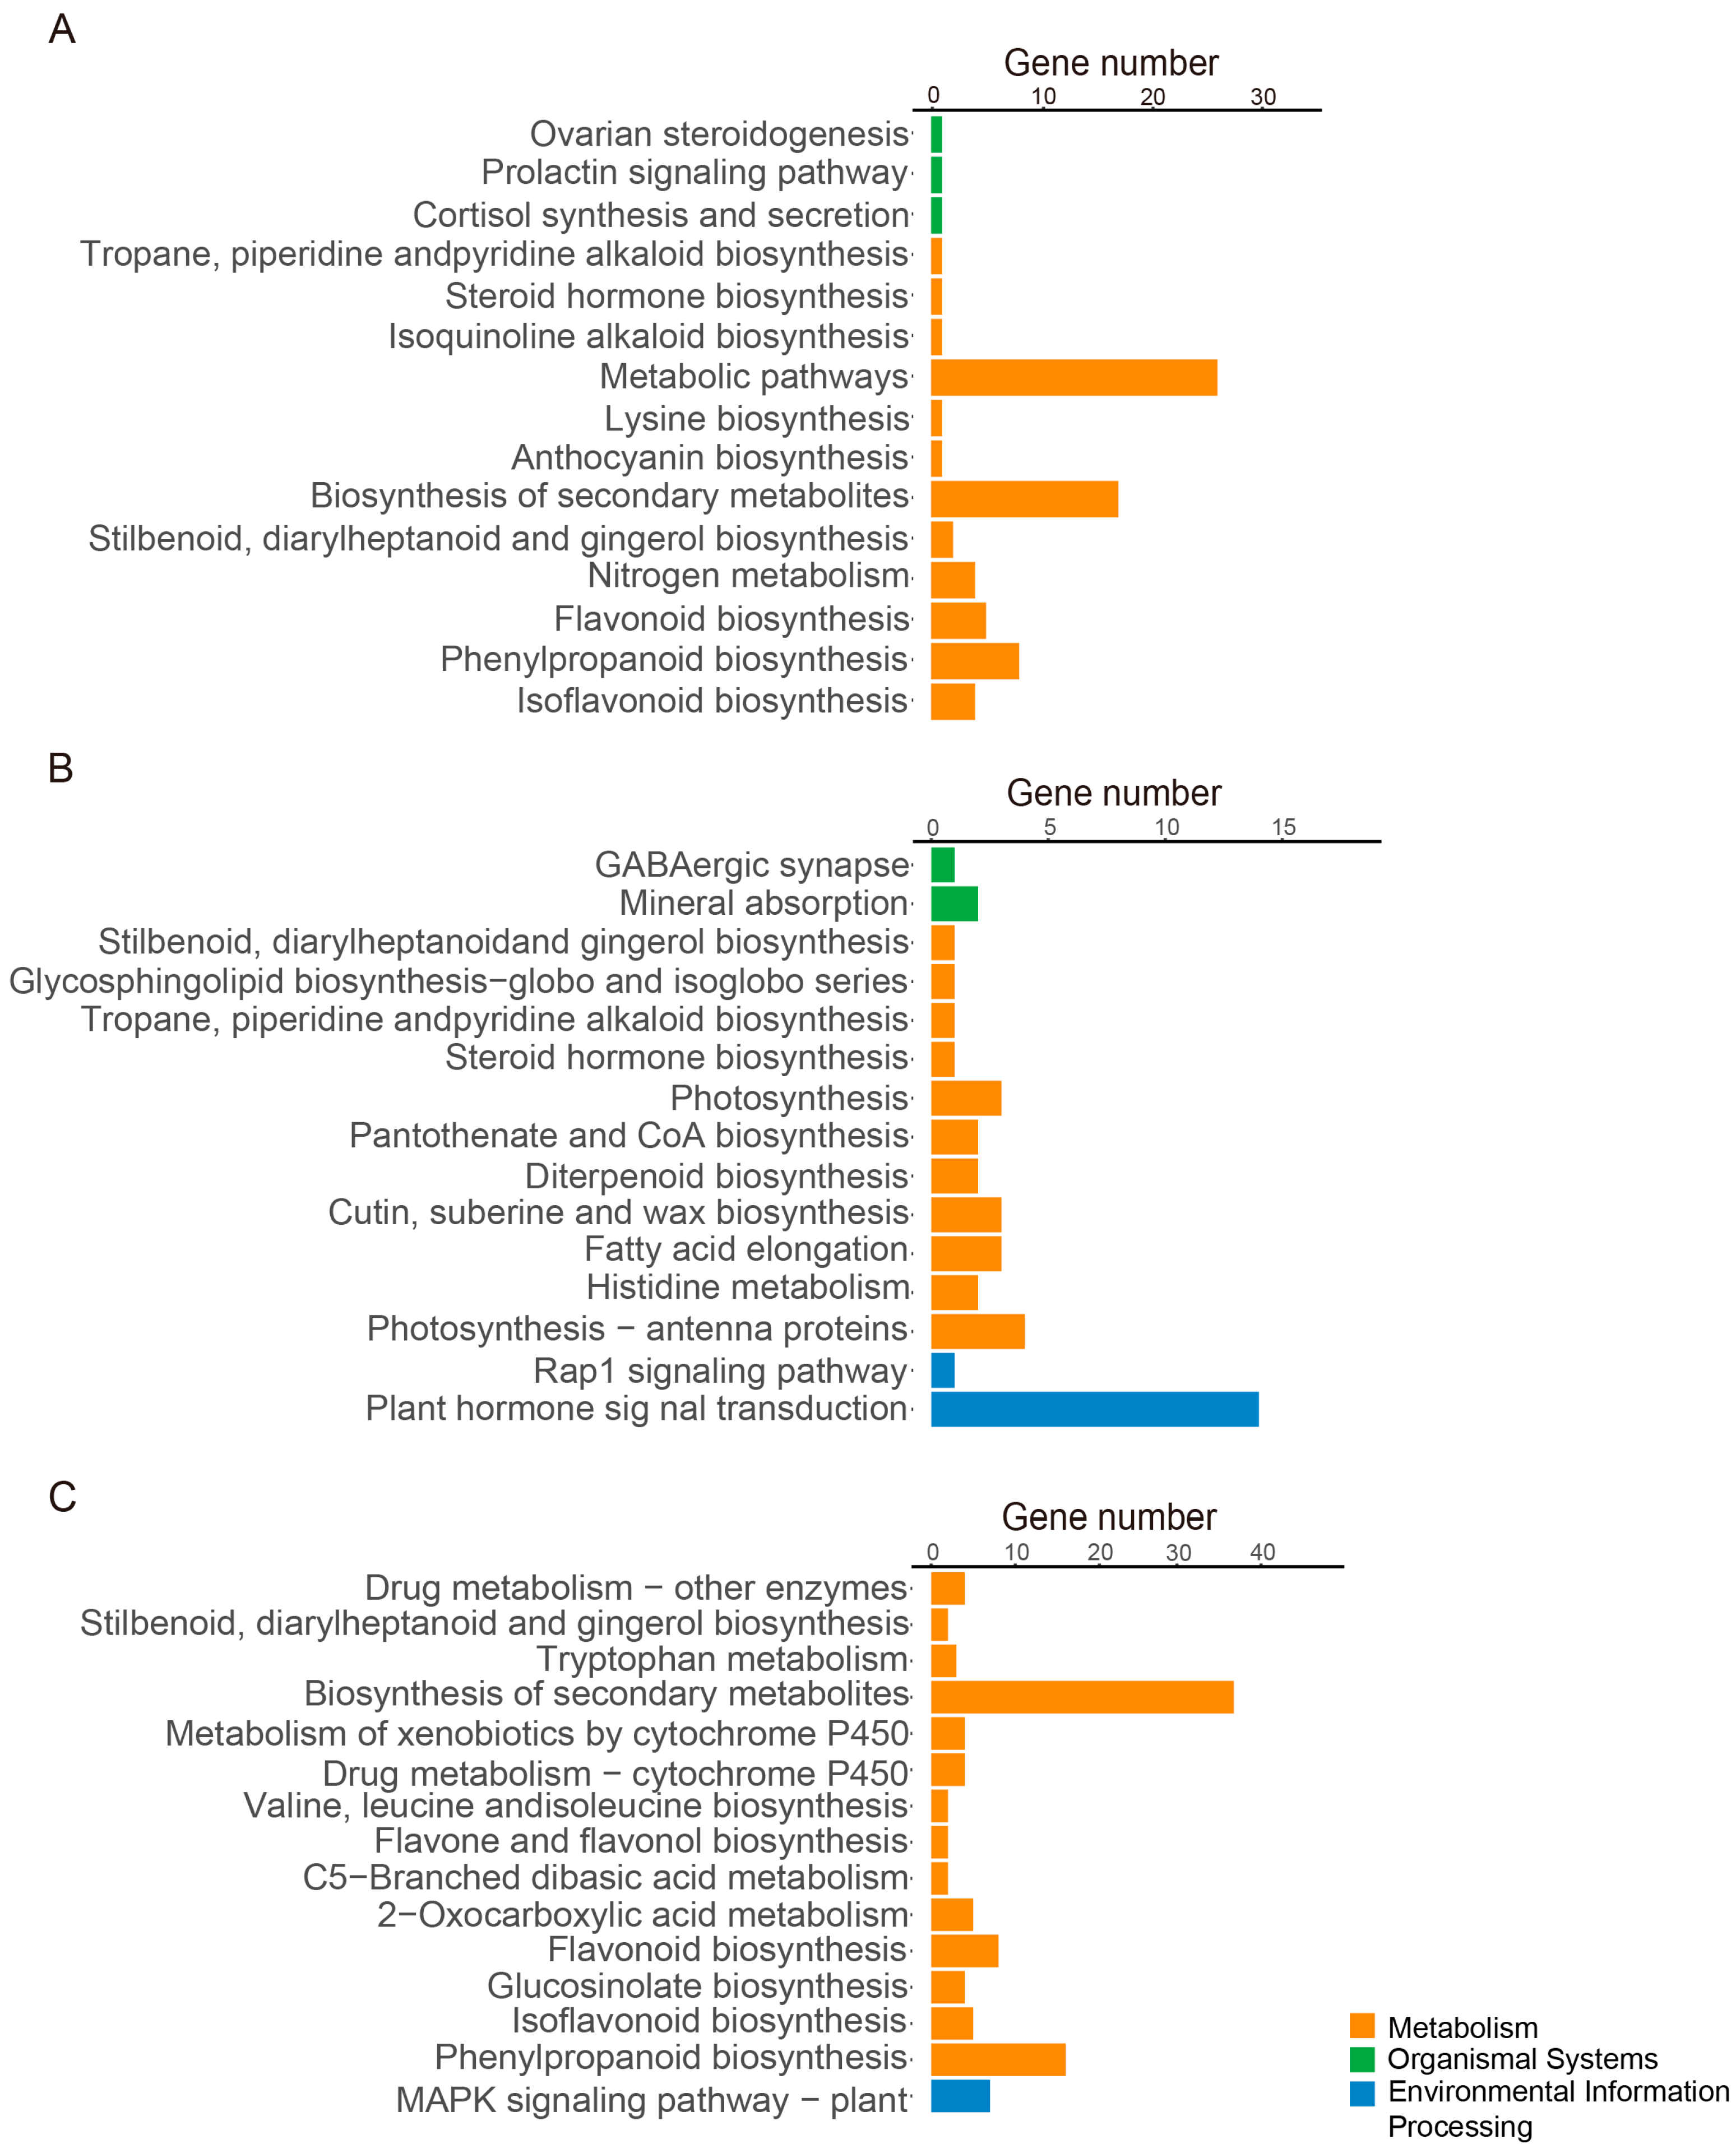
3.4. FPX Regulates Auxin-Related Genes and Plant Metabolism Pathways

Compared to the no-FPX treatment, 1316 genes were significantly upregulated, and 1221 genes were significantly downregulated after two days of FPX treatment. Between days 2 and 15, 2627 genes were upregulated, and 2403 were downregulated. Comparing day 15 to the no-FPX treatment, 2541 genes were upregulated, while 3334 were downregulated. Only 14 genes were consistently upregulated, and 7 genes were consistently downregulated across all three comparisons (Figure 6A,B).
To test the hypothesis that FPX may regulate auxin-related genes, we identified genes associated with the auxin response ontology (GO:0009733) and analyzed their expression dynamics during FPX treatment. Our analysis revealed that twelve auxin-responsive genes showed significant expression changes at days 2 or 15 (Figure 6C). Interestingly, they all belong to the Small Auxin Upregulated RNA (SAUR) gene family [34], which contains 77 members in the M. sativa genome. Among them, three SAUR genes were upregulated at both days 2 and 15, while another three were consistently downregulated. The remaining seven were upregulated at day 2 but downregulated by day 15 (Figure 6C). Phylogenetic analysis revealed that M. sativa contains 45 SAUR genes closely related to Arabidopsis, clustering within the same clade. Seven significantly differentially expressed SAUR genes from M. sativa clustered with Arabidopsis and were distributed across distinct clades (Figure 7). Additionally, 32 SAUR genes in M. sativa did not cluster with Arabidopsis genes, 6 of which exhibited significant differential expression (Figure 7). These findings suggest that FPX may promote callus formation by activating auxin-related genes.
Compared to previous studies on Arabidopsis, two SAUR genes in M. sativa exhibited similar expression patterns (Figure 6C,D). Specifically, MsG0480021757, AT1G29440, and AT1G29500 belonged to the same clade (Figure 7), showing upregulation on day two, followed by downregulation at later time points (Figure 6C,D). In contrast, MsG0380018041, AT2G21210, AT4G38840, and AT4G38850 also clustered in the same clade (Figure 7), but exhibited distinct expression trends: MsG0380018041, AT2G21210, and AT4G38840 were consistently downregulated on day two and beyond, whereas AT4G38850 was upregulated on day two before becoming downregulated later (Figure 6D). These findings suggest that part of these SAUR genes likely share conserved functions and exhibited similar responses when induced by FPX.
To investigate the functional implications of FPX-activated gene expression, we conducted GO enrichment analysis. For the cellular component (CC) category, the enrichment of genes associated with the mitochondrial outer membrane (GO:0005741) was higher on day two after FPX (30 μM) treatment compared to the untreated control (no-FPX) (Figure 8A). Genes related to the 1,3-β-D-glucan synthase complex (GO:0000148) and photosystem I (GO:0009522) showed higher enrichment on day 15 compared to day 2 after FPX treatment (Figure 8B). Genes associated with the photosynthesis system (GO:0009521), chloroplast (GO:0009507), and photosystem I (GO:0009522) displayed greater enrichment on day 15 after FPX treatment compared to the untreated control (no-FPX) (Figure 8C). For the biological process (BP) category, genes related to multicellular organism development (GO:0007275) exhibited higher enrichment following FPX treatment compared to the untreated control on day 2 (Figure 8D). The enrichment of genes associated with photosynthesis (GO:0015979) and multicellular organism development (GO:0007275) was higher on day 15 compared to day 2 after FPX treatment (Figure 8E). Genes involved in multicellular organism development (GO:0007275) also showed greater enrichment when comparing the FPX treatment on day 15 to the untreated control (Figure 8F). For the molecular function (MF) category, genes related to the structural constituent of ribosomes (GO:003735) exhibited higher enrichment on day 2 with FPX treatment compared to the untreated control (Figure 8G). Genes associated with adenosine 5′-monophosphoramidase activity (GO:0043530) showed higher enrichment on day 15 compared to day 2 after FPX treatment (Figure 8H). The enrichment of genes involved in transition metal ion transmembrane transporter activity (GO:0046915) was higher on day 15 with FPX treatment compared to the untreated control (no-FPX) (Figure 8I).
To investigate the metabolic pathways activated by FPX, we performed KEGG enrichment analysis. At day 2, FPX activated several metabolic pathways compared to the untreated control (no-FPX) (Figure 9A). At day 15, FPX activated plant hormone signal transduction pathways compared to day 2 (Figure 9B). Additionally, compared to the untreated control (no-FPX), FPX treatment at day 15 also activated secondary metabolite biosynthesis pathways (Figure 9C).
To validate the RNA-seq data, we selected nine genes (Table S2) and analyzed their expressions using quantitative real-time PCR. Under the FPX (30 μM) treatment, all genes except MsG0680032113 showed increased expression at day 2, while at day 15, all genes except MsG0580026147 exhibited decreased expression, with levels consistently higher at day 2 than at day 15, aligning with transcriptome trends (Figure 10). Under 2,4-D/6-BA treatment, most genes displayed reduced expression at day 2, except MsG0580026147 and MsG0580024778, and at day 15, all genes except MsG0880046107 and MsG0580024778 showed decreased expression. Notably, MsG0080048980, MsG0880046107, MsG0880043195, and MsG0580024778 exhibited higher expression at day 15 than day 2, while others declined. Under combined FPX (30 μM) + 2,4-D/6-BA treatment, most genes showed reduced expression at both day 2 and day 15 compared to the control, except MsG0580026147 and MsG0580024778. At day 15, MsG0280008661, MsG0080048980, MsG0080048620, and MsG0880046107 exhibited decreased expression compared to day 2, while the remaining genes showed increased expression (Figure 10).

4. Discussion

Auxin and cytokinin are widely used for callus induction but are still ineffective in some recalcitrant plants or genotypes [9]. FPX, originally developed to treat mammalian memory loss, was identified for its ability to inhibit hypocotyl elongation in Arabidopsis. This inhibition may occur through ethylene, which is known to be induced by excessive auxin—a hormone mimicked by FPX. Moreover, FPX has been shown to induce callus formation across various species. In Arabidopsis, FPX induces callus formation at 15 μM from root explants and 45 μM from rosette leaf explants. It is also effective in other plants: 45 μM FPX promotes callus formation in rice after 30 days, while in poplar, 30–45 μM FPX is more effective than 0.4 μM naphthaleneacetic acid (NAA). B. distachyon shows callus induction at 45–100 μM in mature seeds and 75 μM in immature seeds, and cucumber requires 15–105 μM for induction within 35 days [11]. However, much lower concentrations, such as 1 μM FPX, are sufficient in hoary stock (M. incana) [12]. In our study, 10–50 μM FPX can induce rapid callus formation in M. sativa from the germinating seed, with 30 μM being optimal. This variation in FPX concentration may be due to differences in signal perception. As a mimic of auxin, FPX could potentially be recognized by the auxin receptor TIR1. Since TIR1 is known to vary among plant species, its binding affinity for FPX may differ, leading to species-specific responses. Additionally, FPX may function differently across various tissues or developmental stages. In addition, our results are consistent with previous findings that FPX typically induces callus formation more rapidly than auxin and cytokinin, with optimal concentrations varying across plant species. For instance, after 50 days of treatment in Ararbidopsis, the calli induced by FPX were significantly larger than those induced by IAA/2,4-D/kinetin [11].
The cellular organization of callus induced by FPX, auxin/cytokinin, and their combination exhibited distinct patterns in M. sativa. FPX-induced calli showed a faster tendency to differentiate into vascular tissue, whereas auxin/cytokinin-induced calli displayed active cell division with limited differentiation. In contrast, in Arabidopsis, auxin/cytokinin-induced calli differentiated into vascular tissue more rapidly, while FPX-induced calli had a simpler structure [11]. These findings highlight species-specific differences in the structure of FPX-induced calli. Since different species, such as Arabidopsis and M. sativa, may have distinct sets of SAUR family genes and regulate them differently, they can influence cell division and expansion in various ways. This variability likely explains the species-specific differences observed in callus structure.
The transcriptome offers valuable insights into the mechanisms underlying FPX-induced callus formation in M. sativa. To date, aside from our study, FPX has been used to induce calli in more than five plant species. However, only one similar study, utilizing microarray analysis, has investigated this mechanism in Arabidopsis [11]. Surprisingly, twelve SAUR genes—approximately 16% of the SAUR gene family—are significantly regulated by FPX in M. sativa. Similarly, in Arabidopsis, FPX regulates 19 SAUR genes, representing about 24% of its SAUR gene family. In Arabidopsis, SAUR proteins have been demonstrated to inhibit PP2C.D phosphatases, which in turn activates plasma membrane (PM) H+-ATPases and promotes cell expansion [35]. The overexpression of SAUR76 leads to a reduction in leaf size, mainly caused by a decrease in cell number, suggesting that SAUR76 can negatively regulate cell division to inhibit leaf growth [35,36]. Interestingly, MsG0880042797 and SAUR76 belong to the same clade. In our study, we observed significant changes in the MsG0880042797 expression levels after days 2 and 15 of FPX treatment, suggesting that FPX-induced cell division may be moderated by MsG0880042797. Additionally, several studies showed that SAUR proteins can regulate polar auxin transport. In Arabidopsis, the overexpression of SAUR19, SAUR41, and SAUR63 enhanced indole-3-acetic acid (IAA) transport in hypocotyls [37]. In contrast, the overexpression of OsSAUR39 in rice reduced IAA transport [38], suggesting that different SAUR proteins may function antagonistically. The ability of SAUR proteins to modulate IAA transport may explain their diverse effects on cell expansion, division, and patterning [39]. Notably, MsG0480021757 and SAUR63 are also in the same clade. In our study, the MsG0480021757 expression levels also showed significant changes after 2 and 15 days of FPX treatment, implying that FPX may influence cell expansion, division, and differentiation by regulating MsG0880042797, which is proposed to moderate IAA transport. Based on these findings, we hypothesize that FPX induces callus formation by regulating SAUR gene expression. However, only a subset of the FPX-responsive SAUR genes in M. sativa belong to the same clade as those in Arabidopsis, suggesting that the regulation of SAUR genes by FPX has diverged between these two species. SAUR genes are typically intronless, with open reading frames encoding proteins ranging from 7 kDa to 20 kDa (~60–180 amino acids) [40,41]. Their short length may facilitate their use in transformation efforts for recalcitrant plants through overexpression.

5. Conclusions

FPX rapidly promotes callus formation in M. sativa, the world’s most important forage crop, at micromolar concentrations. Whole-genome transcriptional analysis revealed that FPX enhanced callus formation while significantly regulating the expression of SAUR family genes in M. sativa. Moreover, several SAUR family genes from M. sativa and Arabidopsis belong to the same clade and exhibited significant expression changes in both species upon FPX treatment, suggesting a conserved cross-species callus induction mechanism by FPX. Our findings demonstrate that SAUR genes are responsive to FPX treatment and suggest their potential utility in optimizing plant genetic engineering and tissue culture protocols. Future studies will explore SAUR expression under different FPX concentrations, focusing on the inhibitory effects of high FPX levels, and investigate the role of pH in FPX-mediated induction mechanisms. These efforts will deepen our understanding of SAUR regulation and FPX applications in plant biotechnology.

Supplementary Materials

The following supporting information can be downloaded at https://www.mdpi.com/article/10.3390/crops5030028/s1: Figure S1: Chemical structure of FPX(A) and 2,4-D(B). Table S1: Sequences of gene-specific primers for real-time PCR. Table S2: Gene IDs and their annotations for real-time PCR.

Author Contributions

Conceptualization, K.Y., Y.G. and F.K.D.; methodology, W.Z. and S.L.; software, B.L.; validation, W.Z., S.L. and B.L.; formal analysis, W.Z., S.L. and B.L.; investigation, W.Z., S.L. and B.L.; resources, K.Y., Y.G. and F.K.D.; data curation, W.Z., S.L. and B.L.; writing—original draft preparation, W.Z., S.L. and K.Y.; writing—review and editing, W.Z., S.L. and K.Y.; visualization, K.Y., Y.G. and F.K.D.; supervision, K.Y., Y.G. and F.K.D.; project administration, K.Y.; funding acquisition, K.Y. All authors have read and agreed to the published version of the manuscript.

Funding

This research was funded by Science and Technology Innovation of Inner Mongolia Autonomous Region, grant number 2022JBGS0020.

Data Availability Statement

The transcriptome raw data are available at https://doi.org/10.6084/m9.figshare.28347761 (accessed on 5 February 2025), https://doi.org/10.6084/m9.figshare.28348094 (accessed on 5 February 2025), and https://doi.org/10.6084/m9.figshare.28350620 (accessed on 5 February 2025).

Acknowledgments

The authors thank Clover company for providing alfalfa seeds as a gift.

Conflicts of Interest

The author Siyang Li is an employee of MDPI; however, she did not work for the journal Crops at the time of submission and publication.

Abbreviation

The following abbreviation is used in this manuscript:
FPXFipexide

References

  1. Horsch, R.B.; Fraley, R.T.; Rogers, S.G.; Sanders, P.R.; Lloyd, A.; Hoffmann, N. Inheritance of functional foreign genes in plants. Science 1984, 223, 496–498. [Google Scholar] [CrossRef] [PubMed]
  2. Anjanappa, R.B.; Gruissem, W. Current progress and challenges in crop genetic transformation. J. Plant Physiol. 2021, 261, 153411. [Google Scholar] [CrossRef] [PubMed]
  3. Lesh, M. Splice of Life: The Case for GMOs and Gene Editing; Adam Smith Institute: London, UK, 2021. [Google Scholar]
  4. Yin, K.; Gao, C.; Qiu, J.L. Progress and prospects in plant genome editing. Nat. Plants 2017, 6, 17107. [Google Scholar] [CrossRef] [PubMed]
  5. Gosal, S.S.; Kang, M.S. Plant Tissue Culture and Genetic Transformation for Crop Improvement. In Improving Crop Resistance to Abiotic Stress; Tuteja, N., Gill, S.S., Tiburcio, A.F., Tuteja, R., Eds.; John Wiley & Sons: Hoboken, NJ, USA, 2012; pp. 357–397. [Google Scholar] [CrossRef]
  6. Gautheret, R.J. Sur la possibilité de réaliser la culture indéfinie des tissus de tubercules de carotte. C. R. Hebd. Seances Acad. Sci. 1939, 208, 118–120. [Google Scholar]
  7. Nobécourt, P. Sur la pérennité et l’augmentation de volume des cultures de tissues végétaux. C. R. Seances Soc. Biol. 1939, 130, 1270–1271. [Google Scholar]
  8. White, P.R. Potentially unlimited growth of excised plant callus in an artificial nutrient. Am. J. Bot. 1939, 26, 59–64. [Google Scholar] [CrossRef]
  9. Ikeuchi, M.; Sugimoto, K.; Iwase, A. Plant callus: Mechanisms of induction and repression. Plant Cell 2013, 25, 3159–3173. [Google Scholar] [CrossRef]
  10. Skoog, F.; Miller, C.O. Chemical regulation of growth and organ formation in plant tissue cultured in vitro. Symp. Soc. Exp. Biol. 1957, 11, 118–131. [Google Scholar]
  11. Nakano, T.; Tanaka, S.; Ohtani, M.; Yamagami, A.; Takeno, S.; Hara, N.; Mori, A.; Nakano, A.; Hirose, S.; Himuro, Y.; et al. FPX is a novel chemical inducer that promotes callus formation and shoot regeneration in plants. Plant Cell Physiol. 2018, 59, 1555–1567. [Google Scholar] [CrossRef]
  12. Tanahara, Y.; Yamanaka, K.; Kawai, K.; Ando, Y.; Nakatsuka, T. Establishment of an efficient transformation method of garden stock (Matthiola incana) using a callus formation chemical inducer. Plant Biotechnol. 2022, 39, 273–280. [Google Scholar] [CrossRef]
  13. Li, X.; Brummer, E.C. Applied genetics and genomics in alfalfa breeding. Agronomy 2012, 2, 40–61. [Google Scholar] [CrossRef]
  14. Kumar, S. Biotechnological advancements in alfalfa improvement. J. Appl. Genet. 2011, 52, 111–124. [Google Scholar] [CrossRef] [PubMed]
  15. Jiang, Q.; Fu, C.; Wang, Z.Y. A unified Agrobacterium-mediated transformation protocol for alfalfa (Medicago sativa L.) and Medicago truncatula. In Transgenic Plants: Methods and Protocols; Kumar, S., Barone, P., Smith, M., Eds.; Humana Press: New York, NY, USA, 2019; pp. 153–163. [Google Scholar] [CrossRef]
  16. Murashige, T.; Skoog, F. A Revised Medium for Rapid Growth and Bio Assays with Tobacco Tissue Cultures. Plant Physiol. 1962, 15, 473–497. [Google Scholar] [CrossRef]
  17. Chen, S.; Zhou, Y.; Chen, Y.; Gu, J. fastp: An ultra-fast all-in-one FASTQ preprocessor. Bioinformatics 2018, 34, i884–i890. [Google Scholar] [CrossRef]
  18. Kim, D.; Paggi, J.M.; Park, C.; Bennett, C.; Salzberg, S.L. Graph-based genome alignment and genotyping with HISAT2 and HISAT-genotype. Nat. Biotechnol. 2019, 37, 907–915. [Google Scholar] [CrossRef]
  19. Danecek, P.; Bonfield, J.K.; Liddle, J.; Marshall, J.; Ohan, V.; Pollard, M.O.; Whitwham, A.; Keane, T.; McCarthy, S.A.; Davies, R.M.; et al. Twelve years of SAMtools and BCFtools. Gigascience 2021, 10, giab008. [Google Scholar] [CrossRef]
  20. Pertea, G.; Pertea, M. GFF utilities: GffRead and GffCompare. F1000Research 2020, 9, 304. [Google Scholar] [CrossRef]
  21. Liao, Y.; Smyth, G.K.; Shi, W. featureCounts: An efficient general purpose program for assigning sequence reads to genomic features. Bioinformatics 2014, 30, 923–930. [Google Scholar] [CrossRef]
  22. Love, M.I.; Huber, W.; Anders, S. Moderated estimation of fold change and dispersion for RNA-seq data with DESeq2. Genome Biol. 2014, 15, 550. [Google Scholar] [CrossRef]
  23. Benjamini, Y.; Hochberg, Y. Controlling the false discovery rate—A practical and powerful approach to Multiple testing. J. R. Statist. Soc. Ser. B 1995, 57, 289–300. [Google Scholar] [CrossRef]
  24. Lyu, Y.; Zhu, S.; Zhi, X.; Ji, Y.; Fan, Y.; Dong, F. Improving subseasonal-to-seasonal prediction of summer extreme precipitation over southern China based on a deep learning method. Geophys. Res. Lett. 2023, 50, e2023GL106245. [Google Scholar] [CrossRef]
  25. Schneider, C.A.; Rasband, W.S.; Eliceiri, K.W. NIH Image to ImageJ: 25 years of image analysis. Nat. Methods 2012, 9, 671–675. [Google Scholar] [CrossRef] [PubMed]
  26. Buchfink, B.; Xie, C.; Huson, D.H. Fast and sensitive protein alignment using DIAMOND. Nat. Methods 2015, 12, 59–60. [Google Scholar] [CrossRef]
  27. Shen, C.; Du, H.; Chen, Z.; Lu, H.; Zhu, F.; Chen, H.; Meng, X.; Liu, Q.; Liu, P.; Zheng, L.; et al. The chromosome-level genome sequence of the autotetraploid alfalfa and resequencing of core germplasms provide genomic resources for alfalfa research. Mol. Plant 2020, 13, 1250–1261. [Google Scholar] [CrossRef]
  28. Katoh, K.; Standley, D.M. MAFFT multiple sequence alignment software version 7: Improvements in performance and usability. Mol. Biol. Evol. 2013, 30, 772–780. [Google Scholar] [CrossRef]
  29. Suyama, M.; Torrents, D.; Bork, P. PAL2NAL: Robust conversion of protein sequence alignments into the corresponding codon alignments. Nucleic Acids Res. 2006, 34 (Suppl. S2), W609–W612. [Google Scholar] [CrossRef]
  30. Capella-Gutiérrez, S.; Silla-Martínez, J.M.; Gabaldón, T. trimAl: A tool for automated alignment trimming in large-scale phylogenetic analyses. Bioinformatics 2009, 25, 1972–1973. [Google Scholar] [CrossRef]
  31. Kumar, S.; Stecher, G.; Li, M.; Knyaz, C.; Tamura, K. MEGA X: Molecular evolutionary genetics analysis across computing platforms. Mol. Biol. Evol. 2018, 35, 1547–1549. [Google Scholar] [CrossRef]
  32. Stamatakis, A. RAxML version 8: A tool for phylogenetic analysis and post-analysis of large phylogenies. Bioinformatics 2014, 30, 1312–1313. [Google Scholar] [CrossRef]
  33. Letunic, I.; Bork, P. Interactive Tree Of Life (iTOL) v5: An online tool for phylogenetic tree display and annotation. Nucleic Acids Res. 2021, 49, W293–W296. [Google Scholar] [CrossRef]
  34. Stortenbeker, N.; Bemer, M. The SAUR gene family: The plant’s toolbox for adaptation of growth and development. J. Exp. Bot. 2019, 70, 17–27. [Google Scholar] [CrossRef] [PubMed]
  35. Spartz, A.K.; Ren, H.; Park, M.Y.; Grandt, K.N.; Lee, S.H.; Murphy, A.S.; Sussman, M.R.; Overvoorde, P.J.; Gray, W.M. SAUR Inhibition of PP2C-D Phosphatases Activates Plasma Membrane H+-ATPases to Promote Cell Expansion in Arabidopsis. Plant Cell 2014, 26, 2129–2142. [Google Scholar] [CrossRef] [PubMed]
  36. Zhang, H.; Yu, Z.; Yao, X.; Chen, J.; Chen, X.; Zhou, H.; Lou, Y.; Ming, F.; Jin, Y. Genome-wide identification and characterization of small auxin-up RNA (SAUR) gene family in plants: Evolution and expression profiles during normal growth and stress response. BMC Plant Biol. 2021, 21, 4. [Google Scholar] [CrossRef]
  37. Spartz, A.K.; Lee, S.H.; Wenger, J.P.; Gonzalez, N.; Itoh, H.; Inzé, D.; Peer, W.A.; Murphy, A.S.; Overvoorde, P.J.; Gray, W.M. The SAUR19 subfamily of SMALL AUXIN UP RNA genes promote cell expansion. Plant J. 2012, 70, 978–990. [Google Scholar] [CrossRef]
  38. Kant, S.; Bi, Y.M.; Zhu, T.; Rothstein, S.J. SAUR39, a small auxin-up RNA gene, acts as a negative regulator of auxin synthesis and transport in rice. Plant Physiol. 2009, 151, 691–701. [Google Scholar] [CrossRef]
  39. Ren, H.; Gray, W.M. SAUR proteins as effectors of hormonal and environmental signals in plant growth. Mol. Plant 2015, 8, 1153–1164. [Google Scholar] [CrossRef]
  40. Jain, M.; Tyagi, A.K.; Khurana, J.P. Genome-wide analysis, evolutionary expansion, and expression of early auxin-responsive SAUR gene family in rice (Oryza sativa). Genomics 2006, 88, 360–371. [Google Scholar] [CrossRef]
  41. Chen, Y.; Hao, X.; Cao, J. Small auxin upregulated RNA (SAUR) gene family in maize: Identification, evolution, and its phylogenetic comparison with Arabidopsis, rice, and sorghum. J. Integr. Plant Biol. 2013, 56, 133–150. [Google Scholar] [CrossRef]
Figure 1. Hypocotyl length and callus area of Medicago sativa after two weeks under different types and concentrations of PGRs. Four M. sativa varieties—4020, 4030, Dite, and Spyder—were used. (AD) Hypocotyl length of M. sativa seeds of various varieties under different types and concentrations of PGRs: (A) 4020, (B) 4030, (C) Dite, and (D) Spyder. (EH) Callus area of M. sativa seeds of various varieties under different types and concentrations of PGRs: (E) 4020, (F) 4030, (G) Dite, and (H) Spyder. Varieties ‘4020’, ‘4030’, ‘Dite’, and ‘Spyder’ are different genotypes of alfalfa. The bar represents the standard deviation, p < 0.05. Superscript letters (a, b, c, d) mark significant pairwise differences based on one-way ANNOVA test. Groups with different letters differ significantly.
Crops 05 00028 g001
Figure 2. Hypocotyl length and callus area of Medicago sativa after four weeks of induction under different types and concentrations of PGRs. (AD) Hypocotyl length of M. sativa seeds of various varieties under different types and concentrations of PGRs: (A) 4020, (B) 4030, (C) Dite, and (D) Spyder. (EH) Callus area of M. sativa seeds of various varieties under different types and concentrations of PGRs: (E) 4020, (F) 4030, (G) Dite, and (H) Spyder. Varieties ‘4020’, ‘4030’, ‘Dite’, and ‘Spyder’ are different genotypes of alfalfa. The bar represents the standard deviation, p < 0.05. Superscript letters (a, b, c, d) mark significant pairwise differences based on one-way ANNOVA test. Groups with different letters differ significantly.
Crops 05 00028 g002
Figure 3. (AD) Changes in hypocotyls and callus tissues of M. sativa at two and four weeks after induction on MS media containing different PGRs. (A) M. sativa ‘4020’. (B) M. sativa ‘4030’. (C) M. sativa ‘Dite’. (D) M. sativa ‘Spyder’.
Crops 05 00028 g003
Figure 4. (A) Changes in hypocotyl and callus of M. sativa variety ‘4030’ after two weeks and four weeks after induction on MS media containing different PGRs. (B) Hypocotyl length of ‘4030’ seeds after different types and concentrations of PGRs for two weeks. (C) Callus area of ‘4030’ after different types and concentrations of PGRs for two weeks. (D) Hypocotyl length of ‘4030’ seeds after different types and concentrations of PGRs for four weeks. (E) Callus area of ‘4030’ after different types and concentrations of PGRs for four weeks. The bar represents the standard deviation, p < 0.05. Superscript letters (a, b, c) mark significant pairwise differences based on one-way ANNOVA test. Groups with different letters differ significantly.
Crops 05 00028 g004
Figure 5. Paraffin sections of M. sativa variety ‘4030’ callus tissue induced by FPX-30 μM, 2,4-D/6-BA, and FPX-30 μM with 2,4-D/6-BA for four weeks. (A) Callus tissue sections treated with FPX at a concentration of 30 μM. (B) Callus tissue sections treated with 2,4-D/6-BA. (C) Callus tissue sections treated with FPX and 2,4-D/6-BA. (D) Enlarged view of the square area in (A). (E) Enlarged view of the square area in (B). (F) Enlarged view of the square area in (C). dv: divisions. is: intercellular spaces.
Crops 05 00028 g005
Figure 6. Expression analysis of differentially expressed genes in M. sativa variety ‘4030’ following FPX treatment. (A) Upregulated genes. (B) Downregulated genes. (C) Hierarchical clustering of SAUR genes in M. sativa significantly regulated by FPX treatment. Ck: Seedlings were treated with no FPX. (D) Hierarchical clustering of SAUR genes in A. thaliana at days two and eight following FPX treatment. Data were obtained from Gene Expression Omnibus (GEO), with accession number GSE116939.
Crops 05 00028 g006
Figure 7. Maximum likelihood tree constructed from SAUR proteins of M. sativa and A. thaliana. Red branches indicate bootstrap support values greater than 60%. Blue labels represent SAUR proteins of A. thaliana; red labels represent M. sativa SAUR proteins showing significant differences in gene expression levels at both the day 2 and day 15 time points.
Crops 05 00028 g007
Figure 8. Genes with high GO enrichment at different times under FPX treatment for M. sativa variety ‘4030’, the size of the circle represents the degree of enrichment. (AC) Genes with high cellular component (CC) GO enrichment at different times under FPX treatment. (A) Day 2 compared with Ck; (B) day 15 compared with day 2; (C) day 15 compared with Ck. (DF) Genes with high biological process (BP) GO enrichment at different times under FPX treatment. (D) Day 2 compared with Ck; (E) day 15 compared with day 2; (F) day 15 compared with Ck. (GI) Genes with high molecular function (MF) GO enrichment at different times under FPX treatment. (G) Day 2 compared with Ck; (H) day 15 compared with day 2; (I) day 15 compared with Ck. Ck: seedlings were treated without FPX.
Crops 05 00028 g008
Figure 9. Activated pathways and the number of genes in each pathway in KEGG enrichment analysis at different times under an FPX concentration of 30 μM for M. sativa variety ‘4030’. (A) Day 2 compared with no-FPX; (B) day 15 compared with day 2; (C) day 15 compared with no-FPX.
Crops 05 00028 g009
Figure 10. Relative expression of genes by quantitative RT-PCR. Nine genes were selected to investigate their expression levels in response to different plant growth regulator treatments at various time points. (A) MsG0280008661. (B) MsG0080048620. (C) MsG0580024778. (D) MsG0880046107. (E) MsG0580024221. (F) MsG0580026147. (G) MsG0680032113. (H) MsG0880043195. (I) MsG0080048980. The bar represents the standard deviation, p < 0.05. Superscript letters (a, b, c) mark significant pairwise differences based on one-way ANNOVA test. Groups with different letters differ significantly.
Crops 05 00028 g010
Disclaimer/Publisher’s Note: The statements, opinions and data contained in all publications are solely those of the individual author(s) and contributor(s) and not of MDPI and/or the editor(s). MDPI and/or the editor(s) disclaim responsibility for any injury to people or property resulting from any ideas, methods, instructions or products referred to in the content.

