Article

Zeolite and Inorganic Nitrogen Fertilization Effects on Performance, Lint Yield, and Fiber Quality of Cotton Cultivated in the Mediterranean Region

by
Ioannis Roussis
1,
Antonios Mavroeidis
1,
Panteleimon Stavropoulos
1,
Konstantinos Baginetas
2,
Panagiotis Kanatas
3,
Konstantinos Pantaleon
1,
Antigolena Folina
1,
Dimitrios Beslemes
4 and
Ioanna Kakabouki
1,*
1
Laboratory of Agronomy, Department of Crop Science, Agricultural University of Athens, 11855 Athens, Greece
2
Greek Ministry of Rural Development and Food, 10176 Athens, Greece
3
Department of Crop Science, University of Patras, 30200 Messolonghi, Greece
4
Institute of Industrial and Forage Crops, Hellenic Agricultural Organization Dimitra, 41335 Larissa, Greece
*
Author to whom correspondence should be addressed.
Crops 2025, 5(3), 27; https://doi.org/10.3390/crops5030027
Submission received: 27 March 2025 / Revised: 17 April 2025 / Accepted: 28 April 2025 / Published: 3 May 2025

Abstract

The continuous provision of nitrogen (N) to the crop is critical for optimal cotton production; however, the constant and excessive application of synthetic fertilizers causes adverse impacts on soil, plants, animals, and human health. The current study focused on the short-term effects (one-year study) of adding different rates of clinoptilolite zeolite, as part of an integrated nutrient management plan, and different rates of inorganic N fertilizer to improve soil and crop performance of cotton in three locations (ATH, MES, and KAR) in Greece. Each experiment was set up according to a split-plot design with three replications, three main plots (zeolite application at rates of 0, 5, and 7.5 t ha−1), and four sub-plots (N fertilization regimes at rates of 0, 100, 150, and 200 kg N ha−1). The results of this study indicated that increasing rates of the examined factors increased cotton yields (seed cotton yield, lint yield, and lint percentage), with the greatest lint yield recorded under the highest rates of zeolite (7.5 t ha−1: 1808, 1723, and 1847 kg ha−1 in ATH, MES, and KAR, respectively) and N fertilization (200 kg N ha−1: 1804, 1768, and 1911 kg ha−1 in ATH, MES, and KAR, respectively). From the evaluated parameters, most soil parameters (soil organic matter, soil total nitrogen, and total porosity), root and shoot development (root length density, plant height, leaf area index, and dry weight), fiber maturity traits (micronaire, maturity, fiber strength, and elongation), fiber length traits (upper half mean length, uniformity index, and short fiber index), as well as color (reflectance and spinning consistency index) and trash traits (trash area and trash grade), were positively impacted by the increasing rates of the evaluated factors. In conclusion, the results of the present research suggest that increasing zeolite and N fertilization rates to 7.5 t ha−1 and 200 kg N ha−1, respectively, improved soil properties (except mean weight diameter), stimulated crop development, and enhanced cotton and lint yield, as well as improved the fiber maturity, length, and color parameters of cotton grown in clay-loam soils in the Mediterranean region.

1. Introduction

Cotton (Gossypium hirsutum L.) constitutes the most commonly utilized natural fiber material in the globe. It has a considerable economic impact on the world’s economy due to its broad use in the textile industry and the creation of job opportunities in the countries where the crop is grown [1]. Cotton fiber is used as a raw material in textile manufacturing, seeds are used to extract oil for biodiesel agro-industries, and seed cake is used in the feed industry [1,2]. The global population growth is also increasing the need for cotton cultivation [3]. Cotton has become increasingly important as the world’s population and living standards have grown. Cotton yield needs to be increased due to limited cultivation areas and a continual growth in cotton demand [3]. Farmers must produce more quantity and quality per unit area [2,4]. Despite a variety’s potential, crop management aspects such as nutrients, water, seedbed preparation, and weed control are critical for long-term cotton production, after climatic conditions [5].
The continuous provision of plant vital nutrients to the crop is critical for optimal cotton production. Several studies on different fertilizer doses have been conducted to optimize the nutrient requirements for long-term cotton production in diverse cotton-producing zones [5,6,7]. Nitrogen (N) is essential for cotton growth and development since cotton requires a lot of this nutrient [8,9]. Nevertheless, growers depend extensively on the excessive application of N fertilizers to increase cotton yield and earnings, resulting in late crop maturity, decreased N use efficiency and yield, as well as a decline in crop productivity [9,10]. According to prior research, providing optimal N dosages at the right time and with appropriate methods may boost biomass production and physiological characteristics, therefore improving cotton yield and quality [11,12,13]. Furthermore, some published studies have indicated that by reducing N rates, efficient agronomic management practices improve N use efficiency while also increasing lint yield and quality [9,14].
The constant and excessive application of synthetic fertilizers causes adverse impacts on soil, plants, animals, and human health [15,16]. As a result of the widespread application of nitrogenous fertilizers in cotton production today, nitrogen losses are increasing through leaching away from the soil and increasing environmental pollution [16,17]. In addition, the incorrect and continual application of synthetic fertilizers causes degradation of the soil, reduced soil water holding capacity, increased soil erosion, and losses of soil nutrients, ultimately resulting in soil fertility, all of which are critical concerns for agricultural lands around the world [17]. To address these issues, the use of zeolite as a soil amendment as part of an integrated nutrient management plan is seen as a critical and sustainable way to maintain and improve soil health and crop productivity [18,19,20].
Clinoptilolite zeolite, a naturally formed crystalline aluminosilicate, has attracted significant attention as a soil amendment for carbon storage while increasing soil properties, macro- and micronutrients, crop yield, and ecological sustainability [20,21,22]. In terms of soil qualities, zeolite provides numerous advantages, including increased soil moisture, improved hydraulic conductivity, and increased yields in acidic soils [21,22]. It is commonly used as a soil conditioner to improve soil physicochemical qualities and cation exchange capacity [18,19]. In addition, applying natural zeolite to soil to manage pH boosted macronutrient availability and improved ammonium retention [18,20,21]. Zeolite is primarily used in agriculture to fixate, store, and slowly release N. The literature demonstrates that adding zeolite to the N source can improve N use efficiency [18,23,24]. Several studies have indicated that mixing zeolite with N improves the compound’s function as a slow-release fertilizer in both intensive and extensive crops, including cotton [21,22,25].
There have been several studies conducted on the impact of soil amendments and inorganic fertilizers on soil parameters, crop growth, and yields around the world. However, no substantial research has been undertaken to assess the combined impacts of inorganic N fertilization and zeolite soil amendment on soil characteristics and cotton productivity in the Mediterranean semi-arid climate. For this reason, we anticipated that inorganic N fertilizer in the form of urea and soil incorporation with zeolite would increase soil characteristics, growth, and, ultimately, cotton crop productivity and yield. As a result, the current study focused on the short-term effects (one-year study) of adding different rates of clinoptilolite zeolite on the soil properties, growth, yield, and fiber quality-related traits of cotton crops under different rates of inorganic N fertilization in three locations in Greece that represent a typical Mediterranean environment.

2. Materials and Methods

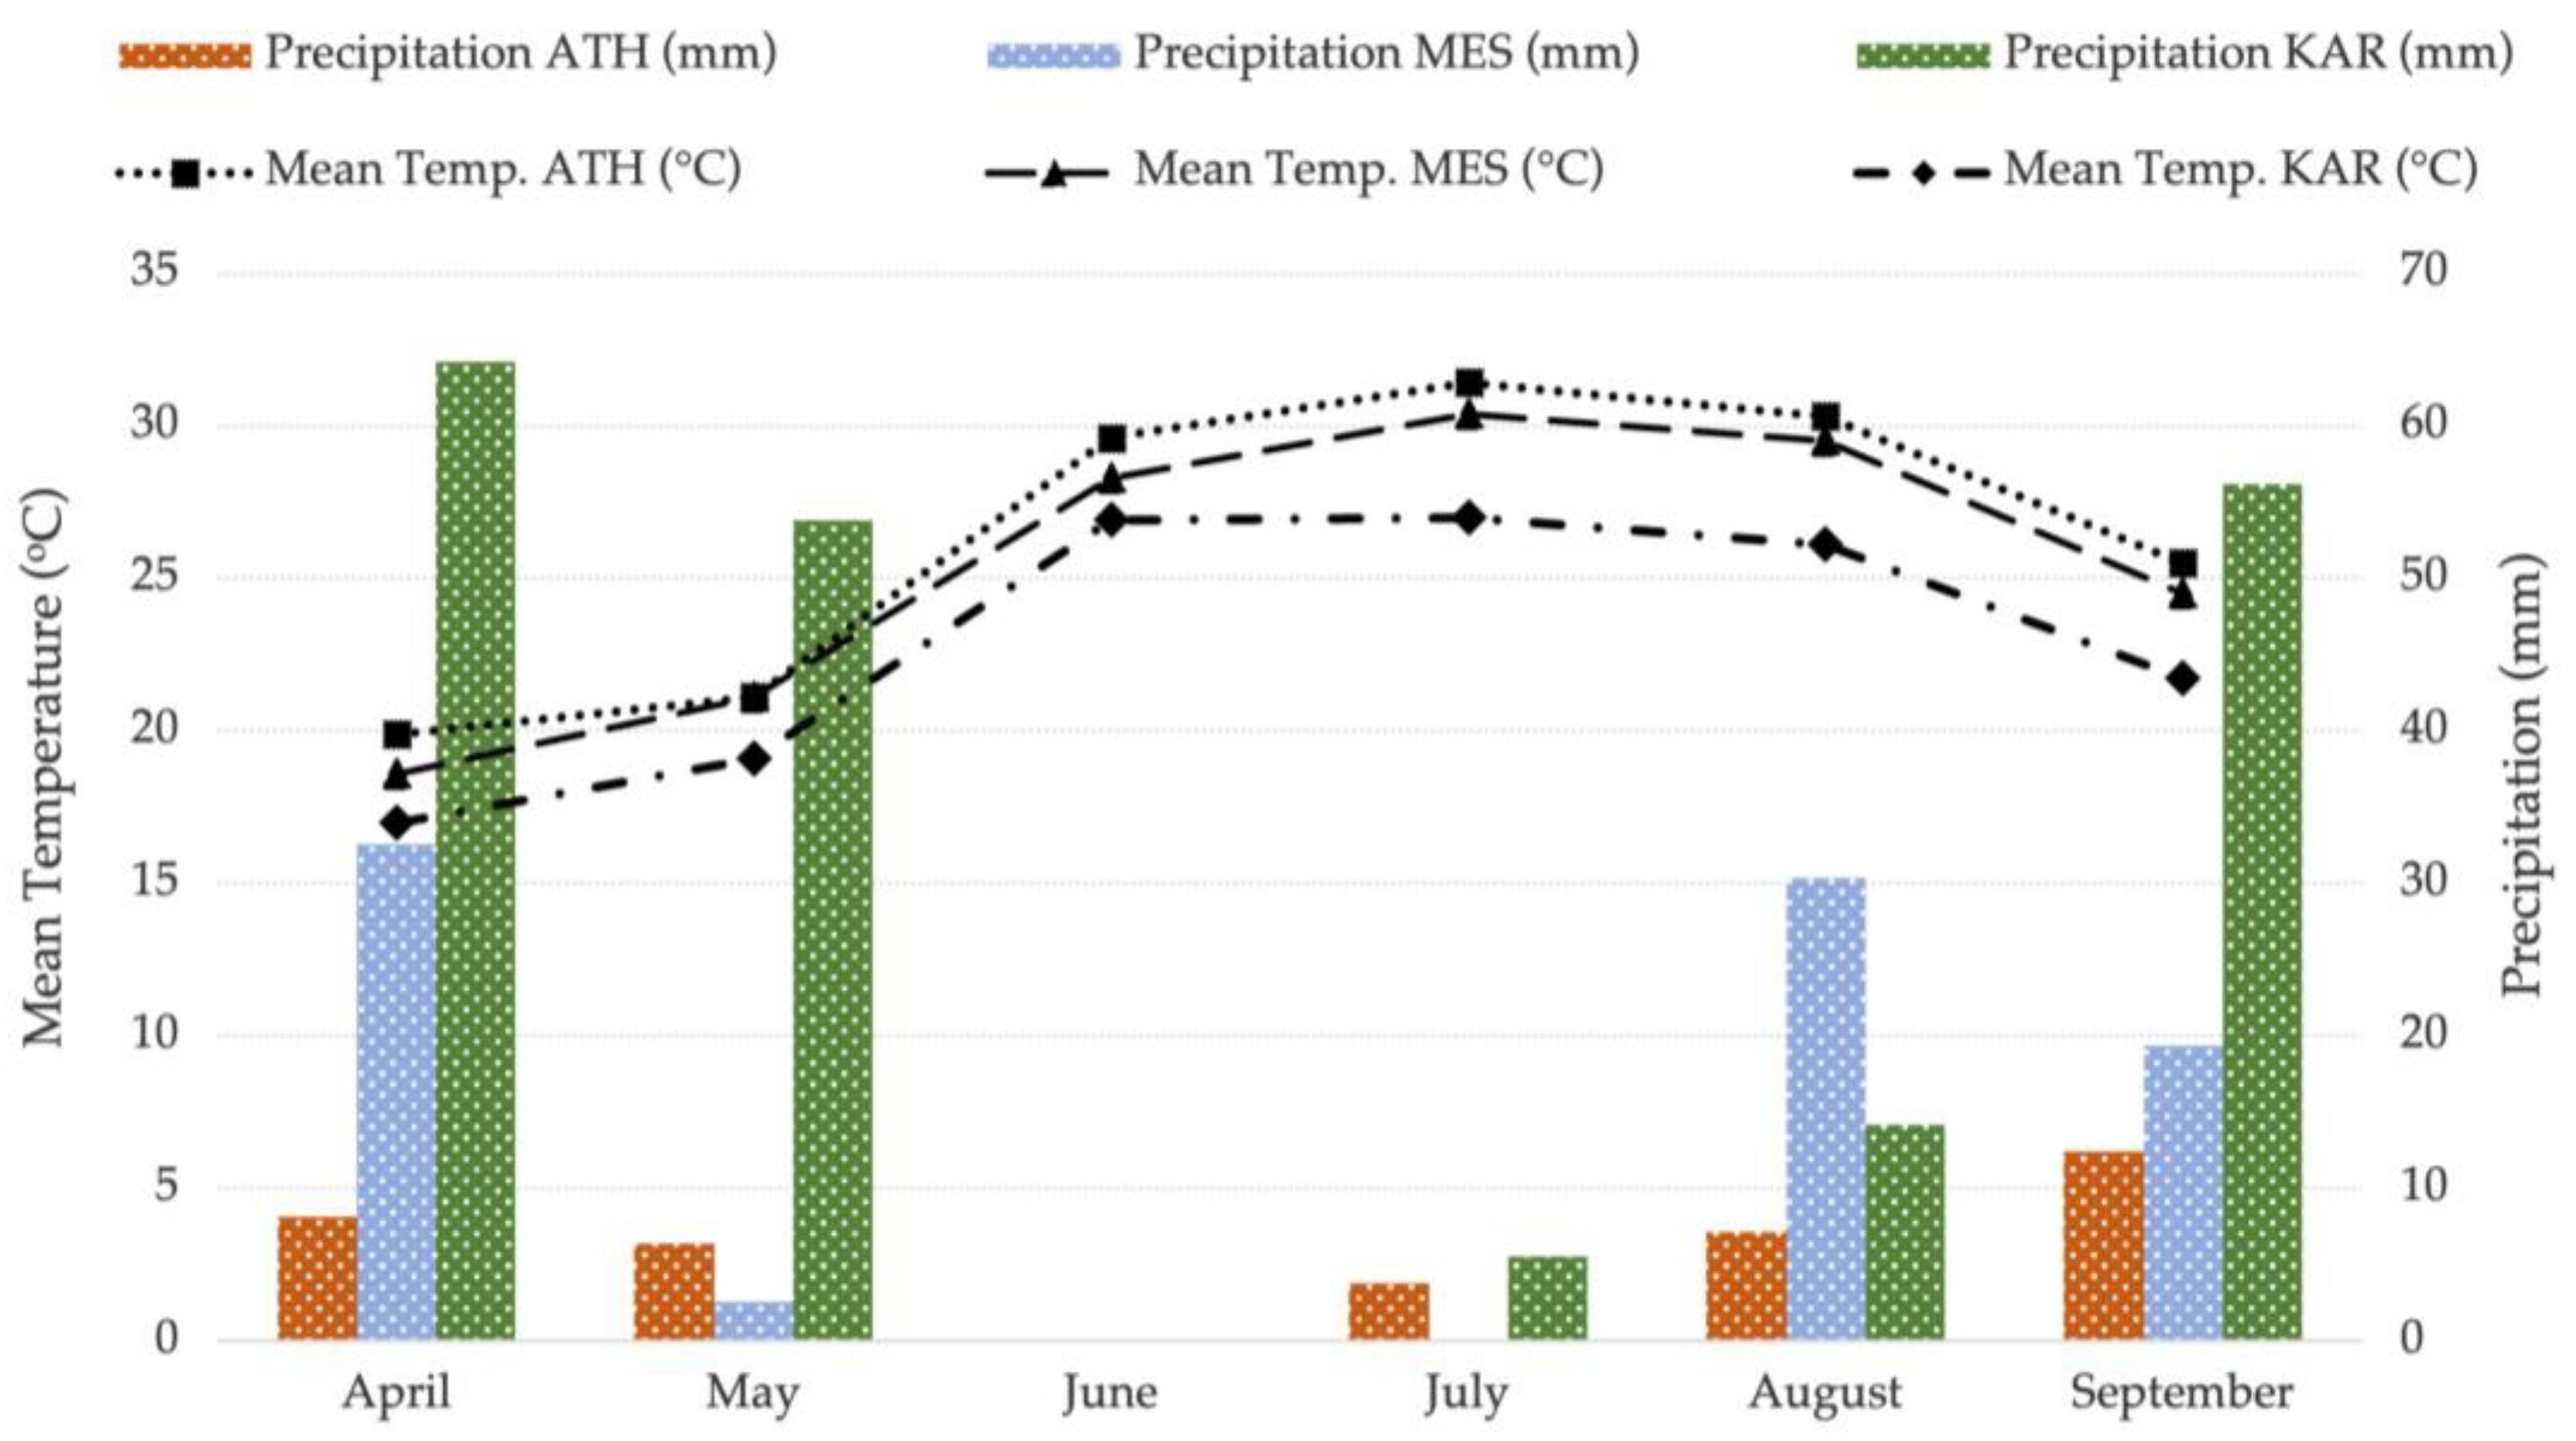
2.1. Site Description and Experimental Design

Three field experiments were set up during the spring–summer season of 2024 across three different geographical locations in Greece, situated in the hot-summer Mediterranean climate zone (Csa) [26] and characterized by the same soil type (clay loam). Characteristics of experimental sites, including geographical information and soil properties, are presented in Table 1. Soil analysis was performed on a soil sample collected from five randomly chosen points in each experimental site, at a 0–30 cm soil depth, according to the methodology used in [24].
Each experimental trial was set up on a 988 m2 area as a split-plot design, with three main plots (Zeolite application at rates of 0, 5, and 7.5 t ha−1) and four sub-plots (N fertilization regimes at rates of 0, 100, 150, and 200 kg N ha−1) in three replications (Table 2). The main plot and sub-plot sizes were 96 m2 (12 m × 8 m) and 24 m2 (8 m × 3 m), respectively. The cultivated plant was upland cotton (Gossypium hisrsutum L.) cultivar ‘Elpida’ (Golden West Seed Hellas, Athens, Greece), characterized as an early maturity variety with great adaptability to various environments, good verticillium wilt tolerance, excellent storm tolerance, and reliable harvesting behavior after heavy rains, making it the most widely cultivated cotton variety in Greece [28,29]. For homogenous starting conditions, the soil in each experimental site was prepared by mouldboard plowing at a depth of 0.25 m, three days before the sowing. Zeolite and N fertilizers were spread to the soil by basal dressing and were incorporated into the soil by harrowing. The natural zeolite (clinoptilolite; Thracean Zeolite by AVGI Ltd., Photolivos, Drama, Greece) utilized in the present investigation consisted of zeolite granules with a grain size of 2.5 to 5.0 mm and was characterized by a pH of 7.28, a cation exchange capacity (CEC) that ranged between 180 and 185 (cmol (p+) kg−1), an electrical conductivity (EC) of 5.6 dS m−1, moisture ranging between 7.4% and 8.6% (at 105 °C), a bulk density ranging between 0.8 and 1.1 g cm−3, as well as silica (SiO2) and alumina (Al2O3) contents ranging between 68–74% and 8–12%, respectively. The N fertilizer was a 46-0-0 urea. For sustained upland cotton growing in Mediterranean semi-arid conditions, the maximum zeolite and N fertilizer amounts used in the current study represent the greatest optimal rates of each [22,25,30,31,32]. Seed sowing took place on the 25th of April, 27th of April, and 4th of May 2024 in ATH, MES, and KAR, respectively. The seeds were manually planted in single rows, 95 cm apart, with a plant density of 130,000 plants ha−1. During the experimental period, a total of 582, 597, and 569 mm of water were applied by drip irrigation systems in ATH, MES, and KAR, respectively. Throughout the study, no diseases or pests had an impact on the cotton crop at any of the experimental locations. In addition, when necessary and before canopy closing, hand hoeing was used to control weeds.
The automatic weather station of the Agricultural University of Athens (Davis Vantage Pro2 Weather Station; Davis Instruments Corporation, Hayward, CA, USA) provided the average monthly air temperature and rainfall data for the ATH experimental site, which are shown in Figure 1. The automated weather stations of the Institute for Environmental Research, National Observatory of Athens [33], which are situated 5–10 km from each experimental trial, provided the relevant data for the MES and KAR experimental sites during the corresponding growing period (Figure 1). Between April and September 2024, the average air temperature was 26.3 °C in ATH, 25.4 °C in MES, and 23.0 °C in KAR. At the same time, the total precipitation was 38, 85, and 194 mm in ATH, MES, and KAR, respectively.

2.2. Sampling, Measurements, and Methods

Ninety days after sowing (90 DAS), two topsoil samples (0–30 cm) were collected from each sub-plot to analyze the chemical properties of the soil. Debris, roots, and stones were removed from soil samples using a 2 mm square-hole filter before air-drying at room temperature (25 °C) and analyzing for soil organic matter (SOM) and soil total nitrogen (STN). To accomplish these analyses, the wet oxidation method of Walkley and Black [34] and the Kjeldahl method [35] were utilized, with the use of a Büchi B-316 device (Buchi Labortechnik AG, Flawil, Switzerland) for combustion and extraction of soil. The mean weight diameter (MWD) of soil aggregates was determined at 90 DAS according to the procedure given by Van Bavel [36] using an oscillation apparatus Analysette 3 (Spartan, Fritsch Ltd., Oberstein, Germany). The oscillation time was 4 min., using 2 kg of air-dried soil from a depth of 0 to 60 cm and sieve mesh sizes where five aggregate fractions (40–20, 20–10, 10–5, 5–2, and <2 mm) were considered and calculated by the following equation:
MWD   =   i = 1 n x i   w i
where:
xi—Mean diameter of different sizes of aggregates.
wi—Proportion of different sizes of aggregates to total weight of aggregate
Total Soil Porosity (TP) was evaluated for each sub-plot at 90 DAS by obtaining undisturbed soil cores with 100 cm3 cylinders (5 cm height and 5.04 cm inner diameter) at depths ranging from 0 to 25 cm [37].
Moreover, a cylindrical substance corer (25 cm long and 10 cm broad) was utilized to pick root samples from the 0–35 cm layer between two plants in a row, avoiding border plants. Specifically, three root samples per sub-plot were analyzed at 90 DAS. After an overnight soak in H2O + (NaPO3)6 + Na2CO3, the roots were extracted from the soil and decanted into a 0.1% trypan blue FAA staining solution (10% CH2O, 50% CH3CH2OH, 5% CH3COOH, and 35% H2O). The root length density (RLD) was determined by scanning root samples via a high-resolution scanner (HP Scanjet 200 Flatbed Photo Scanner, Hewlett-Packard Inc., Palo Alto, CA, USA) and then analyzing the images using Delta-T software (Delta-T Scan ver. 2.04; Delta-T Devices Ltd., Burwell, Cambridge, UK) [38].
At 100 DAS, the leaf area index (LAI) in each sub-plot was assessed by taking five measurements in rapid succession with a Delta-T SunScan SS1 plant canopy analyzer (Delta-T Devices Ltd., Burwell, Cambridge, UK). The SunScan is a frequently employed, accurate, and nondestructive LAI measurement method that has been successfully utilized in numerous past research [24,32,39].
After the cotton bolls reached full maturity (9.5% boll moisture), the bolls from the whole plot were harvested on 16 September 2024 (145 DAS), 14 September 2024 (140 DAS), and 22 September 2024 (142 DAS). After harvesting, the bolls were weighted to estimate the crop’s yield. The yield was estimated (kg ha−1) according to the following Equation (2):
Yield   ( kg   ha 1 ) = w e i g h t   o f   b o l l s   i n   p l o t   i n   k g   10,000 s i z e   o f   p l o t   i n   s q u a r e   m e t e r s
After ginning, seed and lint yield were estimated by weighing the seeds and lint. Lint percentage, the fraction of fiber weight to seed-cotton weight, was also calculated. In addition, 500 g of unginned cotton was utilized from each sub-plot to evaluate and assess fiber quality. The samples were analyzed at the National Centre for Quality Control, Classification, and Standardization of Cotton, Institute of Industrial and Forage Crops of the Hellenic Agricultural Organization “DIMIΤRA” (Karditsa, Greece) via a High-Volume Instrument (HVI) (Uster HVI 1000; Uster Technologies AG, Uster, Switzerland), and the evaluated quality parameters are fully presented and described in Table 3.

2.3. Statistical Analysis

The data were subjected to a two-way analysis of variance (ANOVA) using the JMP 12 statistical program (SAS Institute Inc., Cary, NC, USA). The mean differences were separated using Tukey’s honestly significant difference (HSD) test. Principal component analysis (PCA) and Pearson’s correlation were used to describe the connections among all of the characteristics that were being examined. The significance level for each comparison was set at 5%.

3. Results

The interaction effect among zeolite addition and N fertilization had a considerable impact on soil total nitrogen (STN), total porosity (TP), root length density (RLD), elongation (ELG), upper half mean length (UHML), uniformity index (UI), short fiber index (SFI), and spinning consistency index (SCI), according to the current study’s three-way analysis of variance (ANOVA) (Table 4). Except for boll number, the zeolite application effect was statistically significant for all evaluated traits. In addition, all traits, except trash grade (TrID), were substantially impacted by N fertilization. Finally, the location effect was also significant in all traits, except the RLD, boll weight, SFI, trash area (TrAr), and TrID.

3.1. Soil Characteristics of the Experimental Sites

The zeolite addition had a significant impact on soil organic matter (SOM) across all experimental sites (Table 5). Specifically, in MES and KAR, the high rate of zeolite (7.5 t ha−1) achieved the highest values of SOM (1.901% and 1.986%), whereas, in ATH, the highest value (1.916%) was recorded after the application of 5 t ha−1 zeolite. As for the N fertilization effect on this trait, a significant difference among treatments was only recorded in KAR, with the greatest value (1.970%) observed under the highest N rate (200 kg N ha−1).
In ATH and MES, soil total nitrogen (STN) was statistically affected by zeolite (Table 5), with the highest values found after the application of 7.5 t ha−1 zeolite, resulting in an increase of 6.61% and 5.77%, respectively, compared to the untreated (control). In a similar vein, the STN was also affected by N fertilization, with the highest values being recorded with N applied at 200 kg N ha−1 and the values being 0.129%, 0.111%, and 0.145% in ATH, MES, and KAR, respectively.
Zeolite and N fertilizer had a considerable impact on total porosity (TP) (Table 5). Concerning zeolite, except KAR, application at 7.5 t ha−1 led to significantly greater values compared to the untreated, leading to a percentage difference of 4.54% and 4.84% in ATH and MES, respectively. Regarding N fertilization, the highest TP values (45.78%, 41.32%, and 43.79% in ATH, MES, and KAR) were observed under the highest N fertilizer rate (200 kg N ha−1).
Mean weight diameter (MWD) was influenced by the zeolite and N fertilizer application (Table 5). In plots treated with 7.5 t ha−1 zeolite, the lowest MWD values were recorded, resulting in a decrease of 5.94%, 10.73%, and 6.54% in ATH, MES, and KAR, respectively, compared to the untreated. Additionally, the application of the highest N fertilizer rate also exhibited the highest MWD value, with these being 8.09, 8.48, and 7.94 mm in ATH, MES, and KAR, respectively.

3.2. Agronomic Traits and Yield Parameters of Cotton

As shown in Table 6, root length density (RLD) was affected by zeolite with the highest values (0.813, 0.797, and 0.839 cm cm−3 in ATH, MES, and KAR, respectively) found after the application of the high rate (7.5 t ha−1), and increased by 22.26%, 25.51%, and 21.95% in ATH, MES, and KAR, respectively, compared to the untreated. In a similar vein, the increasing rate of N fertilizer resulted in significantly higher RLD values, with the greatest values observed with N applied at 200 kg N ha−1 (0.902, 0.828, and 0.900 cm cm−3 in ATH, MES, and KAR, respectively).
According to the results of the current research, plant height was also affected by both examined factors across the three experimental trials (Table 6). Concerning the zeolite effect, the values of the experimental plots that received 7.5 t ha−1 zeolite were the greatest, increasing by 20.28%, 14.81%, and 17.41% in ATH, MES, and KAR, respectively, compared to the untreated. Concerning N fertilization, the greatest results were in plots where N fertilizer was applied at 200 kg N ha−1, with values of 114.9, 112.5, and 120.2 cm in ATH, MES, and KAR, respectively.
Concerning leaf area index (LAI), there were significant differences between plots that received zeolite as a soil amendment and those untreated. In all experimental sites, the highest values (2.83, 2.75, and 3.01 m3 m−3 in ATH, MES, and KAR, respectively) were observed after the application of the high rate of zeolite (Table 6). Regarding the effect of N fertilization, the greatest LAI values (3.04, 2.91, and 3.19 m3 m−3 in ATH, MES, and KAR, respectively) were observed in plots fertilized with 200 kg N ha−1, which increased by 27.20%, 27.07%, and 27.60% in ATH, MES, and KAR, respectively, in comparison to the untreated.
The dry weight of the cotton crop, as affected by the application of zeolite and inorganic N fertilizer, is presented in Table 6. Concerning zeolite, application at 7.5 t ha−1 resulted in substantially greater dry weight values compared to the untreated, leading to a percentage difference of 19.81%, 21.74%, and 21.32% in ATH, MES, and KAR, respectively. Regarding the N fertilization treatments, the highest dry weight values (5549, 5368, and 5593, in ATH, MES, and KAR, respectively) were noted following the highest rate of N fertilizer application.
As for boll number, there were no substantial differences between different zeolite regimes, with the values ranging between 75.9 and 76.8 m−2, 73.7 and 74.4 m−2, and 78.5 and 79.1 m−2 in ATH, MES, and KAR, respectively (Table 7). Similarly, the impact of N fertilization was not significant on this trait, with the values ranging between 75.9 and 76.9 m−2, 73.6 and 74.7 m−2, and 77.9 and 79.8 m−2 in the corresponding experimental trials.
On the contrary, boll weight was positively influenced by both zeolite addition and N fertilization, as shown in Table 7. Concerning the zeolite addition effect, the boll weight observed in plants of high zeolite rate (6.18, 6.19, and 6.22 g in ATH, MES, and KAR, respectively), were the greatest, increasing by 1.15%, 1.14%, and 1.63% in ATH, MES, and KAR, respectively, in comparison with the untreated. Regarding the influence of N fertilization, the greatest results were recorded in plots treated with the highest N rate (6.19, 6.20, and 6.22 g in ATH, MES, and KAR, respectively).
The findings of the current research reported that seed cotton yield, lint yield, as well as lint percentage were considerably impacted by zeolite and N fertilization regimes (Table 7). Increasing zeolite (from 0 to 7.5 t ha−1) and N fertilization rates (from 0 to 200 kg N ha−1) caused a significant increase in these yield parameters. Specifically, averaged over N fertilization regimes, the highest values for seed cotton yield, lint yield, and lint percentage were recorded in plots treated with 7.5 t ha−1 zeolite, with the results being 4745 kg ha−1, 1808 kg ha−1, and 38.1% for ATH; 4597 kg ha−1, 1723 kg ha−1, and 37.5% for MES; and 4921 kg ha−1, 1847 kg ha−1, and 37.8% for the KAR experimental site. In addition, averaged over zeolite addition treatments, the greatest results for the aforementioned variables were recorded in plots where N fertilizer was applied at 200 kg N ha−1, with the corresponding values of 4759 kg ha−1, 1804 kg ha−1, and 37.9% for ATH; 4634 kg ha−1, 1768 kg ha−1, and 38.1% for MES; and 4964 kg ha−1, 1911 kg ha−1, and 38.5% for the KAR experimental location.

3.3. Fiber Quality Parameters of Cotton

The ANOVA suggested that fiber maturity parameters, namely micronaire (MIC), maturity (MAT), fiber strength (STR), and elongation (ELG) were positively affected by both examined factors across the three experimental trials (Table 8).
Concerning MIC, the results of the present research indicated that the highest values for this fiber maturity parameter (4.55, 4.48, and 4.81 in ATH, MES, and KAR, respectively) were observed after zeolite addition at 7.5 t ha−1, leading to percentage differences of 27.09%, 33.73%, and 32.87% in ATH, MES, and KAR, respectively, compared to the untreated (Table 8). In the same manner, averaged over zeolite addition treatments, the highest values (4.27, 4.23, and 4.52 in ATH, MES, and KAR) were found after N fertilizer application at 200 kg N ha−1.
As presented in Table 8, MAT was influenced by zeolite, with the highest values (0.857%, 0.834%, and 0.886% in ATH, MES, and KAR, respectively) found after the application of the high rate (7.5 t ha−1), leading to increases of 4.77%, 4.64%, and 3.87% in ATH, MES, and KAR, respectively, in comparison with the untreated. In the same way, the increasing rate of N fertilizer resulted in significantly higher MAT values, with the highest values found with N applied at 200 kg N ha−1 (0.855%, 0.836%, and 0.888% in ATH, MES, and KAR, respectively).
In all experimental sites, STR was statistically influenced by zeolite (Table 8), with the highest values found after the application of 7.5 t ha−1 zeolite, leading to an increase of 16.03%, 16.74%, and 20.07% in ATH, MES, and KAR, respectively, in comparison with the untreated. In a similar vein, STR was also influenced by the application of N fertilizer, with the highest values being recorded with N applied at 200 kg N ha−1, yielding 32.72, 34.23, and 35.24 g tex−1 in ATH, MES, and KAR, respectively.
Regarding the zeolite effect on ELG, the highest values (11.44%, 10.98%, and 11.43% in ATH, MES, and KAR, respectively) were observed after the application of the high rate of zeolite (Table 8). Concerning the effect of N fertilizer application, the greatest values of ELG (11.17%, 10.67%, and 11.33% in ATH, MES, and KAR, respectively) were recorded in plots fertilized with 200 kg N ha−1, showing increases of 17.58%, 17.25%, and 15.03% in ATH, MES, and KAR, respectively, in comparison to the untreated.
The results of the fiber length traits, namely upper half mean length (UHML), uniformity index (UI), and short fiber index (SFI), as influenced by the addition of zeolite and N fertilizer, are presented in Table 9.
Zeolite and N fertilizer had a considerable impact on the UHML parameter (Table 9). Concerning zeolite, 7.5 t ha−1 treatment produced noticeably higher values compared to the untreated, leading to a percentage difference of 7.87%, 8.91%, and 6.01% in ATH, MES, and KAR, respectively. Regarding N fertilization, the greatest results of the UHML parameter (29.17, 28.67, and 30.80 mm, in ATH, MES, and KAR, respectively) were observed after the application of the highest N fertilizer rate.
According to Table 9, UI was positively influenced by both evaluated factors. In response to the zeolite addition effect, the UI values observed in plants of high zeolite rate (82.35%, 81.14%, and 85.96% in ATH, MES, and KAR, respectively) were the greatest, increasing by 3.61%, 3.96%, and 3.08% in ATH, MES, and KAR, respectively, compared to the untreated. As for the effect of N fertilizer application, the greatest results were recorded in plots treated with the highest N rate (81.97%, 80.77%, and 86.04% in ATH, MES, and KAR, respectively).
The SFI parameter was also significantly affected by the application of zeolite and N fertilizer (Table 9). In plots that received 7.5 t ha−1 zeolite, the highest SFI values were found, increasing by 36.78%, 37.29%, and 31.55% in ATH, MES, and KAR, respectively, compared to the untreated. Moreover, the addition of the highest N fertilizer led to the highest SFI values, leading to percentage differences of 27.86%, 28.30%, and 35.07% in ATH, MES, and KAR, respectively, as compared to the untreated.
Finally, the fiber color traits of cotton, namely fiber reflectance (Rd) and spinning consistency index (SCI), as well as the trash traits, namely trash area (TrAr) and trash grade (TrID), were significantly influenced by different zeolite treatments (Table 10). In particular, averaged over the different N fertilization rate treatments, the highest values of Rd, SCI, TrAr, and TrID were observed in plots treated with 7.5 t ha−1 zeolite, with the results being 78.56, 154.69, 0.916%, and 5.8 for ATH; 76.18, 151.54, 0.851%, and 5.0 for MES; and, 81.65, 162.50, 0.884%, and 5.3 for the KAR experimental site. In addition, averaged over zeolite regimes, the highest values of Rd, SCI, and TrAr were found in plots where N fertilizer was applied at 200 kg N ha−1, with the corresponding values being 76.83, 151.64, and 0.848% for ATH; 74.93, 148.98, and 0.901% for MES; and, 80.72, 162.34, and 0.822% for the KAR experimental trial. As for TrID, there were no significant differences among different N fertilization regimes, with values ranging between 4.7 and 5.1, 4.7 and 5.0, and 4.6 and 5.0 in ATH, MES, and KAR, respectively (Table 9).

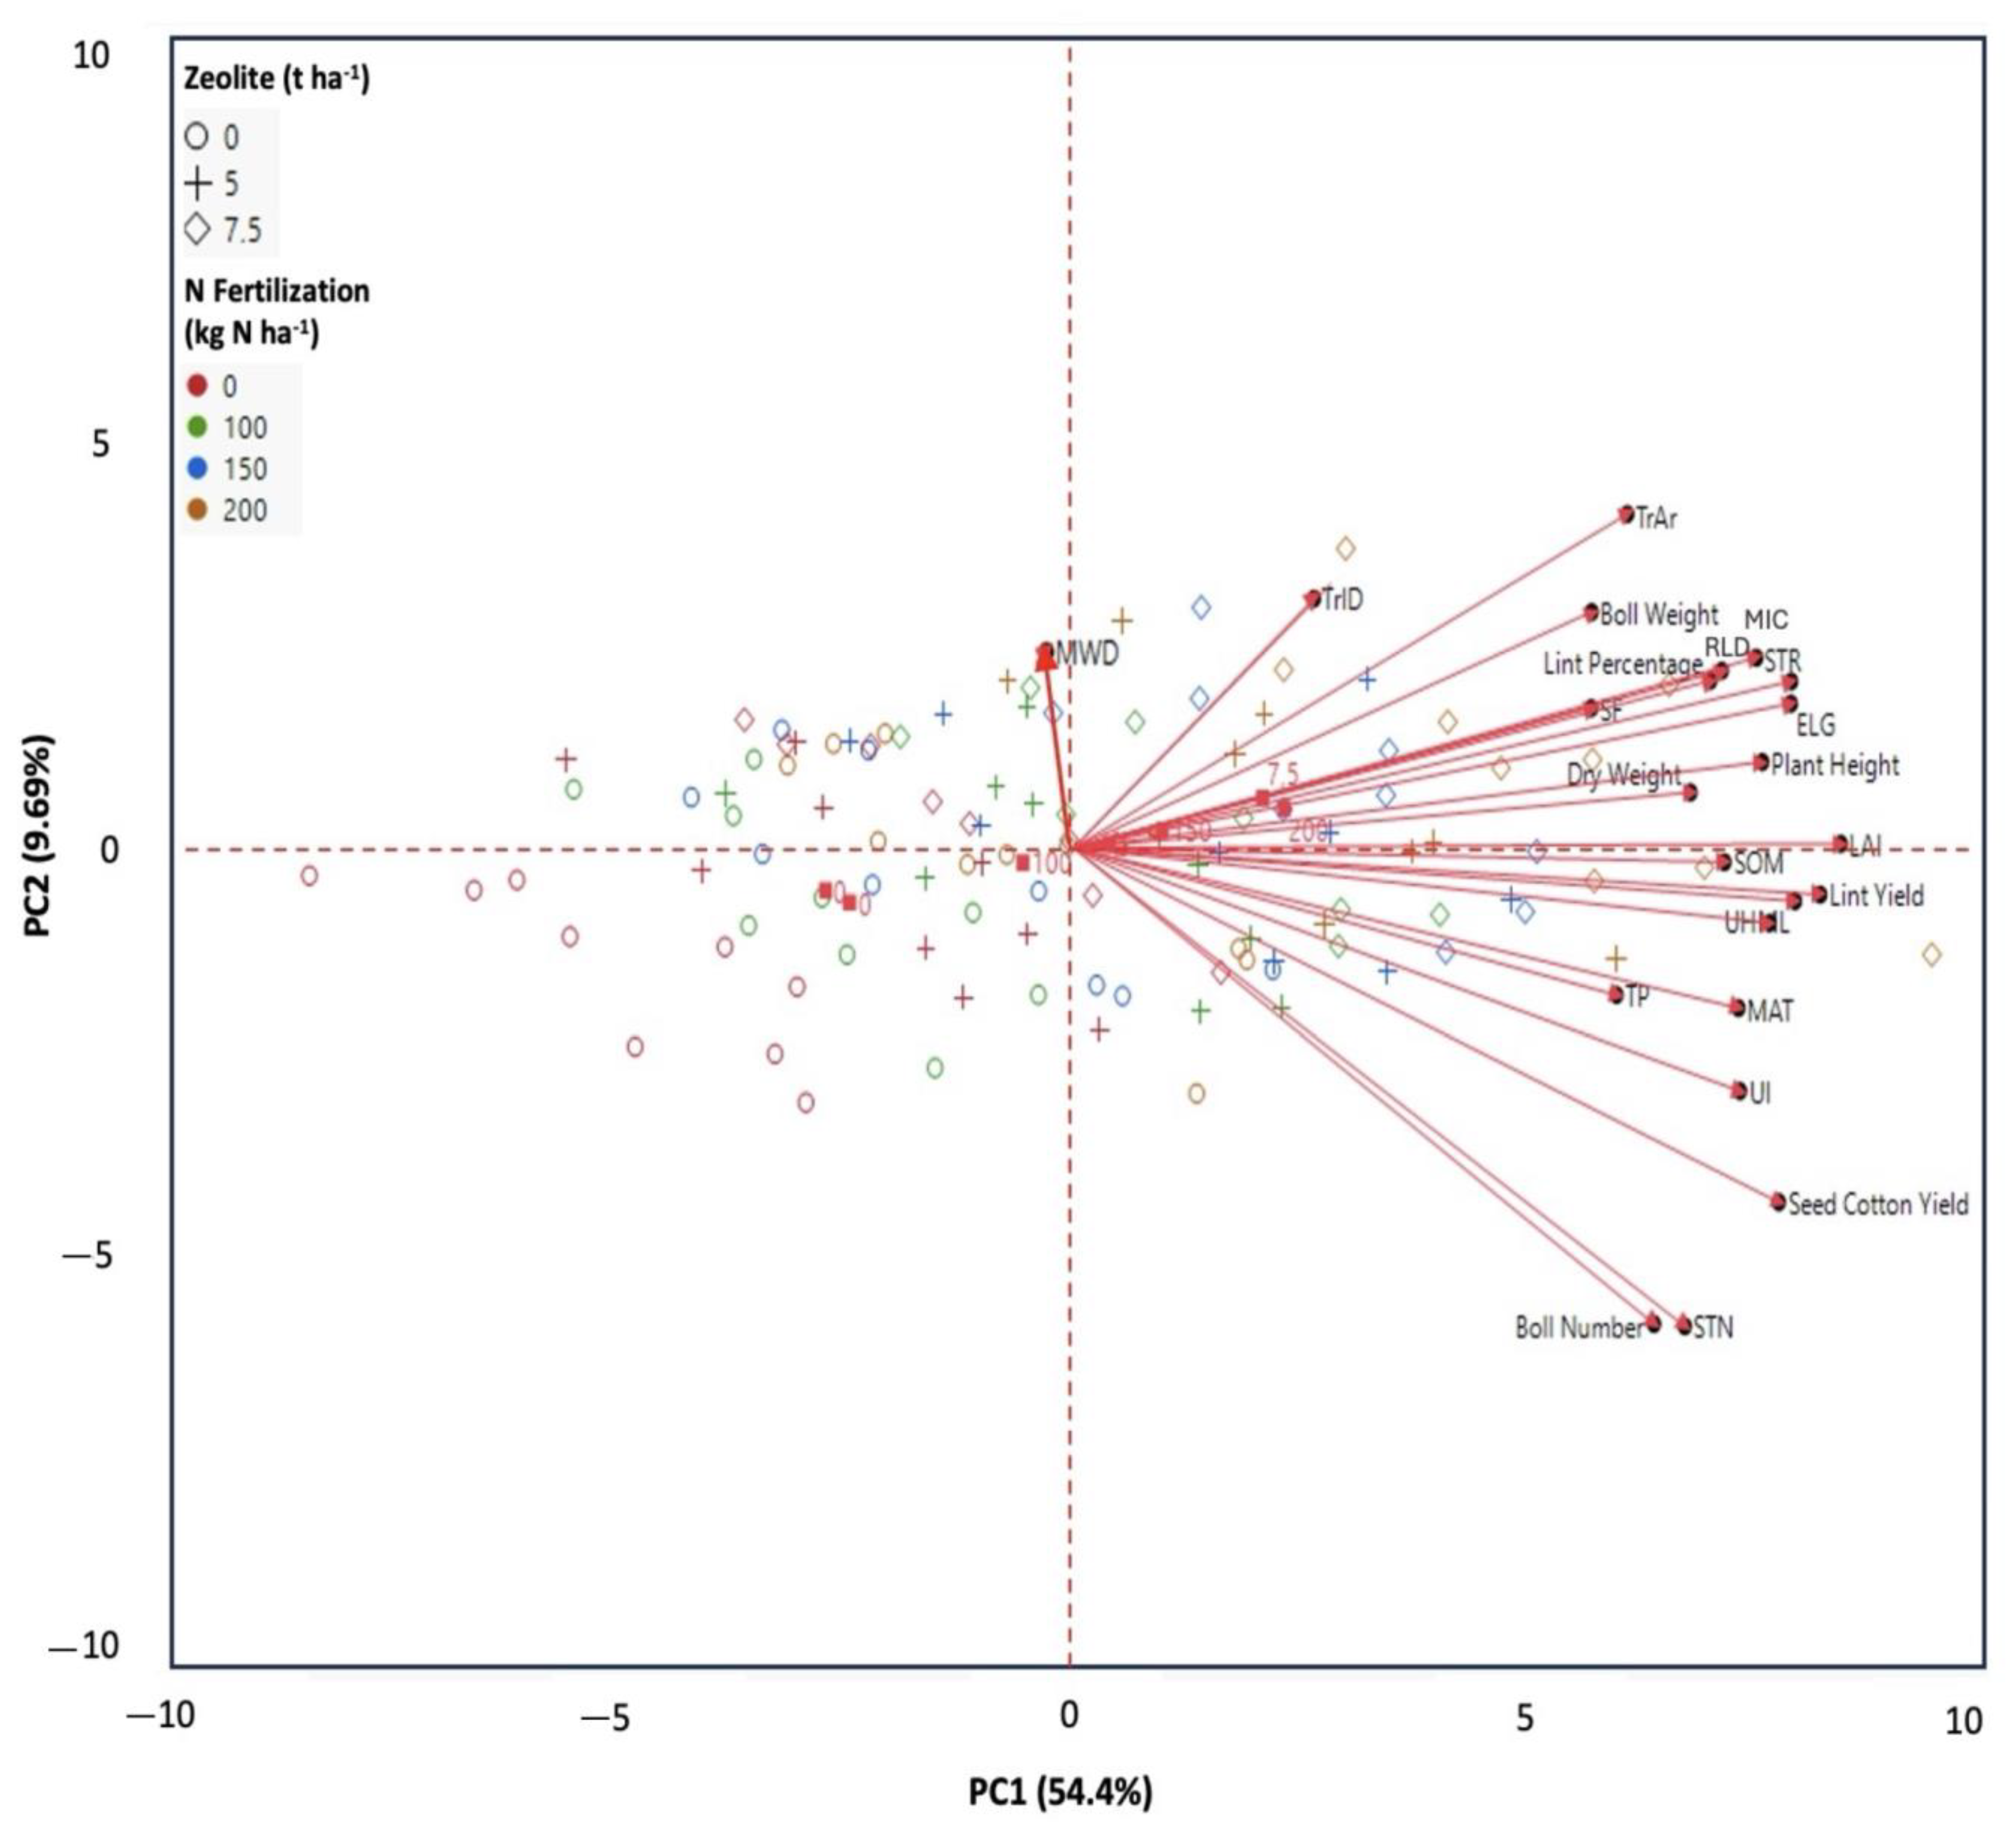
3.4. Principal Component Analysis (PCA) of Evaluated Variable

The principal component analysis (PCA) clarified 64.09% of the total variability, as presented in Figure 2. PC1 (54.4%) clarified the greatest amount of variation by distinguishing between the untreated plots of the two examined factors under study and the N fertilizer application at a level of 100 kg N ha−1 (on the negative site) and the zeolite addition treatments at amounts of 5 and 7.5 t ha−1, along with N fertilizer at levels of 150 and 200 kg N ha−1 (on the positive side). By separating the zeolite addition at amounts of 5 and 7.5 t ha−1 and N fertilizer application at levels of 150 and 200 kg N ha−1 (on the positive side) from the untreated plots of the two examined factors and N fertilizer at a level of 100 kg N ha−1 (on the negative side), PC2 demonstrated 9.69% of the total variance. The upper-right quadrant contained the N fertilizer application at 150 and 200 kg N ha−1 and the zeolite addition treatments at 5 and 7.5 t ha−1, which were more correlated with LAI, dry weight, plant height, ELG, SF, RLD, STR, MIC, lint percentage, boll weight, TrAr and TrID. In addition, N fertilizer at a level of 100 kg N ha−1 and the controls of the two examined factors were observed in the low-left quarter and showed no association with the examined variables.

4. Discussion

One of the main features of soil degradation is a lack of soil organic matter (SOM), which lowers soil fertility and reduces crop production potential [49]. The extensive use of chemical fertilizers and other artificial inorganic inputs, especially in arid and semi-arid areas where agricultural soils are decomposing, low in organic matter, and unable to retain water, has resulted in air pollution, groundwater contamination, soil organic matter loss, and a decline in crop production quality [50,51]. This aligns with the current study findings, which showed that the amount of SOM increased when zeolite was added as a soil amendment (Table 5). Furthermore, prior research has demonstrated a positive correlation between clay concentration and the preservation of soil organic carbon [24,52,53]. Consequently, the use of N fertilizer led to a rise in net primary productivity (NPP), which in turn led to a considerable improvement in SOM in the current research soils, which were classified as clay loams. As NPP increased, soil moisture and temperature decreased because of variations in transpiration and shade, resulting in a decrease in SOM mineralization [54,55].
Soil total nitrogen (STN) is increasingly recognized as a crucial parameter influencing soil fertility in both managed and natural ecosystems, and therefore, it is often used as a stand-in for the N condition of the soil [56]. Table 5 presents how varied N fertilizer rates affected the average STN in the current investigation. Specifically, a considerable rise in STN was observed as N rates increased, with the effect being more pronounced at high N rates. These findings are comparable with those from some previous investigations [57,58]. Regarding zeolite, it has direct or indirect beneficial effects on the physical, chemical, and biological characteristics of soil, which enhances nutrient retention and cycling. Because of the electrostatic interaction between positively charged NH4+ and negatively charged sites in zeolitic minerals, a high degree of NH4+ sorption selectivity is linked to a high cation exchange capacity (CEC) in these minerals [59]. When combined with chemical fertilizers, zeolites in the soil slow mineralization, decrease greenhouse gas emissions, decrease nitrogen leaching and volatilization, and postpone the release of nutrients into the soil solution [21]. Prior research investigated how chemical fertilizers and zeolite affected several field crops to absorb macronutrients, including N, and discovered that zeolite treatments marginally increased STN because of the unique and exceptional properties of zeolites on soil [24,60]. Furthermore, the growth in SOM was accompanied by notable increases in STN, indicating that SOM had organic N bound up. This is further supported by the significant linear correlation between SOM and STN (r = 0.627, p < 0.001; Figure 3).
Total porosity (TP) constitutes one of the most crucial physical properties of soil, which aids in nitrate and water infiltration as well as root growth. The current investigation found that increasing the zeolite application dose had a favorable effect on TP, with the greatest values recorded under the highest zeolite rate (Table 5). Utilizing zeolite raises soil TP, which generally enhances soil structure and could affect crop production measures including gas exchange and water transport [61]. In a previous study conducted by Kakabouki et al. [24], it was found that after the application of 7.5 t ha−1 zeolite in clay loam soil, TP increased by 5.36% as compared to the untreated. The zeolite caused the soil density to drop, the soil porosity to rise, and the soil structure to improve. High zeolite mineral porosity, and thus better soil composition and physical characteristics like TP and water retention, may also be related [62]. Furthermore, this feature appeared to benefit from a rise in the N fertilization rate. A previous study discovered that after a year-long field experiment on sandy clay loam soil for maize crop, mineral fertilizer applied at a rate of up to 200 kg N ha−1 enhanced soil TP by enlarging regular and irregular pores and created a priming effect of native SOM [63].
One measure of the physical characteristics of soil is the mean weight diameter (MWD) of the soil aggregates, which describes the quality of the soil structure. According to the current study, zeolite application had a negative impact on this trait (Table 5). This was most likely brought on by exchangeable Na+ supplied by zeolite replacing Ca2+ and Mg2+ on the soil clays, which resulted in the dispersion of soil particles [64,65]. Because flocculation of clay particles was a fundamental prerequisite for the formation of aggregates, this led to the dissolution of soil aggregation [65]. In addition, this phenomenon can also be explained by the size of zeolite particles. Specifically, because zeolites range in size from 2.5 to 5 mm, the soil matrix particles’ agglomeration and smoothness decreased [65]. As for N fertilization, it seemed to have a positive impact on this trait, especially under high N rates (Table 5). The inclusion of cementing materials that produce nitrogen may be connected to this phenomenon. Smaller soil particles have been shown to enter big, water-stable soil aggregates when high N fertilizer is applied; these aggregates have been linked to root systems and secretions [66].
Robust root systems are essential for boosting crop yields because crops can store photosynthetic products in their leaves, stems, seeds, and roots. To absorb enough amounts of water and nutrients, particularly when biotic or abiotic stress is present, a well-developed root system is necessary, with root development and dispersion being essential characteristics [67]. Concerning the N fertilizing impact, it was shown that the root length density (RLD) increased as the administered N rate increased. Gregory [68] noted that RLD was significantly enhanced by the addition of N fertilizer to the soil. Additionally, several studies found that N fertilizer significantly boosts root growth, especially in soils with low levels of SOM (1–2.5%) [69]. Depending on the crop species being grown, zeolite composites might have varying effects on root shape and development [70]. In the current study, zeolite used as a soil amendment raised RLD in comparison to cotton, which did not receive a soil amendment. This outcome is consistent with studies by Wu et al. [71] and Kakabouki et al. [24], which found that zeolite application at a rate of 7.5 t ha−1, can enhance root growth in rice and maize plants, respectively.
Zeolite can enhance plant growth and development by boosting the long-term availability of nutrients and water [22,72]. Because of its porous structure, zeolite can keep water in the rhizosphere for long periods and create humidity horizontally [73]. Reduced nitrification and N leaching, regulated nutrient release, and selective absorption are some advantages of using zeolite for vegetative development [74]. The open-ringed structure’s small molecular size provides physical protection for NH4+ ions against microbiological nitrification [22]. Thus, it seems that higher N uptake caused cotton to grow taller. Additionally, the addition of N through inorganic N fertilizer increased the synthesis of cytokines, which in turn affected the number of meristematic cells, cell proliferation, and cell wall elasticity [75]. Consequently, following the N fertilizer application at the maximum rate under investigation (200 kg N ha−1), the highest values of plant height were noted (Table 6).
Both zeolite addition and N fertilization greatly increased the cotton crop’s dry weight and leaf area index (LAI) (Table 6). Prior research showed that a greater supply of zeolite as soil amendment improves LAI and photosynthetic efficiency in a variety of field crops due to its slow-release nature and higher ammonium retention capacity, which boost N availability to plants [21,24]. Other studies have also noted an increase in plant biomass as a result of more nitrogen being available when N fertilizer as well as zeolite was added as a soil amendment [21,22]. Furthermore, because accessible N is required for the enzymes phosphoenolpyruvate carboxylase (PEPcase), ribulose-1,5-bisphosphate carboxylase (RuBPCase), and chlorophyll a and b, it has been shown to impact the photosynthetic processes of plants [76,77,78,79]. In fact, according to previous research, plant biomass increases with the amount of chlorophyll a and chlorophyll b present [76,77,78]. These variables, together with the ratio of relative soluble protein, total N content, carboxylase activity, and chlorophyll concentration, all contribute to accelerating photosynthesis and supplying the required nutrients and photosynthetic products to the plant and seed [76]. In the present study, higher N levels in the 200 kg N ha−1 treatment, along with improved growth and development of the plant’s aboveground components, particularly the leaf area, resulted in higher photosynthetic rates, which ultimately led to the maximum dry weight. The LAI and dry weight of cotton have a strong correlation (r = 0.712, p < 0.001; Figure 3), confirming this association.
As the amounts of N and zeolite fertilization increased, the seed yield correspondingly increased (Table 7). Using zeolite as a soil amendment has been demonstrated in numerous studies to improve crop yields for a range of crops, including maize, wheat, sunflower, soybean, rapeseed, rice, and sugar cane [80,81]. Zeolite’s high porosity increased water-holding capacity, and very substantial cation exchange capacity all help to increase seed cotton yield. In addition, it improves nutrient uptake by plants by making nutrients more accessible through different amounts of application. Furthermore, zeolite’s capacity to release minerals gradually reduces the loss of vital nutrients. Applying varying amounts of zeolite seems to improve the seed cotton yield. The largest yields were obtained when cotton plants received the maximum quantity of N and zeolite supplementation, according to Kathade et al. [25], who used zeolite at varied rates in conjunction with different quantities of N. Cotton needs large amounts of N, which is the main nutrient for growth and development [82]. Accordingly, fiber quality is strongly impacted by appropriate nutritional management linked to genetic and environmental factors [83]. Given that crop yield is correlated with the variable lint percentage, it is feasible to conclude that greater lint percentage values attained with N increase show that N fertilization improves yields [84]. According to several studies, applying N fertilizers to cotton crops greatly increases the number of bolls, suggesting that cotton is responsive to N and has a wide absorption capacity. As a result, using nitrogen increases the yield and lint percentage [82,85]. This was supported by the current investigation, which found a strong and positive association between seed cotton yield, lint yield, lint percentage, and boll weight (Figure 3). Furthermore, varied zeolite and fertilization treatments had no significant effect on boll number (Table 7). This parameter is generally influenced by a wide range of factors, including soil properties, climate, cultivation methods, and genetic potential, i.e., cotton variety. Similar to Nie et al. [86], this result demonstrated that location and cotton cultivar significantly influenced this parameter.
As for fiber maturity traits, micronaire (MIC) had a positive response to the highest rates of zeolite addition (7.5 t ha−1) and N fertilization (200 kg N ha−1) (Table 8). Given that the MIC is a crucial metric, these findings could have a direct impact on fiber quality [87]. The thickness and maturity of the fiber are correlated with the MIC index; values below 3.5 show the production of immature fibers and variations in fiber dyeing, while values above 5.0 are categorized as low resistance, which lowers the fiber’s value and is above the level that the market accepts [88]. The activity of essential enzymes, which are involved in processes that directly impact the synthesis, structure, and characteristics of cotton fibers, as well as playing vital roles in the metabolism of proteins and carbohydrates, is intimately related to the correct presence of N [85].
In the same manner, fiber maturity (MAT) was also favorably impacted by the two parameters that were investigated, with the greatest results observed in 7.5 t ha−1 zeolite (0.857%, 0.834%, and 0.886% in ATH, MES, and KAR, respectively) and N fertilization at a rate of 200 kg N ha−1 (0.855%, 0.836%, and 0.888% in ATH, MES, and KAR, respectively) (Table 8). According to da Silva Ribeiro [85], the values of this parameter are regarded as one of the most crucial aspects of fiber quality for the textile industry. Since immature fibers result in weaker yarns that may unravel during the spinning process, low fiber maturity is one of the issues facing the textile industry [89]. Research indicates that N is essential for the growth and maturity of cotton fibers. Specifically, Khan et al. [90] demonstrated how appropriate N treatment can encourage fiber growth and development, leading to full maturity. The physiological, biochemical, and morphological processes of plants are connected to the interaction between N and MAT [91]. N affects the production of cellular substances like cellulose and lignin, which are essential parts of cotton fibers’ cell walls. A sufficient supply of N can promote the deposition of these substances, resulting in a thicker cell wall and, ultimately, higher fiber maturity [90]. It is important to remember, nevertheless, that cotton plants’ reactions to N might differ based on several variables, including the type, time, and dosage of fertilizer applied, as well as the particular soil, soil amendments used, and climate [32]. In addition, according to previous research, high N dosages might cause excessive vegetative growth at the expense of fiber development, which lowers fiber quality and reduces MAT [85].
The findings’ assessment demonstrates how important fiber elongation (ELG) is for creating high-quality textile products. The current study found that the increasing rates of both examined factors had a favorable effect on ELG, with the greatest values observed in 7.5 t ha−1 zeolite (11.44%, 10.98%, and 11.43% in ATH, MES, and KAR, respectively) and N fertilization at a rate of 200 kg N ha−1 (11.17%, 10.67%, and 11.93% in ATH, MES, and KAR, respectively) (Table 8), ranking in the category of very high ELG (>7.6%). Fibers with greater ELG are best suited for creating higher-quality textile products because they enhance tensile characteristics, reducing the likelihood of breakage and yarn flaws [42]. Longer fibers with higher mechanical strength can be produced by encouraging ELG during the cotton growth cycle with adequate N availability [92]. Furthermore, plants’ production of proteins and carbohydrates—two crucial building components of cotton fibers—can be impacted by N fertilization [93]. Previous research proved that applying N in sufficient amounts can greatly boost the synthesis of structural proteins in fibers, which in turn helps to improve the fibers’ strength and flexibility [85,93].
The results of the fiber strength (STR) are shown in Table 8. As with MIC, MAT, and ELG, STR presented a similar positive trend after the application of zeolite and N fertilization, presenting significant variation among fertilized and unfertilized plants. This difference between treated and untreated plants emphasizes how essential and intricate nutritional management is. The weaving process, quality, and productivity are all much enhanced by the fiber’s strength, which also increases its commercial value [94]. It has been proved that the ELG and thickness of the cell wall control the fiber STR [95]. Cell elongation and cellulose production from the secondary cell wall essentially mediate fiber STR and length, which are the most important quality attributes for the industry [94]. Therefore, for the utilization of this crop in the textile industry to continue to grow, research showing nutritional management techniques that can improve fiber STR and length is crucial.
The four stages of differentiation and development—initiation, elongation, secondary cell wall synthesis, and maturity—define fiber length, a variable that is primarily governed by gene expression [95]. However, since the fibers’ elongation occurs during the anthesis phase, cultivation practices that encourage the development of flower buds also have an indirect impact on the differentiation process [96]. In light of this, the current study’s findings support the notion that increasing N enhances fiber length. As observed in Table 9, the increasing rates of both examined factors had a favorable effect on upper half mean length (UHML), with the greatest values observed in 7.5 t ha−1 zeolite (29.73, 29.21, and 30.83 mm in ATH, MES, and KAR, respectively) and N fertilization at a rate of 200 kg N ha−1 (29.17, 28.67, and 30.80 mm in ATH, MES, and KAR, respectively).
The uniformity index (UI) also has a similar trend to UHML (Table 9), showing increasing values as zeolite and N fertilization rates increased. This finding would suggest that N fertilization enhances the structural and chemical composition of the secondary cell wall, favoring the fiber’s characteristics [95]. Accordingly, optimal N supply circumstances encourage better cotton development and fiber quality, but a lack of this element can restrict cell division and expansion [97]. In addition, cultural methods such as fertilization and cultivar-specific factors might affect the typical uniformity of fiber length. Furthermore, the textile sector depends heavily on this consistent length distribution, and as it has been demonstrated, using N has improved length uniformity [97].
Zeolite addition at a rate of 5 t ha−1 and N fertilization at a dose of 100 kg N ha−1 have the best short fiber index (SFI) values (Table 9), with the textile industry accepting values below 10% [85]. However, the fibers were deemed to have limited economic potential because zeolite addition and N fertilization at rates of 7.5 t ha−1 and 200 kg N ha−1, respectively, showed values greater than 10%. According to Elmogahzy and Farag [94], a large proportion of short fibers produces yarns with varying thicknesses that break in the weakest and thinnest areas throughout the spinning and weaving operations.
In the present study, lint percentage, MIC, MAT, STR, and ELG all showed positive relations (Figure 3). Additionally, UHML and UI (r = 0.726, p < 0.001), as well as ELG and SFI (r = 0.549, p < 0.001), showed favorable associations (Figure 3). The positive correlations recorded highlight the simultaneous effect of the examined factors on the development and fiber quality of cotton.
Fiber reflectance (Rd) is used to estimate the color brightness of cotton lint [47]. Both of the factors under investigation had a significant impact on Rd in this study. The highest zeolite and N fertilization rates were positively associated with higher values for Rd (Table 10). According to previous studies, the growth environment [98], planting date and genotype [99], and harvesting methods [100] are all directly related to the color of the fiber and its reflectance. In contrast to our study, previous research demonstrated that applying N causes denser canopies, rank growth, and enhanced vegetative growth, which lowers light intensity and increases insect secretions and attractiveness [100].
As for the spinning consistency index (SCI), a measure for predicting the overall quality and spin ability of cotton fiber, this was also positively affected by zeolite and N fertilization (Table 10). Specifically, at ATH and KAR, the highest rates of examined factors resulted in values of SCI higher than 150, and consequently, their fibers are characterized by the highest grade level of the SCI as A++ [48]. In line with SCI variations in earlier research, higher SCI values at ATH and KAR environments may be associated with climatic (temperature and precipitation) variability [32].
Finally, cotton trash traits, specifically trash area (TrAr) and trash grade (TrID), were dominantly affected by zeolite and N fertilization, except N fertilization on TrID, where the differences among different regimes were not significant (Table 10). In general, there was a tendency for these traits to increase with the increase in the rates of the examined factors. According to the literature, these traits are affected by both environmental factors and cultivation methods [44]. Late blooming, in particular, regrowth, will result in issues with cotton’s fiber quality both directly (as indicated by decreased MIC and increased neps) and indirectly (as indicated by lower grades and higher trash content) [44]. At the same time, inadequate and delayed defoliation can significantly affect the quantity of leaf trash [101]. Severe weed competition in cotton, however, can have detrimental consequences on both trash contamination and fiber quality. Furthermore, plucking and defoliation procedures may be hampered by excessively high N rates that result in late regrowth. Late-season insects are supported by unnecessary and late-season rainfall, which can lower production and quality. Leafy crops can also cause boll rot in humid or rainy conditions [102].

5. Conclusions

As a result of the present study, both zeolite treatments and different N fertilizer rates had an essential impact on soil quality indicators. SOM, STN, and TP were favorably impacted by the factors studied and increased, but MWD showed the opposite trend when zeolite was added to the soil. As for root and shoot development (RLD, plant height, LAI, and dry weight), and cotton yields (seed cotton yield, lint yield, and lint percentage), both factors were positively influenced, and the greatest results were obtained at the maximum examined rate of the evaluated treatments. In terms of yield components, boll weight was also favorably impacted by the factors under investigation. Significantly higher fiber maturity traits (MIC, MAT, STR, and ELG), fiber length traits (UHML, UI, and SFI), as well as color (Rd and SCI) and trash traits (TrAr and TrID), were found in cotton plants that received the highest zeolite rate. A similar trend was also presented in all fiber quality parameters in the case of N fertilization, except TrID, where the differences among N fertilization regimes were not significant. In conclusion, the results of the current investigation indicate that raising the rates of zeolite and N fertilization to 7.5 t ha−1 and 200 kg N ha−1, respectively, improved soil properties (except MWD), stimulated crop development, and enhanced cotton and lint yield, as well as improved the fiber maturity, length, and color parameters of cotton grown in clay-loam soils under Mediterranean conditions. However, a longer-term study is needed to evaluate the seasonality and the long-term effects of zeolite addition as a viable, sustainable alternative or supplement to synthetic fertilizers on soil properties and cotton crop performance under these or different agroclimatic conditions.

Author Contributions

Conceptualization, I.K. and I.R.; methodology, I.K., A.M., P.S., P.K., K.P., A.F., D.B., and I.R.; validation, I.K., A.M., P.S., P.K., K.P., A.F., D.B., and I.R.; investigation, I.K., A.M., P.S., P.K., K.P., A.F., D.B., and I.R.; resources, I.K., I.R., A.M., and P.S.; data curation, I.K., I.R., A.M., and P.S.; writing—original draft preparation, I.K., I.R., A.M., and P.S.; writing—review and editing, I.K., I.R., A.M., K.B., and P.S.; supervision, I.K. All authors have read and agreed to the published version of the manuscript.

Funding

This research was funded by AVGI Ltd. The code number of this project on the Special Account of the Agricultural University of Athens is 80250.

Data Availability Statement

Data are contained within the article.

Conflicts of Interest

The authors declare no conflicts of interest. The funders had no role in the design of the study; in the collection, analyses, or interpretation of data; in the writing of the manuscript; or in the decision to publish the results.

Abbreviations

The following abbreviations are used in this manuscript:
ELGElongation
LAILeaf area index
MATMaturity
MICMicronaire
MWDMean weight diameter
NNitrogen
PCAPrincipal component analysis
RdFiber reflectance
RLDRoot length density
SCISpinning consistency index
SFIShort fiber index
SOMSoil organic matter
STNSoil total nitrogen
STRFiber strength
TPTotal porosity
TrArTrash area
TrIDTrash grade
UHMLUpper half mean length
UIUniformity index

References

  1. Khan, M.A.; Wahid, A.; Ahmad, M.; Tahir, M.T.; Ahmed, M.; Ahmad, S.; Hasanuzzaman, M. World cotton production and consumption: An overview. In Cotton Production and Uses: Agronomy, Crop Protection, and Postharvest Technologies; Springer: Singapore, 2020. [Google Scholar]
  2. Ali, M.A.; Farooq, J.; Batool, A.; Zahoor, A.; Azeem, F.; Mahmood, A.; Jabran, K. Cotton production in Pakistan. In Cotton Production; John Wiley & Sons Ltd.: Hoboken, NJ, USA, 2019; Volume 249. [Google Scholar]
  3. Sarwar, G.; Nazir, A.; Rizwan, M.; Shahzadi, E.; Mahmood, A. Genetic diversity among cotton genotypes for earliness, yield and fiber quality traits using correlation, principal component and cluster analyses. Sarhad J. Agric. 2021, 37, 307–314. [Google Scholar] [CrossRef]
  4. Yasar, M. Yield and fiber quality traits of cotton (Gossypium hirsutum L.) cultivars analyzed by biplot method. J. King Saud Univ. Sci. 2023, 35, 102632. [Google Scholar] [CrossRef]
  5. Hussain, K.; Ilyas, A.; Ali, S.; Bibi, I.; Shakil, Q.; Farid, M.U.; Saqib, Z.A.; Habib, A.; Hakki, E.E. Impacts of nitrogen fertilizer application and mulching on the morpho-physiological and yield-related traits in cotton. Agriculture 2023, 13, 12. [Google Scholar] [CrossRef]
  6. Tariq, M.; Afzal, M.N.; Muhammad, D.; Ahmad, S.; Shahzad, A.N.; Kiran, A.; Wakeel, A. Relationship of tissue potassium content with yield and fiber quality components of Bt cotton as influenced by potassium application methods. Field Crops Res. 2018, 229, 37–43. [Google Scholar] [CrossRef]
  7. Dhakal, C.; Lange, K.; Parajulee, M.N.; Segarra, E. Dynamic optimization of nitrogen in plateau cotton yield functions with nitrogen carryover considerations. J. Agric. Appl. Econ. 2019, 51, 385–401. [Google Scholar] [CrossRef]
  8. Iqbal, A.; Qiang, D.; Zhun, W.; Xiangru, W.; Huiping, G.; Hengheng, Z.; Nianchang, P.; Xiling, Z.; Meizhen, S. Growth and nitrogen metabolism are associated with nitrogen-use efficiency in cotton genotypes. Plant Physiol. Biochem. 2020, 149, 61–74. [Google Scholar] [CrossRef]
  9. Shah, A.N.; Javed, T.; Singhal, R.K.; Shabbir, R.; Wang, D.; Hussain, S.; Anuragi, H.; Jinger, D.; Pandey, H.; Abdelsalam, N.R.; et al. Nitrogen use efficiency in cotton: Challenges and opportunities against environmental constraints. Front. Plant Sci. 2022, 13, 970339. [Google Scholar] [CrossRef]
  10. Devkota, M.; Martius, C.; Lamers, J.P.A.; Sayre, K.D.; Devkota, K.P.; Vlek, P.L.G. Tillage and nitrogen fertilization effects on yield and nitrogen use efficiency of irrigated cotton. Soil Till Res. 2013, 134, 72–82. [Google Scholar] [CrossRef]
  11. Chen, B.L.; Yang, H.K.; Song, W.C.; Liu, C.Y.; Xu, J.; Zhao, W.Q.; Zhou, Z. Effect of N fertilization rate on soil alkali-hydrolyzable N, subtending leaf N concentration, fiber yield, and quality of cotton. Crop J. 2016, 4, 323–330. [Google Scholar] [CrossRef]
  12. Chen, Z.; Tao, X.; Khan, A.; Tan, D.K.; Luo, H. Biomass accumulation, photosynthetic traits and root development of cotton as affected by irrigation and nitrogen-fertilization. Front. Plant Sci. 2018, 9, 173. [Google Scholar] [CrossRef]
  13. Niu, J.; Gui, H.; Iqbal, A.; Zhang, H.; Dong, Q.; Pang, N.; Wang, S.; Wang, Z.; Wang, X.; Yang, G.; et al. N-use efficiency and yield of cotton (G. hirsutumn L.) are improved through the combination of N-fertilizer reduction and N-efficient cultivar. Agronomy 2021, 11, 55. [Google Scholar] [CrossRef]
  14. Luo, Z.; Liu, H.; Li, W.P.; Zhao, Q.; Dai, J.L.; Tian, L.W.; Dong, H. Effects of reduced nitrogen rate on cotton yield and nitrogen use efficiency as mediated by application mode or plant density. Field Crops Res. 2018, 218, 150–157. [Google Scholar] [CrossRef]
  15. Ahmed, M.; Rauf, M.; Mukhtar, Z.; Saeed, N.A. Excessive use of nitrogenous fertilizers: An unawareness causing serious threats to environment and human health. Environ. Sci. Poll. Res. 2017, 24, 26983–26987. [Google Scholar] [CrossRef] [PubMed]
  16. Ijaz, M.; Hussain, I.; Tahir, M.; Shahid, M.; Ul-Allah, S.; Zafar, M.; Rasheed, I.; Nawaz, A. Alternatives to synthetic fertilizers. In Agricultural Waste; Apple Academic Press: Palm Bay, FL, USA, 2021. [Google Scholar]
  17. Ahmad, S.; Hussain, I.; Ghaffar, A.; Rahman, M.H.U.; Saleem, M.Z.; Yonas, M.W.; Hussnain, H.; Ikram, R.M.; Arslan, M. Organic amendments and conservation tillage improve cotton productivity and soil health indices under arid climate. Sci. Rep. 2022, 12, 14072. [Google Scholar] [CrossRef]
  18. Cataldo, E.; Salvi, L.; Paoli, F.; Fucile, M.; Masciandaro, G.; Manzi, D.; Masini, C.M.; Mattii, G.B. Application of zeolites in agriculture and other potential uses: A review. Agronomy 2021, 11, 1547. [Google Scholar] [CrossRef]
  19. Garbowski, T.; Bar-Michalczyk, D.; Charazińska, S.; Grabowska-Polanowska, B.; Kowalczyk, A.; Lochyński, P. An overview of natural soil amendments in agriculture. Soil Tillage Res. 2023, 225, 105462. [Google Scholar] [CrossRef]
  20. Grifasi, N.; Ziantoni, B.; Fino, D.; Piumetti, M. Fundamental properties and sustainable applications of the natural zeolite clinoptilolite. Environ. Sci. Pollut. Res. 2024. [Google Scholar] [CrossRef]
  21. Mondal, M.; Biswas, B.; Garai, S.; Sarkar, S.; Banerjee, H.; Brahmachari, K.; Bandyopadhyay, P.K.; Maitra, S.; Brestic, M.; Skalicky, M.; et al. Zeolites enhance soil health, crop productivity and environmental safety. Agronomy 2021, 11, 448. [Google Scholar] [CrossRef]
  22. Jarosz, R.; Szerement, J.; Gondek, K.; Mierzwa-Hersztek, M. The use of zeolites as an addition to fertilisers—A review. Catena 2022, 213, 106125. [Google Scholar] [CrossRef]
  23. Legese, W.; Taddesse, A.M.; Kibret, K.; Wogi, L. Effects of natural and modified zeolite based composite fertilizers on slow release and nutrient use efficiency. Heliyon 2024, 10, e25524. [Google Scholar] [CrossRef]
  24. Kakabouki, I.; Roussis, I.; Mavroeidis, A.; Stavropoulos, P.; Kanatas, P.; Pantaleon, K.; Folina, A.; Beslemes, D.; Tigka, E. Effects of zeolite application and inorganic nitrogen fertilization on growth, productivity, and nitrogen and water use efficiency of maize (Zea mays L.) cultivated under Mediterranean conditions. Sustainability 2025, 17, 2178. [Google Scholar] [CrossRef]
  25. Kathade, P.; Age, A.B.; Kankal, D.S.; Bhoyar, S.M.; Gaikwad, G.; Solanke, P.S. Effect of natural zeolite on yield, nutrient uptake of cotton and available fertility status of soil in saline tract of Purna Valley. Int. J. Adv. Biochem. Res. 2024, 8, 662–667. [Google Scholar] [CrossRef]
  26. HNMS. Climate atlas of Greece. Available online: http://climatlas.hnms.gr/sdi/?lang=EN (accessed on 10 March 2025).
  27. IUSS Working Group WRB. World Reference Base for Soil Resources. In International Soil Classification System for Naming Soils and Creating Legends for Soil Maps, 4th ed.; International Union of Soil Sciences (IUSS): Vienna, Austria, 2022. [Google Scholar]
  28. Greek Ministry of Rural Development and Food. National Plant Variety Catalogue. Available online: https://www.minagric.gr/for-farmer-2/crop-production/polylikomenu/549-nomothesia-polyliko/553-cat-poik-polyliko (accessed on 11 March 2025). (In Greek).
  29. Greek Payment Authority of Common Agricultural Policy (C.A.P.). Aid Schemes (OPEKEPE). Available online: https://www.opekepe.gr/en/ (accessed on 11 March 2025).
  30. Aygün, Y.Z.; Mert, M. Effects of soil conditioners and nitrogen applications on cotton (Gossypium hirsutum L.) yield and fiber technological properties. Biol. Divers. Conserv. 2020, 3, 290–297. [Google Scholar] [CrossRef]
  31. Stamatiadis, S.; Tsadilas, C.; Samaras, V.C.; Schepers, J.S.; Eskridge, K.M. Nitrogen uptake and N-use efficiency of Mediterranean cotton under varied deficit irrigation and N fertilization. Eur. J. Agron. 2016, 73, 144–151. [Google Scholar] [CrossRef]
  32. Karydogianni, S.; Darawsheh, M.K.; Kakabouki, I.; Zisi, C.; Folina, A.E.; Roussis, I.; Tselia, Z.; Bilalis, D. Effect of nitrogen fertilizations, with and without inhibitors, on cotton growth and fiber quality. Agron. Res. 2020, 18, 432–449. [Google Scholar]
  33. IERSD/NOA. Weather Data. Available online: https://meteosearch.meteo.gr/data/index.cfm (accessed on 11 March 2025).
  34. Walkley, A.; Black, I.A. An examination of the Degtjareff method for determining soil organic matter, and a proposed modification of the chromic acid titration method. Soil Sci. 1934, 37, 29–38. [Google Scholar] [CrossRef]
  35. Bremner, J.M. Determination of nitrogen in soil by Kjedahl method. J. Agric. Sci. 1960, 55, 11–33. [Google Scholar] [CrossRef]
  36. Van Bavel, C.M. MWD of soil aggregates as a statistical index of aggregation. Soil Sci. Soc. Am. Proc. 1949, 14, 20–23. [Google Scholar] [CrossRef]
  37. Lutz, J.F. Apparatus for collecting undisturbed soil samples. Soil Sci. 1947, 64, 399–401. [Google Scholar] [CrossRef]
  38. Kokko, E.G.; Volkmar, K.M.; Gowen, B.; Entz, T. Determination of total root surface area in soil core samples by image analysis. Soil Tillage Res. 1993, 26, 33–43. [Google Scholar] [CrossRef]
  39. Kakabouki, I.; Karydogianni, S.; Roussis, I.; Bilalis, D. Effect of organic and inorganic fertilization on weed flora and seed yield in black mustard [Brassica nigra (L.) Koch] crops. Int. J. Agric. Nat. Resour. 2020, 47, 79–89. [Google Scholar] [CrossRef]
  40. Pei, W.; Song, J.; Wang, W.; Ma, J.; Wu, M.; Yu, J. Quantitative trait locus analysis and identification of candidate genes for micronaire in an interspecific backcross inbred line population of Gossypium hirsutum × Gossypium barbadense. Front. Plant Sci. 2021, 12, 763016. [Google Scholar] [CrossRef] [PubMed]
  41. Liu, Y.; Tao, F.; Yao, H.; Kincaid, R. Feasibility study of assessing cotton fiber maturity from near infrared hyperspectral imaging technique. J. Cotton Res. 2023, 6, 21. [Google Scholar] [CrossRef]
  42. Mathangadeera, R.W.; Hequet, E.F.; Kelly, B.; Dever, J.K.; Kelly, C.M. Importance of cotton fiber elongation in fiber processing. Ind. Crop. Prod. 2020, 147, 112217. [Google Scholar] [CrossRef]
  43. Gundim, C.P.; Cardoso, D.B.O.; Miranda, M.C.C.D.; Silveira, V.M.D.; Medeiros, L.A.; Sousa, L.B.D. Productivity and quality of cotton fiber in different planting seasons. Biosci. J. 2020, 36, 2068–2077. [Google Scholar] [CrossRef]
  44. Darawsheh, M.K.; Beslemes, D.; Kouneli, V.; Tigka, E.; Bilalis, D.; Roussis, I.; Karydogianni, S.; Mavroeidis, A.; Triantafyllidis, V.; Kosma, C.; et al. Environmental and regional effects on fiber quality of cotton cultivated in Greece. Agronomy 2022, 12, 943. [Google Scholar] [CrossRef]
  45. Günaydin, G.K.; Soydan, A.S.; Palamutçu, S. Evaluation of cotton fibre properties in compact yarn spinning processes and investigation of fibre and yarn properties. Fibres Text. East. Eur. 2018, 3, 23–34. [Google Scholar] [CrossRef]
  46. Sahar, A.; Zafar, M.M.; Razzaq, A.; Manan, A.; Haroon, M.; Sajid, S.; Rehman, A.; Mo, H.; Ashraf, M.; Ren, M.; et al. Genetic variability for yield and fiber related traits in genetically modified cotton. J. Cotton Res. 2021, 4, 19. [Google Scholar] [CrossRef]
  47. Çopur, O.; Polat, D.; Odabaşioğlu, C. Effect of different sowing dates on cotton (Gossypium hirsutum L.) fiber color at double crop growing conditions. Harran Tarım Gıda Bilim. Derg. 2018, 22, 67–72. [Google Scholar] [CrossRef]
  48. Yusupaliyeva, U.N.; Yuldashev, N.N. Color quality control in the production of cotton fiber. Eur. Chem. Bull. 2022, 11, 55–58. [Google Scholar]
  49. Karami, Z.; Sharifi, Z.; Renella, G. Determining the most sensitive indicators of soil carbon transformation to the land use change from intact rangeland to cropland, western Iran. Int. J. Environ. Res. 2023, 17, 37. [Google Scholar] [CrossRef]
  50. Rahmani, R.; Khalesro, S.; Heidari, G.; Mokhatssi-Bidgoli, A. Vermicompost and zeolite improve yield, nutrient uptake, essential and fixed oil production, and composition of Nigella sativa L. Front. Sustain. Food Syst. 2023, 7, 1214691. [Google Scholar] [CrossRef]
  51. Zambon, I.; Colantoni, A.; Carlucci, M.; Morrow, N.; Sateriano, A.; Salvati, L. Land quality, sustainable development and environmental degradation in agricultural districts: A computational approach based on entropy indexes. Environ. Impact Assess. Rev. 2017, 64, 37–46. [Google Scholar] [CrossRef]
  52. Amato, M.A.; Ladd, J.N. Decomposition of 14C-labelled glucose and legume material in soils: Properties influencing the accumulation of organic residue C and microbial biomass C. Soil Biol. Biochem. 1992, 24, 455–464. [Google Scholar] [CrossRef]
  53. Kavvadias, V.; Ioannou, Z.; Vavoulidou, E.; Paschalidis, C. Short term effects of chemical fertilizer, compost and zeolite on yield of lettuce, nutrient composition and soil properties. Agriculture 2023, 13, 1022. [Google Scholar] [CrossRef]
  54. Wang, C.; Wan, S.; Xing, X.; Zhang, L.; Han, X. Temperature and soil moisture interactively affected soil net N mineralization in temperate grassland in Northern China. Soil Biol. Biochem. 2006, 38, 1101–1110. [Google Scholar] [CrossRef]
  55. Liu, C.; Lu, M.; Cui, J.; Li, B.; Fang, C. Effects of straw carbon input on carbon dynamics in agricultural soils: A meta-analysis. Glob. Change Biol. 2014, 20, 1366–1381. [Google Scholar] [CrossRef]
  56. Kucharik, C.J.; Brye, K.R.; Norman, J.M.; Foley, J.A.; Gower, S.T.; Bundy, L.G. Measurements and modeling of carbon and nitrogen cycling in agroecosystems of southern Wisconsin: Potential for SOC sequestration during the next 50 years. Ecosystems 2001, 4, 237–258. [Google Scholar] [CrossRef]
  57. Raun, W.R.; Johnson, G.V.; Phillips, S.B.; Westerman, R.L. Effect of long-term N fertilization on soil organic C and total N in continuous wheat under conventional tillage in Oklahoma. Soil Tillage Res. 1998, 47, 323–330. [Google Scholar] [CrossRef]
  58. Halvorson, A.D.; Jantalia, C.P. Nitrogen fertilization effects on irrigated no-till corn production and soil carbon and nitrogen. Agron. J. 2011, 103, 1423–1431. [Google Scholar] [CrossRef]
  59. Aiyuk, S.; Xu, H.; Van Haandel, A. Removal of ammonium nitrogen from pretreated domestic sewage using a natural ion exchanger. Environ. Technol. 2004, 25, 1321–1330. [Google Scholar] [CrossRef]
  60. Zaman, M.; Nguyen, M.L.; Šimek, M.; Nawaz, S.; Khan, M.J.; Babar, M.N.; Zaman, S. Emissions of nitrous oxide (N2O) and di-nitrogen (N2) from the agricultural landscapes, sources, sinks, and factors affecting N2O and N2 ratios. In Greenhouse Gases-Emission, Measurement and Management; Liu, G., Ed.; InTech Europe: Rijeka, Croatia, 2012; pp. 1–32. [Google Scholar]
  61. Belviso, C.; Satriani, A.; Lovelli, S.; Comegna, A.; Coppola, A.; Dragonetti, G.; Cavalcante, F.; Rivelli, A.R. Impact of zeolite from coal fly ash on soil hydrophysical properties and plant growth. Agriculture 2022, 12, 356. [Google Scholar] [CrossRef]
  62. Louhar, G.; Devi, S.; Dahiya, G. Zeolites: A potential source of soil amendments to improve soil properties. Chem. Sci. Rev. Lett. 2020, 9, 777–785. [Google Scholar]
  63. Marinari, S.; Masciandaro, G.; Ceccanti, B.; Greco, S. Influence of organic and mineral fertilisers on soil biological and physical properties. Bioresour. Technol. 2000, 72, 9–17. [Google Scholar] [CrossRef]
  64. Ghorbani, M.; Amirahmadi, E.; Konvalina, P.; Moudrý, J.; Bárta, J.; Kopecký, M.; Teodorescu, R.I.; Bucur, R.D. Comparative Influence of Biochar and Zeolite on Soil Hydrological Indices and Growth Characteristics of Corn (Zea mays L.). Water 2022, 14, 3506. [Google Scholar] [CrossRef]
  65. Kukowska, S.; Szewczuk-Karpisz, K. Management of the soil environment using biochar and zeolite in various combinations: Impact on soil condition and economical aspects. J. Soils Sediments 2025, 25, 77–102. [Google Scholar] [CrossRef]
  66. Majumder, B.; Ruehlmann, J.; Kuzyakov, Y. Effects of aggregation processes on distribution of aggregate size fractions and organic C content of a long-term fertilized soil. Eur. J. Soil Biol. 2010, 46, 365–370. [Google Scholar]
  67. Costa, C.; Dwyer, L.M.; Zhou, X.; Dutilleul, P.; Hamel, C.; Reid, L.M.; Smith, D.L. Root morphology of contrasting maize genotypes. Agron. J. 2002, 94, 96–101. [Google Scholar] [CrossRef]
  68. Gregory, P.J. Root growth and activity. In Physiology and Determination of Crop Yield; Peterson, G.A., Ed.; ASA, CSSA, and SSSA: Madison, WI, USA, 1994; pp. 65–93. [Google Scholar]
  69. Fageria, N.K.; Moreira, A. The role of mineral nutrition on root growth of crop plants. Adv. Agron. 2011, 110, 251–331. [Google Scholar]
  70. Głąb, T.; Gondek, K.; Marcińska-Mazur, L.; Jarosz, R.; Mierzwa-Hersztek, M. Effect of organic/inorganic composites as soil amendments on the biomass productivity and root architecture of spring wheat and rapeseed. J. Environ. Manag. 2023, 344, 118628. [Google Scholar] [CrossRef]
  71. Wu, Q.; Xia, G.; Chen, T.; Zheng, J.; Bu, F.; Chi, D. Effects of nitrogen and zeolite on rice grain yield, water and nitrogen use, and soil total nitrogen in coastal region of Northeast China. Commun. Soil Sci. Plant Anal. 2016, 47, 2103–2114. [Google Scholar] [CrossRef]
  72. Ippolito, A.J.; Tarkalson, D.D.; Lehrsch, G.A. Zeolite soil application method affects inorganic nitrogen, moisture, and corn growth. Soil Sci. 2011, 176, 136–142. [Google Scholar] [CrossRef]
  73. Treacy, M.M.J.; Higgins, J.B. Collection of Simulated XRD Powder Patterns for Zeolites, 5th ed.; Elsevier: Amsterdam, The Netherlands, 2007. [Google Scholar]
  74. Leggo, P. An investigation of plant growth in an organo-zeolitic substrate and its ecological significance. Plant Soil. 2000, 219, 135–146. [Google Scholar] [CrossRef]
  75. Wierzbowska, J.; Cwalina-Ambroziak, B.; Bogucka, B. The effect of nitrogen fertilization on yield and macronutrient concentrations in three cultivars of Jerusalem artichoke (Helianthus tuberosus L.). Agronomy 2021, 11, 2161. [Google Scholar] [CrossRef]
  76. Leghari, S.J.; Wahocho, N.A.; Laghari, G.M.; Laghari, A.H.; Bhabhan, G.M.; Hussain-Talpur, K.; Bhutto, T.A.; Wahocho, S.A.; Lashari, A.A. Role of nitrogen for plant growth and development: A review. Adv. Environ. Biol. 2016, 10, 209–219. [Google Scholar]
  77. Wei, S.; Wang, X.; Li, G.; Jiang, D.; Dong, S. Maize canopy apparent photosynthesis and 13C-photosynthate reallocation in response to different density and N rate combinations. Front. Plant Sci. 2019, 10, 1113. [Google Scholar] [CrossRef]
  78. Wu, L.H.; Li, H.; Luo, Y.M.; Christie, P. Nutrients can enhance phytoremediation of copper-polluted soil by Indian mustard. Environ. Geochem. Health 2004, 26, 331–335. [Google Scholar] [CrossRef]
  79. Yu, F.; Liu, K.; Li, M.; Zhou, Z.; Deng, H.; Chen, B. Effects of cadmium on enzymatic and non-enzymatic antioxidative defenses of rice (Oryza sativa L.). Int. J. Phytoremediat. 2013, 15, 513–521. [Google Scholar] [CrossRef]
  80. Butorac, A.; Filipan, T.; Bašic, F.; Butorac, J.; Mesić, M.; Kisić, I. Crop response to the application of special natural amendments based on zeolite tuff. Rostl. Výroba 2002, 48, 118–124. [Google Scholar] [CrossRef]
  81. Szatanik-Kloc, A.; Szerement, J.; Adamczuk, A.; Józefaciuk, G. Effect of low zeolite doses on plants and soil physicochemical properties. Materials 2021, 14, 2617. [Google Scholar] [CrossRef]
  82. Zaman, I.; Ali, M.; Shahzad, K.; Tahir, M.S.; Matloob, A.; Ahmad, W.; Alamri, S.; Khurshid, M.R.; Qureshi, M.M.; Wasaya, A.; et al. Effect of plant spacings on growth, physiology, yield and fiber quality attributes of cotton genotypes under nitrogen fertilization. Agronomy 2021, 11, 2589. [Google Scholar] [CrossRef]
  83. Kazama, E.H.; Morelli Ferreira, F.; da Silva, R.P.; da Silva, A.R.B.; Augusto Fiorese, D. Multivariate analysis of fiber characteristics of dense cotton in different harvest systems. Aust. J. Crop Sci. 2015, 9, 1075–1081. [Google Scholar]
  84. Veloso, L.L.d.S.A.; Azevedo, C.A.V.d.; Nobre, R.G.; Lima, G.S.d.; Bezerra, J.R.C.; Silva, A.A.R.d.; Fátima, R.T.d.; Gheyi, H.R.; Soares, L.A.d.A.; Fernandes, P.D.; et al. Production and fiber characteristics of colored cotton cultivars under salt stress and H2O2. Plants 2023, 12, 2090. [Google Scholar] [CrossRef] [PubMed]
  85. da Silva Ribeiro, J.E.; de Lima Tartaglia, F.; Caetano, L.P.; dos Santos Coêlho, E.; dos Santos, G.L.; de Oliveira, A.K.S.; da Silva, E.F.; de Almeida Oliveira, P.H.; da Silva, A.G.C.; da Silveira, L.M.; et al. Effect of nitrogen fertilization on the quality of colored cotton fibers in the Brazilian semi-arid region. J. Nat. Fibers 2024, 21, 2391010. [Google Scholar] [CrossRef]
  86. Nie, J.; Qin, D.; Mao, L.; Liu, Y.; Dong, H.; Song, X.; Sun, X. Genotypic variance in 13C-photosynthate partitioning and within-plant boll distribution in cotton. J. Cotton Res. 2020, 3, 15. [Google Scholar] [CrossRef]
  87. Korra, C.G.; Kura, A.B.; Tiliksew, A.D. Study of Ethiopian genetically modified and organic cotton fiber quality compared with conventional cotton. Cogent Food Agric. 2024, 10, 2301144. [Google Scholar] [CrossRef]
  88. Sarwar, M.; Farrukh Saleem, M.; Ullah, N.; Rizwan, M.; Ali, S.; Rizwan Shahid, M.; Alamri, S.A.; Nasser Alyemeni, M.; Ahmad, P. Exogenously applied growth regulators protect the cotton crop from heat-induced injury by modulating plant defense mechanism. Sci. Rep. 2018, 8, 17086. [Google Scholar] [CrossRef]
  89. Leal, A.J.F.; Piati, G.L.; Leite, R.C.; Zanella, M.S.; Osorio, C.R.W.S.; Lima, S.F. Nitrogen and mepiquat chloride can affect fiber quality and cotton yield. Rev. Bras. Eng. Agric. Ambient. 2020, 24, 238–243. [Google Scholar] [CrossRef]
  90. Khan, N.; Han, Y.; Wang, Z.; Wang, G.; Feng, L.; Yang, B.; Li, Y. Role of proper management of nitrogen in cotton growth and development. Int. J. Biosci. 2019, 14, 5. [Google Scholar]
  91. Chen, J.; Liu, L.; Wang, Z.; Sun, H.; Zhang, Y.; Bai, Z.; Song, S.; Lu, Z.; Li, C. nitrogen fertilization effects on physiology of the cotton boll–leaf system. Agronomy 2019, 9, 271. [Google Scholar] [CrossRef]
  92. Liu, Z.; Zhao, M.; Zhang, H.; Ren, T.; Liu, C.; He, N. Divergent response and adaptation of specific leaf area to environmental change at different spatio-temporal scales jointly improve plant survival. Glob. Change Biol. 2023, 29, 1144–1159. [Google Scholar] [CrossRef] [PubMed]
  93. Noor, H.; Ding, P.; Ren, A.; Sun, M.; Gao, Z. Effects of nitrogen fertilizer on photosynthetic characteristics and yield. Agronomy 2023, 13, 1550. [Google Scholar] [CrossRef]
  94. Elmogahzy, Y.; Farag, R. Tensile Properties of Cotton Fibers: Importance, Research, and Limitations. In Handbook of Properties of Textile and Technical Fibres; Elsevier: Amsterdam, The Netherlands, 2018. [Google Scholar]
  95. Zhai, Z.; Zhang, K.; Fang, Y.; Yang, Y.; Cao, X.; Liu, L.; Tian, Y. Systematically and comprehensively understanding the regulation of cotton fiber initiation: A review. Plants 2023, 12, 3771. [Google Scholar] [CrossRef] [PubMed]
  96. Jan, M.; Liu, Z.; Guo, C.; Sun, X. Molecular regulation of cotton fiber development: A review. Int. J. Mol. Sci. 2022, 23, 5004. [Google Scholar] [CrossRef] [PubMed]
  97. Kumar, R.; Kumar Pareek, N.; Kumar, U.; Javed, T.; Al-Huqail, A.A.; Rathore, V.S.; Nangia, V.; Choudhary, A.; Nanda, G.; Ali, H.M. Coupling effects of nitrogen and irrigation levels on growth attributes, nitrogen use efficiency, and economics of cotton. Front. Plant Sci. 2022, 13, 890181. [Google Scholar] [CrossRef]
  98. Bradow, J.M.; Davidonis, G.H. Quantitation of fiber quality and the cotton production-processing interface: A physiologist’s perspective. J. Cotton Sci. 2000, 4, 34–64. [Google Scholar]
  99. Porter, P.M.; Sullivan, M.J.; Harvey, L.H. Cotton cultivar response to planting date on the southeastern coastal plain. J. Prod. Agric. 1996, 9, 223–227. [Google Scholar] [CrossRef]
  100. van der Sluijs, M.H.J. Effect of nitrogen application level on cotton fibre quality. J. Cotton Res. 2022, 5, 9. [Google Scholar] [CrossRef]
  101. Tian, J.S.; Hu, Y.Y.; Gan, X.X.; Zhang, Y.L.; Hu, X.B.; Ling, G.O.U.; Luo, H.H.; Zhang, W.F. Effects of increased night temperature on cellulose synthesis and the activity of sucrose metabolism enzymes in cotton fiber. J. Integr. Agric. 2013, 12, 979–988. [Google Scholar] [CrossRef]
  102. Reddy, K.N.; Burke, I.C.; Boykin, J.C.; Williford, J. Narrow-row cotton production under irrigated and non-irrigated environment: Plant population and lint yield. J. Cotton Sci. 2009, 13, 48–55. [Google Scholar]
Figure 1. Weather data for the three experimental sites (ATH, MES, and KAR) from April to September 2024.
Crops 05 00027 g001
Figure 2. Two-dimensional principal component analysis (PCA) diagram with all 24 variables. The evaluated variables are as follows: SOM = soil organic matter; STN = soil total nitrogen; TP = total porosity; MWD = mean weight diameter; RLD = root length density; plant height = mean height of cotton plants; LAI = leaf area index; dry weight = total dry weight of cotton plants per hectare; boll number = total number of bolls per square meter; boll weight = mean weight of boll; seed cotton yield = total seed cotton yield per hectare; lint yield = total lint yield per hectare; lint percentage = ratio of lint to seed cotton weight; MIC = micronaire; MAT = maturity; STR = fiber strength; ELG = elongation; UHML = upper half mean length; UI = uniformity index; SFI = short fiber index; Rd = fiber reflectance; SCI = spinning consistency index; TrAr = trash area; TrID = trash grade.
Crops 05 00027 g002
Figure 3. Correlation matrix heatmap between the examined variables. ns  =  not significant (p  >  0.05), * = p  ≤  0.05, ** = p  ≤  0.01, *** = p  <  0.001.
Crops 05 00027 g003
Table 1. Geographical information and soil properties of the studied experimental sites.
NameAthens (ATH)Messolonghi (MES)Karditsa (KAR)
Geographical location (Lat., Long.)37°59′ N, 23°42′ E38°36′ N, 21°48′ E39°35′ N, 22°04′ E
Altitude (m above sea level)29−1.5108
Regional UnitCentral AthensAetolia–AkarnaniaKarditsa
Administrative RegionAtticaWestern GreeceThessaly
Geographical RegionEast-Central GreeceWestern GreeceCentral Greece
Köppen Climate Classification Category [26]CsaCsaCsa
Soil Properties (0–30 cm)
Soil Order [27]CambisolFluvisolCambisol
Soil TypeClay Loam (CL)Clay Loam (CL)Clay Loam (CL)
Clay (%)29.637.039.1
Silt (%)34.820.724.2
Sand (%)35.642.336.7
pH (1:1 H2O)7.417.897.36
Organic Matter (%)1.7331.6991.842
CaCO3 (%)14.5718.4313.19
Total Nitrogen (%)0.1240.1110.138
Phosphorus—Olsen P (mg kg−1 soil)13.414.215.5
Potassium (mg kg−1 soil)215342277
Csa: hot-summer Mediterranean climate zone according to Köppen Climate Classification Category [26].
Table 2. Main plot and sub-plot treatments applied in the study.
Main Plot TreatmentZeolite (Clinoptilolite Granules)
10 t ha−1
25 t ha−1
37.5 t ha−1
Sub-plot treatmentN Fertilization (Urea Fertilizer)
10 kg N ha−1
2100 kg N ha−1
3150 kg N ha−1
4200 kg N ha−1
Table 3. Short description and methodology of the evaluated cotton fiber quality traits.
Trait GroupTraitDescriptionMethodReference
Fiber Maturity TraitsMicronaire (MIC)An indicative measurement of the air permeability of compressed cotton fibersVia evaluating the resistance of airflow in a specific amount of cotton fibers[40]
Maturity (MAT)The probability of breakage and entanglementMeasure of secondary walls’ thickness[41]
Fiber Strength (STR)The needed strength for fiber breakageExert force until the breakage of a bundle of fibers[42]
Elongation (ELG)The percentage of fiber’s extension before the breakagePull fibers and measure the length right before the breakage[43]
Fiber Length TraitsUpper Half Mean Length (UHML)A measurement of the length of fiberThe mean length of fiber’s longer half[44]
Uniformity Index (UI)The ratio of the Upper-Half Mean Length (UHML) to the mean length of the fibersUniformity Index = Mean Length/Upper Half Mean Length [45]
Short Fiber Index (SFI)The amount of fibers < 12.5 mmVia HVI instrument[46]
Color TraitsFiber Reflectance (Rd)The value of reflectance (Rd)Measurement of the reflectance of the fiber using the Nickerson–Huntercolor chart[47]
Spinning Consistency Index (SCI)An indicator that classifies fibers according to their quality and spinnabilitySCI = −414.67 + 2.9 × Str − 9.32 × MIC + 49.17 × UHML + 4.74 × UI + 0.65 × Rd + 0.36 × (+b)[48]
Trash TraitsTrash Area (TrAr)The area covered with trashCounting the pieces of trash that are exposed to the glass window[44]
Trash Grade (TrID)The trash gradeDetermined by calibrating HVI with known samples[44]
Table 4. Combined analysis of variance (F values) for all studied variables over three experimental sites (ATH, MES, and KAR).
Source of
Variance
DfSoil Organic Matter (SOM)Soil Total
Nitrogen (STN)
Total Porosity (TP)Mean Weight Diameter (MWD)Root Length Density (RLD)Plant Height
Location (L)210.259 ***286.807 ***58.993 ***4.438 *2.366 ns7.694 **
Zeolite (Z)217.264 ***11.798 ***9.878 ***14.350 ***27.635 ***27.707 ***
Fertilization (F)35.423 **17.429 ***18.754 ***19.796 ***63.851 ***20.384 ***
L × Z40.887 ns0.188 ns0.317 ns0.882 ns0.036 ns0.207 ns
L × F60.318 ns1.213 ns1.289 ns0.337 ns0.854 ns0.923 ns
Z × F60.338 ns4.616 ***4.799 ***0.183 ns2.725 *0.566 ns
L × Z × F120.299 ns0.079 ns0.115 ns0.161 ns0.393 ns0.229 ns
Source of
Variance
DfLeaf Area
Index (LAI)
Dry WeightBoll NumberBoll WeightSeed Cotton YieldLint Yield
Location (L)225.779 ***12.258 ***99.934 ***3.029 ns187.244 ***34.636 ***
Zeolite (Z)224.837 ***19.382 ***2.541 ns17.707 ***20.911 ***25.167 ***
Fertilization (F)361.184 ***46.739 ***3.868 *18.949 ***26.174 ***27.718 ***
L × Z40.239 ns0.115 ns0.068 ns0.428 ns0.347 ns1.212 ns
L × F60.829 ns0.472 ns0.329 ns0.096 ns0.717 ns0.104 ns
Z × F60.379 ns1.052 ns0.639 ns0.953 ns1.586 ns1.557 ns
L × Z × F120.156 ns0.125 ns0.467 ns0.215 ns0.843 ns1.248 ns
Source of
Variance
DfLint PercentageMicronaire (MIC)Maturity (MAT)Fiber Strength (STR)Elongation (ELG)Upper Half Mean Length (UHML)
Location (L)23.795 *9.851 ***37.615 ***3.878 *5.485 **26.662 ***
Zeolite (Z)219.968 ***117.189 ***17.389 ***24.594 ***37.619 ***36.950 ***
Fertilization (F)320.564 ***9.111 ***10.805 ***9.539 ***13.484 ***10.484 ***
L × Z41.932 ns0.522 ns0.184 ns0.214 ns0.851 ns0.611 ns
L × F60.298 ns0.122 ns0.406 ns0.235 ns0.237 ns0.449 ns
Z × F61.474 ns2.102 ns3.408 **0.918 ns3.137 **2.891 *
L × Z × F121.399 ns0.068 ns0.506 ns0.239 ns0.198 ns0.351 ns
Source of
Variance
DfUniformity
Index (UI)
Short Fiber
Index (SFI)
Fiber
Reflectance (Rd)
Spinning
Consistency Index (SCI)
Trash Area (TrAr)Trash Grade (TrID)
Location (L)253.781 ***0.030 ns36.952 ***39.552 ***0.184 ns0.052 ns
Zeolite (Z)217.102 ***15.057 ***63.189 ***45.484 ***31.359 ***11.229 ***
Fertilization (F)311.005 ***9.354 ***13.172 ***15.035 ***9.583 ***0.679 ns
L × Z40.149 ns0.134 ns0.098 ns0.582 ns0.293 ns1.507 ns
L × F60.138 ns0.069 ns0.172 ns0.378 ns0.216 ns0.012 ns
Z × F62.827 *2.721 *2.047 ns3.648 **1.426 ns1.294 ns
L × Z × F120.108 ns0.094 ns0.067 ns0.241 ns0.251 ns1.438 ns
Df: Degrees of freedom. ns  =  not significant (p  >  0.05), * = p  ≤  0.05, ** = p  ≤  0.01, *** = p  <  0.001.
Table 5. Soil organic matter (SOM), soil total nitrogen (STN), total porosity (TP), and mean weight diameter (MWD) as influenced by zeolite addition and N fertilization regimes over three experimental sites (ATH, MES, and KAR).
Soil Organic Matter (SOM) (%)Soil Total Nitrogen (STN) (%)Total Porosity (TP) (%)Mean Weight
Diameter (MWD) (mm)
ATH
Zeolite (t ha−1)
01.818 ± 0.017 B0.121 ± 0.001 B43.16 ± 0.44 B7.91 ± 0.14 A
51.916 ± 0.032 A0.127 ± 0.002 A44.63 ± 0.73 AB7.79 ± 0.16 AB
7.51.895 ± 0.025 AB0.129 ± 0.002 A45.12 ± 0.71 A7.44 ± 0.10 B
N Fertilization (kg N ha−1)
01.833 ± 0.033 a0.120 ± 0.001 b42.67 ± 0.54 b7.27 ± 0.08 c
1001.876 ± 0.035 a0.125 ± 0.002 ab44.01± 0.69 ab7.65 ± 0.16 bc
1501.882 ± 0.037 a0.128 ± 0.002 a44.76 ± 0.85 ab7.86 ± 0.18 ab
2001.914 ± 0.019 a0.129 ± 0.003 a45.78 ± 0.64 a8.09 ± 0.11 a
Source of Variation
FZeolite3.653 *5.845 **3.890 *4.280 *
FFertilization1.144 ns4.564 *4.766 **6.541 **
FZeolite×Fertilization0.416 ns1.676 ns1.838 ns0.265 ns
MES
Zeolite (t ha−1)
01.727 ± 0.019 B0.104 ± 0.001 B38.84 ± 0.42 B8.30 ± 0.23 A
51.845 ± 0.029 A0.108 ± 0.001 A40.43 ± 0.71 AB7.88 ± 0.21 AB
7.51.901 ± 0.035 A0.110 ± 0.002 A40.72 ± 0.64 A7.41 ± 0.15 B
N Fertilization (kg N ha−1)
01.775 ± 0.036 a0.103 ± 0.001 b38.36 ± 0.41 b7.33 ± 0.14 b
1001.815 ± 0.039 a0.107 ± 0.001 ab39.82 ± 0.70 ab7.70 ± 0.24 ab
1501.830 ± 0.043 a0.109 ± 0.002 ab40.49 ± 0.78 ab8.01 ± 0.21 ab
2001.775 ± 0.038 a0.111 ± 0.002 a41.32 ± 0.59 a8.48 ± 0.27 a
Source of Variation
FZeolite7.365 **4.828 *4.274 *6.362 **
FFertilization1.225 ns4.388 *4.871 **5.975 **
FZeolite×Fertilization0.070 ns2.216 ns1.396 ns0.040 ns
KAR
Zeolite (t ha−1)
01.854 ± 0.021 B0.136 ± 0.001 A41.68 ± 0.48 A7.80 ± 0.16 A
51.946 ± 0.027 A0.141 ± 0.002 A42.48 ± 0.67 A7.46 ± 0.17 AB
7.51.986 ± 0.030 A0.142 ± 0.003 A42.90 ± 0.81 A7.29 ± 0.14 B
N Fertilization (kg N ha−1)
01.840 ± 0.037 b0.130 ± 0.002 b39.66 ± 0.68 b6.94 ± 0.14 c
1001.944 ± 0.034 a0.141 ± 0.003 a43.04 ± 0.52 a7.49 ± 0.12 b
1501.959 ± 0.029 a0.142 ± 0.002 a43.18 ± 0.46 a7.70 ± 0.15 ab
2001.970 ± 0.031 a0.145 ± 0.003 a43.79 ± 0.59 a7.94 ± 0.16 a
Source of Variation
FZeolite7.867 **2.392 ns2.078 ns4.293 *
FFertilization4.623 *9.214 ***12.874 ***8.817 ***
FZeolite×Fertilization0.634 ns1.214 ns1.795 ns0.346 ns
ns  =  not significant (p  >  0.05), * = p  ≤  0.05, ** = p  ≤  0.01, *** = p  <  0.001. Statistically significant differences among zeolite application treatments within a location are depicted by different capital letters, whereas statistically significant differences between N fertilization regimes within an experimental site are depicted by different lowercase letters according to Tukey’s HSD test (p ≤ 0.05).
Table 6. Root length density (RLD), plant height, leaf area index (LAI), and dry weight as influenced by zeolite addition and N fertilization regimes over three experimental sites (ATH, MES, and KAR).
Root Length Density (RLD) (cm cm−3)Plant Height
(cm)
Leaf Area Index (LAI) (m3 m−3)Dry Weight
(kg ha−1)
ATH
Zeolite (t ha−1)
00.665 ± 0.037 B94.2 ± 3.2 B2.50 ± 0.08 B4185 ± 221 B
50.754 ± 0.046 A107.4 ± 2.9 A2.74 ± 0.07 A4546 ± 296 AB
7.50.813 ± 0.051 A113.3 ± 3.0 A2.83 ± 0.08 A5014 ± 308 A
N Fertilization (kg N ha−1)
00.561 ± 0.019 c95.3 ± 3.5 c2.39 ± 0.06 c3450 ± 153 c
1000.721 ± 0.026 b102.6 ± 3.6 bc2.63 ± 0.07 b4345 ± 182 b
1500.792 ± 0.050 ab107.0 ± 4.8 ab2.70 ± 0.08 b4984 ± 247 a
2000.902 ± 0.049 a114.9 ± 3.2 a3.04 ± 0.06 a5549 ± 244 a
Source of Variation
FZeolite8.053 **17.539 ***14.751 ***6.115 **
FFertilization21.354 ***9.324 **27.909 ***21.533 ***
FZeolite×Fertilization1.498 ns0.816 ns0.545 ns0.239 ns
MES
Zeolite (t ha−1)
00.635 ± 0.037 C95.9 ± 3.8 B2.46 ± 0.07 B3979 ± 252 B
50.732 ± 0.039 B107.2 ± 3.6 A2.64 ± 0.08 A4204 ± 299 AB
7.50.797 ± 0.048 A110.1 ±3.9 A2.75 ± 0.06 A4844 ± 308 A
N Fertilization (kg N ha−1)
00.521 ± 0.024 b87.7 ± 4.0 b2.29 ± 0.05 c3265 ± 158 c
1000.759 ± 0.027 a106.6 ± 3.8 a2.62 ± 0.07 b4151 ± 249 b
1500.774 ± 0.029 a110.7 ± 2.9 a2.67 ± 0.10 ab4584 ± 297 b
2000.828 ± 0.038 a112.5 ± 3.2 a2.91 ± 0.07 a5368 ± 243 a
Source of Variation
FZeolite14.714 ***8.049 **7.175 **5.394 *
FFertilization30.816 ***13.963 ***11.548 ***15.484 ***
FZeolite×Fertilization2.210 ns0.344 ns0.281 ns0.494 ns
KAR
Zeolite (t ha−1)
00.688 ± 0.029 B102.8 ± 3.2 B2.76 ± 0.08 B4610 ± 220 B
50.770 ± 0.047 AB114.6 ± 4.0 AB2.97 ± 0.07 A4948 ± 239 B
7.50.839 ± 0.052 A120.7 ± 3.4 A3.01 ± 0.09 A5593 ± 213 A
N Fertilization (kg N ha−1)
00.593 ± 0.021 c103.6 ± 3.7 b2.50 ± 0.07 c4223 ± 165 c
1000.739 ± 0.032 b112.1 ± 4.1 ab2.94 ± 0.05 b4877 ± 249 b
1500.831± 0.045 ab115.0 ± 4.9 ab3.00 ± 0.05 ab5327 ± 292 ab
2000.900 ± 0.043 a120.2 ± 3.8 a3.19 ± 0.06 a5775 ± 207 a
Source of Variation
FZeolite7.164 **6.599 **9.009 **8.369 **
FFertilization16.389 ***2.974 *34.360 ***11.056 ***
FZeolite×Fertilization0.305 ns0.146 ns0.230 ns0.542 ns
ns  =  not significant (p  >  0.05), * = p  ≤  0.05, ** = p  ≤  0.01, *** = p  <  0.001. Statistically significant differences among zeolite application treatments within a location are depicted by different capital letters, whereas statistically significant differences between N fertilization regimes within an experimental site are depicted by different lowercase letters according to Tukey’s HSD test (p ≤ 0.05).
Table 7. Boll number, boll weight, seed cotton yield, lint yield, and lint percentage as influenced by zeolite addition and N fertilization regimes over three experimental sites (ATH, MES, and KAR).
Boll Number
(m−2)
Boll Weight
(g)
Seed Cotton Yield (kg ha−1)Lint Yield
(kg ha−1)
Lint Percentage
(%)
ATH
Zeolite (t ha−1)
075.9 ± 0.3 A6.11 ± 0.02 B4639 ± 14 C1627 ± 31 B35.1 ± 0.6 B
576.4 ± 0.2 A6.14 ± 0.01 AB4695 ± 19 B1759 ± 24 A37.4 ± 0.3 A
7.576.8 ± 0.4 A6.18 ± 0.02 A4745 ± 26 A1808 ± 34 A38.1 ± 0.5 A
N Fertilization (kg N ha−1)
075.9 ± 0.3 a6.09 ± 0.03 c4633 ± 10 c1641 ± 30 b35.4 ± 0.6 b
10076.2 ± 0.2 a6.12 ± 0.01 bc4669 ± 11 bc1695 ± 28 b36.3 ± 0.5 b
15076.3 ± 0.4 a6.18 ± 0.02 ab4712 ± 25 ab1786 ± 33 a37.8± 0.5 a
20076.9 ± 0.5 a6.19 ± 0.02 a4759 ± 34 a1804 ± 53 a37.9 ± 0.9 a
Source of Variation
FZeolite1.588 ns5.291 *14.008 ***18.334 ***15.410 ***
FFertilization1.095 ns5.406 **11.110 ***9.367 ***6.861 **
FZeolite×Fertilization1.194 ns0.216 ns1.989 ns1.741 ns1.230 ns
MES
Zeolite (t ha−1)
073.7 ± 0.4 A6.12 ± 0.02 B4512 ± 25 B1617 ± 35 B35.8 ± 0.6 B
574.3 ± 0.5 A6.15 ± 0.02 AB4576 ± 31 AB1703 ± 38 A37.2 ± 0.6 A
7.574.4 ± 0.3 A6.19 ± 0.01 A4597 ± 26 A1723 ± 29 A37.5 ± 0.5 A
N Fertilization (kg N ha−1)
073.6 ± 0.3 a6.08 ± 0.02 c4478 ± 22 b1572 ± 31 c35.1 ± 0.6 b
10074.1 ± 0.4 a6.14 ± 0.01 b4557 ± 14 ab1657 ± 25 bc36.4 ± 0.4 ab
15074.3 ± 0.7 a6.18 ± 0.02 ab4577 ± 39 a1729 ± 47 ab37.7 ± 0.7 a
20074.7 ± 0.4 a6.20 ± 0.01 a4634 ± 36 a1768 ± 35 a38.1 ± 0.6 a
Source of Variation
FZeolite0.685 ns5.494 *3.568 *3.869 *3.886 *
FFertilization0.869 ns10.750 ***5.593 **6.760 **7.192 **
FZeolite×Fertilization0.423 ns0.521 ns0.648 ns0.918 ns1.028 ns
KAR
Zeolite (t ha−1)
078.5 ± 0.5 A6.12 ± 0.02 B4805 ± 39 B1776 ± 36 B36.9 ± 0.5 B
579.2 ± 0.3 A6.18 ± 0.01 A4895 ± 17 A1862 ± 24 A38.0 ± 0.4 A
7.579.1 ± 0.4 A6.22 ± 0.02 A4921 ± 29 A1847 ± 15 A37.8 ± 0.2 A
N Fertilization (kg N ha−1)
077.9 ± 0.3 a6.11 ± 0.03 b4768 ± 32 c1742 ± 28 c36.5 ± 0.5 c
10078.6 ± 0.4 a6.16 ± 0.02 ab4844 ± 34 b1798 ± 30 b37.1± 0.4 bc
15079.3 ± 0.6 a6.20 ± 0.02 a4919 ± 23 a1882 ± 19 a38.2 ± 0.3 ab
20079.8 ± 0.5 a6.22 ± 0.03 a4964 ± 27 a1911 ± 14 a38.5 ± 0.4 a
Source of Variation
FZeolite0.735 ns7.167 **8.726 **9.253 **3.601 *
FFertilization2.385 ns4.920 **12.992 ***17.021 ***7.095 **
FZeolite×Fertilization0.271 ns0.605 ns1.243 ns1.985 ns2.579 *
ns  =  not significant (p  >  0.05), * = p  ≤  0.05, ** = p  ≤  0.01, *** = p  <  0.001. Statistically significant differences among zeolite application treatments within a location are depicted by different capital letters, whereas statistically significant differences between N fertilization regimes within an experimental site are depicted by different lowercase letters according to Tukey’s HSD test (p ≤ 0.05).
Table 8. Fiber maturity traits (micronaire (MIC), maturity (MAT), fiber strength (STR), and elongation (ELG)) as influenced by zeolite addition and N fertilization regimes over three experimental sites (ATH, MES, and KAR).
Fiber Maturity Traits
Micronaire (MIC)Maturity (MAT)
(%)
Fiber Strength (STR)
(g text−1)
Elongation (ELG)
(%)
ATH
Zeolite (t ha−1)
03.58 ± 0.06 C0.818 ± 0.02 B28.94 ± 0.77 B9.29 ± 0.16 C
54.24 ± 0.11 B0.832 ± 0.01 AB31.55 ± 0.74 A10.61 ± 0.38 B
7.54.55 ± 0.08 A0.857 ± 0.01 A33.58 ± 0.79 A11.44 ± 0.29 A
N Fertilization (kg N ha−1)
03.90 ± 0.16 b0.817 ± 0.01 b29.43 ± 0.69 b9.50 ± 0.28 b
1004.11 ± 0.15 ab0.833 ± 0.02 ab30.94 ± 0.96 ab10.06 ± 0.30 b
1504.22 ± 0.17 a0.837 ± 0.01 ab32.35 ± 1.17 a11.04 ± 0.46 a
2004.27 ± 0.19 a0.855 ± 0.02 a32.72 ± 1.20 a11.17 ± 0.51 a
Source of Variation
FZeolite40.438 ***7.204 **10.347 ***25.919 ***
FFertilization3.266 *3.217 *3.232 *10.480 ***
FZeolite×Fertilization0.798 ns1.953 ns0.650 ns1.471 ns
MES
Zeolite (t ha−1)
03.35 ± 0.06 B0.797 ± 0.01 B28.92 ± 0.99 B8.67 ± 0.22 B
54.14 ± 0.11 A0.820 ± 0.01 AB32.11 ± 1.32 AB10.10 ± 0.34 A
7.54.48 ± 0.14 A0.834 ± 0.02 A33.76 ± 0.86 A10.98 ± 0.46 A
N Fertilization (kg N ha−1)
03.74 ± 0.15 b0.793 ± 0.01 b29.05 ± 1.15 b9.10 ± 0.26 b
1003.94 ± 0.18 ab0.819 ± 0.02 ab31.17 ± 1.02 ab9.79 ± 0.44 ab
1504.03 ± 0.19 ab0.821 ± 0.01 ab31.94 ± 1.83 ab10.09± 0.47 ab
2004.23 ± 0.26 a0.836 ± 0.01 a34.23 ± 1.07 a10.67 ± 0.70 a
Source of Variation
FZeolite32.127 ***4.359 *5.566 *13.501 ***
FFertilization3.072 *3.126 *3.149 *3.169 *
FZeolite×Fertilization0.819 ns1.321 ns0.443 ns1.207 ns
KAR
Zeolite (t ha−1)
03.62 ± 0.08 B0.853 ± 0.01 B29.99 ± 0.94 B9.96 ± 0.24 B
54.52 ± 0.11 A0.871 ± 0.01 A33.71 ± 1.19 A10.55 ± 0.37 AB
7.54.81 ± 0.10 A0.886 ± 0.01 A36.10 ± 0.83 A11.43 ± 0.31 A
N Fertilization (kg N ha−1)
04.09 ± 0.18 b0.851 ± 0.02 c30.44 ± 1.26 b9.85 ± 0.18 b
1004.26 ± 0.16 ab0.858 ± 0.01 bc33.08 ± 1.21 ab10.48 ± 0.39 ab
1504.40 ± 0.19 ab0.882 ± 0.01 ab34.31 ± 1.64 a10.93 ± 0.43 a
2004.52 ± 0.24 a0.888 ± 0.01 a35.24 ± 1.18 a11.33 ± 0.51 a
Source of Variation
FZeolite48.052 ***7.258 **10.552 ***6.172 **
FFertilization4.067 *6.339 **3.624 *3.363 *
FZeolite×Fertilization0.613 ns1.092 ns0.386 ns0.996 ns
ns  =  not significant (p  >  0.05), * = p  ≤  0.05, ** = p  ≤  0.01, *** = p  <  0.001. Statistically significant differences among zeolite application treatments within a location are depicted by different capital letters, whereas statistically significant differences between N fertilization regimes within an experimental site are depicted by different lowercase letters according to Tukey’s HSD test (p ≤ 0.05).
Table 9. Fiber length traits (upper half mean length (UHML), uniformity index (UI), and short fiber index (SFI)) as influenced by zeolite addition and N fertilization regimes over three experimental sites (ATH, MES, and KAR).
Fiber Length Traits
Upper Half Mean Length (UHML)
(mm)
Uniformity Index (UI)
(%)
Short Fiber Index (SFI)
(<12.5 in mm)
ATH
Zeolite (t ha−1)
027.56 ± 0.17 C79.48 ± 0.49 B8.02 ± 0.49 B
528.88 ± 0.33 B80.94 ± 0.51 AB9.43 ± 0.57 AB
7.529.73 ± 0.26 A82.35 ± 0.70 A10.97 ± 0.78 A
N Fertilization (kg N ha−1)
027.87 ± 0.32 b79.75 ± 0.51 b8.29 ± 0.38 c
10028.81 ± 0.28 a80.04 ± 0.46 b8.58 ± 0.53 bc
15029.04 ± 0.46 a81.94 ± 0.64 a10.42 ± 0.62 ab
20029.17 ± 0.51 a81.97 ± 1.02 a10.60 ± 0.49 a
Source of Variation
FZeolite25.959 ***7.995 **6.771 **
FFertilization5.619 **4.133 *3.415 *
FZeolite×Fertilization1.429 ns1.032 ns1.058 ns
MES
Zeolite (t ha−1)
026.82 ± 0.27 B78.05 ± 0.52 B7.91 ± 0.59 B
528.33 ± 0.34 A79.71 ± 0.48 A9.52 ± 0.62 AB
7.529.21 ± 0.44 A81.14 ± 0.79 A10.86 ± 0.77 A
N Fertilization (kg N ha−1)
027.20 ± 0.31 b78.39 ± 0.59 c8.27 ± 0.67 c
10028.09 ± 0.47 ab78.86 ± 0.51 bc8.53 ± 0.60 bc
15028.53 ± 0.39 a80.51 ± 0.57 ab10.33 ± 0.73 ab
20028.67 ± 0.70 a80.77 ± 0.74 a10.61 ± 1.02 a
Source of Variation
FZeolite13.766 ***8.001 **6.295 **
FFertilization3.138 *3.514 *4.128 *
FZeolite×Fertilization1.007 ns1.194 ns0.893 ns
KAR
Zeolite (t ha−1)
029.08 ± 0.29 B83.39 ± 0.59 B8.43 ± 0.62 B
529.73 ± 0.48 AB84.18 ± 0.70 AB9.16 ± 0.68 AB
7.530.83 ± 0.37 A85.96 ± 0.73 A11.09 ± 0.59 A
N Fertilization (kg N ha−1)
028.96 ± 0.21 b83.07 ± 0.53 b8.24 ± 0.40 b
10029.73 ± 0.69 ab83.21 ± 0.27 b8.31 ± 0.42 b
15030.04 ± 0.42 ab85.72 ± 0.72 a10.55 ± 0.91 ab
20030.80 ± 0.40 a86.04 ± 0.89 a11.13 ± 1.24 a
Source of Variation
FZeolite6.614 **3.409 *3.407 *
FFertilization3.671 *3.715 *3.048 *
FZeolite×Fertilization1.279 ns0.899 ns0.967 ns
ns  =  not significant (p  >  0.05), * = p  ≤  0.05, ** = p  ≤  0.01, *** = p  <  0.001. Statistically significant differences among zeolite application treatments within a location are depicted by different capital letters, whereas statistically significant differences between N fertilization regimes within an experimental site are depicted by different lowercase letters according to Tukey’s HSD test (p ≤ 0.05).
Table 10. Fiber color (fiber reflectance (Rd) and spinning consistency index (SCI)) and trash traits (trash area (TrAr) and trash grade (TrID)) as influenced by zeolite addition and N fertilization regimes over three experimental sites (ATH, MES, and KAR).
Color TraitsTrash Traits
Fiber Reflectance (Rd)Spinning Consistency Index (SCI)Trash Area (TrAr)
(%)
Trash Grade (TrID)
(1–7 index)
ATH
Zeolite (t ha−1)
071.39 ± 0.93 C141.75 ± 0.94 C0.343 ± 0.06 C3.8 ± 0.4 C
574.88 ± 0.57 B149.28 ± 1.72 B0.622 ± 0.11 B4.9 ± 0.2 B
7.578.56 ± 0.63 A154.69 ± 1.68 A0.916 ± 0.07 A5.8 ± 0.2 A
N Fertilization (kg N ha−1)
073.57 ± 1.06 b143.38 ± 1.90 b0.520 ± 0.11 b4.7 ± 0.5 a
10073.95 ± 0.93 b148.40 ± 1.61 a0.533 ± 0.13 b4.8 ± 0.4 a
15075.43 ± 1.19 ab150.86 ± 2.24 a0.609 ± 0.14 ab4.9 ± 0.3 a
20076.83 ± 1.73 a151.64 ± 3.13 a0.848 ± 0.08 a5.1 ± 0.4 a
Source of Variation
FZeolite29.273 ***35.435 ***14.625 ***11.703 ***
FFertilization3.802 *8.748 ***3.094 *0.315 ns
FZeolite×Fertilization0.832 ns1.912 ns1.077 ns1.072 ns
MES
Zeolite (t ha−1)
069.04 ± 0.79 C137.51 ± 1.53 B0.353 ± 0.05 B4.3 ± 0.3 B
572.71 ± 0.66 B146.12 ± 1.80 A0.698 ± 0.13 A5.3 ± 0.3 A
7.576.18 ± 1.02 A151.54 ± 2.60 A0.851 ± 0.10 A5.0 ± 0.2 AB
N Fertilization (kg N ha−1)
070.92 ± 1.10 c139.28 ± 1.98 b0.437 ± 0.07 b4.7 ± 0.5 a
10071.29 ± 1.15 bc144.37 ± 2.50 ab0.491 ± 0.13 b4.9 ± 0.2 a
15073.44 ± 1.33 ab147.59 ± 2.41 a0.709 ± 0.16 ab4.9 ± 0.2 a
20074.93 ± 1.56 a148.98 ± 4.04 a0.901 ± 0.12 a5.0 ± 0.4 a
Source of Variation
FZeolite23.188 ***16.389 ***6.941 **3.901 *
FFertilization4.857 **4.553 *3.621 *0.222 ns
FZeolite×Fertilization0.620 ns1.151 ns0.359 ns2.389 ns
KAR
Zeolite (t ha−1)
074.81 ± 0.83 C151.59± 1.63 B0.246 ± 0.06 B4.3 ± 0.5 A
577.59 ± 0.89 B155.56 ± 2.12 B0.649 ± 0.12 A4.8 ± 0.3 A
7.581.65 ± 0.97 A162.50 ± 2.86 A0.884 ± 0.10 A5.3 ± 0.3 A
N Fertilization (kg N ha−1)
076.13 ± 0.99 b150.60 ± 1.18 b0.418 ± 0.08 b4.6 ± 0.6 a
10076.31 ± 0.86 b156.59 ± 2.28 ab0.454 ± 0.12 b4.7 ± 0.3 a
15078.91 ± 1.51 ab156.67 ± 2.44 ab0.679 ± 0.18 ab4.9 ± 0.3 a
20080.72 ± 1.92 a162.34 ± 4.23 a0.822 ± 0.14 a5.0 ± 0.6 a
Source of Variation
FZeolite15.121 ***8.359 **12.099 ***1.338 ns
FFertilization4.654 *4.722 *3.188 *0.196 ns
FZeolite×Fertilization0.743 ns1.391 ns0.669 ns1.123 ns
ns  =  not significant (p  >  0.05), * = p  ≤  0.05, ** = p  ≤  0.01, *** = p  <  0.001. Statistically significant differences among zeolite application treatments within a location are depicted by different capital letters, whereas statistically significant differences between N fertilization regimes within an experimental site are depicted by different lowercase letters according to Tukey’s HSD test (p ≤ 0.05).
Disclaimer/Publisher’s Note: The statements, opinions and data contained in all publications are solely those of the individual author(s) and contributor(s) and not of MDPI and/or the editor(s). MDPI and/or the editor(s) disclaim responsibility for any injury to people or property resulting from any ideas, methods, instructions or products referred to in the content.

