Abstract
Land use and land cover (LULC) changes significantly shape urban environments and directly impact ecological and socioeconomic systems. This study aims to explore these interconnections by employing the Cellular Automata–Markov (CA–Markov) model to assess and predict LULC dynamics in Arkansas. Historical LULC datasets from 2001 to 2021, obtained from the National Land Cover Database, were simplified from 11 into 5 classes to facilitate analysis and effectively map transitions. The model was validated by predicting LULC for 2016 and 2021 and comparing the predictions with the real maps, achieving an overall accuracy of approximately 91.9%, using model validation metrics, including precision, recall, F1-score, and Kappa Coefficient, and highlighting the strength of the predictions. Predictions for 2026 and 2031 reveal a continuous increase in built-up areas at the expense of vegetation cover, underscoring ongoing urbanization trends. Specifically, built-up areas are projected to increase from 28.39% in 2021 to 30.15% in 2031, while vegetation cover is expected to decline from 49.30% to 47.48%. This research demonstrates the utility of the CA–Markov model in simulating urban growth patterns and provides actionable insights into sustainable urban planning and land management strategies.
1. Introduction
Land Use/Cover (LULC) change is one of the key issues in assessing environmental impacts and sustainable development [1]. Population growth and economic development act as driving forces, transforming various land covers such as vegetation and water. Since the 20th century, urbanization has accelerated quickly along with economic development, and as a result, urban populations continue to grow globally [2]. The United Nations (UN) statistics on trends in global urbanization highlight the urgent need to investigate how changes in LULC affect land surface temperature. According to these statistics, by 2018 about half of all people on the planet lived in cities, and by 2050, that number is expected to rise to an astounding 68% [3,4]. Approximately 2.5 billion additional people are predicted to live in urban areas by 2050 as a result of continuous urbanization and population expansion worldwide. This massive, fast urbanization process has not only accelerated socioeconomic development but also had a number of unfavorable impacts, such as the rise of the “urban challenges,” which is constituted by pollution, traffic jams, and heat islands [5]. The sustainable growth of cities and the surrounding areas is severely hindered by these impacts [6,7]. Recent heatwaves in different parts of the world have underscored the severity of these issues, leading to increased death and adverse ecological impacts [8]. Furthermore, a serious worry is the rising need for housing, services, and infrastructure to support growing urban populations.
Considering these problems, Arkansas cities are experiencing several significant challenges related to LULC changes and the associated increase in land surface temperature (LST) and urban heat islands (UHIs). One of the primary challenges is the rapid urbanization of its cities, driven by population growth, which results in higher demand for housing and infrastructure, ultimately leading to extensive land transformation and increased impervious surfaces, contributing to elevated LST [9,10]. Between 1993 and 2010, Arkansas’ population increased from approximately 2.42 million to 2.92 million, representing a growth of roughly 20%. Furthermore, from 2010 to 2022, the state′s population rose to approximately 3.05 million, signifying an additional increase of approximately 4% during this more recent period [11]. Additionally, the state′s substantial agricultural sector, including rice, soybeans, and cotton cultivation, contributes to LULC changes as natural landscapes are converted into cropland [12].
Understanding and analyzing the long-term dynamics of LULC in response to global population growth and its environmental implications requires precise studies [13]. These analyses are crucial for assessing diverse environmental changes and achieving sustainable development goals [14]. To provide a scientific basis for regional planning and sustainable development decisions, predictive models of LULC patterns can be very effective [15]. These models rely on past data to generate future LULC change scenarios [16,17,18]. Numerous remote sensing datasets, such as Landsat satellite imagery, provide a long-term record of Earth surface observations, offering a nearly global dataset of reliable information [19,20]. These datasets are invaluable for identifying, monitoring, and mapping the dynamics of LULC changes [21,22,23]. The National Land Cover Database (NLCD) provides reliable and spatially detailed information on LULC change across the United States [23].
Researchers have developed numerous operational models to simulate future land use changes. Since the 1990s, stochastic discrete event models, such as Markov chains and Cellular Automata–Markov (CA–Markov), have become the most used approaches for predicting land use changes. Using the CA–Markov, Huang forecasted the LULC change for the area of Beijing between 1992 and 2012 with the 5 years interval [24]. Their study highlighted a significant decrease in farmland and an increase in construction land, underscoring the need for policy interventions to achieve sustainable land use planning. Tariq et al. used the same model to model the changes in LST and LULC for Faisalabad, Pakistan between 1990−2018 [25]. Their findings indicated that CA–Markov chains performed effectively as a projecting model. Their results revealed significant urban growth, including an expansion in built-up areas and vegetation cover, highlighting the impacts of rapid urbanization and the importance of sustainable planning and land use policies. Forecasting future LULC scenarios involves incorporating various driving factors, including infrastructure and socioeconomic elements like road networks and human settlements, as well as physical terrain drivers such as slope derived from Digital Elevation Models (DEMs) [26,27,28,29]. The findings suggest that these driving forces significantly impact the spatial patterns of land use change.
Contemporary LULC prediction spans driver-based CA frameworks (e.g., SLEUTH, CLUE-S, PLUS, Dinamica EGO) and hybrid ML–CA approaches (e.g., RF-CA, ANN-CA) that learn suitability from roads, zoning, accessibility, and terrain [30,31,32,33,34,35,36,37]. Here we adopt CA–Markov as a parsimonious, NLCD-compatible baseline that yields transparent transition matrices and local neighborhood rules across metros, aligns with the 5-year NLCD cadence used for validation, and supports statewide comparability without assembling heterogeneous driver rasters [38,39,40,41,42]. We explicitly acknowledge the stationarity assumption (recent transitions approximating near-future behavior) and outline how, as harmonized driver layers mature for Arkansas, this baseline can extend to driver-informed or hybrid ML–CA formulations for non-stationary dynamics and scenario analysis.
Recent Arkansas-focused remote sensing studies provide strong retrospective evidence of land-cover dynamics but less coverage of forward simulations. For example, a Landsat time-series approach mapped annual urban expansion in Northwest Arkansas (NWA) (1995–2015), documenting rapid, spatially clustered growth tied to regional economic drivers [43], Around Little Rock, a fine-resolution (60 m) multi-decadal land-cover timeline (1857–2006) integrated historical maps, aerial photos, and national datasets to quantify long-term transitions [41]. Statewide applications summarized by the U.S. Geological Survey further highlight how Arkansas researchers use Landsat to track water/land dynamics and reservoir expansion, informing resource management [44]. We provide the first statewide, multi-metropolitan CA–Markov forecasts for Arkansas at 30 m, combining a uniform urban-AOI design with rolling 5-year validation (2016/2021) and Kappa to establish a transparent, NLCD-based baseline. This design delivers planning-aligned forecasts for 2026/2031 that are readily interpretable by practitioners and comparable across metros, while defining a clear path to driver-informed or hybrid ML–CA extensions as statewide socioeconomic and infrastructure datasets mature.
The objectives of this study are: (i) analyze and evaluate the dynamic patterns of LULC changes in NWA, Little Rock, and Fort Smith from 2001 to 2021. (ii) predict and project future LULC patterns for 2026 and 2031 using CA–Markov, offering valuable insights into potential scenarios of urban expansion and vegetation loss. (iii) facilitate the adoption of sustainable land management practices by identifying key drivers and trends of LULC changes, thereby aiding in informed decision-making and effective policy development.
2. Study Area
The study focuses on Arkansas’ developed metros, NWA cities, Little Rock, and Fort Smith. Arkansas lies in the south-central United States, covering 137,733 km2 and spanning roughly 33°–36.5° N and 89°–94.5° W (Figure 1). These metros rank among the state’s fastest-growing urban areas and have undergone substantial LULC change driven by urbanization, population growth, and economic development.
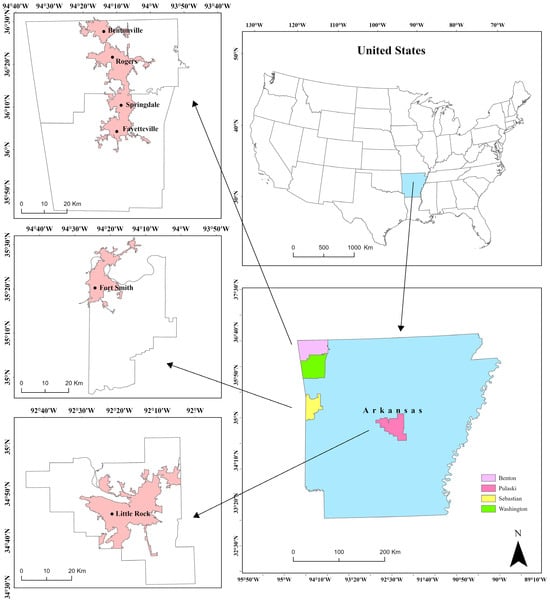
Figure 1.
Areas of interest (AOI) in northwest and central Arkansas, USA.
NWA comprising cities such as Fayetteville, Springdale, Rogers, and Bentonville, has emerged as a rapidly expanding metropolitan area. Its urban growth has been driven by a booming economy, large corporate headquarters, and increasing migration, leading to substantial conversion of natural and agricultural land into built-up areas. Little Rock, the state capital and the largest city, serves as a political, cultural, and economic hub, facing challenges related to urban sprawl and land use conflicts [43]. Fort Smith, located along the Arkansas-Oklahoma border, has a historical industrial base and is undergoing moderate urbanization while maintaining its industrial significance.
The study area includes diverse topographical and climatic conditions that influence LULC dynamics. The northwestern region of the study area experiences a humid subtropical climate with four distinct seasons, while the central and southern regions are characterized by hot summers and mild winters. The land cover of these cities consists of a mix of built-up areas, vegetation, water bodies, agricultural lands, and bare land. Increasing urban expansion and infrastructure development have resulted in a reduction in vegetation cover, contributing to environmental concerns such as rising LST, UHIs, and ecological disturbances.
With rapid urban expansion, industrial growth, and population pressure, the natural landscape of Arkansas’ developed cities is undergoing significant transformation. Understanding these changes and their environmental implications is crucial for sustainable urban planning and resource management, which forms the basis of this study.
3. Materials and Methods
3.1. Data Preparation for LULC Change Analysis
We used NLCD 2001/2006/2011/2016/2021 at the native 30 m resolution. To balance interpretability and model stability, NLCD was aggregated to five classes—Vegetation, Built-up, Cropland, Water, Bare land—with Vegetation combining forest, grassland, and (where present) shrub/scrub. This reduces class imbalance and sparsity while preserving contrasts relevant to urban-growth assessment. The full NLCD land cover classes to five-class mapping is provided in Table S1 in the Supplementary Materials. NLCD LULC maps to five-class aggregation used in this study.
All inputs/outputs were processed in Python 3.10.12 in Google Colab on the NLCD grid; categorical layers used nearest-neighbor resampling and continuous layers bilinear. We reclassified each NLCD epoch, computed inter-epoch change, and exported summary rasters to ArcGIS Pro 3.4 for map production. Urban AOIs for each metro (NWA, Little Rock, Fort Smith) were defined from NLCD Developed classes (open/low/medium/high) intersected with municipal boundaries to capture built-up cores and immediate edges. The workflow is summarized in Figure 2.
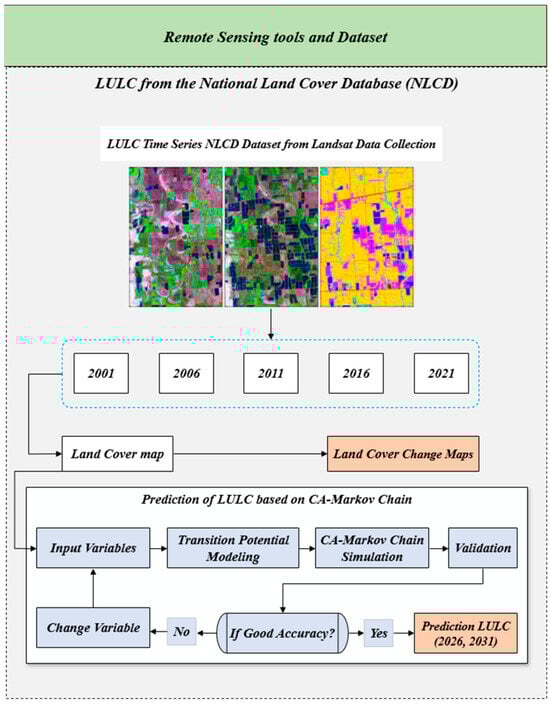
Figure 2.
Workflow for data, processing, modeling, and forecasting. Panel colors denote stage: green = data sources (NLCD, years 2001–2021), light blue = processing/modeling steps (input variables, transition-potential modeling, CA–Markov simulation), orange = outputs/validation (land-cover change maps, validation, predictions 2026/2031), gray (rounded) = decision/quality-control (if accuracy is acceptable). All rasters are on the NLCD 30 m grid.
For prediction, we implemented a CA–Markov scheme in Python 3.10.12 Transition matrices were estimated from historical NLCD, and a 3 × 3 neighborhood allocated spatial patterns. Validation used a rolling 5-year design: 2016 was predicted from 2006 to 2011 transitions applied to the 2011 base; 2021 from 2011 to 2016 applied to the 2016 base. We report Overall Accuracy, Cohen’s κ, and class-wise precision/recall/F1 (Section 4.2). The validated model was then applied to the 2021 base to forecast 2026 and 2031.
3.2. CA–Markov Model for LULC Predicton
The CA–Markov model integrates the temporal predictive power of Markov chains with the spatial allocation capabilities of CA to simulate LULC change [44]. In this study, it was applied to forecast future LULC for three regions in Arkansas: Little Rock, Fort Smith, and NWA cities (Fayetteville, Springdale, Rogers, and Bentonville). The predictions targeted the years 2026 and 2031, using 5-year and 10-year transition intervals, respectively. This study reports a single, trend-based baseline without exogenous conservation masks; no hard/soft constraints were applied so that allocations reflect recent NLCD-observed dynamics within the urban AOIs.
3.2.1. CA–Markov Model
The Markov chain is a series of random events in which the state at any given time is entirely determined by the previous state. Although every random variable in a Markov chain depends entirely on the state that came before it, the probability distribution that determines these transitions can change [11,27,44]. The Markov chain component quantifies how land cover transitions from one class to another based on historical LULC maps. [45,46,47]. It uses a transition probability matrix where each element represents the likelihood of a pixel of class i at time t becoming class j at time t + 1 [48,49]. The basic form is:
where S(t) represents the system status at time t, S (t + 1) represents is the projected system status, and P is the transition matrix where low transition will have near (0) probability and high transition have near (1) probabilities [50,51,52]. The transition matrix has the structure as follows:
This matrix is normalized such that each row sums to 1, ensuring valid probabilistic transitions. The aggregate change in land cover proportions can also be estimated using:
where p(t) is a vector of class proportions at time t, T is the transition matrix.
3.2.2. Cellular Automata Model
While the Markov model predicts the quantity of change, it does not specify where change occurs. To allocate changes spatially, the CA model uses local transition rules based on neighborhood effects. The spatial evolution rule is defined as:
where is the transition function, N is the spatial neighborhood.
Each pixel updates its state based on both its own transition probability and the effect of neighboring cells. In this study, a Moore neighborhood configuration was used, which includes the 8 surrounding pixels in a 3 × 3 grid [39]. The standard contiguity filter used is:
To model spatial land use dynamics, the CA component of the CA–Markov model was used to simulate neighborhood influence during land cover transitions. Each cell in the study area (i.e., pixel in the LULC raster) is assumed to be influenced by the land cover types of its surrounding cells. In this study, spatial interaction was incorporated using a 3 × 3 moving window (Moore neighborhood) that considers the eight adjacent pixels surrounding each focal cell [53,54,55]. This neighborhood structure boosts land cover changes to occur in connected clusters, rather than as isolated patches. For instance, areas of vegetation loss are more likely to expand outward from existing disturbed zones, reflecting realistic spatial development patterns [39].
The spatial influence was applied through a median filter, which smooths the classification and emphasizes local contiguity. Pixels located adjacent to dominant land cover classes such as built-up or vegetation are more likely to transition into those same classes. For example, a pixel surrounded by built-up areas is more likely to urbanize than one surrounded by forest or cropland. This approach avoids unrealistic patchiness and prevents land cover from changing arbitrarily across the landscape. Suitability for each transition is increased when neighboring pixels belong to the same class [25]. The spatial logic can be summarized as:
“The more cells of the same land cover type surrounding a pixel, the higher the suitability for that class, and the more likely the pixel will transition into that class. [56]”
The final LULC maps for 2026 and 2031 were generated by combining this neighborhood influence with the transition probabilities derived from observed LULC changes in earlier years. For 2026, transitions were based on 2016–2021 change patterns; for 2031, the model used the longer 2011–2021 transition interval. In both cases, the 2021 LULC map was used as the base for simulation. Starting from the 2021 base map, 2026 was generated with the 2016 to 2021 (); 2031 used a 10-year matrix estimated from 2011to 2021 () so that . This preserves consistency between each forecast horizon and the corresponding calibration interval.
Spatial allocation combines (i) contiguity (3 × 3 Moore neighborhood) to favor clustered growth and (ii) topographic feasibility (slope/aspect from 30 m DEM) to discourage implausible conversions on steep slopes [39]. Contiguity is computed via a moving-window kernel that boosts the dominant surrounding class; slope is normalized to [0,1] and applied as a penalty during allocation [49]. Water is treated as largely persistent (high self-transition), limiting conversions except along existing shorelines. Final suitability is scaled to respect class totals prescribed by the Markov transition matrix for each horizon. We evaluated sensitivity to (i) neighborhood size (3 × 3 vs. 5 × 5), and (ii) temporal window for transitions 2011–2016 vs. 2016–2021. Reported metrics include overall accuracy, and Cohen’s κ for 2016 and 2021. Larger neighborhoods increased contiguity but slightly elevated allocation disagreement at urban fringes; newer transition windows better captured recent urban infill.
We also mapped LULC as built-up gain only. For each pair 2001–2021 and 2001–2031, the later raster was projected and snapped to the earlier raster (NEAREST; identical cell size and intersection extent). We then coded gain where a pixel transitioned from any non–built-up class to built-up in the later year (loss and unchanged pixels are transparent).
To improve spatial accuracy in LULC forecasting, terrain characteristics were integrated directly into the CA–Markov prediction process for all three study areas: Northwest Arkansas, Little Rock, and Fort Smith. A 30-meter resolution DEM was processed to generate both slope and aspect layers. The slope was calculated as the rate of elevation change using first-order derivatives, while the aspect represented the directional orientation of each cell’s surface. These terrain factors were incorporated as part of the transition rules to constrain the likelihood of land cover change based on topographic feasibility.
This integrated modeling approach enabled a more realistic simulation of urban expansion, vegetation persistence, and land conversion by considering both statistical trends and biophysical constraints. The prediction was performed separately for each region and each target year (2026 and 2031), using region-specific transition matrices and topographic inputs.
4. Results
4.1. Simulated LULC
LULC analysis for Fort Smith, Little Rock, and NWA from 2001 to 2021 in Table 1 and Figure 3 reveals distinct trends in landscape transformations. Across all three regions, vegetation cover exhibited a continuous decline, with notable reductions in forested and green areas. In contrast, built-up areas expanded significantly, indicating urbanization-driven landscape modifications. This trend was particularly evident in Northwest Arkansas, where built-up areas increased from 209.95 km2 in 2001 to 275.09 km2 in 2021. A similar pattern emerged in Little Rock and Fort Smith, with urban expansion at the expense of vegetation.

Table 1.
The trend of land use area between 2001–2021.
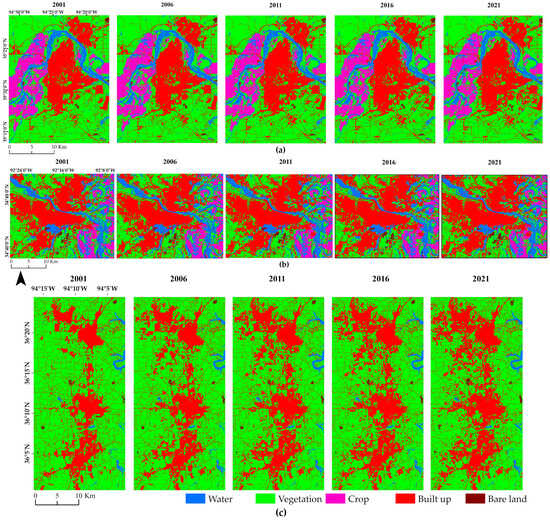
Figure 3.
LULC changes pattern: (a) Fort Smith, (b) Little Rock, and (c) NWA from 2001–2021.
Water bodies remained relatively stable, showing minor fluctuations across different years. The cropland category remained mostly unchanged in Fort Smith but showed a slight decrease in Little Rock. Interestingly, bare land exhibited minimal variations across all three regions, with a small increase observed in Fort Smith by 2021. The consistent decline in vegetation and the rise in built-up areas align with regional urban development trends, infrastructure expansion, and population growth (Figure 4).
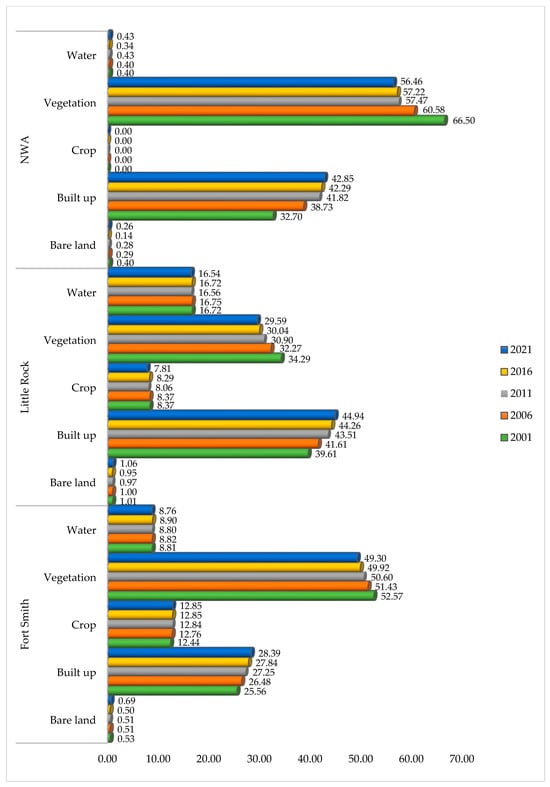
Figure 4.
Temporal changes in each LULC class in Arkansas from 2001 to 2021 (km2, NLCD 30 m).
Among Fort Smith, Little Rock, and NWA, NWA experienced the most significant LULC transformation, with built-up areas expanding by approximately 65.14 km2 over the past two decades. Little Rock also saw notable urban expansion, increasing by around 40.11 km2, supported by its role as the state capital and a transportation hub. Fort Smith had the slowest built-up expansion, with some urbanization replacing vegetation and bare land, while cropland remained relatively stable.
4.2. Model Validation
We validated the model using a rolling 5-year design. First, we evaluated 2006 to 2011 transitions with the 2011 base produced a 2016 prediction, and 2011 to 2016 transitions with the 2016 base produced a 2021 prediction. The model achieved an overall prediction accuracy of approximately 90%, indicating a strong agreement between the simulated results and real-world data. This high accuracy underscores the model’s effectiveness in capturing transition probabilities and spatial dependencies, which are critical for representing historical land use change dynamics.
The validation metrics, including precision (P), recall (R), and F1-score (F1), are presented in Table 2. These metrics demonstrate robust performance across most LULC types, with particularly high accuracy for water (F1: 91–94%), vegetation (F1: 88–94%), and built-up areas (F1: 85–94%). Additionally, Cohen’s Kappa (κ) indicates substantial to almost-perfect agreement across metros in both validation years (Table 3), complementing the class-wise F1 results.
Table 2.
Forecast classification metrics for 2026 and 2031—precision (P), recall (R), and F1-score (F1)—for predicted LULC classes in Fort Smith, Little Rock, and NWA.
Table 3.
Cohen’s Kappa (κ) for validation years by metropolitan area (κ is reported only for 2016 and 2021; forecast years 2026/2031 are not included).
Minor discrepancies between predicted and actual land cover were identified, primarily in regions experiencing rapid development or natural land restoration. For instance, slight overestimations of built-up areas and underestimations of vegetation were noted in Little Rock and Northwest Arkansas. These deviations may be attributed to unaccounted factors such as policy-driven conservation efforts, delays in urban expansion projects, or natural variability in land cover changes.
Despite these minor inconsistencies, the strong validation results confirm that the CA–Markov model is well-calibrated and capable of forecasting future LULC dynamics with reasonable confidence. The model’s performance across different regions and timeframes supports its applicability for scenario-based land use planning and policy analysis.
4.3. LULC Transition Probabilities and Transition Matrix of Years 2026 and 2031
To predict future LULC changes for Little Rock, Fort Smith, and NWA, two different modeling intervals were employed using the CA–Markov method. For the five-year forecast (2026), transition probabilities were derived from observed changes between 2016 and 2021, with the 2021 LULC map serving as the base input. For the ten-year forecast (2031), transitions were estimated using a longer interval based on 2011 to 2021 change patterns, again using the 2021 map as the simulation starting point. This structure ensured that all regional forecasts were prepared from a consistent base year while acquiring both short- and long-term land cover dynamics. The results presented in Table 4 illustrate significant trends in urban expansion, vegetation decline, and minor fluctuations in other land cover categories across the three metropolitan regions.
Table 4.
The total LULC changes in km2 between 2021, 2026 and 2031.
For Fort Smith, built-up areas are projected to increase from 28.39% in 2021 to 30.15% in 2031, while vegetation cover is expected to decrease from 49.30% to 47.48%. Water bodies remain relatively stable, with a slight decrease from 8.76% to 8.64%. Bare land exhibits minor fluctuations, reaching a peak of 0.81% in 2026 before declining to 0.76% in 2031. Agricultural land (crop) shows a marginal increase over the modeled period, from 12.85% to 12.96%.
In Little Rock, urban expansion follows a similar trend, with built-up areas increasing from 44.94% in 2021 to 47.28% in 2031. Vegetation cover declines from 29.59% to 27.59%, while agricultural land shows a slight decrease from 7.88% to 7.71%. Water bodies and bare land remain relatively stable, experiencing minor variations over the forecast period.
For NWA region, rapid urbanization is the dominant trend, with built-up areas projected to increase from 42.85% in 2021 to 48.58% in 2031. This expansion occurs at the expense of vegetation cover, which is expected to decline from 56.46% to 50.74%. Water coverage remains stable at approximately 0.42%, while bare land exhibits minimal fluctuations.
Across the forecast horizon, Built-up increases while Vegetation declines in all metros, with small absolute changes in Water and Bare land. From 2021 to 2031, Fort Smith Built-up grows by +1.76 km2 (+6.2%, +0.176 km2 yr−1) and Vegetation declines −1.82 km2 (−3.7%, −0.182 km2 yr−1); Little Rock Built-up grows +2.34 km2 (+5.2%, +0.234 km2 yr−1) with Vegetation −2.00 km2 (−6.8%, −0.200 km2 yr−1). Water changes are modest (FS −0.12 km2; LR −0.19 km2, both ≈−0.01–0.02 km2 yr−1), and Cropland is relatively stable (FS +0.11 km2; LR −0.17 km2 over 10 years). For NWA (2021–2026), Built-up increases +4.20 km2 (+9.8%, +0.84 km2 yr−1) while Vegetation decreases −4.30 km2 (−7.6%, −0.86 km2 yr−1); Water is nearly stable (−0.01 km2), and Bare land rises slightly (+0.11 km2) from a very small baseline. These rates are consistent with Vegetation to Built-up conversions concentrated at urban fringes and along growth corridors (Figure 5; Table 4).
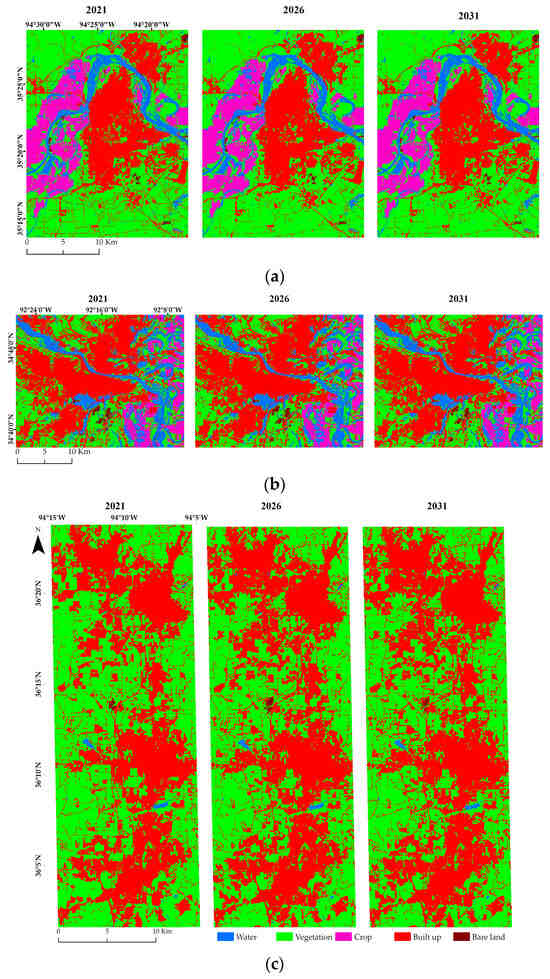
Figure 5.
LULC changes prediction pattern: (a) Fort Smith, (b) Little Rock, and (c) NWA from 2001–2021.
Table 5 shows the CA–Markov-derived LULC transition probability matrices for 2026 and 2031 to help one understand these changes. While off-diagonal entries catch land conversion tendencies—such as vegetation and agriculture moving into built-up areas—diagonal values reflect land persistence. These matrices provide a comprehensive picture of regional variations in land stability and urban transformation techniques, so giving important foresight for environmental management and sustainable planning.
Table 5.
Transition Probability Matrices for LULC Change (2026 and 2031).
The results indicate that urban expansion is the primary driver of LULC change across all three regions. Vegetation cover is continuously decreasing, emphasizing the impact of urbanization on natural landscapes. These trends provide critical insights for urban planners and policymakers in managing sustainable land use and mitigating environmental impacts associated with rapid urban growth. Figure 5 and Figure 6 depict observed LULC change (2001–2021) and projected allocations for 2026 and 2031 in NWA, Little Rock, and Fort Smith. Maps show built-up gain only (red), highlighting where non–built-up land converted to built-up; unchanged and losses are transparent.
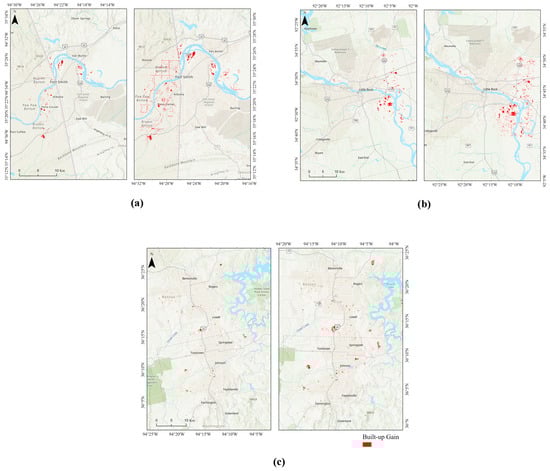
Figure 6.
Built-up gain (change-only) for Fort Smith (a) and Little Rock (b) and (c) NWA. Left panels show observed built-up gain between 2001–2021; right panels show projected built-up gain between 2001–2031. Red pixels mark transitions from non–built-up to built-up. Later-year rasters were aligned to the earlier year (snap, cell size), and maps use the intersection extent. (Basemap: Esri World Topographic Map (sources: Esri, TomTom, Garmin, FAO, NOAA, USGS, © OpenStreetMap contributors, and others), accessed [Nov 2025].
Across all metros, the dominant transition is Vegetation to Built-up, concentrated along the urban fringe and major transport corridors, with smaller pockets of Cropland to Built-up at metropolitan edges; NWA shows the most extensive outward expansion, Little Rock combines infill with westward growth, and Fort Smith exhibits comparatively limited expansion.
These allocations are consistent with the high F1 and κ values reported for the validation years, indicating that the spatial logic reflects observed trends while remaining trend-based at 30 m resolution. The maps highlight likely hot-spots of continued urbanization that can guide canopy protection, heat-mitigation, and zoning updates in near-term planning cycles.
5. Discussions
Human activity is one of the main sources of LULC change, while there are other multiple complicated factors that also play a role [54]. According to the study′s findings, there were notable LULC changes in Fort Smith, Little Rock, and NWA in Arkansas between 2001 and 2031. With an overall accuracy of 91.9%, the CA–Markov model demonstrated remarkable efficacy in simulating these dynamics. It performed especially well in forecasting transitions for vegetation, water bodies, and built-up areas. A clear trend of urban growth at the expense of agricultural and vegetative lands is shown by the findings. Built-up areas in NWA, which increased by 65.14 km2 between 2001 and 2021 and are predicted to increase from 42.85% in 2021 to 48.58% in 2031, are an important example of this pattern.
These results completely aligned with the recent population changes across the Arkansas cities. One of the primary challenges is the rapid urbanization of its cities, driven by population growth, which results in higher demand for housing and infrastructure, ultimately leading to extensive land transformation and increased impervious surfaces, contributing to elevated LST [9,10]. Between 1993 and 2010, Arkansas’ population increased from approximately 2.42 million to 2.92 million, representing a growth of roughly 20%. Furthermore, from 2010 to 2022, the state′s population rose to approximately 3.05 million, signifying an additional increase of approximately 4% during this more recent period [11]. Additionally, the state′s substantial agricultural sector, including rice, soybeans, and cotton cultivation, contributes to LULC changes as natural landscapes are converted into cropland [12].
The region′s economic growth is driven by corporate giants such as Walmart and Tyson Foods, as well as an influx of population associated with institutions like the University of Arkansas aligns with the rapid urbanization observed in NWA [57,58]. This growth has made NWA the focal point of LULC changes in the state, reflecting the highest rate of transformation compared to other regions [55,56].
Additionally, regional variations in LULC changes were evident. While Little Rock and Fort Smith also experienced urban expansion, their growth rates were slower, reflecting differences in economic drivers and land use policies. Notably, water bodies remained stable across all regions, suggesting minimal hydrological disruption from urban sprawl. However, the decline in vegetation cover particularly in NWA raises concerns about rising LST and UHI effects, which could exacerbate climate-related challenges in densely populated areas.
Despite the model’s strong performance, minor differences were observed, such as an overestimation of built-up growth in Little Rock and underestimation of vegetation recovery in NWA. These deviations may stem from unaccounted factors like policy-driven conservation efforts or delays in development projects. The CA–Markov model’s reliance on historical trends also presents a limitation, as it assumes past patterns will persist, potentially overlooking future policy shifts, economic disruptions, or climate impacts [9,10].
From a methodological perspective, the CA–Markov model integrates temporal change dynamics through transition probability matrices and enhances spatial realism via the cellular automata mechanism. This allows it to account for both class-level transitions and neighborhood interactions, making it well-suited for simulating future urban configurations [27,48]. However, one limitation of this model is its assumption that future transitions will follow historical trends. This assumption may not hold in the presence of abrupt socioeconomic or environmental shifts, such as new zoning policies or climate events [13].
Furthermore, the model does not incorporate explanatory variables such as population density, transportation networks, or economic incentives, which often influence land development. The accuracy of the transition matrix depends heavily on the quality of classified base maps and the temporal interval used. A finer temporal resolution might capture short-term dynamics better but also introduce noise if classification uncertainty is high [48].
The findings of the research have implications for sustainable urban development throughout the state of Arkansas. To reduce the consequences of UHI, green infrastructure projects like urban forestry and permeable surfaces are essential, as seen by the anticipated loss of vegetated area. Zoning laws and compact city planning may also be able to prevent unbridled urban growth while protecting natural and agricultural areas. Future research should explore integrated modeling approaches that incorporate socioeconomic drivers (e.g., population density, transportation networks) to enhance predictive accuracy and support more resilient land use strategies. Future scenarios could also incorporate conservation constraints (e.g., hard veto for protected lands/floodplains; soft penalties near riparian buffers) to test policy-relevant alternatives.
6. Limitations
This study provides trend-based forecasts using a CA–Markov framework and should be interpreted with several constraints. First, the model assumes stationarity of recent transition patterns; abrupt policy, economic, or hazard shocks may invalidate this assumption. Second, analyses are limited to urbanized areas, so non-urban processes and peri-urban heterogeneity are under-represented. Third, class aggregation (forest, grassland, shrub/scrub to Vegetation) at 30 m improves stability but masks within-vegetation differences and may propagate NLCD classification errors to transitions. Fourth, spatial detail is constrained by 30 m resolution and a 3 × 3 neighborhood, which can smooth fine-scale infill and corridor features. Finally, driver variables (e.g., roads, zoning, population density) and uncertainty bands for 2026/2031 were not included; future work will integrate driver-informed suitability (or hybrid ML–CA), sensitivity analysis, and uncertainty quantification. This concise treatment aligns with common practice in CA–Markov applications that report accuracy with Kappa and briefly note scope and data limits.
7. Conclusions
This study provides a statewide, multi-metropolitan CA–Markov baseline for Arkansas using harmonized NLCD inputs and a temporally consistent 5-year step design. The contribution is twofold: (i) a transparent, comparable framework that yields planning-ready forecasts for Arkansas’ principal metros using uniform assumptions, and (ii) an explicit, out-of-sample validation protocol aligned with NLCD epochs to support credible near-term projections.
From a planning perspective, the maps and class dynamics offer actionable guidance on where urban growth pressures are most likely to concentrate in the next decade, supporting interventions such as growth-management near urban edges, targeted infill, and canopy/green-infrastructure preservation along development corridors. Because the approach is lightweight and NLCD-compatible, it is readily transferable to other U.S. urban regions seeking consistent, baseline foresight.
We acknowledge scope limits, most notably the trend-based (stationary) transitions, five-class aggregation, and a study area focus, and view this baseline as a foundation for richer scenario work. Future research will incorporate non-stationary, driver-informed transitions and hybrid ML–CA suitability, couple forecasts with socioeconomic and policy modules (e.g., zoning, transport access, conservation constraints), and report uncertainty using ensemble and bootstrap strategies. Together, these extensions will enable policy-relevant, multi-scenario exploration while preserving the comparability established here.
Supplementary Materials
The following supporting information can be downloaded at: https://www.mdpi.com/article/10.3390/geomatics5040062/s1, Table S1: NLCD LULC maps to five-class aggregation used in this study.
Author Contributions
All authors contributed to the design of the methodology and writing of the article. R.V. conducted the paper as part of his PhD program, collected the data, and performed the analysis. M.H.A. provided supervision, resources, and contributed to the review, editing, and guidance throughout the research process. All authors participated in the preparation of the manuscript and approved the final version for publication. All authors have read and agreed to the published version of the manuscript.
Funding
This research received no external funding.
Data Availability Statement
The datasets used in this study are publicly available from open-access sources. Satellite data were obtained from NLCD and USGS Earth Explorer. All data sources are properly cited within the manuscript The data presented in this study are available on request from the corresponding author. Publicly available inputs used in this study include the National Land Cover Database (NLCD, 2001–2021) from the USGS MRLC program (https://www.mrlc.gov/).
Conflicts of Interest
The authors declare no conflicts of interest or state.
References
- Afuye, G.A.; Nduku, L.; Kalumba, A.M.; Santos, C.A.G.; Orimoloye, I.R.; Ojeh, V.N.; Thamaga, K.H.; Sibandze, P. Global Trend Assessment of Land Use and Land Cover Changes: A Systematic Approach to Future Research Development and Planning. J. King Saud Univ. Sci. 2024, 36, 103262. [Google Scholar] [CrossRef]
- Cai, Y.; Zhang, H.; Zheng, P.; Pan, W. Quantifying the Impact of Land Use/Land Cover Changes on the Urban Heat Island: A Case Study of the Natural Wetlands Distribution Area of Fuzhou City, China. Wetlands 2016, 36, 285–298. [Google Scholar] [CrossRef]
- Son, N.-T.; Chen, C.-F.; Chen, C.-R.; Thanh, B.-X.; Vuong, T.-H. Assessment of Urbanization and Urban Heat Islands in Ho Chi Minh City, Vietnam Using Landsat Data. Sustain. Cities Soc. 2017, 30, 150–161. [Google Scholar] [CrossRef]
- UN|DESA|United Nations Department of Economic and Social Affairs. 68% of the World Population Projected to Live in Urban Areas by 2050, Says UN. Available online: https://www.un.org/development/desa/en/news/population/2018-revision-of-world-urbanization-prospects.html (accessed on 8 November 2023).
- Silva, J.S.; da Silva, R.M.; Santos, C.A.G. Spatiotemporal Impact of Land Use/Land Cover Changes on Urban Heat Islands: A Case Study of Paço Do Lumiar, Brazil. Build. Environ. 2018, 136, 279–292. [Google Scholar] [CrossRef]
- Wu, W.; Li, C.; Liu, M.; Hu, Y.; Xiu, C. Change of Impervious Surface Area and Its Impacts on Urban Landscape: An Example of Shenyang between 2010 and 2017. Ecosyst. Health Sustain. 2020, 6, 1767511. [Google Scholar] [CrossRef]
- Keivani, R. A Review of the Main Challenges to Urban Sustainability. Int. J. Urban Sustain. Dev. 2009, 1, 5–16. [Google Scholar] [CrossRef]
- Yadav, N.; Rajendra, K.; Awasthi, A.; Singh, C.; Bhushan, B. Systematic Exploration of Heat Wave Impact on Mortality and Urban Heat Island: A Review from 2000 to 2022. Urban Clim. 2023, 51, 101622. [Google Scholar] [CrossRef]
- Saha, M.; Al Kafy, A.; Bakshi, A.; Al-Faisal, A.; Almulhim, A.; Rahaman, Z.; Al Rakib, A.; Fattah, M.; Akter, K.; Rahman, M.; et al. Modelling Microscale Impacts Assessment of Urban Expansion on Seasonal Surface Urban Heat Island Intensity Using Neural Network Algorithms. Energy Build. 2022, 275, 112452. [Google Scholar] [CrossRef]
- Yan, H.; Edwards, F.G. Effects of Land Use Change on Hydrologic Response at a Watershed Scale, Arkansas. J. Hydrol. Eng. 2013, 18, 1779–1785. [Google Scholar] [CrossRef]
- U.S. Census Bureau QuickFacts: Arkansas. Available online: https://www.census.gov/ (accessed on 3 September 2023).
- Lark, T.J.; Schelly, I.H.; Gibbs, H.K. Accuracy, Bias, and Improvements in Mapping Crops and Cropland across the United States Using the USDA Cropland Data Layer. Remote Sens. 2021, 13, 968. [Google Scholar] [CrossRef]
- Selmy, S.A.H.; Kucher, D.E.; Mozgeris, G.; Moursy, A.R.A.; Jimenez-Ballesta, R.; Kucher, O.D.; Fadl, M.E.; Mustafa, A.-r.A. Detecting, Analyzing, and Predicting Land Use/Land Cover (LULC) Changes in Arid Regions Using Landsat Images, CA-Markov Hybrid Model, and GIS Techniques. Remote Sens. 2023, 15, 5522. [Google Scholar] [CrossRef]
- van Soest, H.L.; van Vuuren, D.P.; Hilaire, J.; Minx, J.C.; Harmsen, M.J.H.M.; Krey, V.; Popp, A.; Riahi, K.; Luderer, G. An-alysing Interactions among Sustainable Development Goals with Integrated Assessment Models. Glob. Transit. 2019, 1, 210–225. [Google Scholar] [CrossRef]
- da Cunha, E.R.; Santos, C.A.G.; da Silva, R.M.; Bacani, V.M.; Pott, A. Future Scenarios Based on a CA-Markov Land Use and Land Cover Simulation Model for a Tropical Humid Basin in the Cerrado/Atlantic Forest Ecotone of Brazil. Land Use Policy 2021, 101, 105141. [Google Scholar] [CrossRef]
- Mutale, B.; Qiang, F. Modeling Future Land Use and Land Cover under Different Scenarios Using Patch-Generating Land Use Simulation Model. A Case Study of Ndola District. Front. Environ. Sci. 2024, 12, 1362666. [Google Scholar] [CrossRef]
- Ambarwulan, W.; Yulianto, F.; Widiatmaka, W.; Rahadiati, A.; Tarigan, S.D.; Firmansyah, I.; Hasibuan, M.A.S. Modelling Land Use/Land Cover Projection Using Different Scenarios in the Cisadane Watershed, Indonesia: Implication on Deforestation and Food Security. Egypt. J. Remote Sens. Space Sci. 2023, 26, 273–283. [Google Scholar] [CrossRef]
- Sleeter, B.M.; Wilson, T.S.; Sharygin, E.; Sherba, J.T. Future Scenarios of Land Change Based on Empirical Data and Demographic Trends—Sleeter—2017—Earth’s Future—Wiley Online Library. Earth Future 2017, 5, 1068–1083. [Google Scholar] [CrossRef]
- García-Álvarez, D.; Nanu, S.F. Land use cover datasets: A review. In Land Use Cover Datasets and Validation Tools; SpringerLink: Berlin/Heidelberg, Germany, 2022; Available online: https://link.springer.com/chapter/10.1007/978-3-030-90998-7_4 (accessed on 17 January 2025).
- Pande, C.; Moharir, K.; Varade, A.; Abdo, H.; Mulla, S.; Yaseen, Z. Intertwined Impacts of Urbanization and Land Cover Change on Urban Climate and Agriculture in Aurangabad City (MS), India Using Google Earth Engine Platform. J. Clean. Prod. 2023, 422, 138541. [Google Scholar] [CrossRef]
- Yu, L.; Shi, Y.; Gong, P. Land Cover Mapping and Data Availability in Critical Terrestrial Ecoregions: A Global Perspective with Landsat Thematic Mapper and Enhanced Thematic Mapper plus Data. Biol. Conserv. 2015, 190, 34–42. [Google Scholar] [CrossRef]
- Hemati, M.; Hasanlou, M.; Mahdianpari, M.; Mohammadimanesh, F. A Systematic Review of Landsat Data for Change Detection Applications: 50 Years of Monitoring the Earth. Remote Sens. 2021, 13, 2869. [Google Scholar] [CrossRef]
- Gutman, G.; Huang, C.; Chander, G.; Noojipady, P.; Masek, J.G. Assessment of the NASA–USGS Global Land Survey (GLS) Datasets. Remote Sens. Environ. 2013, 134, 249–265. [Google Scholar] [CrossRef]
- Huang, Y.; Yang, B.; Wang, M.; Liu, B.; Yang, X. Analysis of the Future Land Cover Change in Beijing Using CA-Markov Chain Model. Environ. Earth Sci. 2020, 79, 60. [Google Scholar] [CrossRef]
- Tariq, A.; Shu, H. CA-Markov Chain Analysis of Seasonal Land Surface Temperature and Land Use Land Cover Change Using Optical Multi-Temporal Satellite Data of Faisalabad, Pakistan. Remote Sens. 2020, 12, 3402. [Google Scholar] [CrossRef]
- Gebresellase, S.H.; Wu, Z.; Xu, H.; Muhammad, W.I. Scenario-Based LULC Dynamics Projection Using the CA–Markov Model on Upper Awash Basin (UAB), Ethiopia. Sustainability 2023, 15, 1683. [Google Scholar] [CrossRef]
- Mondal, S.; Sharma, N.; Garg, P.K.; Kappas, M. Statistical Independence Test and Validation of CA Markov Land Use Land Cover (LULC) Prediction Results. Egypt. J. Remote Sens. Space Sci. 2016, 19, 259–272. [Google Scholar] [CrossRef]
- Das, D.; Prodhan, F.A.; Hoque, M.Z.; Haque, M.E.; Kabir, M.H. Monitoring and Future Prediction of Land Use Land Cover Dynamics in Northern Bangladesh Using Remote Sensing and CA-ANN Model. Earth 2025, 6, 73. [Google Scholar] [CrossRef]
- Delgado, E.; Barboza, E.; Rojas-Briceño, N.B.; Cotrina-Sanchez, A.; Valdés-Velásquez, A.; de la Lama, R.L.; Llerena-Cayo, C.; de la Puente, S. Modeling and Predicting Land Use and Land Cover Changes Using Remote Sensing in Tropical Coastal Eco-systems of Southern Peru. Environ. Sci. Eur. 2025, 37, 139. [Google Scholar] [CrossRef]
- Kondum, F.A.; Rowshon, K.; Luqman, C.A.; Hasfalina, C.M.; Zakari, M.D. Change Analyses and Prediction of Land Use and Land Cover Changes in Bernam River Basin, Malaysia. Remote Sens. Appl. Soc. Environ. 2024, 36, 101281. [Google Scholar] [CrossRef]
- da Silva Cruz, J.; Blanco, C.J.C.; de Oliveira Júnior, J.F. Modeling of Land Use and Land Cover Change Dynamics for Future Projection of the Amazon Number Curve. Sci. Total Environ. 2022, 811, 152348. [Google Scholar] [CrossRef]
- Gaur, S.; Mittal, A.; Bandyopadhyay, A.; Holman, I.; Singh, R. Spatio-Temporal Analysis of Land Use and Land Cover Change: A Systematic Model Inter-Comparison Driven by Integrated Modelling Techniques. Int. J. Remote Sens. 2020, 41, 9229–9255. [Google Scholar] [CrossRef]
- Kiziridis, D.A.; Mastrogianni, A.; Pleniou, M.; Tsiftsis, S.; Xystrakis, F.; Tsiripidis, I. Improving the Predictive Performance of CLUE-S by Extending Demand to Land Transitions: The Trans-CLUE-S Model. Ecol. Model. 2023, 478, 110307. [Google Scholar] [CrossRef]
- Duan, X.; Haseeb, M.; Tahir, Z.; Mahmood, S.A.; Tariq, A. Analyzing and Predicting Land Use and Land Cover Dynamics Using Multispectral High-Resolution Imagery and Hybrid CA-Markov Modeling. Land Use Policy 2025, 157, 107655. [Google Scholar] [CrossRef]
- Bhattacharjee, S.; Sharma, N.; Salim, M.; Garg, R.D.; Sharma, K. Predictive Modeling of Land Cover Changes in Round-1 Smart Cities of India Using Cellular Automata and GIS. Discov. Cities 2025, 2, 6. [Google Scholar] [CrossRef]
- Floreano, I.X.; de Moraes, L.A.F. Land Use/Land Cover (LULC) Analysis (2009–2019) with Google Earth Engine and 2030 Prediction Using Markov-CA in the Rondônia State, Brazil. Environ. Monit. Assess. 2021, 193, 239. [Google Scholar] [CrossRef]
- Marzougui, M.; Sampedro, G.A.; Almadhor, A.; Alsubai, S.; Al Hejaili, A.; Abbas, S. Deep Learning-Based Spatial Pattern Modeling for Land Use and Land Cover Classification Using Satellite Imagery. Meteorol. Appl. 2025, 32, e70064. [Google Scholar] [CrossRef]
- Taloor, A.K.; Sharma, S.; Parsad, G.; Jasrotia, R. Land Use Land Cover Simulations Using Integrated CA-Markov Model in the Tawi Basin of Jammu and Kashmir India. Geosyst. Geoenviron. 2024, 3, 100268. [Google Scholar] [CrossRef]
- Surabuddin Mondal, M.; Sharma, N.; Kappas, M.; Garg, P.K. Ca Markov Modeling of Land Use Land Cover Dynamics and Sensitivity Analysis to Identify Sensitive Parameter(S). Int. Arch. Photogramm. Remote Sens. Spat. Inf. Sci. 2019, 42, 723–729. [Google Scholar] [CrossRef]
- Hasnine, M.; Rukhsana. Spatial and Temporal Analysis of Land Use and Land Cover Change in and Around Kolkata City, India, Using Geospatial Techniques. J. Indian Soc. Remote Sens. 2023, 51, 1037–1056. [Google Scholar] [CrossRef]
- Reynolds, R.; Liang, L.; Li, X.; Dennis, J. Monitoring Annual Urban Changes in a Rapidly Growing Portion of Northwest Ar-kansas with a 20-Year Landsat Record. Remote Sens. 2017, 9, 71. [Google Scholar] [CrossRef]
- Lin, C.; Wu, C.-C.; Tsogt, K.; Ouyang, Y.-C.; Chang, C.-I. Effects of Atmospheric Correction and Pansharpening on LULC Classification Accuracy Using WorldView-2 Imagery. Inf. Process. Agric. 2015, 2, 25–36. [Google Scholar] [CrossRef]
- Jawarneh, R.; Abulibdeh, A.; Hashem, N.; Awawdeh, M.; Al-Awadhi, T.; Abdullah, M.; Kenawy, A. Assessing and Predicting Land Cover Dynamics for Environmental Sustainability in Jordan’s Arid Ecosystems Using CA-Markov Model. Remote Sens. Appl. Soc. Environ. 2024, 35, 101262. [Google Scholar] [CrossRef]
- U.S. Geological Survey. Arkansas and Landsat; U.S. Geological Survey: Reston, VA, USA, 2022.
- U.S. Geological Survey. National Land Cover Database. Available online: https://www.usgs.gov/centers/eros/science/national-land-cover-database (accessed on 17 January 2025).
- Hu, X.; Zhu, W.; Shen, X.; Bai, R.; Shi, Y.; Li, C.; Zhao, L. Exploring the Predictive Ability of the CA–Markov Model for Urban Functional Area in Nanjing Old City. Sci. Rep. 2024, 14, 18453. [Google Scholar] [CrossRef] [PubMed]
- Okwuashi, O.; Ndehedehe, C.E. Integrating Machine Learning with Markov Chain and Cellular Automata Models for Mod-elling Urban Land Use Change. Remote Sens. Appl. Soc. Environ. 2021, 21, 100461. [Google Scholar] [CrossRef]
- Kang, J.; Fang, L.; Li, S.; Wang, X. Parallel Cellular Automata Markov Model for Land Use Change Prediction over MapReduce Framework. ISPRS Int. J. Geo-Inf. 2019, 8, 454. [Google Scholar] [CrossRef]
- Theres, L.; Radhakrishnan, S.; Rahman, A. Simulating Urban Growth Using the Cellular Automata Markov Chain Model in the Context of Spatiotemporal Influences for Salem and Its Peripherals, India. Earth 2023, 4, 296–314. [Google Scholar] [CrossRef]
- Ouma, Y.O.; Nkwae, B.; Odirile, P.; Moalafhi, D.B.; Anderson, G.; Parida, B.; Qi, J. Land-Use Change Prediction in Dam Catchment Using Logistic Regression-CA, ANN-CA and Random Forest Regression and Implications for Sustainable Land–Water Nexus. Sustainability 2024, 16, 1699. [Google Scholar] [CrossRef]
- He, C.; Okada, N.; Zhang, Q.; Shi, P.; Li, J. Modelling Dynamic Urban Expansion Processes Incorporating a Potential Model with Cellular Automata. Landsc. Urban Plan. 2008, 86, 79–91. [Google Scholar] [CrossRef]
- Ghosh, P.; Mukhopadhyay, A.; Chanda, A.; Mondal, P.; Akhand, A.; Mukherjee, S.; Nayak, S.K.; Ghosh, S.; Mitra, D.; Ghosh, T.; et al. Application of Cellular Automata and Markov-Chain Model in Geospatial Environmental Modeling—A Review. Remote Sens. Appl. Soc. Environ. 2017, 5, 64–77. [Google Scholar] [CrossRef]
- ScienceDirect Topics. Transition Probability Matrix—An Overview. Available online: https://www.sciencedirect.com/topics/mathematics/transition-probability-matrix (accessed on 22 February 2025).
- Carrillo-Niquete, G.A.; Andrade, J.L.; Valdez-Lazalde, J.R.; Reyes-García, C.; Hernández-Stefanoni, J.L. Characterizing Spatial and Temporal Deforestation and Its Effects on Surface Urban Heat Islands in a Tropical City Using Landsat Time Series. Landsc. Urban Plan. 2022, 217, 104280. [Google Scholar] [CrossRef]
- Zaitsev, D.A. A Generalized Neighborhood for Cellular Automata. Theor. Comput. Sci. 2017, 666, 21–35. [Google Scholar] [CrossRef]
- Yang, Y.; Zhang, M.; Li, Q.; Chen, B.; Gao, Z.; Ning, G.; Liu, C.; Li, Y.; Luo, M. Modulations of Surface Thermal Environment and Agricultural Activity on Intraseasonal Variations of Summer Diurnal Temperature Range in the Yangtze River Delta of China. Sci. Total Environ. 2020, 736, 139445. [Google Scholar] [CrossRef] [PubMed]
- Tyson Foods Inc. Tyson Foods Reports Fourth Quarter and Fiscal 2023 Results. Available online: https://www.tysonfoods.com/news/news-releases/2023/8/tyson-foods-reports-fourth-quarter-2023-results (accessed on 20 November 2023).
- Walmart. Walmart Releases 2022 Annual Report and Proxy Statement. Available online: https://corporate.walmart.com/news/2022/04/21/walmart-releases-2022-annual-report-and-proxy-statement (accessed on 20 November 2023).
Disclaimer/Publisher’s Note: The statements, opinions and data contained in all publications are solely those of the individual author(s) and contributor(s) and not of MDPI and/or the editor(s). MDPI and/or the editor(s) disclaim responsibility for any injury to people or property resulting from any ideas, methods, instructions or products referred to in the content. |
© 2025 by the authors. Licensee MDPI, Basel, Switzerland. This article is an open access article distributed under the terms and conditions of the Creative Commons Attribution (CC BY) license (https://creativecommons.org/licenses/by/4.0/).