Abstract
To satisfy the needs of an ever-growing population, it is imperative to cope with the extended demand for copper. To do so, copper makers mostly rely on pyrometallurgical processes that are characterized by emitting hazardous gases and solid wastes, and by the fact that these processes are energy demanding. Additionally, copper makers face the issue of processing leaner ore bodies or exploiting mineral deposits already overexploited or about to end their productivity cycle. These problems compromise the sustainable production of copper. Because of that, this study focuses on the leading technology in use to assess and identify possible solutions in order to improve the efficiency of energy usage and to decrease the amount of wastes generated in copper pyrometallurgy. To do so, reliable thermodynamic databases and Sankey diagrams were used to determine possible improvements. For example, it is determined that by increasing the mass ratio of Fe/Cu in the mineral feedstock may result in increasing the copper content in the matte, and thus reducing the exergy flows, resulting in improved energy usage. Another positive impact is that using oxygen-enriched air with higher copper concentrations could decrease SO2 emissions by nearly 25%. Among other detrimental environmental issues, they entail.
1. Introduction
Copper is a key commodity associated with human activities. As the worldwide population grows, it is expected that a substantial increase its demand will be experienced. Different studies [1,2,3] have been conducted to forecast the supply and demand of such metal. To do so, distinct models under different scenarios have been utilized, and consequently different data have been obtained. Regardless of these differences, a common finding is that the demand for copper will increase to 350% by 2050.
To cope with such a figure, copper makers will face several challenges, and among them is the exploitation of already overexploited copper ores and the processing of leaner ore bodies. The key issue associated with these mineral deposits is the actual energy usage [4].
Refining copper ores with lower copper contents demand more energy, as associated gangue materials are processed along with the copper. A consequence of this is the production of wastes. To overcome these detrimental effects and to cope with the global demand for copper, the copper extraction processes need to become more efficient energy wise. Nearly 80% of copper production is conducted through the use of pyrometallurgical processes, whereas hydrometallurgical routes to produce copper approaches approximate 20% [5].
As leaner ore bodies are processed, the feasibility of using metallurgical routes has to be evaluated [6,7]. If the mineral body with low copper content (down to 0.1%) to be treated does not require fine grinding, then pyrometallurgical processing should be used; on the other hand, if fine grinding is needed, then heap leaching followed by direct smelting should be considered [8]. These criteria to select one process route over another have serious implications in terms of energy usage and waste generation. Provided that no fine grinding is required, more copper metal is produced pyrometallurgically; however, this process is more energy-intensive and produces unwanted SO2 gas.
Traditional copper pyrometallurgy comprises three sequential stages: (i) smelting (bath and flash), (ii) converting, and (iii) fire refining [6,7]; however, modern technologies tend to integrate these process steps into a single continuous operation [6] such as the SKS/BBS reactor [8]. In either case, energy consumption and gaseous emissions remain environmental issues. As long as these problems exist, it is impossible to truly think about sustainable copper production. Perhaps a way to start addressing these issues would be by implementing exergy analysis in conjunction with life cycle analysis indicators [9,10,11].
Previous studies on the subject matter focused on the use of energy and the implementation of possible strategies to either recover energy or to decrease its consumption along the production chain of copper [4,12,13,14]. Such studies are based solely on energy and mass balances. This paper focuses on using exergy analysis instead of conventional energy balances to detect possible improvements in the energy usage and to mitigate environmental impacts associated with copper pyrometallurgy. To do so, in the paper we describe the current pyrometallurgical route used in copper making along with a brief description of the leading technology in use and the key chemical reactions that take place on each of the processing stages. After such description, exergy and the methods of computation are described, and finally we present the results and the conclusions that we obtained from our results and analyses are presented.
2. Copper Pyrometallurgy Operations
2.1. Description of Copper Processing Stages
Conventional copper pyrometallurgy involves a series of furnace stages to increase the relative copper content by selective oxidation of both sulphur and iron, and other minor impurities such as selenium, tellurium, cadmium, etc.
The oxidation of sulfur takes place by reacting the copper and iron sulfides in the mineral concentrate. As sulfur oxidizes, iron reacts with oxygen to form iron oxides, which are captured by silica fluxes added in the smelting and converting stages. Silicon oxide from the flux and the iron oxides combine to form an iron silicate known as fayalite, which is the base of the different slags produced in copper making. Other oxidized elements are captured by the fayalite slag, helping to increase the copper content until a purity of 99.99 wt% is achieved after the final copper refining stage [6].
During smelting, some of the iron is partially oxidized to form a fayalite slag. Additionally, upon sulfur oxidation, the heat evolved from that reaction is used to melt the copper concentrate (20 to 30 wt% Cu) into a mixture of molten sulfides, known as matte. Mattes contain between 50 and 75 wt% in copper.
The smelting operation typically occurs at 1200 °C and it can be represented by Equation (1):
Once smelting is completed, the matte is transferred to a converter to “convert” it into blister copper. The converting operation is the selective oxidation of the Cu-Fe-S molten matte to obtain nearly pure copper, containing between 98 and 99.5 wt% Cu, as shown in Equation (2).
Converting consists of two stages. The first stage is described by Equation (3a,b), and is known as the slag blow, during which oxygen-enriched air is injected into the matte to oxidize the dissolved iron. The iron oxide that is formed combines with silica flux to produce a fayalite slag. Sulfur in the matte is removed as SO2 gas. The slag blow stops when the iron content decreases to below 1 wt%, after which the slag is discharged and returned to the smelter to recover the copper droplets entrained in the slag.
The slag blow is followed by the copper blow, during which most of the remaining sulfur in the matte is oxidized to SO2 gas, and a liquid alloy phase called blister copper is formed with copper concentration up to 99.5%, as shown in Equation (4).
After conversion, the blister copper is taken to the fire refining furnace, where an oxidizing gas is used to remove the remaining sulfur and minor impurities from the molten alloy, while oxidizing some of the copper as well. Once the alloy oxygen content approaches 1 wt%, a CO- and H2-containing reducing gas is used to reduce copper oxides and achieve a copper concentration of at least 99.99% Cu [15]. The fire-refined copper is cast into anodes for electrorefining into a high-purity metal.
All the SO2 gas coming from the different process stages is collected and sent to an acid plant to produce sulfuric acid. Oxygen-enriched air and even pure oxygen are used in copper refining to help fix the SO2 and reduce emissions. This effect will be discussed in the subsequent sections of this paper.
Another issue to consider in copper pyrometallurgy is the mineral feedstock. The main mineral species that comprises concentrates that feed copper refineries is chalcopyrite (CuFeS2); however, concentrates also contain other sulfide minerals such as bornite (Cu5FeS4), chalcocite (Cu2S), covellite (CuS), and pyrite (FeS2), among others. Given the relative amounts of these species in the mineral concentrates, copper makers mix them to obtain the desired copper grade for refining. Consequently, different Fe/Cu mass ratios are obtained, and such ratios have a strong impact on the processing of copper. Figure 1 depicts the traditional pyrometallurgical refining of copper.
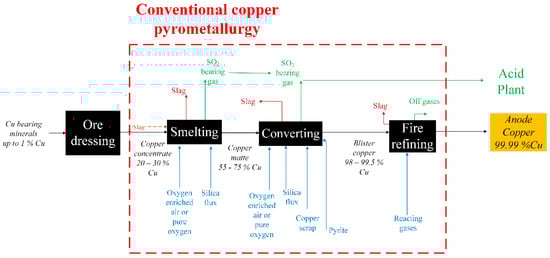
Figure 1.
Schematic flowsheet of traditional copper pyrometallurgical processing.
2.2. Technologies in Use
Different technologies [6,7] are employed to refine copper pyrometallurgically. Kapusta [16,17] traced the evolution of copper smelting technology from 2003 to 2019. From these reports, flash smelting is the dominating technology for copper smelting, whereas Pierce Smith converting technology dominates such processes. In spite of this, bath smelting technologies are becoming popular alternatives for copper pyrometallurgy; however, the environmental impacts due to the combination of flash smelting and Pierce Smith converting is the lowest among all technologies available [5,17]. According to Kapusta data, Outokumpu flash smelting is the most common vessel used in copper refining. Fire refining does not convey a high footprint in comparison to the smelting and converting stages.
Because of these facts, we decided to assess the energy usage of a pyrometallurgical copper operation comprising flash smelting (Outukumpu)—converting (Pierce Smith) and fire refining.
3. Exergy Analysis
Exergy analysis has been applied to metal production for at least 40 years [18,19,20,21]. Conventional energy and mass balances are typically used to assess chemical processes; however, these balances are not the best way to represent the usage of energy, since these balances represent quantities with different dimensions (mass and energy) [21]. On the contrary, exergy balances relate to the loss of work potential of a system undergoing an irreversible process [22]. The exergy balance allows for the identification of those points along the processing path where energy can be saved or recovered. In the case of high-temperature processing, exergy becomes an important variable to determine the overall process efficiency. Furthermore, energy and mass balances only indicate the amount of material or energy resources needed to carry out a specific process [9], whereas exergy works on a single unit basis (energy) and measures the thermodynamic quality of a component or that of a material stream [9].
Ignatenko et al. proposed the use of exergy analysis as an efficient tool to evaluate the actual performance of any process in terms of resource usage [11]. They suggest complementing the information generated from traditional mass and energy balances with that obtained through the exergy analysis.
The exergy of a system comprises four contributions: physical exergy, chemical exergy, kinetic exergy, and potential exergy. In copper pyrometallurgy, the last two components can be neglected, and the analysis focuses on the first two contributions.
Physical exergy is defined in Equation (5) [18]:
where is the standard enthalpy of reaction at a temperature T; is the standard enthalpy of reaction at 298 K; is the standard entropy of reaction at a temperature T; is the standard entropy of reaction at 298 K; and T0 is the ambient temperature (298 K).
To determine the enthalpy and entropy values needed to calculate the physical exergy, it is necessary to use the heat capacity (at constant pressure) of the chemical species involved in copper pyrometallurgy. The heat capacity is typically expressed in the form of a polynomial with temperature (K) as the determinant [23]. This is shown in Equation (6):
Table A1 in this paper’s Appendix A shows the heat capacities of the species considered in our calculations, and the standard heat of reaction of the chemical species involved in copper pyrometallurgy.
Chemical exergy of a stream is defined in Equation (7) [18]:
where is defined by Klassen et al. [18] as “the exergy difference between the stream of individual elements and the actual stream at reference conditions”; ni is the i-th chemical element taking part in copper refining reactions; and is the chemical exergy of each element within the system.
Additionally, the exergy associated with the oxygen enrichment of air was calculated with Equation (8) [24]:
3.1. Methodology
To conduct the exergy analysis associated with the copper pyrometallurgical route of flash smelting—Peirce Smith converting—fire refining, we fixed the production of a ton of copper concentrate; the mass flows were then computed backward from the anode copper to the mineral concentrate. We used different concentrations of feedstock, resulting in distinct Fe/Cu mass ratios for calculations, as well as the relative amounts of mineral species fed into the smelter.
In conducting our computations, we assumed that the material streams leaving the corresponding processing units leave at the process temperature. We did not consider the heat transfer that occurs when a material leaves the processing unit. In this way, we assume that chemical equilibrium was attained rapidly within the furnaces and that the energy carried away by the off streams is transferred completely to the environment.
Additionally, as we only focused on the production path of copper, we did not include in our analysis exergy contributions corresponding to auxiliary/complementary equipment, such as the oxygen plant, the steam power generation, etc.
With the information that we gathered, a mass and energy balance was calculated, and the results were compared to those of the exergy analysis. In the end, Sankey diagrams for the energy and exergy flows were created. From these charts, it is clear that the exergy analysis provides a more accurate quantification of energy usage in copper pyrometallurgy.
To calculate the energy and exergy flows within the selected copper pyrometallurgical route, reliable thermodynamic data in the form of enthalpies of reaction [23], heat capacities (evaluated in the temperature interval from 298 to 1523 K) [23], and chemical exergies [20,25] were used. The data used in this paper is shown in Table A1, Table A2, Table A3 and Table A4 in the Appendix A at the end of this paper.
3.2. Study Cases
To conduct this study, we created two study cases. The first one considers a mineral blend consisting of chalcopyrite (CuFeS2) and pyrite (FeS2) as the main sources of copper iron and sulfur. Along with these two mineral species, other minor species are considered in the feedstock. Five different proportions of chalcopyrite and pyrite were considered to obtain Fe/Cu mass ratios of 1.55, 1.42, 1.37, 1.24, and 1.12. The higher the mass ratio, the lower the copper content in the feedstock. Such mass ratios are observed in actual operations. The mineral blends of this first case are labeled B1x, where x represents each of the mass ratios defined above.
The second case considers a mineral blend consisting of chalcopyrite, pyrite, and chalcocite (Cu2S). Chalcocite is a copper sulfide that does not contain iron. By incorporating this mineral species, the relative concentration of iron would decrease, while increasing the relative amount of copper in the feedstock. As with the first case, distinct mass ratios Fe/Cu were used by mixing these three mineral species. The Fe/Cu mass ratios for the second study case were 1.52, 1.33, 1.29, 1.18, and 1.11. As with the previous case, larger Fe/Cu mass ratios indicate feedstocks leaner in copper. The mineral blends for this second case were labeled B2x, where x has the same meaning as in the first case.
Table 1 shows the starting mineral mixtures used in our calculations.

Table 1.
Mineral feedstock used in this paper to carry out the exergy analysis.
4. Results and Discussion
The purpose of this paper is to evaluate the actual usage of energy throughout the pyrometallurgical copper route and from these findings propose improvements to the copper-making operation. As copper making consists of three main stages working in series, energy and mass are lost as materials transfer between the different processing units.
The results obtained from our computations are presented in Section 4.1, Section 4.2 and Section 4.3 for flash smelting, converting, and fire refining, respectively. The data shown in such sections were computed using the mineral blend labeled as B11 (Table 1). This mix consists of CuFeS2 and FeS2 as the main mineral species used in copper pyrometallurgy; the mix has a Fe/Cu ratio of 1.55.
All ten mineral mixes (B11 to B25) were considered in our research, but we limit the energy, mass and exergy balances in Section 4.1, Section 4.2 and Section 4.3 to mineral mix B11. Results from the other blends are discussed in Section 4.4, Section 4.5, Section 4.6 and Section 4.7.
4.1. Flash Smelting Analysis
To carry out our calculations, we chose an Outokumpu flash smelter, as it is the leading technology in use to smelt copper concentrates [6,17]. The main objective of smelting is to melt the copper concentrate to eliminate some impurities, and to obtain a molten sulfide mixture called matte with higher copper content.
The advent of bath smelting technologies merits a similar study like the one we are presenting. Additionally, in this paper, we did not consider at all integrated processes such as Noranda or Mitsubishi. It is expected that performing a similar analysis to the one we are conducting would give different results, as the operation parameters of the distinct smelting technologies vary among them. In addition to that, the mineral feedstock changes from process to process, as well as the type and amount of slag produced. These variations would alter the results presented in the present study.
In an independent calculation, we found that at the smelter inlet, the entropy associated with the copper concentrate is 0.95 MJ/K. In contrast, at the outlet of the process, the entropy of the resulting matte increases to 1.42 MJ/K. This indicates that the process proceeds in the right path as the copper concentration increases in the matte. In this sense, the exergy associated with smelting indicates that there is an enormous amount of high-quality energy ready to be recovered.
The energy balance in Table 2 reveals that the energy flow in the flash smelter (FS) is 4647 MJ, whereas the exergy balance indicates that at the smelter inlet the total exergy is 9350 MJ and at the smelter outlet, such figure decreased to 6953 MJ; this indicates that 2395 MJ of exergy was lost as the smelting operation occurs. Such exergy lost represents 25.6% of exergy destroyed. The difference in the results between the energy and exergy balances indicates that the energy available in the system is much higher than expected.
Table 2.
Summary of mass, energy, and exergy balances in the Outokumpu flash smelter.
According to the figures in Table 2, the exergy content in the copper matte is 2623 MJ. In contrast, the exergy lost in the off gases and the discharged slag is 4300 MJ. The energy balance claims that the amount of energy lost in these by-products (gases and slags) is 2395 MJ, which is nearly one-half of the exergy figure. This means that the amount of energy wasted is higher than originally expected.
The chemical reactions in the smelter are exothermic (oxidation) and contribute to a total of 2893 MJ per ton of copper concentrate. This energy is used to heat the matte and keep it and the slag in the liquid state. Additional heat can be added to the smelter by burning external fuels; in doing this, the energy efficiency of the smelter would decrease.
In terms of exergy, the main contribution to this quantity is the chemical exergy content; its high values are due to the stored energy (chemical) in the sulfides as they are burnt, and the energy is released in the form of heat, so, therefore, it is an intrinsic property of the system that cannot be easily modified.
We determined the energy and exergy efficiencies based on the main copper bearing products at the smelter outlet. The energy efficiency was computed by dividing the matte energy content over the total energy at the smelter outlet. This yields a 6.9% of energy efficiency. Exergy efficiency was computed in a similar way. The total exergy content of the matte was divided by the total exergy content at the smelter outlet; this resulted in 38.14% of exergy efficiency.
If other input and output streams are considered, the efficiency figures would change. Additionally, we considered a 63 copper matte (63% copper); if we based our calculations on richer mattes, the efficiency of the smelter would increase.
Similar calculations were made to evaluate the efficiencies in the converter and the fire refining furnace.
To improve the exergy efficiency and consequently that of the energy, it is proposed to enhance the physical component of exergy. By enhancing the physical exergy component, we mean to have better control over the preheating of the smelter. To do so, it is necessary to recover as much heat as possible to decrease the thermal gradients within this operation. Also, the use of oxygen-enriched air would be helpful in reducing the physical exergy component.
4.2. Converting Operation
The molten matte obtained in the smelter is transferred to the converter. At this stage, selective oxidation of iron and sulfur results in a copper-rich material known as blister. Oxygen-enriched air is injected (submerged, laterally) into the melt to obtain the blister. The starting mattes used in this process typically start at 63 wt% copper. Nearly one half of the inlets (matte, gases, and fluxes) leave the process as wastes in the form of off gases and slags. The remainder of the material is the blister with nearly 99% copper, whose energy content is 109.8 MJ.
The energy balance for converting is shown in Table 3 along with its corresponding mass and exergy balances. The energy balance indicates that there are significant energy losses; the energy efficiency for this stage is 5.1%.
Table 3.
Summary of mass, energy and exergy balances in the Peirce Smith converter.
In copper converting, off gases account for 51% of the energy losses. This, perhaps, is inherent to the converter design itself. When the converter is charged and during metal and slag pouring, the converter tilts, and its mouth remains open, so gaseous emissions leave the system, making it difficult to capture all of them with auxiliary systems. The presence of such emissions also adds other disadvantages:
- ◦
- Toxic SO2 is liberated, and this constitutes a serious health and environmental risk;
- ◦
- As SO2 mixes with the surrounding air, it dilutes, making its capture more difficult. This reduces the efficiency of acid plant production;
- ◦
- As major gas volume is produced, the entropy of the off gases increases, so when the energy content in such gases is partially recovered, their energy quality decreases, making it harder to recover the energy stored in them.
From the exergy point of view, it can be seen in Table 3 that the off gases carry away 1800 MJ, whereas the slag produced in this stage only wastes 318 MJ. These figures are larger than those provided by conventional energy balances.
The exergy efficiency in the converting operation is even lower than that of the smelting stage. The exergy efficiency in the conversion stage is 17.4%. Similarly to smelting, the chemical exergy component carries away most of the exergy losses. Exergy destruction in this process is in the order of 2190 MJ, which represents 46% of the exergy inlet. To process one ton of matte (grade 63% Cu) in the converter, the energy balance reports heat losses of 2063 MJ. In comparison, the exergy losses are 2190 MJ. These figures are consistent with those calculated for the smelting operation. Table 3 presents these figures.
If the energy from the hot flows could be recovered, the exergy efficiency could increase to 27%, at least theoretically.
To improve the exergy efficiency of the converting operation, it is necessary to recover heat from the hot flows, such as the off gases and the molten slags. In that regard, the development of continuous processes to convert mattes has proven successful [8,26]. These novel operations reduce process costs (capital, operational, and environmental) as well as recovering the energy contained in process by-products.
4.3. Fire Refining
Table 4 presents the energy, mass, and exergy balances for the fire-refining operation. The energy balance for this operation shows that the refined (anode) copper carries 62.43 MJ per ton of metal. This last processing stage has an energy efficiency of 37.9%. This process produces small amounts of process gases and slag. These two by-products together represent 9.5% of the energy at the outlet. The breakdown is as follows: the process gases take 8.2% of the energy (8.39 MJ), while the slag takes 1.3% of the energy, which is equivalent to 1.30 MJ of the energy.
Table 4.
Summary of mass, energy, and exergy balances in the fire refining furnace.
Of the three processing stages, fire refining is the least energy-intensive and the most efficient operation. The energy involved in this operation represents nearly one third of the exergy associated with this process.
The final product of fire refining is anode copper; it carries 334 MJ of total exergy per ton of metal. As fire refining occurs, 166.6 MJ of total exergy is destroyed. The exergy efficiency associated with this stage is 92%, which is significantly larger than those obtained in smelting and converting.
As with the previous stages, there are significant differences between the energy and exergy balances. However, there seems to be a constant ratio between these two balances.
From the data shown in the previous sections, some of the energy lost can be recovered to enhance the efficiency of the pyrometallurgical operations related to copper making.
Figure 2 shows Sankey diagrams for energy distribution in each of the reactors used in copper making. These diagrams are compared with corresponding diagrams for the exergy flow in each of the process units considered in this work. The distinct diagrams in Figure 2 indicate that exergy flows are larger than those related to energy distribution.
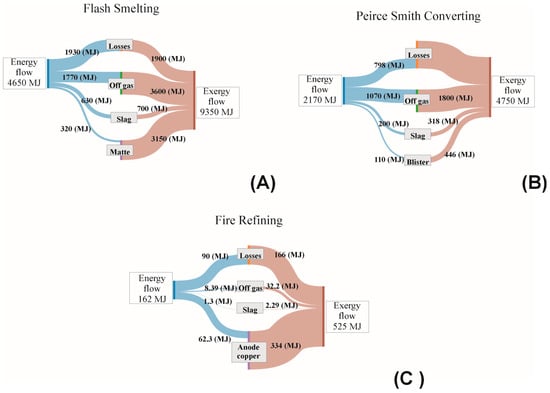
Figure 2.
Sankey diagrams comparing the energy and exergy flows in the pyrometallurgical processing of copper. (A) Outokumpu Flash Smelter. (B) Peirce Smith Converter. (C) Fire refining.
The differences between the energy and exergy flows in Figure 2 illustrate how exergy is more useful in identifying points along the process route where improvements can be made to enhance the efficiency of the processes under study. While the energy balance is subject to energy conservation, it is not clear under which points improvements can be made this is because energy must be conserved.
On the contrary, exergy is a non-conservative quantity, and the computations indicate that a fraction of the exergy flows is destroyed in each of the processing units. Exergy destruction indicates that improvements to the copper process can be made to make better usage of energy while decreasing the footprint associated with copper making. By increasing the exergy efficiency, the system would decrease its footprint as it means that all of the exergy is totally converted without loss.
It is also clear from the diagrams in Figure 2 that the off gases in the smelting and converting operations take away considerable amounts of energy that can be recovered. The slags produced throughout the entire process flow are also a point susceptible to energy recovery. Efforts to find out ways to recover as much energy as possible from metallurgical slags have been discussed [13].
In addition to the previous statements, the use of Sankey diagrams opens the door to look at the manipulation of some process variables to improve the overall energy efficiency of copper pyrometallurgy. Among the process variables that can enhance the copper operation are the following:
- ◦
- Oxygen enrichment in the blast;
- ◦
- Air preheating;
- ◦
- Matte grade;
- ◦
- Mineralogy (feedstock).
These process variables are discussed in the upcoming sections of this manuscript.
4.4. Effect of Oxygen Enrichment in the Blast
Queneau [27,28] pointed out the benefits of supplying additional oxygen in pyrometallurgical operations. When operating with high oxygen concentrations, the volume of the off gases produced decreases significantly, and the SO2 produced is more concentrated, making it easier to fix to obtain sulfuric acid. As the volume of off gases decreases with oxygen enrichment, the energy and exergy flows associated with the gas streams also decrease, representing a positive impact on the copper-making operation.
It has been shown that the exergy contribution due to enriching the air with oxygen increases up to 3200 MJ when using 85 V% of oxygen in the blast when treating mattes with 60 wt% copper; such exergy figure drops to nearly 2200 MJ when refining copper mattes with 80 wt% Cu and 85 V% oxygen in the blast [24].
Such exergy additions are not as significant as those of the combined smelting and converting operations. Furthermore, dealing with oxygen-rich blasts results in a decrease in the overall net exergy in the pyrometallurgy of copper.
It is also observed that in smelting, as the blast is richer in oxygen, it results in mattes leaner in iron sulfide. This fact allows the increased efficiency of the converting stage as melts higher in copper are processed. For example, assuming a blast with 40 V% oxygen enrichment results in increasing the exergy of the matte by 12,000 MJ, whereas using pure oxygen results in an exergy increase of 9000 MJ. The latter would be beneficial during conversion since the removal of iron and sulfur would proceed more rapidly.
Additionally, by increasing the relative oxygen content, the concentration of nitrogen in the blast decreases, resulting in lowering the volume of off gases produced, with higher SO2 content.
These two effects, Cu-richer mattes and SO2-concentrated process gases, improve the efficiency of copper pyrometallurgy quite substantially.
Figure 3 indicates the concentration of the SO2 gas produced per ton of metal as the oxygen concentration in the blast increases.
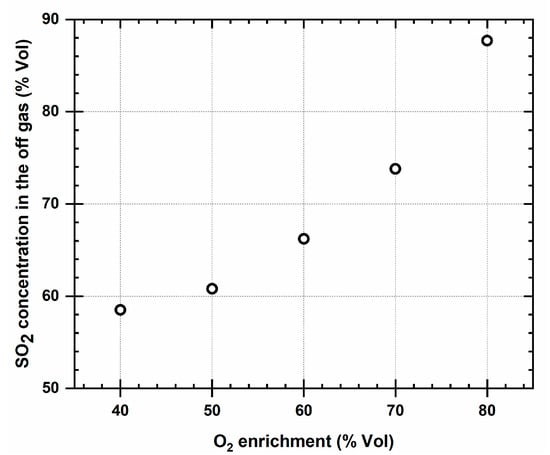
Figure 3.
Relationship between the concentration of the SO2 produced with the oxygen enrichment of the smelter blast.
4.5. Effect of Gas Preheating
Outokumpu flash smelters typically preheat the gas used to melt the copper concentrates. Preheating is conducted by burning gas in the air by a series of burners placed in the furnace shaft. Preheating ensures that there is sufficient heat to fully melt the concentrate particles and reduces the need for oxygen enrichment in the blast. This practice produces CO2 gas, which is hazardous and is a reducing agent. The presence of CO2 hinders the oxidation of iron sulfide. This increases the concentration of FeS in the matte which also has a negative effect on the amount of exergy generated in the smelting operation.
The additional heat from preheating tends to concentrate in the upper end of the furnace, allowing the quick ignition of the concentrate.
More exergy due to the generation of additional gases and to the additional heat required to burn the gas adds to the exergy generation in the smelter. Since smelting is autogenous, the heat from burning the sulfides in the mineral feedstock could be used to preheat the blast. Preheating without burning gas has a minimum effect on the exergy produced in the smelter; however this practice would limit the generation of CO2 as well as eliminating the cost of such additional fuel.
Figure 4 shows that there are no significant additions to exergy generation in the smelter via changing the blast preheating; it also shows that there is a correlation between the amount of FeS produced (in the matte) and the preheating of the blast in the smelting stage.
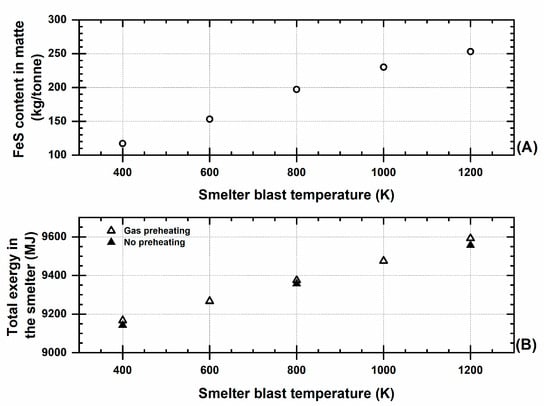
Figure 4.
Effect of the smelter’s preheated blast temperature on (A) the amount of FeS content in the matte and (B) the total exergy in the smelting unit.
A problem associated with increasing the concentration of FeS in the matte is that the resulting matte has lower copper contents. Mattes with lower grade have a negative impact on the converting stage as more iron needs to be removed from the matte to produce blister.
To achieve proper iron removal more energy is required. In this regard, it is convenient to reduce the iron content in the matte as much as possible, despite producing more SO2 gas. This last statement seems contradictory, but the whole copper refining operation strongly depends on the smelting stage; henceforth, it seems convenient to produce more emissions in the smelting operation while the overall process has better efficiency.
Energy recovery from the blast preheating would be suitable for decreasing the amount of oxygen needed to remove sulfur as SO2 gas per ton of concentrate; however, more FeS will be produced accordingly. This is shown in Figure 5.
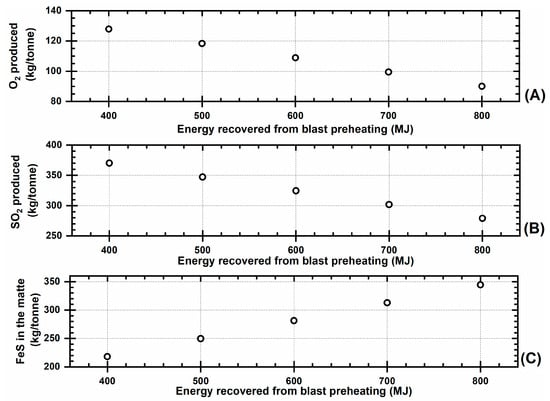
Figure 5.
Effect of the energy recovery from blast preheating on: (A) oxygen emissions’ production, (B) SO2 emissions’ production, and (C) FeS produced in the matte.
Sankey’s exergy diagram clearly shows that the process gases take away most of the heat that can be reused [29]. If this stream could be returned to preheat the smelter charge, the exergy (total) of the smelter would decrease significantly, and its energy efficiency would undoubtedly improve.
4.6. Effect of Matte Grade
For a given copper content in the concentrate, it is customary that copper makers produce mattes with copper concentrations between 60 and 65 wt%. If the copper concentration in the matte were increased, the exergy associated with the smelter would be substantially reduced; additionally, the oxygen requirement to burn the sulfur and oxidize the iron in the smelter would decrease. Henceforth, producing mattes with higher copper grades improves the performance of the converting stage. Figure 6 demonstrates this effect.
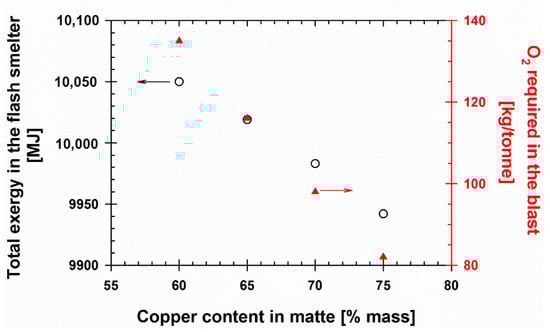
Figure 6.
Effect of copper content in the matte on total exergy and oxygen requirements per ton of concentrate.
If it makes economic sense, these authors suggest that copper makers should produce mattes with copper contents of at least 75 wt%. This copper concentration not only minimizes the exergy associated with smelting but also allows for handling less volume of off gases throughout the entire copper-making operation.
4.7. Effect of Mineral Composition in the Process Feedstock
To determine the effect of mineralogy on the exergy associated with copper pyro-metallurgy, ten different mineral feedstocks (Table 1, concentrate blends B11 to B25) were used to compute the exergy flows in the copper-making process. Blend 1 had chalcopyrite and pyrite as the main mineral species. The relative amounts of these mineral species were varied to obtain variations in feedstocks that were similar to those found in the industry. As a result of these variations, Fe/Cu mass ratios of 1.55, 1.42, 1.37, 1.24, and 1.12 were obtained. These ratios correspond to initial copper contents in the feedstock of 20.7, 21.8, 22.5, 24.6, and 26.3 wt% copper, respectively.
The second mineral blend used in this study contained primarily chalcopyrite, chalcocite, and pyrite. Likewise, these major mineral species were varied to obtain different Fe/Cu mass ratios (1.52, 1.33, 1.29, 1.18, and 1.11) that correspond to the initial copper concentrations of 20.9, 22.7, 23.2, 24.6, and 25.6 wt%. The addition of chalcocite dilutes the iron in the feedstock, even though these second mineral blends have slightly less copper, and additionally there is less iron added to the whole copper refining operation.
These initial copper contents impacted the total exergy (chemical and physical) flows associated with each of the copper making processing steps. The different Fe/Cu mass ratios produced different exergy flows. The total exergy flow in each of the process stages and in the whole refining operation are shown in Figure 7. It is worth mentioning that the exergy data in Figure 7 comprises both the chemical and physical components of exergy.
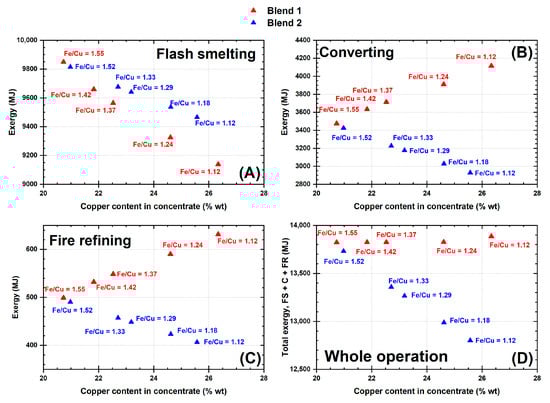
Figure 7.
Total exergy flows as a function of the copper content in the starting mineral feedstock in (A) flash smelter (Outokumpu), (B) converter (Peirce Smith), (C) fire refining, and (D) exergy flow from the whole refining operation; results from adding the exergy flow of the flash smelter (FS), that of the converter (C) and that of fire refining (FR).
From the data in Figure 7, lowering the Fe/Cu mass ratio (increasing copper content) in the feedstock decreases the total exergy flow in the smelting stage. On the contrary, in converting and in fire refining, mineral blend 1 tends to increase the total exergy. This effect is attributed to the higher amount of iron in this blend; in the case of mineral blend 2, the effect is the opposite. Increasing the copper content relative to that of iron in the blend results in decreasing the exergy in these two operations. It is also noticeable that the major exergy contribution comes from the smelting operation which is the first processing stage.
In general terms, feedstocks with a low Fe/Cu mass ratio decrease the exergy of the whole copper refining path. This results from having higher initial copper concentrations while lowering the initial iron content added to the entire refining operation.
From this perspective, and to improve the exergy efficiency significantly, smelters should utilize concentrates that contain considerable amounts of chalcocite (Cu2S, Fe/Cu = 0), and/or bornite (Cu5FeS4, Fe/Cu = 0.18), and lower the portion of chalcopyrite (CuFeS2, Fe/Cu = 0.88). However, such a scenario is unlikely to happen. Copper ore deposits do not contain as much chalcocite and/or bornite as they contain chalcopyrite.
Despite this, our calculations indicate that even adding small amounts of chalcocite to the starting charge results in considerable decreases in the total exergy associated with copper making.
Thus far, our results indicate that increasing the copper content to the smelter decreases the exergy flow. This allows us to recommend adding copper scrap from copper anodes into the smelter. Adding this type of material would dilute the iron fed with the mineral concentrate; however adding this scrap may reduce the process temperature, and thus trials should be made to test the feasibility (technical and economical) of making these additions.
It is customary to add copper scrap into the converter to help control the temperature as the copper blow occurs; however, as shown, it would be a good idea to feed the smelter with some metallic copper to help decrease the exergy stream in that process and thus improve exergy-wise the entire copper processing.
Increasing the copper concentration in the concentrate also impacts positively on the amount of SO2 generated. The SO2 produced per ton of anode copper drops from 2.6 to 1.8 ton when the copper content in the feedstock increases from 21 wt% to 26 wt%.
The actions described above should contribute positively to attempts to meet the demand for energy, as copper is produced from leaner ore bodies to fulfill human needs.
Furthermore, this paper demonstrates that the use of exergy analysis facilitates the development of process flowsheets, thereby contributing to sustainable development [29].
To complement our study, life cycle analysis should be added to find out better ways to produce copper. Previous studies on copper making [30,31] utilizing life cycle analysis offer similar results to ours. For example, it was stated that energy consumption, and thus generation of greenhouse gases emissions associated with copper making, has decreased as a consequence of improvements to copper-smelting operations [30]. It is imperative to include in this type of analysis the effect of specific emissions like the ones associated with feedstock components, such as arsenic and antimony, among others [31].
4.8. General Discussion
Modern day mineral processing needs to satisfy more than simple economic criteria to be commercially successful. As ore bodies become leaner, other considerations such as environmental and energy consumption/recovery considerations, among others, should be accounted to provide prosperous metal production.
The complexity of mineralogy associated with leaner ores adds up to the processes feed streams, resulting in larger streams of wastes and increased energy consumption. As the mineral deposits used to extract copper become scantier, more gangue material needs to be treated, which has negative environmental impacts [32].
Such impacts can be clearly identified using exergy analysis. Furthermore, the use of this analytical tool might give insight into new technological developments or whether it is the case in upgrading current processes. Besides increasing the recycling and reutilization of goods, we still need to keep attempting to fulfill human needs. In this regard, it appears that the actual metal content in the ore body is the most crucial factor to consider when selecting environmentally favorable processing routes [4,32,33].
It has been shown that the use of exergy facilitates the identification of points along the whole processing path that are susceptible to improvements in the use of energy to decrease the generation of waste emissions that harm the environment; this tool also aids in the more efficient usage of energy resources. To offer better quantifications of processes’ performances, exergy analysis should be complemented with techniques associated with life cycle analysis.
These combined analyses can be applied not only to copper processing but to metal production in general.
From the results shown in the previous sections of this work, it is clear that the key points to improve the overall efficiency of the whole copper-making operation is in the handling of the off gases and the slag streams. These are wastes of the copper-making operation that convey significant amounts of energy that can be recovered. By implementing heat recovery devices, it is expected that heat could be returned to the process path, making more efficient use of the energy utilized to process the copper concentrates. This would warrantee more exergy destruction.
In the case of the gases, the physical exergy component is susceptible to being manipulated by increasing the oxygen concentration in the blast. It is known that the nitrogen in the air carries considerable amounts of energy that are not used to carry out refining reactions. In this sense, if the nitrogen is diluted with oxygen, less volumes of gas need to be handled, and a more concentrated SO2 gas can be easier to convert into sulfuric acid.
Regarding slags, these materials carry away substantial amounts of energy that can be recovered and transformed into electricity as suggested [13]. In this case, the chemistry of the slags is pretty much set. Changes in the oxidation potential within each of the process units would result in the increase in slag production and thus more energy requirements to refine the copper will be demanded, compromising the efficiency of the whole refining operation. Decreasing process efficiency results in higher exergy flows.
Another aspect to weigh in is the use of copper scrap in the smelter. Copper makers need to run some trials to see how effective this action could be in improving the energy usage throughout the whole copper refining path. Our calculations show that starting feedstocks with higher copper contents into the smelter significantly decreases the total exergy associated with the whole refining operation. However, a techno-economical evaluation of scrap addition to determine actual feed rates needs to be conducted before implementing it as a common practice
5. Concluding Remarks
The pyrometallurgical processing of copper, comprising Outokumpu flash smelting, Peirce Smith converting, and fire refining, was evaluated by quantifying the energy and exergy flows associated with this process. The use of exergy allows for better assessment of energy usage throughout the whole copper-making operation. Conventional energy balances are limited in evaluating the performance of refining processes such as that of copper.
Furthermore, the implementation of exergy analyses combined with life cycle analysis assessments would be useful in developing technologies with lower environmental impacts. Such appraisals should be implemented in future metal refining operations.
The exergy analysis conducted in this work shows that the smelting operation carries most of the exergy associated with copper making.
Unsurprisingly, to produce copper more efficiently and with lower detrimental environmental impacts, the following should be implemented in current operations:
- ◦
- Decrease the Fe/Cu mass ratio in the initial mineral feedstock. Via this, higher initial copper contents in the concentrates fed to the copper refining operations would result in the increased overall efficiency of the copper-making process.
- ◦
- Recycle copper anode scrap in the smelter rather than in the converting unit. It is customary to add scrap to the converter for temperature control purposes, not to improve energy usage efficiency. However, by adding copper scrap to the smelter, the initial iron content would dilute, enhancing the elimination of iron. It is necessary to run trials to evaluate how much scrap can be added to the smelter without making the smelting operation more expensive economically wise.
- ◦
- Use oxygen-enriched air with at least 40% Vol of oxygen enrichment. By virtue of this, the volume of off gases would be reduced while obtaining more concentrated SO2 gas to ease its capture and to decrease its footprint. Heat losses to the off gas stream should decrease as the relative amount of nitrogen would dilute.
- ◦
- Decrease the use of fuels to preheat the smelter blast as much as possible. It was shown that using additional gas to preheat the blast into the smelter is not really required. The blast can be heated directly from the heat released by the exothermic oxidation reactions taking place in the flash smelter. Additional fuel gas only adds to harmful gaseous emissions, increasing the footprint associated with copper making.
- ◦
- Recover as much energy as possible from the off gases streams. It was discussed that process gases carry significant amounts of heat. The recovery of such wasted energy would increase the energy efficiency of the copper-making operation while reducing the environmental impacts associated with copper refining.
Combining two or more of these issues should improve the copper refining process quite significantly.
Author Contributions
Conceptualization, D.M.R.-R. and G.P.; methodology, L.J.R.-R. and A.H.B.-A.; software, A.A.-G. and G.P.; validation, L.J.R.-R., A.H.B.-A. and J.G.C.-N.; formal analysis, D.M.R.-R., A.A.-G. and J.G.C.-N.; data curation, L.J.R.-R. and A.H.B.-A.; writing—original draft preparation, D.M.R.-R., A.A.-G. and G.P.; writing—review and editing, A.A.-G., J.G.C.-N. and G.P.; and project administration, G.P. All authors have read and agreed to the published version of the manuscript.
Funding
This research received no external funding.
Data Availability Statement
The data presented in this study is available upon request from the corresponding author.
Acknowledgments
Diana Ruiz thanks Conahcyt/SECIHTI for the scholarship to pursue her master’s degree. Luis Ramírez and Ayrton Bautista thank Conahcyt/SECIHTI for their scholarships to pursue their doctoral degrees.
Conflicts of Interest
The authors declare no conflicts of interest.
Appendix A
In this section, we present the data that we used to carry out our computations. The data source was cited in Section 3.1.
Table A1 presents the chemical species considered in our calculations, along with their coefficients to determine their respective heat capacity (Cp). The heat capacity is presented in the form of a polynomial in temperature:
Table A2 presents the main chemical reactions involving the species in Table A1 and their standard heat of reaction at 298 K.
Table A3 shows the standard chemical exergy and the standard Gibbs free energy of formation of the compounds used in our calculations.
Table A4 shows the chemical exergy of the chemical elements considered in our calculations.
Table A5 shows the chemical assays considered in the different materials used along the processing path.
Table A6 shows the mineral blends used in our calculations along with their respective chemical assays.
Table A1.
Data to estimate the heat capacity of the different species involved in the pyrometallurgy of copper.
Table A1.
Data to estimate the heat capacity of the different species involved in the pyrometallurgy of copper.
| Species | State | A | B | C | D | Temperature Interval |
|---|---|---|---|---|---|---|
| As2S3 | s | 179.100 | −220.754 | −18.089 | 252.715 | 298–450 |
| s | 105.646 | 36.447 | 0.000 | 0.000 | 450–585 | |
| l | 185.000 | 0.000 | 0.000 | 0.000 | 585–2000 | |
| As2O3 | s | 88.052 | 72.668 | −11.414 | 0.000 | 298–585 |
| l | 152.716 | 0.000 | 0.000 | 0.000 | 585–734 | |
| As2S2 | s | 82.956 | 37.363 | 0.000 | 0.000 | 298–580 |
| l | 146.440 | 0.000 | 0.000 | 0.000 | 580–700 | |
| As4O6 | s | 70.040 | 406.685 | 0.000 | 0.000 | 298–582 |
| l | 305.432 | 0.000 | 0.000 | 0.000 | 582–670 | |
| As2O6 | ||||||
| Sb2S3 | s | 101.844 | 60.529 | −0.002 | 0.011 | 298–823 |
| l | 167.360 | 0.000 | 0.000 | 0.000 | 823–1200 | |
| Sb4O6 | s | 0.000 | 0.000 | 0.000 | 0.000 | 298–300 |
| Sb2O3 | s | 118.307 | −8.354 | −12.771 | 35.442 | 298–879 |
| s | −749.204 | 1299.103 | 1146.336 | −513.903 | 879–928 | |
| l | 180.000 | 0.000 | 0.000 | 0.000 | 928–4000 | |
| Bi2S3 | s | 109.830 | 41.003 | 0.000 | 0.000 | 298–1050 |
| l | 209.200 | 0.000 | 0.000 | 0.000 | 1050–1200 | |
| ZnS | s | 48.676 | 5.760 | −4.119 | 0.003 | 298–1293 |
| s | 49.751 | 4.488 | −4.551 | −0.005 | 1293–2100 | |
| l | 67.000 | 0.000 | 0.000 | 0.000 | 2100–3000 | |
| ZnO | s | 47.584 | 3.903 | −7.504 | 1.279 | 298–2250 |
| l | 67.000 | 0.000 | 0.000 | 0.000 | 2250–4000 | |
| PbS | s | 60.962 | −18.814 | −6.261 | 13.382 | 298–1386.5 |
| l | 67.000 | 0.000 | 0.000 | 0.000 | 1386.5–3000 | |
| PbO | s | 45.179 | 12.887 | −2.887 | −0.013 | 298–1159 |
| l | 64.998 | 0.000 | 0.000 | 0.000 | 1159–2000 | |
| FeS2 | s | 72.387 | 8.850 | −11.428 | 0.001 | 298–1500 |
| FeS | s | −273.270 | 779.182 | 81.241 | 0.000 | 298–411 |
| s | 72.358 | 0.000 | 0.000 | 0.000 | 411–598 | |
| s | 94.584 | −83.667 | 1.410 | 47.944 | 598–1465 | |
| l | 62.551 | 0.000 | 0.000 | 0.000 | 1465–3000 | |
| FeO | s | 50.278 | 3.651 | −1.941 | 8.234 | 298–600 |
| s | 30.849 | 46.228 | 11.694 | −19.278 | 600–900 | |
| s | 90.408 | −38.021 | −83.811 | 15.358 | 900–1300 | |
| s | 153.698 | −82.062 | −374.814 | 21.975 | 1300–1650 | |
| l | 68.199 | 0.000 | 0.000 | 0.000 | 1650–5000 | |
| Fe3O4 | s | 475.215 | −873.665 | −120.520 | 800.730 | 298–850 |
| s | 49.827 | 72.534 | 855.536 | 0.000 | 850–1870 | |
| l | 213.384 | 0.000 | 0.000 | 0.000 | 1870–2000 | |
| FeO*SiO2 | s | 92.592 | 42.677 | −14.100 | 0.000 | 298–1413 |
| FeAsS | s | 62.886 | 40.585 | 1.423 | 0.000 | 298–500 |
| SiO2 | s | 58.082 | −0.033 | −14.259 | 28.221 | 298–847 |
| s | 58.873 | 10.071 | 0.117 | 0.000 | 847–1079 | |
| s | 72.735 | 1.331 | −41.288 | −0.013 | 1079–1996 | |
| l | 85.772 | 0.000 | 0.000 | 0.000 | 1996–3000 | |
| Cu | s | 21.988 | 15.303 | −0.736 | −14.437 | 100–400 |
| s | 26.013 | −0.110 | −1.725 | 2.800 | 400–800 | |
| s | 44.407 | −29.417 | −23.841 | 16.090 | 800–1357.77 | |
| l | 31.400 | 0.000 | 0.000 | 0.000 | 1357.77–6000 | |
| Cu2O | s | 64.550 | 17.581 | −6.393 | −0.001 | 298–1517 |
| l | 99.900 | 0.000 | 0.000 | 0.000 | 1517–4000 | |
| Cu2S | s | 53.438 | 76.459 | −0.117 | 2.456 | 298–376 |
| s | 112.140 | −30.973 | −0.046 | 0.147 | 376–717 | |
| s | 85.019 | 0.000 | 0.000 | 0.000 | 717–1402 | |
| l | 83.680 | 0.000 | 0.000 | 0.000 | 1402–2000 | |
| CuS | s | 43.671 | 20.136 | −2.102 | −0.005 | 298–1000 |
| CuSO4 | s | 38.676 | 252.380 | −1.588 | −148.155 | 298–500 |
| s | 100.848 | 102.751 | −33.107 | −47.162 | 500–800 | |
| s | 149.213 | 11.265 | −67.612 | 0.049 | 800–2000 | |
| CuFeS2 | s | 86.985 | 53.555 | −5.607 | 0.000 | 298–830 |
| s | −1441.974 | 1844.977 | 0.000 | 0.000 | 830–930 | |
| s | 172.464 | 0.000 | 0.000 | 0.000 | 930–1200 | |
| O2 | g | 22.060 | 20.887 | 1.621 | −8.207 | 298–700 |
| g | 29.793 | 7.910 | −6.194 | −2.204 | 700–1200 | |
| g | 34.859 | 1.312 | −14.140 | 0.163 | 1200–2500 | |
| SO2 | g | 29.134 | 37.222 | 0.058 | −2.885 | 50–500 |
| g | 54.779 | 3.350 | −24.745 | −0.241 | 500–5000 |
Table A2.
Chemical reactions considered to carry out our calculations and their standard heat of formation at 298 K.
Table A2.
Chemical reactions considered to carry out our calculations and their standard heat of formation at 298 K.
| Reaction | [kJ] |
|---|---|
| As2S3 + 9/2 O2 = As2O3 + 3 SO2 | −1452.533 |
| As2S3 + O2 = As2S2 + SO2 | −275.241 |
| As2S3 + 9/2 O2 = 1/2 As4O6 + 3 SO2 | −1396.587 |
| Sb2S3 + 9/2 O2 = 1/2 Sb4O6 + 3 SO2 | −1296.296 |
| Sb2S3 + 9/2 O2 = Sb2O3 + 3 SO2 | −1393.968 |
| Bi2S3 + 9/2 O2 = 1/2 Bi2O6 + 3 SO2 | −1151.284 |
| ZnS + 3/2 O2 = ZnO + SO2 | −444.312 |
| PbS + 3/2 O2 = PbO + SO2 | −416.574 |
| FeS2+ O2 = FeS + SO2 | −226.984 |
| FeO + 1/6 O2 = 1/3 Fe3O4 | −104.563 |
| FeO + SiO2 = FeO*SiO2 | 23.343 |
| FeAsS + 1/2 O2 = 1/2 As2S2 + FeO | −260.834 |
| FeS + 3/2 O2 = FeO + SO2 | −462.411 |
| FeAsS + 9/4 O2 = 1/4 As4O6 + FeO + SO2 | −850.567 |
| FeAsS + 9/4 O2 = 1/2 As2O3 + FeO + SO2 | −849.480 |
| Cu + 1/4 O2 = 1/2 Cu2O | −85.300 |
| CuFeS2 + 1/2 O2 = 1/2 Cu2S + FeS + 1/2 SO2 | −99.454 |
| CuS + 1/2 O2 = 1/2 Cu2S + 1/2 SO2 | −132.154 |
| 2 CuSO4 + 3 FeS2 = Cu2S + 3 FeS + 4 SO2 | 485.538 |
Table A3.
Chemical exergies and Gibbs free energy of formation of the chemical compounds considered in this work.
Table A3.
Chemical exergies and Gibbs free energy of formation of the chemical compounds considered in this work.
| Species | [kJ/mole] | [kJ/mole] |
|---|---|---|
| As2S3 | 2713.35 | −95.46 |
| As2O3 | 412.9 | −580.71 |
| As2S2 | 2063.18 | −138.58 |
| As4O6 | ||
| As2O6 | ||
| Sb2S3 | 2523.44 | −173.75 |
| Sb4O6 | ||
| Sb2O3 | 2523.44 | −173.75 |
| Bi2S3 | 2230.31 | −140.68 |
| ZnS | 744.08 | −202.22 |
| ZnO | 20.52 | −320.71 |
| PbS | 740.69 | −98.77 |
| PbO | 45.16 | −189.24 |
| FeS2 | 1440.37 | −150.72 |
| FeS | 883.56 | −100.48 |
| FeO | 127.34 | −251.63 |
| Fe3O4 | 127.38 | −1011.53 |
| FeO*SiO2 | 277.08 | −1338.94 |
| FeAsS | 1427.63 | −50.24 |
| SiO2 | 3.13 | −854.94 |
| Cu | 134.25 | 0 |
| Cu2O | 123.53 | −146.96 |
| Cu2S | 789.3 | −86.25 |
| CuS | 692.31 | −48.99 |
| CuSO4 | 86.89 | −662.35 |
| CuFeS2 | 1534.44 | −190.9 |
| O2 | 3.97 | 0 |
| SO2 | 310.41 | −300.61 |
Table A4.
Chemical exergy of the chemical elements considered in this work.
Table A4.
Chemical exergy of the chemical elements considered in this work.
| Element | [kJ/mole] |
|---|---|
| Sb | 438.02 |
| As | 493.83 |
| Bi | 274.92 |
| Cu | 134.25 |
| Fe | 376.99 |
| Pb | 232.41 |
| O2 | 3.97 |
| Si | 854.10 |
| S | 607.05 |
| Zn | 339.25 |
Table A5.
Chemical composition of the materials used along the different copper refining stages.
Table A5.
Chemical composition of the materials used along the different copper refining stages.
| Concentrate | |
|---|---|
| Species | Wt% |
| CuFeS2 | 30.50 |
| CuS | 8.50 |
| Cu2S | 17.00 |
| CuO | 0.01 |
| FeS2 | 33.80 |
| FeAsS | 0.01 |
| ZnS | 1.28 |
| PbS | 0.03 |
| SiO2 | 3.57 |
| Al2O3 | 4.29 |
| As2S3 | 0.84 |
| Sb2S3 | 0.15 |
| Bi2S3 | 0.02 |
| Matte | |
| Species | Wt% |
| Cu2S | 72.34 |
| FeS | 26.80 |
| FeAsS | 0.01 |
| ZnS | 0.74 |
| PbS | 0.02 |
| Sb2S3 | 0.05 |
| Bi2S3 | 0.04 |
| Blister | |
| Species | Wt% |
| Cu | 96.00 |
| CuO | 3.00 |
| PbO | 0.10 |
| Sb2S3 | 0.14 |
| Bi2S3 | 0.13 |
| ZnS | 0.21 |
| Others | 0.42 |
Table A6.
Mineral blends used in this work and their chemical assays.
Table A6.
Mineral blends used in this work and their chemical assays.
| Mineral blend 1 (CuFeS2 + FeS2) | |||||||||||||||
|---|---|---|---|---|---|---|---|---|---|---|---|---|---|---|---|
| Species | Weight (kg) | Fe/Cu | Cu (%) | Weight (kg) | Fe/Cu | Cu (%) | Weight (kg) | Fe/Cu | Cu (%) | Weight (kg) | Fe/Cu | Cu (%) | Weight (kg) | Fe/Cu | Cu (%) |
| CuFeS2 | 598.0 | 1.56 | 20.42 | 630.0 | 1.45 | 21.81 | 650.0 | 1.40 | 22.50 | 710.0 | 1.24 | 24.23 | 760.0 | 1.12 | 25.94 |
| CuO | 0.1 | 0.1 | 0.1 | 0.1 | 0.1 | ||||||||||
| FeS2 | 302.0 | 270.0 | 250.0 | 190.0 | 140.0 | ||||||||||
| FeAsS | 0.1 | 0.1 | 0.1 | 0.1 | 0.1 | ||||||||||
| ZnS | 10.8 | 10.8 | 10.8 | 10.8 | 10.8 | ||||||||||
| PbS | 0.3 | 0.3 | 0.3 | 0.3 | 0.3 | ||||||||||
| SiO2 | 35.7 | 35.7 | 35.7 | 35.7 | 35.7 | ||||||||||
| Al2O3 | 42.9 | 42.9 | 42.9 | 42.9 | 42.9 | ||||||||||
| As2S3 | 8.4 | 8.4 | 8.4 | 8.4 | 8.4 | ||||||||||
| Sb2S3 | 1.5 | 1.5 | 1.5 | 1.5 | 1.5 | ||||||||||
| Bi2S3 | 0.2 | 0.2 | 0.2 | 0.2 | 0.2 | ||||||||||
| Mineral blend 2 (CuFeS2 + Cu2S +FeS2) | |||||||||||||||
| Species | Weight (kg) | Fe/Cu | Cu (%) | Weight (kg) | Fe/Cu | Cu (%) | Weight (kg) | Fe/Cu | Cu (%) | Weight (kg) | Fe/Cu | Cu (%) | Weight (kg) | Fe/Cu | Cu (%) |
| CuFeS2 | 490.0 | 1.52 | 20.87 | 390.0 | 1.33 | 22.68 | 397.0 | 1.29 | 23.13 | 376.0 | 1.18 | 24.49 | 362.0 | 1.12 | 25.40 |
| Cu2S | 50.0 | 115.0 | 118.0 | 145.0 | 163.0 | ||||||||||
| CuO | 0.1 | 0.1 | 0.1 | 0.1 | 0.1 | ||||||||||
| FeS2 | 360.0 | 395.0 | 385.0 | 379.0 | 375.0 | ||||||||||
| FeAsS | 0.1 | 0.1 | 0.1 | 0.1 | 0.1 | ||||||||||
| ZnS | 10.8 | 10.8 | 10.8 | 10.8 | 10.8 | ||||||||||
| PbS | 0.3 | 0.3 | 0.3 | 0.3 | 0.3 | ||||||||||
| SiO2 | 35.7 | 35.7 | 35.7 | 35.7 | 35.7 | ||||||||||
| Al2O3 | 42.9 | 42.9 | 42.9 | 42.9 | 42.9 | ||||||||||
| As2S3 | 8.4 | 8.4 | 8.4 | 8.4 | 8.4 | ||||||||||
| Sb2S3 | 1.5 | 1.5 | 1.5 | 1.5 | 1.5 | ||||||||||
| Bi2S3 | 0.2 | 0.2 | 0.2 | 0.2 | 0.2 | ||||||||||
References
- Elshkaki, A.; Graedel, T.E.; Ciacci, L.; Reck, B.K. Copper Demand, Supply, and Associated Energy Use to 2050. Glob. Environ. Change 2016, 39, 305–315. [Google Scholar] [CrossRef]
- Hunt, C.; Romero, J.; Jara, J.; Lagos, G. Copper Demand Forecasts and Predictions of Future Scarcity. Resour. Policy 2021, 73, 102123. [Google Scholar] [CrossRef]
- He, R.; Small, M.J. Forecast of the U.S. Copper Demand: A Framework Based on Scenario Analysis and Stock Dynamics. Environ. Sci. Technol. 2022, 56, 2709–2717. [Google Scholar] [CrossRef]
- Norgate, T.; Jahanshahi, S. Low Grade Ores—Smelt, Leach or Concentrate? Miner. Eng. 2010, 23, 65–73. [Google Scholar] [CrossRef]
- Alexander, C.; Johto, H.; Lindgren, M.; Pesonen, L.; Roine, A. Comparison of Environmental Performance of Modern Copper Smelting Technologies. Clean. Environ. Syst. 2021, 3, 100052. [Google Scholar] [CrossRef]
- Davenport, W.G.; Biswas, A.K.; King, M.; Schlesinger, M. Extractive Metallurgy of Copper; Elsevier: Amsterdam, The Netherlands, 2002; ISBN 978-0-08-044029-3. [Google Scholar]
- Moskalyk, R.R.; Alfantazi, A.M. Review of Copper Pyrometallurgical Practice: Today and Tomorrow. Miner. Eng. 2003, 16, 893–919. [Google Scholar] [CrossRef]
- Coursol, P.; Mackey, P.J.; Kapusta, J.P.T.; Valencia, N.C. Energy Consumption in Copper Smelting: A New Asian Horse in the Race. JOM 2015, 67, 1066–1074. [Google Scholar] [CrossRef]
- Abadías Llamas, A.; Valero Delgado, A.; Valero Capilla, A.; Torres Cuadra, C.; Hultgren, M.; Peltomäki, M.; Roine, A.; Stelter, M.; Reuter, M.A. Simulation-Based Exergy, Thermo-Economic and Environmental Footprint Analysis of Primary Copper Production. Miner. Eng. 2019, 131, 51–65. [Google Scholar] [CrossRef]
- Drielsma, J.A.; Russell-Vaccari, A.J.; Drnek, T.; Brady, T.; Weihed, P.; Mistry, M.; Simbor, L.P. Mineral Resources in Life Cycle Impact Assessment—Defining the Path Forward. Int. J. Life Cycle Assess 2016, 21, 85–105. [Google Scholar] [CrossRef]
- Ignatenko, O.; Van Schaik, A.; Reuter, M.A. Exergy as a Tool for Evaluation of the Resource Efficiency of Recycling Systems. Miner. Eng. 2007, 20, 862–874. [Google Scholar] [CrossRef]
- Alvarado, S. Long Term Energy-Related Environmental Issues of Copper Production. Energy 2002, 27, 183–196. [Google Scholar] [CrossRef]
- Barati, M.; Esfahani, S.; Utigard, T.A. Energy Recovery from High Temperature Slags. Energy 2011, 36, 5440–5449. [Google Scholar] [CrossRef]
- Alvarado, S.; Iribarne, J. Minimum Energy Requirements in Industrial Processes: An Application of Exergy Analysis. Energy 1990, 15, 1023–1028. [Google Scholar] [CrossRef]
- Díaz-Damacillo, L.; Reyes, F.; Ingalls, A.; Méndez, C.; Plascencia, G. Mass Transfer Model for the De-Oxidation of Molten Copper. JOM 2017, 69, 980–986. [Google Scholar] [CrossRef]
- Kapusta, J.P.T. JOM World Nonferrous Smelters Survey, Part I: Copper. JOM 2004, 56, 21–27. [Google Scholar] [CrossRef]
- Kapusta, J.P.T.; Watt, L. The 2019 Copper Smelting Survey; Canadian Institute of Mining, Metallurgy and Petroleum: Westmount, QC, Canada, 2019. [Google Scholar]
- Klaasen, B.; Jones, P.-T.; Durinck, D.; Dewulf, J.; Wollants, P.; Blanpain, B. Exergy-Based Efficiency Analysis of Pyrometallurgical Processes. Metall. Mater. Trans. B 2010, 41, 1205–1219. [Google Scholar] [CrossRef]
- Morris, D.R.; Steward, F.R.; Szargut, J. Technological Assessment of Chemical Metallurgical Processes. Can. Metall. Q. 1994, 33, 289–295. [Google Scholar] [CrossRef]
- Morris, D.R.; Szargut, J. Standard Chemical Exergy of Some Elements and Compounds on the Planet Earth. Energy 1986, 11, 733–755. [Google Scholar] [CrossRef]
- Morris, D.R.; Steward, F.R. Exergy Analysis of a Chemical Metallurgical Process. Metall. Trans. B 1984, 15, 645–654. [Google Scholar] [CrossRef]
- Kotas, T.J. The Exergy Method of Thermal Plant Analysis, POD ed; Exergon Publ. Company: London, UK, 2012; ISBN 978-1-908341-89-1. [Google Scholar]
- Roine, A. HSC Chemistry 10; Outokumpu Research Oy: Helsinki, Finland, 2006. [Google Scholar]
- Pineda, J.A.; Plascencia, G. Exergy in Copper Converting and Its Relation to SO2 Emissions. J. Sustain. Metall. 2016, 2, 265–272. [Google Scholar] [CrossRef]
- Szargut, J. Chemical Exergies of the Elements. Appl. Energy 1989, 32, 269–286. [Google Scholar] [CrossRef]
- Newman, C.J.; Collins, D.N.; Weddick, A.J. Recent Operation and Environmental Control in the Kennecott Smelter; The Minerals, Metals and Materials Society: Warrendale, PA, USA, 1999. [Google Scholar]
- Queneau, P.E. Oxygen Technology and Conservation. Metall. Trans. B 1977, 8, 357–369. [Google Scholar] [CrossRef]
- Queneau, P.E. Coppermaking in the Eighties—Productivity in Metal Extraction from Sulfide Concentrates. JOM 1981, 33, 38–46. [Google Scholar] [CrossRef]
- Rankin, W.J. Sustainability—The Role of Mineral Processing and Extractive Metallurgy. Miner. Process. Extr. Metall. 2017, 126, 3–10. [Google Scholar] [CrossRef]
- Liu, L.; Xiang, D.; Cao, H.; Li, P. Life Cycle Energy Consumption and GHG Emissions of the Copper Production in China and the Influence of Main Factors on the above Performance. Processes 2022, 10, 2715. [Google Scholar] [CrossRef]
- Hong, J.; Chen, Y.; Liu, J.; Ma, X.; Qi, C.; Ye, L. Life Cycle Assessment of Copper Production: A Case Study in China. Int. J. Life Cycle Assess 2018, 23, 1814–1824. [Google Scholar] [CrossRef]
- Norgate, T.E.; Jahanshahi, S.; Rankin, W.J. Assessing the Environmental Impact of Metal Production Processes. J. Clean. Prod. 2007, 15, 838–848. [Google Scholar] [CrossRef]
- Norgate, T.; Haque, N. Energy and Greenhouse Gas Impacts of Mining and Mineral Processing Operations. J. Clean. Prod. 2010, 18, 266–274. [Google Scholar] [CrossRef]
Disclaimer/Publisher’s Note: The statements, opinions and data contained in all publications are solely those of the individual author(s) and contributor(s) and not of MDPI and/or the editor(s). MDPI and/or the editor(s) disclaim responsibility for any injury to people or property resulting from any ideas, methods, instructions or products referred to in the content. |
© 2025 by the authors. Licensee MDPI, Basel, Switzerland. This article is an open access article distributed under the terms and conditions of the Creative Commons Attribution (CC BY) license (https://creativecommons.org/licenses/by/4.0/).