Abstract
Predicting the thermo-physiological comfort of technical clothing requires an understanding of how microscopic textile structures influence macroscopic properties such as air, heat, and moisture permeability. This work represents the first step towards a multi-scale predictive tool capable of estimating key comfort-related properties from the geometrical features of woven fabrics. Focusing on air permeability, the effect of structural and design parameters was investigated while keeping the fibre material (cotton) constant. A computational framework that combines validated Computational Fluid Dynamics (CFD) simulations with a Fully Connected Neural Network (FCNN) was developed, enabling fast and accurate predictions before production. The CFD model accounts for both intra- and inter-yarn porosity, ensuring reliability across a wide range of fabric configurations. The FCNN, trained on simulation and literature data, achieved a mean absolute relative error of 2.01% and a maximum error of 7.72%, demonstrating excellent agreement with experimental results. The analysis highlights how weave type and yarn density govern airflow resistance, offering an efficient tool for the design and optimisation of breathable technical textiles.
1. Introduction
Textiles are generally divided into two broad categories: conventional textiles and technical textiles [1]. Conventional textiles are primarily intended for everyday use or aesthetic purposes, while technical textiles are intended for functional applications. Technical textiles are generally categorised into twelve groups based on their area of application: Mobiltech, Indutech, Medtech, Hometech, Clothtech, Agrotech, Buildtech, Sportech, Packtech, Geotech, Protech, and Oekotech [2].
One of the most closely monitored properties of technical textiles is permeability. Air permeability plays a decisive role in various areas. In manufacturing and composite applications, for instance, it provides important information about the quality of the impregnation and indicates how well a matrix, e.g., a resin, can penetrate a textile reinforcement [3]. In the medical and industrial field, textiles with controlled air permeability are used as filters or barriers in numerous contexts [4].
In the context of this work, which focuses on sports textiles, air permeability is particularly important for determining thermal comfort [5].
By understanding how air flows through a fabric, designers can optimise textile structures to achieve the desired level of breathability and comfort for the user. The standard reference for measuring the air permeability of textiles is ISO 9237:1995 [6]. According to this standard, the air flow through a fabric sample is measured under a certain pressure difference, usually 100 Pa, across the textile thickness. The sample is clamped in a special testing device, and the resulting flow rate is expressed in terms of air surface velocity (mm/s). This standardised method provides a consistent and reliable way of quantifying the breathability of textiles and allows comparisons to be made between different materials and structures.
Several experimental studies have investigated the factors that determine air permeability of technical textiles, highlighting the crucial role of fabric structure, yarn arrangement, and pore properties. Kulichenko [7] developed a theoretical and analytical framework for predicting air permeability based on the geometric configuration of textile pores. By modelling the flow through yarn spaces using both Poiseuille and Darcy’s laws, the study showed that yarn arrangement, density, and pore size have a significant impact on airflow, providing a fundamental understanding for the design of textiles with targeted permeability properties.
Building on this concept, Daukantiene and Vadeike [8] investigated elastic knitted fabrics and combined measurements according to ISO 9237 with assessments of fabric thickness under different pressures. Their work showed that not only the yarn geometry, but also the integration of elastane fibres and the construction of bound seams running through the multilayer system can significantly change the airflow through the textile. These results emphasise the importance of considering both material composition and structural characteristics when evaluating breathability, especially for garments that are intended to provide high thermal comfort. At the same time, it was proven that the overall porosity of the fabric alone is not sufficient to describe airflow, as it does not take into account the distribution, size, and arrangement of individual pores, which are crucial for permeability [9].
Finally, Zupin et al. [10] confirmed that while overall porosity and yarn arrangement are important, other key parameters also matter, such as the hydraulic diameter of the pores and the number of macropores, that can effectively predict air permeability for a range of cotton fabrics. The results show that the effects of material construction and composition on permeability can be consolidated into a limited set of structural descriptors, providing a strong foundation for computational modelling. However, identifying these descriptors alone is not sufficient on its own: their interactions are often non-linear, depend on the multi-scale geometry of the fabric, and cannot always be captured by simplified analytical expressions or regression-based models. Consequently, more advanced methods, such as Computational Fluid Dynamics (CFD), are required to explicitly resolve airflow within complex textile architectures and quantify how structural parameters influence permeability under varying conditions.
By focusing on the most relevant geometric features, computational models can reproduce experimental trends and enable systematic exploration of textile designs without extensive physical testing. Although experimental studies provide valuable empirical evidence and have successfully identified the key structural parameters controlling permeability, they are inherently limited in scope and applicability. Their results do not always generalise to more complex or untested configurations, and empirical models derived from experiments frequently fail to capture non-linear parameter interactions. Moreover, fabric samples must be physically manufactured before testing, making experimental evaluation a post-production tool that restricts a priori optimisation. In addition to demonstrating the same correlation between pore size and air permeability, some studies have shifted the focus to the possibility of predicting air permeability from design parameters available before the fabric production, as in the work of Ogulata and Mezarcioz [11]. That theoretical model is based on the Darcy formula that takes into account both the flow through the pores between the yarns and the spaces between the fibres within the yarn structure. Similar models [12,13] have been developed to study the heat transfer process in porous textiles, estimating the permeability with Darcy’s empirical formula. As also described by Syerko et al. [14], the pores between the yarns were shown to dominate the overall air permeability. Their model exhibited a strong correlation with experimental results, supporting its applicability for predicting the permeability of different woven fabrics prior to manufacturing. In parallel, new analytical models [15] demonstrated the ability to predict the distribution of the fibre volume fraction as a function of yarn diameter, providing further insights into the structural parameters governing permeability.
Building on these analytical approaches, recent research has increasingly turned to data-driven methods, in particular artificial neural networks (ANNs), to overcome the limitations of both experimental testing and purely theoretical modelling. The relationships between fabric structural parameters, pore geometry, and air permeability are highly non-linear, and conventional regression models often fail to capture their complexity. In contrast, ANNs have shown strong predictive capabilities even with relatively simple input variables. For example, Cay et al. [16] showed that a generalised neural regression network can predict air permeability from basic structural descriptors such as warp density, weft density, and mass per unit area, with significantly lower errors than multiple linear regression and even extending prediction to process-related outcomes such as vacuum drying efficiency. Similarly, Matusiak [17] confirmed that neural networks outperform classical statistical approaches when applied to cotton fabrics where permeability depends on multiple interacting factors.
More recently, ANNs have been successfully applied to knitted and nonwoven fabrics. Haroglu et al. [18] showed that neural networks provide much higher accuracy than fuzzy logic or regression models in predicting the air permeability of pile loop knitted fabrics, while Gultekin et al. [19] integrated image-derived texture features into ANN models to predict porosity and permeability in hydroentangled nonwovens, achieving high agreement with experimental data. Together, these studies highlight the potential of neural networks to bridge the gap between theory and experiment by providing accurate predictions of air permeability in different textile categories prior to production, supporting the optimisation of fabric design before manufacturing.
In this paper, the authors present a flexible framework for predicting the air permeability of woven textiles. Experimental data from the literature [10] are first used to validate a CFD setup capable of estimating the air permeability of self-generated fabric geometries. The CFD model is then used as a tool to create an extended dataset, which is used to train a neural network. The resulting data-driven model enables rapid prediction of textile properties based on structural parameters, streamlining the prototyping and design phase and reducing the need for extensive experimental testing. The flexibility and adaptability of the framework are further enhanced by the use of open source software, which enables customisation, transparency, and reproducibility of simulations and analyses.
A workflow of the project is shown in Figure 1 for clarity.
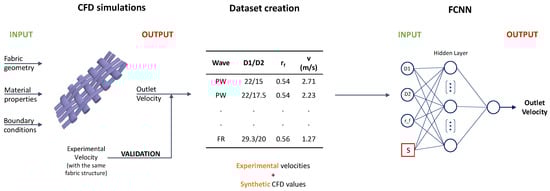
Figure 1.
Workflow of the proposed methodology. The CFD model is first validated against experimental data [10] and then used to generate a synthetic dataset by varying structural and design parameters of woven fabrics. Combined CFD and experimental data are subsequently used to train a Fully Connected Neural Network (FCNN), which enables fast and accurate prediction of air permeability prior to production.
2. Governing Equations and Theoretical Background
The governing equations for an incompressible Newtonian fluid are the continuity and Navier–Stokes equations [20]:
where v is the velocity vector, p is the pressure, is the fluid density, is the dynamic viscosity, and g is the gravitational acceleration.
However, for very low Reynolds numbers (i.e., in steady-state flows), the inertia terms in the Navier–Stokes equations can be neglected, which leads to the Stokes approximation:
In the context of dual-scale flow simulations, upscaling of the Stokes equations within the porous region (i.e., inside the yarn) leads to Darcy’s law, which governs the behaviour of flow through porous media:
where u is the Darcy velocity (at the surface), K is the intrinsic permeability of the porous material, and is the dynamic viscosity of the fluid.
One of the key choices of this study was deciding whether or not to model the internal porosity of the yarn. Based on literature [14], it was demonstrated that across-plane flow through fibrous reinforcements can often be approximated as a single-scale phenomenon when the scale separation between the intra-yarn permeability “K” and the inter-yarn pore size is large. In such cases, the effect of intra-yarn porosity on the overall macro-permeability becomes negligible compared to that of the mesoscopic inter-yarn structure.
Figure 2 illustrates a practical approach for assessing whether the flow within a fibrous structure exhibits a single- or multi-scale nature in the absence of detailed information about the local fibre volume fraction inside the yarns.
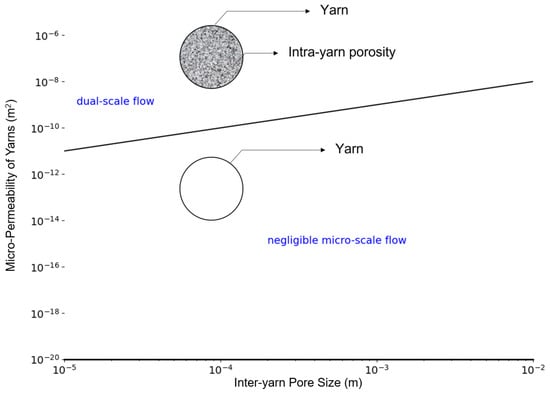
Figure 2.
Assessment of flow scale separation in fibrous materials using permeability–pore size comparison. Adapted from Syerko et al. [14].
Since this parameter is rarely available and its estimation can be non-immediate, a range of possible local permeabilities can instead be calculated using Gebart’s relations, which are empirical formulas used to estimate the permeability of bundles of cylindrical fibres arranged in regular packing configurations. For the commonly assumed square packing [21], the permeability is given by
where is the fibre radius, is the local fibre volume fraction, and is the maximum packing fraction, which equals for square packing. The geometric constant is for square packing. When is not known, it can be reasonably hypothesised within a range of values, typically lower-bounded by the known global fibre volume fraction of the reinforcement.
Since intra-yarn pore sizes are generally easier to determine experimentally, a straightforward visual strategy involves plotting a line that represents the calculated permeability range on a diagram such as the one shown in Figure 2. If this band does not intersect the dual-scale region defined by the intra-yarn pore size, scale separation is confirmed, and the flow can be considered to occur on a single scale.
Based on literature values [15,22,23], a range of local fibre volume fractions () between 0.4 and 0.6 was assumed. Assuming an average fibre radius of 8 (corresponding to the radius of the individual cotton fibres constituting the yarn) [24,25,26], and applying the Gebart relation for square packings, this corresponds to a micro-permeability range between and . Using the hydraulic diameters reported by [10] for the textile structures (PW, BW, TW(1/3), and FR(4/2)) analysed in this study, a range of intra-yarn pore sizes from 125.21 m (narrower structure) to 274.25 m (wider structure) was considered. If one compares these values with the value from Syerko et al. [14], they fall within the range where the micro-scale flux can be considered negligible.
To ensure that the assumption of neglecting the flow inside the yarn and considering only the passage of air between the yarns would not introduce a significant error, and considering that dual-scale flow simulations are computationally expensive, a limited number of dual-scale simulations were performed initially in the laminar regime. These simulations were then compared with single-scale laminar simulations in which the yarn was treated as impermeable.
While this two-scale approach provided a physically comprehensive representation, it was also much more computationally demanding and less adaptable to variations in the geometric configuration of the system. To increase flexibility and reduce computational costs, a simplified modelling strategy was used in which the yarn was treated as an impermeable solid to whose surface a no-slip boundary condition was applied, focusing exclusively on the flow region between the yarns.
This procedure allows the practitioner to decide, prior to CFD, whether modelling the yarn as impermeable introduces a negligible error or whether intra-yarn flow must be resolved explicitly. If values of yarn micro-permeability are known, and assuming pore size is known from design features (or knowable from simple visual inspection), it is sufficient to locate the X-Y point in Syerko’s diagram (Figure 2) corresponding to the two values and decide on the validity of the single- vs. dual- cale assumption based on its position relative to the line separating the planes. In the more common case where precise values of permeability are not known, it is possible to employ (as done in this work) Gebart’s relations based on fibre radius and yarn volume fraction, which are quantities more easily obtained. By means of example, and in order to provide a guide for following this modelling procedure informed by the mentioned heuristic, one can consider the case of wool. Taking a wool yarn made of fibers with radius of 15 m, and assuming a local fibre volume fraction slightly above 50% (consistent with compact staple yarns), Gebart’s relation would result in a yarn micro-permeability of , that together with a estimated characteristic pore size of approximately 50 m, would result in this fabric being in the upper portion of Syerko’s diagram, highlighting the need for dual-scale flow modelling. Specifically, following [14], the value of , where h is the inter-yarn pore size, would be equal to , above the cited critical threshold of . Subsequently, in the presented methodology, using OpenFOAM’s porousSimpleFoam solver, it would suffice to use the obtained micro-permeability value of K in the solver’s parameters to proceed with a simulation taking into account both inter-yarn and intra-yarn flow. As a minor implementation detail, and referring to the OpenFOAM version we used, this is fed as an input to the CFD model as a Darcyan permeability factor d, the inverse of micro-permeability, in the porosity properties of the case, as seen for example here: https://github.com/OpenFOAM/OpenFOAM-9/blob/master/tutorials/incompressible/porousSimpleFoam/angledDuctImplicit/constant/porosityProperties, accessed on 5 December 2025.
Then, regarding further geometric modelling choices, the variability of yarn deformation and packing was accounted for by a geometric tuning parameter (i.e., the reduction factor), which was defined to describe the degree of flattening of the yarn cross-section. The analysis was performed for all the examined textile structures, including plain Weave PW, Basket Weave BW, Twill TW (1/3), and Filling Rib FR (4/2). This allowed the model to account for the effects of varying weave density or yarn compression without the need to explicitly resolve inter-yarn porosity. An analysis of yarn trajectories obtained from TexGen confirms that decreasing the reduction factor, which means leading to stronger yarn flattening, produces longer warp and weft yarn paths. This behaviour is consistent with the lateral expansion associated with compression (Poisson-driven) and reflects an increase in effective crimp.
In this sense, the reduction factor implicitly encodes a Poisson-type geometric coupling between transverse compression of the yarn cross-section and axial elongation of the yarn path, rather than introducing an independent constitutive material parameter. The reduction factor, therefore, influences not only yarn cross-sectional dimensions but also macroscopic geometric features relevant to airflow pathways.
To provide a physically motivated lower bound for the reduction factor , it was assumed that the yarn cross-section changes from an initial circle of diameter d to an ellipse with thickness and width , where is an effective Poisson’s ratio.
The area of the initial circular cross-section is
while the compressed elliptical cross-section has semi-axes
and
yielding
By enforcing that the ratio between the compressed and initial cross-sectional areas does not fall below the yarn fibre volume fraction , i.e.,
we obtain a physically consistent lower bound for for given and . For instance, for and , this yields .
Finally, this reduction factor should therefore be interpreted as a geometry-based correction accounting for weave-dependent yarn deformation within the idealised TexGen representation, rather than as a constitutive mechanical parameter. In practice, can be selected within a physically meaningful range based on measurable geometric indicators such as yarn waviness (crimp), with a monotonic decrease in observed for increasing yarn crimp, i.e., more highly crimped yarn paths corresponding to lower values of . For the fabrics considered here, values of in the range 0.5–0.6 were found to be appropriate and provide a practical reference for selecting an initial value, which may then be refined using experimental thickness or permeability data when available.
3. Numerical Modelling and Geometry Creation
TexGen [27] was chosen for its open-source nature and its specific design for modelling textile geometries, which made it a natural choice for this study. After an initial manual setup phase, an approach previously adopted in a former work by the authors was chosen [28], in which a Python (version number 3.9) -based tool was developed to automate the generation of packed bed geometries and simulation setups. Similarly, a custom Python script that not only programmatically defines the textile parameters within TexGen, but also automates the creation of multiple simulation-ready geometries by varying key structural parameters such as yarn density and reduction factor was implemented. This automated pipeline has significantly streamlined the preparation of large simulation batches while ensuring consistency and reproducibility. TexGen creates textiles where yarns are modelled as solid volumes. A centerline and a cross-section along that yarn define the yarns. A domain is also specified, defining the area of the textile to be investigated. The yarn path is then defined using the coordinates of the master nodes (in x, y, and z) that define the centerline, and then the exact path of this centerline is defined with interpolation (cubic in our case). The cross-section is defined as constant along the whole length of the yarn (i.e., elliptical cross-section).
It is important to point out that TexGen geometries are based on idealised yarn morphologies with constant elliptical cross-sections. In real woven fabrics, yarns undergo spatially varying deformation due to bending at crossover regions, contact-induced flattening, and heterogeneous packing. These effects can locally alter pore connectivity and airflow pathways, potentially causing deviations from the idealised geometry assumed in this study. In the present work, all these factors are accounted for in the corrections introduced by the reduction factor.
To model the textile structures in TexGen, a custom Python script has been developed that defines the structural parameters of the fabric. These parameters include the yarn density, the yarn dimensions, the yarn reduction factor, and Poisson’s ratio, which together describe the geometry and the deformation behaviour of the fabric. Starting from the yarns diameters ( and ), the other parameters were defined as follows:
The reduction factor () plays a decisive role in geometric modelling, as it provides information about the compressibility of the yarns when they are exposed to an air flow. This value depends not only on the density of the warp and weft yarns but also on the type of weave and reflects the mechanical reaction of the textile under pressure. For the sake of simplicity, Poisson’s ratio is assumed to be constant and set to 0.4, which is a representative value for cotton [29]. This parameter determines the lateral deformation of the yarns under vertical compression and contributes to the estimation of the yarn width after deformation. and represent the warp and weft densities of the yarns, and and are the spacing between the yarns, which are calculated as the reciprocal of these densities. The effective yarn thickness corrected by the reduction factor is evaluated as and . Finally, and are the effective yarn widths after deformation, taking into account the vertical compression and lateral expansion, modulated by the Poisson’s ratio.
Figure 3 shows graphically the parameters evaluated.
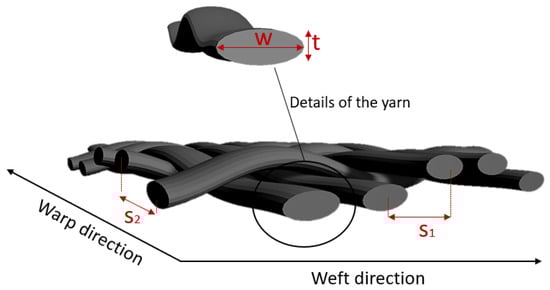
Figure 3.
In-plane view of the textile model, with main inter- and intra-yarn geometrical features indicated.
The structural parameters used to model the initial dataset to create the geometries and validating the CFD simulations were based on the work of Zupin et al. [10], which investigated four different textile structures: PW, BW, TW 1/3, and FR 4/2. Each of these weave types was modelled across four different yarn densities, namely 22/15, 22/20, 29.3/15, and 29.3/20 (warp/weft density in threads/cm). The diameters of the yarns were also taken from the same source [10] and were kept constant, with and for the warp and weft yarns, respectively (as shown in Figure 4).
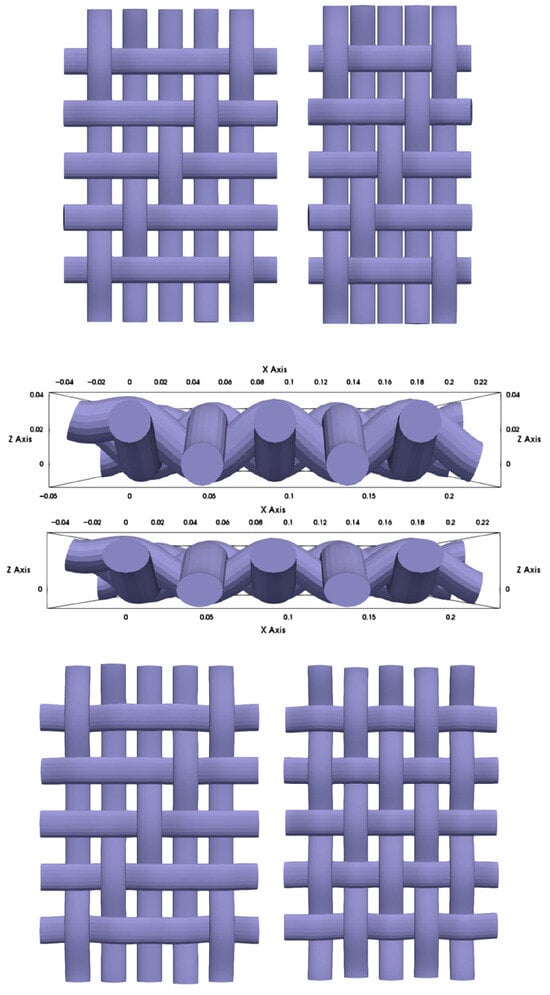
Figure 4.
Illustration of different densities (top) for Plain Weave, reduction factor (middle), and weave type (bottom) comparing Basket Weave on the left with Plain Weave on the right.
3.1. Mesh Generation
For mesh generation, a Representative Elementary Volume (REV) [30] consisting of five warp yarns and five weft yarns was set. This configuration was chosen to ensure that the selected area can effectively capture the periodicity and heterogeneity of the textile structure and thus serves as a repeatable unit for further analysis. By including multiple yarn interlacings in both directions, the REV is large enough to account for the structural and geometric variations that characterise each fabric type while remaining computationally manageable for simulation purposes.
The open source platform OpenFOAM [31] was used as software for both the meshing process and the CFD simulations. In particular, the snappyHexMesh utility was used to create the mesh. The meshing process started with the creation of a Cartesian background mesh over the entire computational domain, which in our case was defined as the volume surrounding the textile structure. This domain was set to twice the thickness of the fabric in the direction perpendicular to its plane, so that there was sufficient space above and below the material for the flow development. Once the background mesh was created, the geometric model (i.e., imported as an STL file) corresponding to the volume of the yarns was removed, obtaining a computational domain composed of only the empty parts where air flow will occur. Finally, the mesh is subjected to a further adjustment in which the edge points are shifted towards the surface of the original geometry, creating a mesh that corresponds exactly to the shape of the fabric. Figure 5 shows the obtained final mesh.
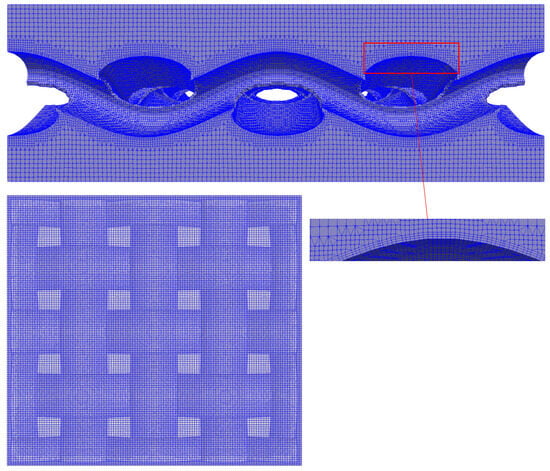
Figure 5.
Details of the computational domain in one of the structures studied, showing the periodicity of the REV and the levels used in the mesh generation.
3.2. CFD Simulations
After having ensured grid independence (as explained below), CFD simulations were performed by generating a pressure drop between the inlet and outlet surfaces of the computational domain. In the mono-scale flow configuration, yarns were treated as impermeable solids. The flow field was determined solely by the incompressible Navier–Stokes equations, which were solved in the regions between the yarns.
In the dual-scale configuration, the yarns were modelled as porous media, which allowed for flow within the yarns. In this case, the solver porousSimpleFoam was used, which simultaneously takes into account the Navier–Stokes equations in the free fluid regions and Darcy’s law within the porous regions representing the yarns. The solver automatically activates the appropriate formulation depending on the location: the Navier–Stokes equations are applied outside the yarns, while Darcy’s law applies to the internal porous domains.
In both cases, symmetric boundary conditions were applied to the lateral surfaces to prevent normal flow across them. The working fluid was chosen as an incompressible Newtonian fluid (air) with a density of and a kinematic viscosity of .
The present CFD simulations were performed under steady-state assumptions using the full Navier–Stokes equations without turbulence closure. Using the hydraulic diameter of the inter-yarn pores as characteristic length and the outlet velocities obtained under the imposed pressure drops, the resulting Reynolds numbers range between 50 and 100. These values fall within the transitional (or weakly turbulent) flow regime typically observed in textile air-permeability measurements. For these intermediate Reynolds numbers, we opted not to employ turbulence closures (as large-scale turbulent structures are not dominant) but to resolve the flow directly by means of mesh refinement and grid-independence analysis (Figure 6), ensuring that the relevant flow structures are adequately captured without introducing turbulence models.
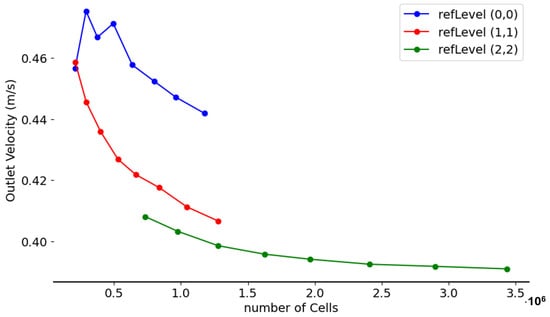
Figure 6.
Results of the grid independence study for three refinement levels.
4. Results and Discussion
To ensure the reliability of the grid, a grid independence test was performed and the results are shown in Figure 6. The outlet velocity was used as a reference parameter and plotted against the total number of cells to assess the sensitivity of the solution to grid refinement. Three increasing surface refinement levels were investigated (in OpenFOAM syntax parlance, starting from level (0,0), meaning no refinement at the wall, then moving to level (1,1), and level (2,2)), corresponding to the blue, red, and green curves, respectively. Among these, the configuration of the last stage (green curve) showed the most consistent behaviour, with the outlet velocity gradually approaching an asymptotic value. A plateau is reached beyond about cells, which means that further refinement leads to negligible changes in the results, while it means increased computational cost. This configuration offers the best compromise between computational cost and solution accuracy.
The first step was to check whether the structural parameters selected for modelling have a measurable influence on the overall permeability of the system. In this first set of simulations, inter-yarn was neglected, and a single average reduction factor was applied for all yarn densities and fabric structures. To evaluate the influence of yarn density and weave structure on flow velocity, a multiple linear regression analysis was performed. The model included categorical variables for both factors, using basket weave (BW) and density 22-15 as reference categories. This approach allowed us to quantify the independent contribution of each parameter to outlet velocity.
Table 1 summarises the estimated coefficients, standard errors, and the statistical significance of the model terms. The overall model fit is very good, with an adjusted of 0.947, which means that 94.7% of the variance in the obtained CFD velocity (CFD v) is explained by the predictors. The results show that the warp and weft density has a significant influence on the flow velocity: an increase in density from the initial value (22-15) to higher densities (22-20, 29.3-15, 29.3-20) leads to a significant decrease in the velocity, with the largest decrease observed at density 29.3-20. In terms of weave structure, PW shows a statistically significant negative effect on velocity compared to BW, while FR and TW show no significant differences.

Table 1.
Multiple linear regression results predicting flow velocity from yarn density, weave structure, and reduction factor. The baseline categories are Basket Weave for weave structure and 22-15 for yarn density. Significant coefficients are indicated with * ().
These results suggest that yarn density and weave structure are key factors influencing flow velocity in textile samples, with higher densities and certain structures reducing the velocity parameter.
Once the validity of the modelling decisions had been assessed, the inter-yarn was included in the simulations, assuming a fibre volume fraction () of 0.5 and an average fibre diameter of 8 m. Using Gebart’s equation for bundles of cylindrical fibres arranged in a square packing configuration, this corresponds to a micro-permeability of .
The introduction of intra-yarn increases the completeness and adaptability of the model, especially for fabrics with higher fibre volume fractions or higher yarn packing densities. As shown in Figure 2, these conditions correspond to shifts along the y-axis (higher micro-permeability) or along the x-axis (lower space between yarns). The simulation domain was then modelled in two different regions:
- Intra-yarn region: The yarns were represented as a porous medium, with the flow determined by Darcy’s law based on the micro-permeability of the fibre structure.
- Inter-yarn region: The flow between the yarns was solved using the Stokes equations, which are suitable for free flow conditions.
This dual-porosity approach allowed an evaluation of the impact of the general assumption of yarn impermeability on simulation accuracy, striking a balance between computational cost and model fidelity. To accelerate convergence, both dual-scale and mono-scale flow simulations were performed in the laminar regime. Importantly, this approach improves the flexibility of the model so that it can be applied to materials with a higher porosity, and enables predictions of air permeability in a wider range of textile structures. Intra-yarn porosity is not limited to cotton fibres or staple yarns, as some multifilament yarns may also exhibit internal voids. Conversely, monofilament yarns contribute exclusively to inter-yarn flow pathways. Consequently, air permeability is also influenced by yarn characteristics such as fibre type, yarn structure, and surface hairiness, which may alter the balance between intra- and inter-yarn flow domains. Although these aspects are beyond the scope of the present modelling assumptions, they should be considered when extrapolating the dual-porosity approach to different yarn architectures.
The results of these simulations are shown in Figure 7 in comparison to the corresponding single-scale flow values.
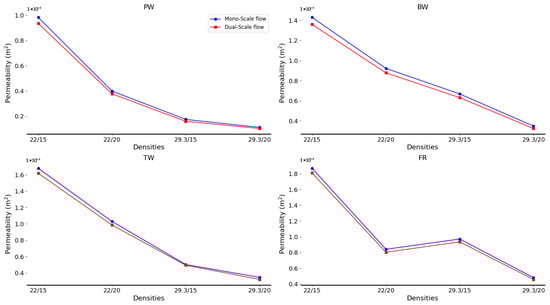
Figure 7.
Comparison of air permeability values obtained with dual-scale flow modelling (red curves) compared to mono-scale modelling (blue curves) in the laminar regime. Results are reported for each weave type: Plain Weave (PW), Basket Weave (BW), Twill (TW), and Filling Rib (FR).
The comparison showed no significant differences in permeability between dual- and single-scale simulations. Therefore, and in accordance with the theoretical considerations of Syerko et al. [14], the simplifying assumption of neglecting the intra-yarn flow is validated and only the intra-yarn porosity is considered, recognising the small error introduced by this approximation.
While the single-scale assumption proved valid for cotton yarns with moderate fibre volume fractions, its applicability is not universal. Textile systems with high intra-yarn porosity, irregular yarn packing, or heterogeneous microstructures, such as high-porosity reinforcements, may exhibit significant flow within the yarns. In these cases, a dual-scale representation is necessary to avoid underestimating permeability or misrepresenting local flow pathways.
The CFD framework developed already includes a dual-porosity configuration, allowing the model to be extended to yarn structured where intra-yarn flow is significant. This ensures that the overall methodology remains applicable across a wide range of materials, from tightly packed yarns to highly porous structures.
Subsequently, the reduction factor () was used as a tuning parameter to improve the agreement between CFD simulations and experimental data. For each fabric type and yarn density, was systematically adjusted so that the outlet velocities determined with the numerical model reproduced the experimental results reported by Zupin et al. [10], which served as a case study to validate the proposed modelling approach.
Once a good agreement between CFD and experimental results had been achieved for all configurations, a new and more general value for the reduction factor was sought, now defined as a global value for each of the four fabric structures. This allowed the overall behaviour of a fabric to be characterised solely by its interlacing pattern (namely: BW, PW, TW, and FR).
New simulations were then carried out using a single value across a range of reduction factors, keeping it constant for all four yarn densities within each weave type. The optimal value for each structure was identified as the one that minimised the prediction error, expressed as the root mean square error (RMSE) between the experimental and computational outlet velocities.
A sensitivity analysis was also performed to assess the influence of this reduction factor on the model response. For each weave type (plain, twill, basket, and filling rib), the outlet velocity was monitored while systematically varying the reduction factor. The analysis indicated that the model displays a clear minimum in RMSE for a specific factor value, and that small deviations (±10%) around this optimum result in variations in outlet velocity of less than 3%. This confirms that the selected reduction factor is a stable and physically meaningful parameter for each fabric structure, ensuring that the model remains robust across different yarn densities.
Table 2 presents the experimental outlet velocities alongside the calculated outlet velocities obtained using the selected reduction factor and the corresponding errors.
Table 2.
Comparison between experimental and CFD velocities obtained using the global reduction factor across different textile structures and densities, with the corresponding standard error rounded to two decimal places. Apart from columns 5 and 6, which are expressed in m/s, the other quantities are dimensionless.
In addition, Figure 8 shows the agreement between CFD and experimental errors using the tuned parameter by the densities in the same weave type.
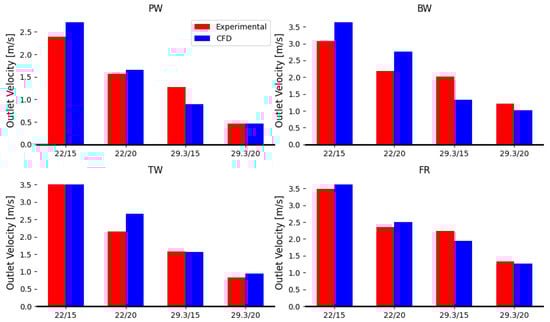
Figure 8.
Computational (blue bars) and experimental (red bars) results comparison in the different weave types estimated with the global reduction factor. Results are reported for each weave type: Plain Weave (PW), Basket Weave (BW), Twill (TW), and Filling Rib (FR).
The possibility of defining a global reduction factor allowed us not only to validate the CFD results but also to introduce a global tuning parameter representative of the mechanical behaviour of a given weave type. Together with Poisson’s ratio, which takes into account the deformation of the material in directions perpendicular to the applied load, this parameter provides a comprehensive description of the structural response of the fabric. This approach ensures that even for new cases where experimental validation is missing (unlike this case, where a dataset taken from the literature is available), simulations can be performed for different yarn densities with an acceptable error rate between the computational predictions and the actual measurements.
Starting from the 50 experimental fabric configurations reported in the literature [10], each defined by a combination of weave type and warp/weft density, this first set of conditions was first reproduced in the CFD model to be validated. Subsequently, the CFD setup was used to expand the dataset, interpolating new density values within the same experimental range (warp 22–29.3 yarns/cm, weft 15–20 yarns/cm).
For each weave type, four intermediate densities were added between the minimum and the maximum literature values for both warp and weft (15, 16.3, 17.5, 18.8, 20 yarns/cm in warp and 22, 23.8, 25.7, 27.5, 29.3 yarns/cm in weft), resulting in 25 new density pairs per weave type. This procedure doubled the number of available configurations while remaining fully consistent with experimentally observed ranges.
These additional simulations increased the number of data points available for training the neural network, enabling it to learn the relationship between structural parameters (such as yarn density and weave type) and the resulting outlet velocity with greater robustness. Therefore, a flexible tool was developed, facilitating both the simulation and the interpretability of permeability-relevant fabric features.
Fully Connected Neural Network
The neural network developed for this purpose was a fully connected feedforward network with a single hidden layer of 16 neurons and a ReLU activation function. Inputs included the warp and weft density, the associated global reduction factor, and a set of one-hot encoded variables representing the weave structure (as shown in Figure 9).
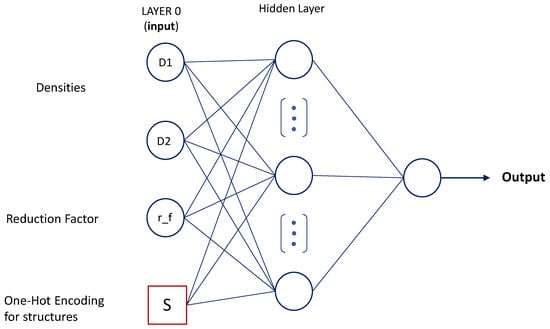
Figure 9.
Scheme of the architecture of the FCNN.
The training process was monitored by both training and validation losses, with early stopping applied to prevent overfitting. As can be seen in Figure 10, the network converged quickly within the first hundred epochs, after which the training and validation losses remained close to each other until the end of training. This behaviour indicates stable convergence and the absence of overfitting.
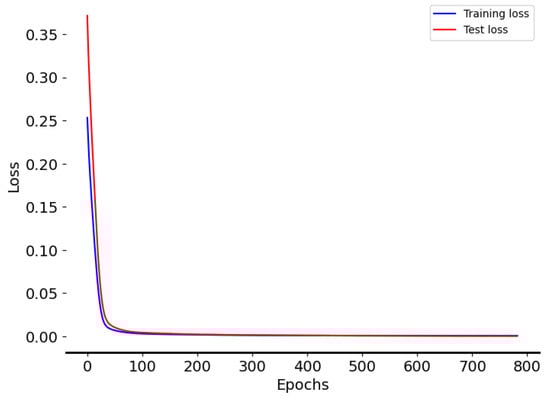
Figure 10.
Losses over epochs for training and test data.
The consistency of the predictions is also confirmed by the parity diagram in Figure 11, in which the predicted values closely match the experimental data, as evidenced by the clustering along the identity line. No obvious biases or systematic deviations are observed, indicating that the model correctly captures the underlying relationships. Moreover, both the training and test data follow similar trends, confirming good generalisation.
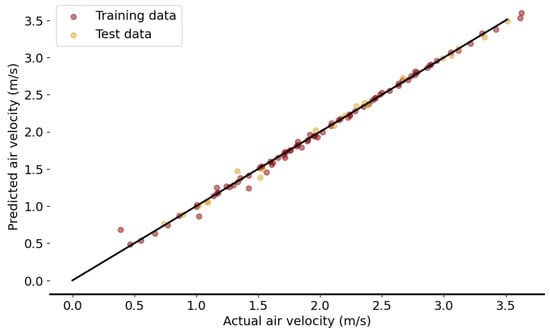
Figure 11.
Parity plot of the model predictions compared to the experimental outlet air velocity.
In quantitative terms, the network achieved a mean absolute relative error of 2.01%, a maximum error of 7.72%, a root mean squared error (RMSE) of 0.0438 m/s, and a coefficient of determination () of 0.9974, indicating excellent agreement between predictions and experimental measurements.
A more granular analysis of the prediction errors shows the variability between the weave types: the highest error is observed for BW fabrics (0.0446) and the lowest for FR fabrics (0.0063), while PW and TW are in between (0.0380 and 0.0263, respectively). This suggests that certain weave types are predicted more accurately, possibly due to differences in geometric complexity.
The influence of yarn density on prediction accuracy was analysed by dividing warp density D1 and weft density D2 into four intervals each. The mean absolute relative error increases with both D1 and D2:
- For D1, the error rises from 0.0094 in the lowest bin to 0.0438 in the highest interval.
- For D2, the error increases from 0.0198 in the lowest bin to 0.0518 in the highest interval.
The correlation coefficients confirm this trend: D1 shows a moderate positive correlation with the error (0.573), while D2 shows a weaker correlation (0.251). These results suggest that fabrics with higher yarn density are associated with slightly higher prediction errors, which is consistent with the increased sensitivity of outlet velocity to geometric variations in denser textiles.
Overall, the FCNN exhibits a low and consistent error across the parameter space, with most predictions falling within experimental variability, while the subtle influence of weave type and yarn density on model performance is emphasised.
To quantitatively assess the computational benefit of the proposed hybrid framework, a comparison was made between the CFD-based simulations and the FCNN predictions in terms of processing time and scalability. Each CFD simulation was run on four CPU cores and required approximately 40 min to reach convergence. For a typical dataset of 100 virtual fabric structures, the total computational cost amounts to 4000 min (approximately 67 h) of CPU time, excluding mesh generation and post-processing.
In contrast, the FCNN required around 7 min for training on the same hardware and subsequently provided individual predictions in less than 2 s. The corresponding speed-up ratio (S), defined as
is approximately 1200, indicating that the neural network performs permeability evaluations about three orders of magnitude faster than the CFD solver once trained. The computational cost per sample, therefore, decreases from 40 min per sample (CFD) to 0.002 min per sample (FCNN), yielding an efficiency gain of 99.995%.
This drastic reduction in CPU time enables rapid parametric exploration of design variables and real-time evaluation of multiple fabric configurations, while maintaining an average predictive error of 2.01% with respect to CFD results. From an engineering perspective, the FCNN acts as a surrogate model capable of reducing computational costs by several orders of magnitude without compromising accuracy, thus making large-scale optimisation and virtual prototyping of textile architectures computationally feasible.
In conclusion, the FCNN was able to successfully reproduce the experimental results for the various fabric structures and yarn densities considered. Minor deviations were observed for some specific configurations, but there was no systematic bias. Importantly, this prediction accuracy is achieved at a fraction of the computational cost of CFD simulations, making the network an effective surrogate model for rapid parametric exploration and design optimisation of woven textiles.
5. Conclusions
This work introduced a computational framework for predicting the air permeability of woven technical textiles from their structural parameters before production. By integrating validated CFD simulations with a Fully Connected Neural Network (FCNN), this study demonstrates a practical method to link microscopic textile geometry with macroscopic aerodynamic performance. The selected design parameters are relevant to real manufacturing processes, enabling the tool to be readily applied for design optimisation.
The inclusion of both intra- and inter-yarn porosity in the CFD framework extends the model’s applicability to a wide range of fabrics, from highly porous to densely woven structures, ensuring robustness under different flow regimes. Although the assumption of impermeability of the yarns was supported by both analytical reasoning and quantitative comparison with experimental data, the model was designed to account for fabrics that could fall into the dual-flow regime. In this way, the framework remains valid even for fabrics with highly porous yarns or tightly packed structures. The strategy significantly increased the robustness and generality of the methodology.
The current framework does not account for unsteady flow effects or fabric deformation. Future extensions may incorporate fluid–structure interaction (FSI), unsteady CFD, or turbulence modelling if moving beyond the transitional ranges studied here to capture the coupling between yarn deformation and evolving pore geometry, thereby extending the practical applicability of the workflow.
From a computational perspective, the hybrid CFD–FCNN strategy proved to be highly efficient. A speed-up ratio of about 1200× and a reduction of more than 99.99% in computational cost per evaluation were reached, without significant loss of accuracy (mean error 2.01%). These results highlight the practical scalability of the approach and its suitability for integration into design optimisation loops or digital prototyping pipelines, where large parametric explorations are required. The machine learning component effectively replaces computationally expensive CFD steps while maintaining predictive accuracy, highlighting the potential of hybrid physical data-driven models in textile engineering.
Beyond its immediate predictive capability, this approach represents a key concept: permeability evaluation can move from a post-production measurement to a pre-design optimisation step, supporting the creation of textiles with tailored comfort performance.
However, the current study is limited to laminar flow and cotton-based materials, chosen as a representative case. Future work will expand the model to include different fibres, weave types, and flow regimes, and will extend the predictive framework to additional comfort-related properties such as moisture and heat transfer, ultimately enabling a comprehensive multi-scale tool for technical textile design.
Author Contributions
Methodology, G.B. (Gianluca Boccardo); formal analysis, A.F. and G.B. (Gianluca Boccardo); investigation, E.B. and G.B. (Ghasem Beiginalou); resources, A.F.; data curation, E.B. and G.B. (Ghasem Beiginalou); writing—original draft, E.B. and G.B. (Gianluca Boccardo); writing—review editing, A.F. and G.B. (Gianluca Boccardo); project administration, A.F. and G.B. (Gianluca Boccardo); funding acquisition, A.F. and G.B. (Gianluca Boccardo). All authors have read and agreed to the published version of the manuscript.
Funding
This study was carried out within the MICS (Made in Italy—Circular and Sustainable) Extended Partnership and received funding from the European Union Next-GenerationEU (PIANO NAZIONALE DI RIPRESA E RESILIENZA (PNRR)—MISSIONE 4 COMPONENTE 2, INVESTIMENTO 1.3—D.D. 1551.11-10-2022, PE00000004). This manuscript reflects only the authors’ views and opinions; neither the European Union nor the European Commission can be considered responsible for them.
Data Availability Statement
The raw data supporting the conclusions of this article will be made available by the authors on request.
Conflicts of Interest
The authors declare no conflicts of interest.
References
- Rasheed, A. Classification of Technical Textiles. In Fibers for Technical Textiles; Ahmad, S., Rasheed, A., Nawab, Y., Eds.; Topics in Mining, Metallurgy and Materials Engineering; Springer: Cham, Switzerland, 2020. [Google Scholar] [CrossRef]
- Horrocks, A.R.; Anand, S.C. (Eds.) Handbook of Technical Textiles; Elsevier: Amsterdam, The Netherlands, 2000. [Google Scholar]
- Paul, R. (Ed.) High Performance Technical Textiles; John Wiley & Sons: Hoboken, NJ, USA, 2019. [Google Scholar]
- Rajendran, S.; Anand, S.C. Developments in Medical Textiles. Text. Prog. 2002, 32, 1–42. [Google Scholar] [CrossRef]
- Morrissey, M.P.; Rossi, R.M. Clothing systems for outdoor activities. Text. Prog. 2013, 45, 145–181. [Google Scholar] [CrossRef]
- ISO 9237:1995; Textiles—Determination of the Permeability of Fabrics to Air. International Organization for Standardization: Geneva, Switzerland, 1995.
- Kulichenko, A.V. Theoretical analysis, calculation, and prediction of the air permeability of textiles. Fibre Chem. 2005, 37, 371–380. [Google Scholar] [CrossRef]
- Daukantiene, V.; Vadeike, G. Evaluation of the air permeability of elastic knitted fabrics and their assemblies. Int. J. Cloth. Sci. Technol. 2018, 30, 839–853. [Google Scholar] [CrossRef]
- Havlová, M. Air permeability and constructional parameters of woven fabrics. Fibres Text. East. Eur. 2013, 2, 84–89. [Google Scholar]
- Zupin, Z.; Hladnik, A.; Dimitrovski, K. Prediction of one-layer woven fabrics air permeability using porosity parameters. Text. Res. J. 2012, 82, 117–128. [Google Scholar] [CrossRef]
- Ogulata, R.T.; Mezarcioz, S.M. Total porosity, theoretical analysis, and prediction of the air permeability of woven fabrics. J. Text. Inst. 2012, 103, 654–661. [Google Scholar] [CrossRef]
- Shen, H.; Xu, Y.; Wang, F.; Wang, J.; Tu, L. Numerical analysis of heat and flow transfer in porous textiles-Influence of wind velocity and air permeability. Int. J. Therm. Sci. 2020, 155, 106432. [Google Scholar] [CrossRef]
- Puszkarz, A.K.; Machnowski, W.; Błasińska, A. Modeling of thermal performance of multilayer protective clothing exposed to radiant heat. Heat Mass Transf. 2020, 56, 1767–1775. [Google Scholar] [CrossRef]
- Syerko, E.; Binetruy, C.; Comas-Cardona, S.; Leygue, A. A numerical approach to design dual-scale porosity composite reinforcements with enhanced permeability. Mater. Des. 2017, 131, 307–322. [Google Scholar] [CrossRef]
- El Messiry, M. Theoretical determination of the fiber volume fraction distribution for natural fiber fabric reinforced polymer composite. J. Ind. Text. 2018, 48, 904–925. [Google Scholar] [CrossRef]
- Cay, A.; Vassiliadis, S.; Rangoussi, M.; Tarakçıoğlu, I. Prediction of the air permeability of woven fabrics using neural networks. Int. J. Cloth. Sci. Technol. 2007, 19, 18–35. [Google Scholar] [CrossRef]
- Matusiak, M. Application of artificial neural networks to predict the air permeability of woven fabrics. Fibres Text. East. Eur. 2015, 23, 41–48. [Google Scholar]
- Haroglu, D. Modeling the air permeability of pile loop knit fabrics using fuzzy logic and artificial neural network. J. Text. Inst. 2023, 114, 265–272. [Google Scholar] [CrossRef]
- Gültekin, E.; Çelik, H.İ.; Nohut, S.; Elma, S.K. Predicting air permeability and porosity of nonwovens with image processing and artificial intelligence methods. J. Text. Inst. 2020, 111, 1641–1651. [Google Scholar] [CrossRef]
- Icardi, M.; Boccardo, G.; Marchisio, D.L.; Tosco, T.; Sethi, R. Pore-scale simulation of fluid flow and solute dispersion in three-dimensional porous media. Phys. Rev. E 2014, 90, 013032. [Google Scholar] [CrossRef]
- Gebart, B.R. Permeability of unidirectional reinforcements for RTM. J. Compos. Mater. 1992, 26, 1100–1133. [Google Scholar] [CrossRef]
- Long, A.; Boisse, P.; Robitaille, F. Mechanical analysis of textiles. In Design and Manufacture of Textile Composites; Elsevier: Amsterdam, The Netherlands, 2005; pp. 62–109. [Google Scholar]
- Yu, X.W.; Wang, H.; Wang, Z.W. Analysis of yarn fiber volume fraction in textile composites using scanning electron microscopy and X-ray micro-computed tomography. J. Reinf. Plast. Compos. 2019, 38, 199–210. [Google Scholar] [CrossRef]
- Yanagisawa, M.; Keynia, S.; Belteton, S.; Turner, J.A.; Szymanski, D.B. A conserved cellular mechanism for cotton fibre diameter and length control. In Silico Plants 2022, 4, diac004. [Google Scholar] [CrossRef]
- He, C.; Ge, J.; Cao, X.; Chen, Y.; Chen, H.; Fang, D. The effects of fiber radius and fiber shape deviations and of matrix void content on the strengths and failure mechanisms of UD composites by computational micromechanics. Compos. Sci. Technol. 2022, 218, 109139. [Google Scholar] [CrossRef]
- Sumetsky, M.; Dulashko, Y. Radius variation of optical fibers with angstrom accuracy. Opt. Lett. 2010, 35, 4006–4008. [Google Scholar] [CrossRef] [PubMed]
- Brown, L.P. TexGen. In Advanced Weaving Technology; Springer: Berlin/Heidelberg, Germany, 2022; pp. 253–291. [Google Scholar]
- Boccardo, G.; Augier, F.; Haroun, Y.; Ferré, D.; Marchisio, D.L. Validation of a novel open-source work-flow for the simulation of packed-bed reactors. Chem. Eng. J. 2015, 279, 809–820. [Google Scholar] [CrossRef]
- Sun, H.; Pan, N.; Postle, R. On the Poisson’s ratios of a woven fabric. Compos. Struct. 2005, 68, 505–510. [Google Scholar] [CrossRef]
- Bear, J. Dynamics of Fluids in Porous Media; Courier Corporation: New York, NY, USA, 2013. [Google Scholar]
- Schulze, L.; Thorenz, C. The multiphase capabilities of the CFD toolbox OpenFOAM for hydraulic engineering applications. In Proceedings of the ICHE 2014, Hamburg, Germany, 28 September–2 October 2014; pp. 1007–1014. [Google Scholar]
Disclaimer/Publisher’s Note: The statements, opinions and data contained in all publications are solely those of the individual author(s) and contributor(s) and not of MDPI and/or the editor(s). MDPI and/or the editor(s) disclaim responsibility for any injury to people or property resulting from any ideas, methods, instructions or products referred to in the content. |
© 2026 by the authors. Licensee MDPI, Basel, Switzerland. This article is an open access article distributed under the terms and conditions of the Creative Commons Attribution (CC BY) license.