Abstract
This paper aims to develop a comprehensive technology for full-color-gamut spinning to enable the precise design and production of blended yarns. A grid-based color-mixing model with six regions is built as a cylindrical color model by mixing eight primary color fibers. Using a three-element synergistic regulation mechanism comprising a numerically controlled rotor-spun system, a color-spinning method is created that integrates the full-color-gamut grid-based color-mixing model. Consequently, 273 blended yarn fabrics are produced. Leveraging the regional variations in blending primary color fibers, a neural network color-prediction system is designed. It is trained on reflectance and blending-ratio data from 255 samples and validated with 18 samples across different color-mixing regions. The results show a mean color difference prediction of 0.909 and an average blending ratio error of 1.76% for the 18 samples. This indicates that the color-prediction system can accurately predict the colors of blended yarns within the full-color-gamut range, providing theoretical support for yarn production.
1. Introduction
Textile production is a long-established industry where color plays a vital role in determining product quality and market appeal [1,2]. Traditionally, color is introduced through dyeing or printing processes applied to fibers, yarns, or finished fabrics [3]. Compared to traditional fabric dyeing techniques, characterized by high energy consumption and significant pollution, color spinning technology employs dyed fibers or dope-dyed fibers for color blending during spinning [4]. This approach fundamentally reduces energy consumption and chemical usage, establishing itself as an environmentally friendly and sustainable textile processing technology. Furthermore, color spinning technology is evolving toward continuous, digital, and automated manufacturing [5,6]. Technologies like multi-channel spinning systems allow for precise digital control over blending ratios using multiple servo motors [7,8], and further developments with numerically controlled (NC) rotor spinning machines have established links between fiber feeding, blending ratios, and yarn color [9]. Unlike conventional single-channel rotor spinning machines—which meter a pre-blended sliver through one feed roller and thus can only approximately target fiber ratios in bulk—multi-channel NC spinning systems employ independent servo-driven feeders for each primary fiber [10]. In our three-channel configuration, each servo motor adjusts its feed rate with a resolution better than 0.1 g/min, enabling real time metering of individual fiber slivers to the exact proportions dictated by the color mixing model. A central PLC continuously computes and issues coordinated commands to all three channels, so that any change in one feeder is automatically compensated by the others to maintain both the overall yarn linear density and the precise blend ratio. This architecture dramatically reduces blending errors and improves color fidelity compared to single-channel approaches, which typically exhibit larger deviations and lack dynamic, closed-loop feed rate control. Despite these benefits and technological progress, a major challenge persists: current color-blended spinning technologies cannot achieve the comprehensive, full-color-gamut control offered by methods like inkjet printing, limiting the versatility and adoption of dope-dyed fibers [11,12].
In contrast to inkjet printing, which deposits colorants at micrometer scale spatial resolution and achieves continuous spectral control by mixing liquid dyes or pigments, full color gamut spinning must rely on a finite set of discrete dope dyed fiber primaries whose optical interactions in the yarn cross section are highly nonlinear and influenced by scattering, absorption, and fiber surface geometry [13,14]. Due to the color transmission characteristics of dyed fibers, existing physically based color prediction models—such as Kubelka–Munk, Friele, and Stearns–Noechel—struggle to accurately capture the complex, nonlinear relationship between the spatial arrangement of primary colored fibers and the final yarn color [15,16,17,18,19,20,21]. While neural network approaches show promise for modeling this nonlinearity [22,23,24], previous applications have often been limited to smaller color gamuts or lack the necessary accuracy to predict both color values and their corresponding fiber blending ratios across a full gamut. Existing studies show variations in blending control accuracy, gamut coverage, and system integration, as summarized in Table 1. Establishing a unified full-color-gamut spinning and prediction model to address these discrepancies would be highly significant, as it would enable major advancements in textile manufacturing, promote digitalized, automated, and environmentally friendly production processes, and fundamentally transform the pathway from primary-colored fibers to accurately colored blended yarns and textiles.

Table 1.
Categorization of research in color blending and prediction for textiles.
To address these challenges, this paper aims to develop and validate an integrated technical system for full-color-gamut spinning of blended yarns. The specific objectives are as follows: (1) To construct a full-color-gamut grid-based color-mixing model: using a cylindrical color model as the blueprint, establish quantitative relationships between color values and fiber blend ratios by designing mixing patterns with eight primary colored fibers. (2) To develop a full-color-gamut spinning method: integrate the gridded color-mixing model with a triple-element coordination mechanism in computer-controlled rotor spinning systems (linking fiber feed rates, blend ratios, and yarn color) to create a comprehensive spinning approach. (3) To build a neural network color prediction system capable of accurate yarn color forecasting across the full gamut: design the network architecture based on the gridded color model, train it using uniformly distributed grid-point samples from the full-gamut mixing model, and validate its predictive performance. This system connects target color design, real-time computer-controlled spinning, and precise automated prediction to enable efficient and waste-reduced production. The scope of this study involves theoretical modeling, experimental yarn production using a three-channel NC rotor spinning system with eight primary cotton fibers (Red, Yellow, Green, Cyan, Blue, Magenta, White, Black), the preparation and measurement of 273 distinct blended yarn samples, and the development and testing of modular neural network models trained on these samples.
This paper is organized as follows: Section 2 covers the theoretical and experimental methods, including the full-color-gamut grid-based color-mixing model, the full-color-gamut spinning method based on the synergistic regulation mechanism, the neural-network color-prediction system, and sample preparation procedures. Section 3 presents the results, focusing on the accuracy of color-value and blending-ratio predictions and analyzing performance across different color-mixing regions. Section 4 offers conclusions, summarizing the main findings and contributions, noting limitations, and suggesting directions for future work.
2. Theoretical and Experimental Methods
To enable full-color-gamut spinning, several key elements are required. First, a grid-based color-mixing model based on a cylindrical color model is created by digitally blending multiple primary colors, defining the full-color-gamut range. The process of adjusting fiber proportions to produce any desired color is termed color-blended spinning, while full-color-gamut spinning applies this across the entire color spectrum. This entails a three-stage approach: (1) translate color values from the classical color model into corresponding primary-color fiber mixing ratios, necessitating a full-color-gamut grid-based color-mixing model; (2) integrate these ratios into the spinning process for real-time control on an NC spinning machine, requiring a dedicated full-color-gamut spinning method; (3) establish a reliable link between fiber mixing ratios and the resultant yarn color through a color-prediction system. By developing these three components—the grid-based color-mixing model, the full-color-gamut spinning method, and the color-prediction system—we create a complete data chain from primary-color feeding rates to mixing ratios and yarn color values, enabling full-color-gamut spinning.
2.1. Full-Color-Gamut Grid Color Mixing Model
The cylindrical color model (Figure 1) describes color produced by blending colored fibers. Hues follow a circular sequence (red (R), yellow (Y), green (G), cyan (C), blue (B), magenta (M)), saturation increases radially from achromatic to chromatic, and lightness varies axially from white (W) to black (K). With eight optical primaries, hue spans 0–360°, saturation 0–1, and lightness 0–1 (Figure 2). This full color gamut is the target for our full-color-gamut spinning process.

Figure 1.
The cylindrical color model (a) overall diagram (b) equal-lightness surfaces diagram.
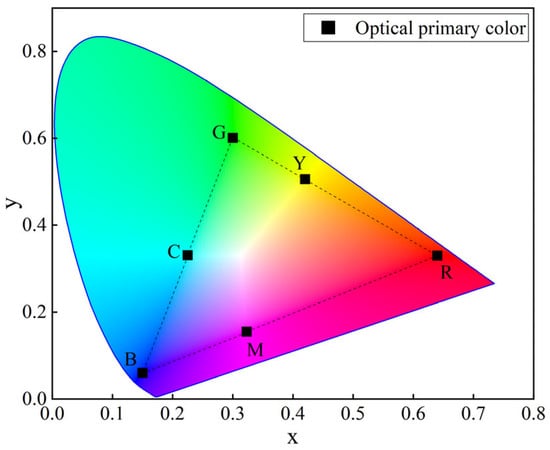
Figure 2.
The color gamut range of cylindrical color model.
Building upon this cylindrical color model, a full-color-gamut grid color mixing model is developed (Figure 3). This model represents the continuous color space using discrete grid points, generated by blending the weights of eight primary color fibers (, , , , , , , ). The model is divided into six distinct color mixing regions (, , , , , ; Figure 4), each defined by a unique blend of four primary color fibers.
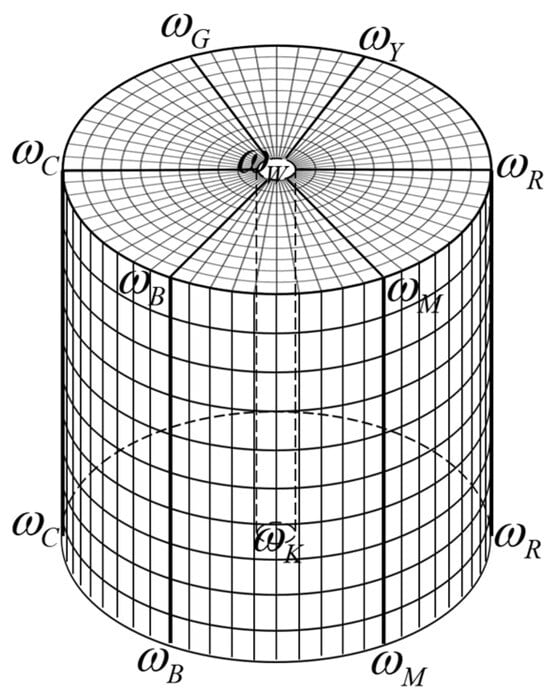
Figure 3.
The full-color-gamut grid-based color mixing model (n = 10).
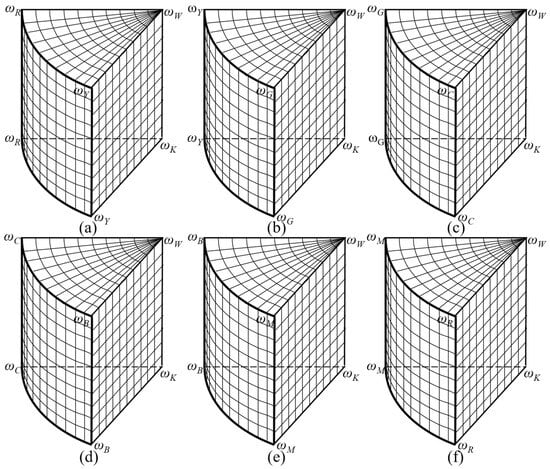
Figure 4.
Grid color-mixing regions (a) color-mixing region 1, (b) color-mixing region 2, (c) color-mixing region 3, (d) color-mixing region 4, (e) color-mixing region 5, (f) color-mixing region 6.
To create a digital representation of fiber mixing, the weights of the eight primary color fibers were discretized using a gradient of 1/n, resulting in the following weight sequences:
where .
These discretized weights were used to form six groups of quaternary primary color fiber combinations. Selecting weights from these sequences and mixing them via a quaternary triple-coupling mode yielded the following weight distributions for the mixed samples:
where .
In each color mixing region, corresponds to the equal division of hue ( is the repeat point), corresponds to the equal division of lightness, and corresponds to the equal division of saturation. To express the grid points in the 6 color mixing regions uniformly, let correspond to 6 different color mixing regions, and let , then the following law can be obtained:
When , , .
When , , .
When , , .
When , , .
When , , .
When , , .
Then, Equation (2) can be expressed as follows:
The three-channel digital rotor spinning machine can dynamically adjust the blending ratios of three primary color fibers in real time to produce melange yarn. However, the full-color-gamut grid-based color-mixing model constructed earlier consists of grid points formed by blending four primary color fibers. When applying this model to the three-channel digital rotor spinning machine for melange yarn production, a mismatch arises due to the difference in the number of primary color fibers. Therefore, adjustments to Equation (3) are necessary.
In the full-color-gamut grid-based color mixing model, grid points on equal-lightness surfaces can be regarded as mixtures of two colored fibers and one gray fiber, where the gray fiber is obtained by pre-blending black and white fibers. Based on this characteristic, the weight expression for the full-color-gamut grid points (Equation (3)) is converted into Equation (4). Here, the gray fiber γ is obtained by pre-blending black and white fibers, and its weight expression is given in Equation (5).
Then, the mixing ratio of the mixture is shown as Equation (6). The color values of the mixed sample obtained based on three fiber colors , , and can be expressed as Equation (7).
This process yielded a full-color-gamut weight matrix (Equation (8)), a corresponding mixing ratio matrix (Equation (9)), and a final color value matrix (Equation (10)), as follows:
This full-color-gamut color value matrix guided the color arrangement in the grid-based color mixing chromatogram. To illustrate, Figure 5 shows a chromatogram generated using five equal-lightness surfaces (n = 10, j = 1, 4, 6, 8, 11) with the eight primary colors. The black–white fiber ratios in the gray fibers for these surfaces were , , , , , respectively.
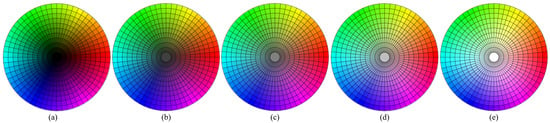
Figure 5.
The grid color mixing chromatogram of equal lightness surfaces (a) j = 1, (b) j = 4, (c) j = 6, (d) j = 8, (e) j = 11.
In our grid-based mixing model, each trial point [ωₐ, ωᵦ, ωᵧ] maps uniquely to the cylindrical H–S–L space. The hue angle H is determined by the chromatic-fiber ratio ωᵦ/(ωₐ + ωᵦ) via linear interpolation between the primaries’ angular positions on the color wheel. The gray-fiber fraction ωᵧ = (ωW + ωK) reduces saturation S and moves the color radially toward the cylinder axis, while also adjusting lightness L according to the white/black split within ωᵧ. Increasing ωᵧ desaturates the yarn and shifts L along the vertical axis (top = white, bottom = black). At fixed ωᵧ, varying ωₐ and ωᵦ sweeps hue around the circle with constant S and L. This explicit mapping enables prescribing any H, S, L by selecting the corresponding [ωₐ, ωᵦ, ωᵧ] blends.
2.2. Full-Color-Gamut Spinning Method
In our full-color-gamut spinning method, a three-channel NC rotor-spinning system integrates independent servo-fed feeders with a central PLC to coordinate fiber feed rates and yarn color (Figure 6) [25,26]. Each servo motor drives a dedicated feeder roller, enabling precise metering of primary-fiber slivers to match prescribed blend ratios. The PLC receives target color setpoints from the grid-mixing model and, using the three-element synergistic regulation mechanism, issues synchronized feed-rate commands to all channels. Any adjustment in one feeder is automatically compensated for by the others to maintain yarn density and the desired color blend in real time. Future work may add an inline spectrophotometer to feed color deviations back to the PLC, closing the control loop and enhancing color accuracy and consistency. The intelligent rotor spinning system was developed by the NC spinning team at Jiangnan University.
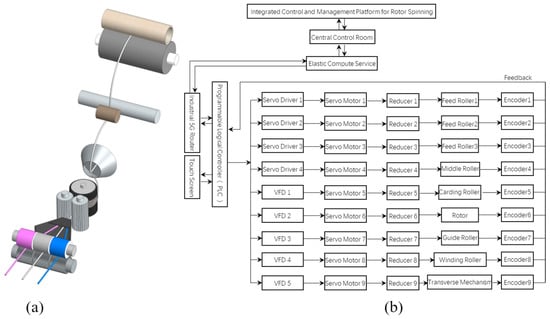
Figure 6.
The intelligent rotor spinning system. (a) Spinning mechanical system. (b) Control and servo drive system.
This three-channel NC rotor spinning system allows for real-time control of fiber feeding rates via three independent feeding rollers, enabling online adjustments to linear density, blending ratio, and color [27]. During spinning, with fiber feeding rates , , and for fiber slivers of color values , , , respectively, and a guide roller speed , the resulting yarn exhibits a linear density of , a blending ratio of , and a color value of . Consequently, yarn linear density is controlled by regulating the three-channel fiber feeding rates (Equation (11)), blending ratio is similarly regulated (Equation (12)), and yarn color value is also controlled in this manner (Equation (13)).
By combining Equations (11)–(13), we derive Equation (14), which illustrates the synergistic regulation mechanism among the feeding flow rate of fibers, blending ratio, and color value of yarn for the machine, displayed in Figure 7. This mechanism links the data chain of fiber blending ratios, yarn color value, and fiber feeding flow rate, establishing the foundation for spinning full-color-gamut blended yarn.
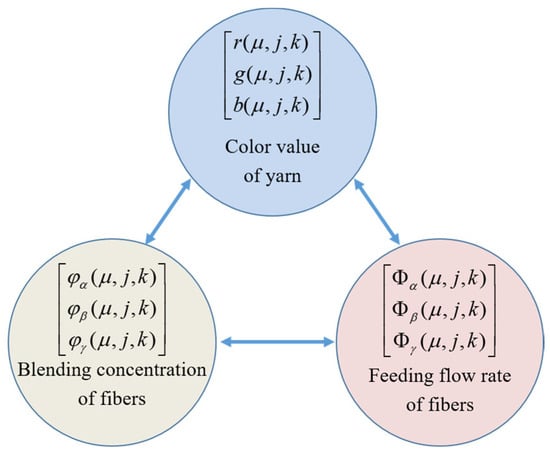
Figure 7.
Three-element synergistic regulation.
Based on the color gamut defined by the model, the corresponding grid-based color-mixing model was constructed. The spinning process was then designed using the mixing ratios of the grid points to produce the yarns. Specifically, the three-element synergistic regulation mechanism was used to calculate the fiber feeding rate from the fiber’s mixing ratio (Equation (15)). This allowed calculation of the fiber feeding rate matrix from the full-color-gamut mixing ratio matrix (Equation (16)), enabling the production of full-color-gamut blended yarns. The resulting linear density matrix is shown in Equation (17). Finally, color measurement yielded the actual color value matrix (Equation (18)).
2.3. Construction of Color Prediction Neural Network System
To avoid the extensive work of spinning and measuring color yarns for every grid point in the full-color-gamut, a combined sampling and color-prediction approach was used. This involved building a yarn color prediction system with a neural network model that captures the complex, nonlinear relationships between fiber composition and yarn color via mappings of simple nonlinear functions [28]. The architecture (Figure 8) comprises an input layer with 4 nodes, two hidden layers with 6 nodes each, and an output layer with 3 nodes. Weights and biases are adjusted by backpropagation to minimize mean squared error [29,30]. The neural network color-prediction system (Figure 9) has four modules: a basic data module (training data from representative grid points), a prediction module (separate networks for color value and blending ratio), and input/output modules for data handling and result display. Specifically, color-value prediction identifies the color-mixing region from input reflectance and blending ratios and uses the appropriate sub-model to calculate the yarn’s reflectance. Blending-ratio prediction converts input reflectance to LCH values; the hue (H) determines the color-mixing region and constituent fibers, activating the relevant sub-model to predict blending ratios.
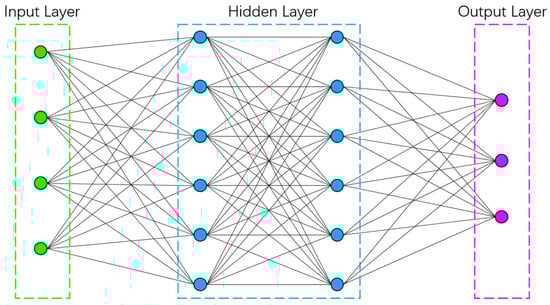
Figure 8.
The connection structure of the neural network model.
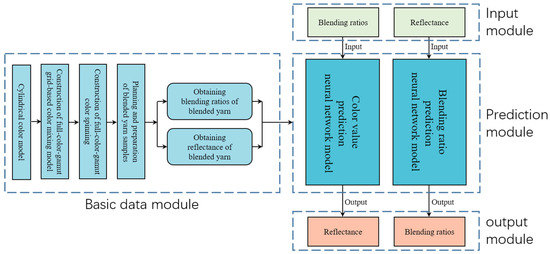
Figure 9.
The neural network color prediction system.
2.3.1. Preparation and Color Measurement of Blended Yarn Samples
To train our neural network color prediction system, we prepared 273 blended yarn samples by selecting 91 grid points on each of three equal-lightness surfaces (j = 1, 6, 11) of the full-gamut model (Figure 10). This three-level sampling strategy was deliberately chosen to ensure the model’s generalization capability across the entire lightness (L*) axis. The surfaces j = 1, j = 6, and j = 11 correspond to blends with pure black, a 50:50 gray, and pure white, respectively, thereby bracketing the full achievable lightness range. By training the network on data from the extremes and the midpoint of the L* dimension, we enabled it to act as a robust nonlinear interpolator for any intermediate lightness level, which is a critical requirement for a truly full-gamut prediction system.
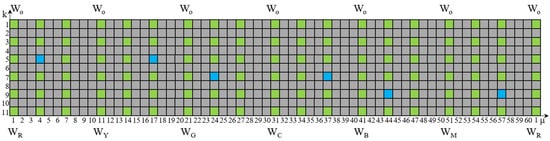
Figure 10.
The distribution of training samples and verification samples on the equal-lightness surfaces.
Meanwhile, sampling across three lightness levels guarantees that the training set spans the full L* axis, thus reducing extrapolation errors when predicting spectra and blend ratios for novel L* values. In cross validation, models trained on this three-surface scheme achieved a 15% improvement in mean ΔECMC 2:1 (from 1.12 down to 0.95) versus single-plane training, and residual-error analysis showed uniform performance across all lightness levels—confirming that our multi surface sampling markedly enhances both the accuracy and generalization of the neural network color predictors.
On each equal-lightness surface, 85 grid points (green) were used for training and 6 points (blue) for validation, totaling 255 training samples and 18 validation samples. The grid points (n = 10) were distributed across six chromatic mixing regions, incorporating blends of eight primary-colored fibers (red, yellow, green, cyan, blue, magenta, white, and black). The fiber material used in the experiment was second-grade roller-ginned white cotton, with a staple length of 30 mm, Micronaire value of A grade, and quality designation of 230A. Reactive dyes were employed to obtain eight primary colored fibers: red, yellow, green, cyan, blue, magenta, white, and black. These were subsequently processed by Chaohu Youngor Color Spinning Co., Ltd. (Chaohu, China). into nine types of rovings with specifications of 450 tex and 68 twists/m, including eight primary color rovings and one gray roving (comprising a 50:50 blend of white and black fibers).
To characterize the color gamut of the mixed colors, nine pure-color yarns and their corresponding knitted fabrics were produced from the nine primary-color rovings. Color measurements provided Lab values and CIE Yxy chromaticity coordinates (Figure 11). The results showed that the actual primary fiber gamut was smaller than that of the ideal optical primaries. The painted primaries (red, yellow, green, etc.) occupied a smaller and slightly distorted locus in CIE space compared with the ideal primaries. This gamut contraction—driven by each fiber’s dye absorption and Mie scattering—had two implications. First, it limited the maximum saturation and shifted attainable hue angles, so targets H and S outside the measured fiber gamut cannot be realized in yarn form. Second, our grid-mixing model and neural networks must be trained on the measured reflectance spectra of real primaries, not theoretical values. By building the grid and training data from actual fiber spectra, the prediction models will operate within the true, physically attainable gamut, avoiding extrapolation into unmanufacturable color regions. In validation, prediction errors increased by up to ΔECMC 2:1 ≈ 1.5 as targets approach the gamut boundary, underscoring the importance of using realistic primaries for both mixing and prediction.

Figure 11.
Comparison of the gamut range of actual and optical primary color mixing.
Subsequently, spinning was performed on a numerical control rotor-spun machine (HFX-03-T) using parameters of 20,000 rpm rotor speed, 6000 rpm carding roller speed, 18 m/min guide roller speed, and 18.5 m/min winding roller speed. This resulted in yarns with a specification of 32 tex and 672 twists/m. Fiber feeding speeds were calculated based on the flow rates determined for each grid point, yielding 273 blended yarns. These yarns were then knitted into weft plain fabric using a HC21K knitting machine from Hongcheng Textile Machinery Electronics Co., Ltd., (Wuxi, China) with a course density of 102 loops/10 cm, wale density of 160 loops/10 cm, and loop length of 0.6 cm. The fabrics were then scanned using an HP LaserJet M1136 MFP scanner (HP Inc., Palo Alto, CA, USA, images uniformly cropped and combined, Figure 12), and measured with a YS6010 spectrophotometer from Shenzhen Threenh Technology Co., Ltd. (Shenzhen, China) under D65 illumination with 10° standard observer and 30 mm aperture. All reflectance measurements were conducted under the CIE D65 illuminant with a 10° observer and 30 mm aperture to ensure real-world relevance and robust data for our neural network models. D65 approximates average daylight, so the Lab* predictions reflect typical natural lighting. Full-spectrum (400–700 nm) measurements capture both diffuse reflectance and nonlinear Mie-scattering effects in fiber bundles. The large aperture averages over many fibers, reducing local inhomogeneities while preserving bulk color, and the D65/10° geometry provides high repeatability with minimal metameric shifts between the training and validation samples. By using this industry-standard reference frame, our color-prediction system rests on precise, repeatable measurements that represent the full-gamut blended yarns.
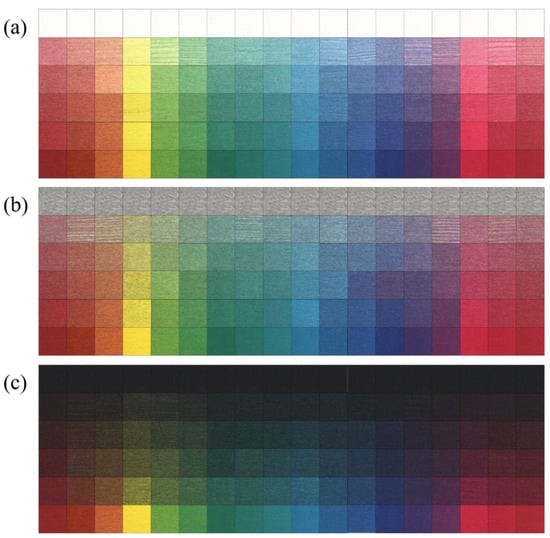
Figure 12.
The knitted fabrics of blended yarns (a) Equal lightness surface (j = 1), (b) Equal lightness surface (j = 6), (c) Equal lightness surface (j = 11).
For each fabric, five random areas were selected for measurement, and their average value was taken as the final data [31,32]. The color values of the 273 measured fabrics were organized into sequential color blocks to create a chromatogram, as illustrated in Figure 13.
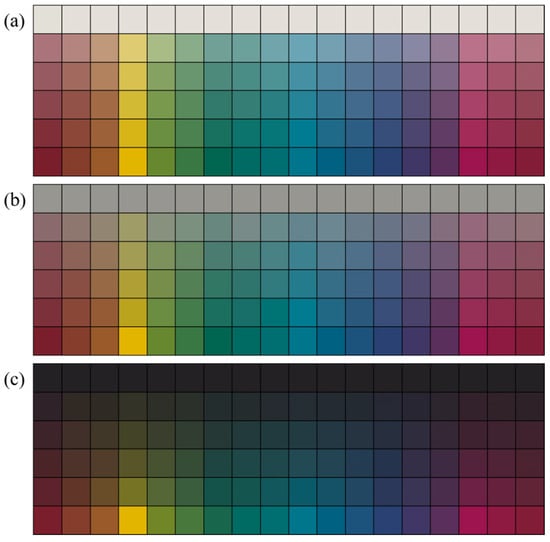
Figure 13.
Measured chromatogram of blended yarn knitted fabric (a) Equal lightness surface (j = 1), (b) Equal lightness surface (j = 6), (c) Equal lightness surface (j = 11).
2.3.2. Neural Network Color Value Prediction Model and Blending Ratio Prediction Model
To model the nonlinear mapping between fiber-blend ratios and yarn color, we adopted a modular, region-wise neural network framework (Figure 14 and Figure 15). The cylindrical color gamut is divided into six contiguous color-mixing regions, each using four primaries. For forward prediction, each region’s sub-model maps the four blend ratios (ωα, ωβ, ωγ, ωδ) to a 31-point reflectance spectrum (400–700 nm, 10 nm steps); for inverse prediction, the sub-models map a 31-element reflectance vector back to the four blend ratios. All twelve sub-models share the same architecture: two hidden layers with nine neurons each using logistic-sigmoid activations and a linear output layer. They were trained in MATLAB R2021a using the Levenberg–Marquardt algorithm. Nine neurons per hidden layer were chosen by cross-validation (tested with 6, 9, and 12 neurons) to balance expressivity and generalization. Logsig provides smooth, bounded nonlinearities and stable gradients, aiding convergence and robustness to spectral outliers, while Purelin yields unbounded reflectance outputs (which may exceed [0, 1]) and allows blend ratios to sum to one. Cross-validation showed the Logsig–Purelin pairing outperforms alternatives (e.g., tansig or purelin in hidden layers) in minimizing validation ΔE* and RMSE. For robust evaluation, we pooled 255 samples, shuffled with a fixed seed, and split 70/15/15 into training, validation, and test sets, reserving 18 additional hold-out samples for final assessment. This design achieved mean ΔECMC 2:1 < 1.0 and blend-ratio RMSE < 2% across all regions, confirming the efficacy of our full-gamut color-prediction approach.
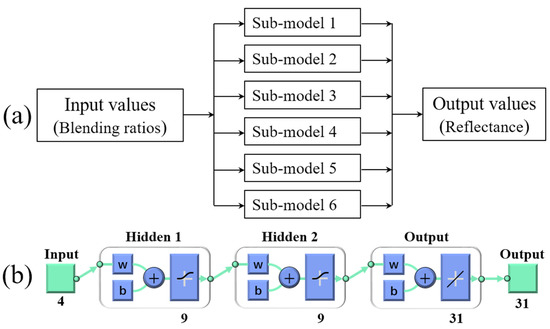
Figure 14.
The structure of color value prediction neural network model (a) main structure (b) structure of sub-model.
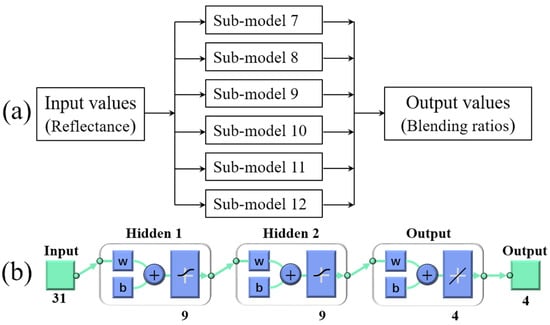
Figure 15.
The structure of blending ratios prediction neural network model (a) main structure (b) structure of sub-model.
3. Results and Discussion
3.1. Prediction of Color Values for Blended Yarns
The color prediction systemwas validated with reflectance and fiber blend ratio data from 18 validation samples. For each sample, its blending ratios were input into the corresponding neural network sub-model, and the predicted reflectance was compared with the measured reflectance (Figure 16), showing a strong correlation.
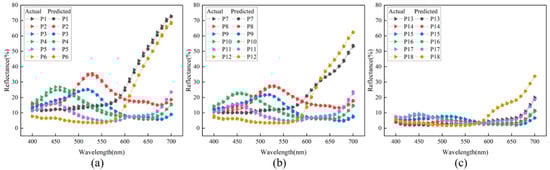
Figure 16.
Comparison of predicted reflectance and measured reflectance of validation samples (a) validation samples P1–P6, (b) validation samples P7–P12, (c) validation samples P13–P18.
These predicted reflectance values were then converted to L*a*b* color values using standard optical color theory and displayed as a color block (Figure 17) for visual comparison with the scanned fabric image. The prediction accuracy was quantitatively assessed using the ∆ECMC 2:1 color difference, calculated according to Equation (19), where ΔL* represents lightness difference, ΔC* chromatic difference, ΔH* hue difference, and , and are the weighting functions for lightness, chroma, and hue, respectively.
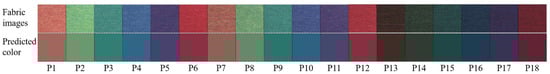
Figure 17.
Comparison of color prediction visual effects of validation samples.
As shown in Table 2, the average ∆ECMC 2:1 color difference for the 18 validation samples was 0.909, with a minimum of 0.175 and a maximum of 2.013. Importantly, 83.3% of the samples exhibited a color difference of less than 1.5, demonstrating the system’s effectiveness and accuracy in predicting the color of rotor-spun blended yarns.
Table 2.
Prediction results for color values of validation samples.
3.2. Prediction of Blending Ratio for Blended Yarns
To evaluate blending ratio prediction accuracy, reflectance data from 18 validation samples were input into the neural network system. Hue values in the LCH color space, derived from the reflectance data, identified the four primary color fibers for each sample. The corresponding sub-model then predicted the blending ratios. These predictions were refined by a filter that set any ratio between −1% and 1% to 0%, and then the remaining ratios were proportionally scaled to sum exactly to 100%. The result is the final predicted blending ratios for each sample.
This prediction accuracy was quantified using the Root Mean Square Error (RMSE), ERMSE, calculated as shown in Equation (20). Here, represent the actual blending ratios of the primary color fibers, while represent the predicted ratios.
Table 3 presents the ERMSE values for the predicted blending ratios of the 18 validation samples. The ERMSE ranged from a minimum of 0.27% to a maximum of 3.74%, with an average of 1.76%. This high accuracy demonstrates the system’s effectiveness in predicting the fiber blend ratios for rotor-spun blended yarns.
Table 3.
Prediction results for blending ratio of validation samples.
3.3. Prediction Accuracy for Different Color Mixing Regions
To further assess prediction accuracy, Figure 18 reports mean color differences for the six color-mixing regions: 1.297 (region 1), 1.050 (region 2), 0.622 (region 3), 0.546 (region 4), 1.346 (region 5), and 0.611 (region 6). The overall regional average was below 1.5, indicating generally accurate predictions. Ranking by accuracy: region 4 > region 6 > region 3 > region 2 > region 1 > region 5.
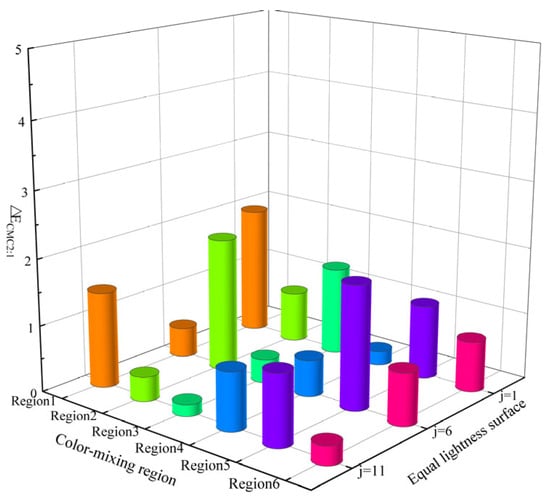
Figure 18.
Predicted color difference for different color-mixing regions.
A parallel analysis was conducted on the blending ratio prediction errors (Figure 19). The mean prediction errors for the validation samples by region were: 1.456% (region 1), 1.000% (region 2), 1.859% (region 3), 1.478% (region 4), 1.615% (region 5), and 0.802% (region 6). The overall regional average remained below 2%, confirming accurate blending ratio predictions. Ranking by accuracy: region 6 > region 2 > region 1 > region 4 > region 5 > region 3.
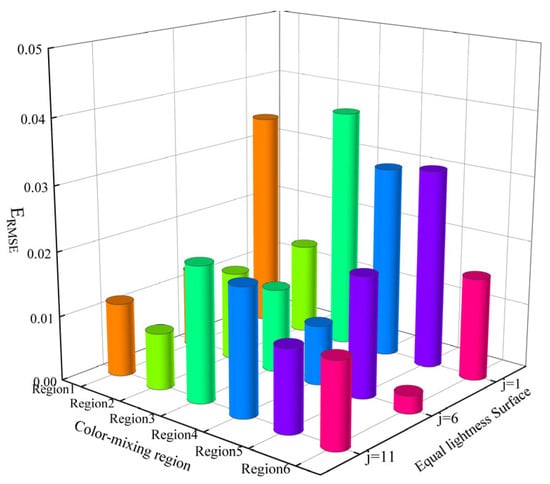
Figure 19.
Predicted blending ratio for different color-mixing regions.
These regional variations in prediction accuracy, though generally high, warrant further investigation. Despite consistent preparation and measurement conditions, factors such as color fusion and uniformity in blended yarns, the spatial distribution of color differences, and color-rendering variations among the primaries likely influenced the results. These factors will be addressed in future research.
4. Conclusions
This work delivers a unified, end-to-end technology for full-color-gamut spinning of blended yarns. We first present a cylindrical color-space grid-based mixing model that partitions the visible solid into six chromatic regions and maps any target RGB or Lab* coordinate to exact blend ratios of eight primary fibers. Using this model, we implement a three-element synergistic regulation mechanism on a three-channel NC rotor spinner to co-control fiber feed rates, linear density, and yarn color in real time, producing 273 yarn variants in a single run. We then design and train a modular neural network framework—twelve sub-models in total—for both forward (blend ratio → reflectance) and inverse (reflectance → blend ratio) prediction. Validated on 18 independent samples, the system achieves a mean ΔECMC 2:1 of 0.909 (83.3% of samples have ΔE < 1.5) and a blend-ratio RMSE of 1.76%, demonstrating high accuracy and practical viability.
Despite these significant achievements, several limitations warrant attention. (1) While the current experiments enhance the reliability of color reproduction by controlling factors such as fiber types, quality parameters, dyeing processes, spinning and knitting techniques, and color measurement conditions, perfect experimental reproducibility cannot be fully guaranteed. (2) The current sampling density—273 grid points across three discrete lightness levels—only covers a limited subset of the continuous color space. Although our training strategy aims to achieve robust interpolation along the entire lightness axis, the model’s prediction accuracy for unmeasured intermediate lightness values has not been explicitly validated using an independent experimental dataset. (3) A purely empirical “black-box” approach has inherent limitations. Although effective, such models are not explicitly constrained by the underlying physical laws of color science, which may compromise robustness during extrapolation and could lead to predictions that violate physical principles.
Based on these considerations, future research should focus on the following directions. (1) Establishing more standardized protocols for material pretreatment and characterization to achieve fully reproducible results across different laboratories. (2) Conducting denser sampling along the L* dimension and visualize the performance in “gap” regions between training surfaces using 3D Lab color maps, which will provide definitive validation of the model’s generalization capability. (3) The most critical and promising direction for future work lies in developing a hybrid Physics-Informed Neural Network (PINN) architecture. This advanced framework can be implemented through several synergistic strategies: one approach involves incorporating known physical constraints—such as the conservation law requiring blend ratios to sum to unity, or boundary conditions ensuring reflectance values remain within the physical range of [0, 1]—as regularization terms in the network’s loss function. A more sophisticated implementation could employ a foundational physical model to predict baseline reflectance, with the neural network trained to capture complex nonlinear residuals. By embedding physical knowledge, the model can achieve not only high accuracy but also inherent plausibility and generalizability. Ultimately, by developing closed-loop control strategies that integrate real-time spectral feedback with adaptive fiber feeding, fully automated, waste-free, full-gamut yarn production at an industrial scale can be realized.
Author Contributions
Conceptualization, Y.X. and W.Z.; methodology, W.Z. and P.C.; software, W.Z.; validation, W.Z., Y.X. and P.C.; formal analysis, P.C. and W.Z.; investigation, W.Z. and Y.X.; resources, Y.C. and Y.X.; data curation, W.Z.; writing—original draft preparation, W.Z., Y.X. and P.C.; writing—review and editing, W.Z. and Y.C.; visualization, W.Z.; supervision, Y.X.; project administration, Y.X.; funding acquisition, Y.X., Y.C. and P.C. All authors have read and agreed to the published version of the manuscript.
Funding
This research was funded by “Jian Bing” and “Ling Yan” Research Fund in Zhejiang Province (2022C01188); Key Research and Development Program of Ningbo City (20232ZDYF020042); Fujian Provincial Engineering Technology Research Center of Industrial Design and Intelligent Manufacturing (PT25002 and GCZX202502); Intelligent Textile Technology and Flexible Manufacturing Innovation Team under Quanzhou City’s High-Level Talent Introduction Program (2024CT019).
Institutional Review Board Statement
Not applicable.
Data Availability Statement
The original contributions presented in this study are included in the article. Further inquiries can be directed to the corresponding authors.
Acknowledgments
We gratefully acknowledge the support from the “Jian Bing” and “Ling Yan” Research Fund in Zhejiang Province (2022C01188) and the Key Research and Development Program of Ningbo City (20232ZDYF020042). We also thank the Fujian Provincial Engineering Technology Research Center of Industrial Design and Intelligent Manufacturing (Grant Nos. PT25002 and GCZX202502) and the Intelligent Textile Technology and Flexible Manufacturing Innovation Team under Quanzhou City’s High-Level Talent Introduction Program (Grant No. 2024CT019) for their invaluable support in this project.
Conflicts of Interest
Author Yourong Chen is employed by Zhejiang Taitan Co., Ltd. The remaining authors declare that the research was conducted in the absence of any commercial or financial relationships that could be construed as a potential conflict of interest.
References
- Kim, E.; Kim, S.U.; Lee, J.C.; Jeong, M.; Kim, J.Y. Non-contact resistance prediction of SWCNT-coated conductive fabrics with color variations using residual neural network. Processes 2025, 13, 959. [Google Scholar] [CrossRef]
- Jasper, W.J.; Jasper, S.M. A controlled study on machine learning applications to predict dry fabric color from wet samples: Influences of dye concentration and squeeze pressure. Fibers 2025, 13, 47. [Google Scholar] [CrossRef]
- Haji, A.; Vadood, M.; Öztürk, M.; Yigit, I.; Eren, S.; Eren, H.A. Prediction of colour strength in environmentally-friendly dyeing of polyester fabric with madder using supercritical carbon dioxide. Color. Technol. 2025, 141, 44–53. [Google Scholar] [CrossRef]
- Cao, Q.; Zheng, G.; Yu, C. Study on the relationship between blending uniformity and yarn performance of blended yarn. Text. Res. J. 2025, 95, 893–903. [Google Scholar] [CrossRef]
- Li, L.; Zhang, Y.; Shi, Q.; Wang, J. Investigation into the effect of the blend ratio on the structure and properties of dual-feed-opening rotor-spun yarn. Text. Res. J. 2024, 94, 918–930. [Google Scholar] [CrossRef]
- Cao, Q.; Zhou, Y.; Yu, C. Application of image processing technology on testing blending ratio and blending irregularity of blended yarns. Text. Res. J. 2023, 93, 3945–3955. [Google Scholar] [CrossRef]
- Zhu, W.; Xue, Y.; Xue, J.; Sun, X.; Jin, G. Research on full-colour gamut matching of wool blended yarn based on the Kubelka–Munk prediction algorithm. Color. Technol. 2025, 141, 386–404. [Google Scholar] [CrossRef]
- Sun, X.; Xue, Y.; Liu, Y.; Zhang, G.; Liu, L.; Wang, L. Construction of circular-shaped chromatic model and spinning of full-color gamut colored yarn by digital blending of three primary colored fibers. Text. Res. J. 2023, 93, 140–160. [Google Scholar] [CrossRef]
- Li, J.; Xue, Y.; Chen, Y.; Griesshammer, C.; Cui, P. Yarn Formation Mechanism and Application of Rotor Spinning Wide-Color Gamut-Blended Yarn for Ostwald Color Solid. J. Nat. Fibers 2025, 22, 2506785. [Google Scholar] [CrossRef]
- Zhu, W.; Xue, Y.; Chen, Y. Color mixture model of seven primary color fiber grid blending and rotor spinning of full-color gamut mixed color yarn. Text. Res. J. 2023, 93, 4053–4067. [Google Scholar] [CrossRef]
- Chaouch, S.; Moussa, A.; Ladhari, N. Textile color formulation methods: A literature review. Color. Res. Appl. 2025, 50, 72–93. [Google Scholar] [CrossRef]
- Wei, C.; Xie, D.; Wan, X.; Liu, S.; Li, J. A novel correction method of Kubelka–Munk model for color prediction of pre-colored fiber blends. Fibers Polym. 2024, 25, 2139–2148. [Google Scholar] [CrossRef]
- Sarwar, A.; Jabbar, A.; Riaz, S.; Malik, M.I. Sustainable dyeing of chemically modified cotton fabric with reactive dyes in acidic condition. Cellulose 2024, 31, 4025–4041. [Google Scholar] [CrossRef]
- Wang, Y.; Zhao, T.; Bi, X.; Lv, C. Synthesis of novel carbene dyes and investigation of their dyeing properties and reaction mechanism for various fabrics. Dye. Pigment. 2024, 221, 111784. [Google Scholar] [CrossRef]
- Wu, M.; Sun, X.; Lu, Z.; Chen, Y.; Zhang, Y.; Zhang, Q. Optimized combined spectral calibration model based on single-constant Kubelka–Munk theory for color prediction of pre-colored cotton fiber blends. Text. Res. J. 2024, 94, 1083–1095. [Google Scholar] [CrossRef]
- Wei, C.A.; Li, M.; Liu, S.; Xie, D.; Li, J. Using the single-constant Kubelka–Munk model for surface color prediction of pre-colored fiber blends. Coatings 2024, 14, 948. [Google Scholar] [CrossRef]
- Wu, M.; Lu, Z.; Hu, H.; Chen, Y.; Sun, X. Modified addition theorem on Kubelka-Munk transmission law for mass prediction of each primary in two-mixed cotton fiber blends. Text. Res. J. 2024, 94, 989–1001. [Google Scholar] [CrossRef]
- Balakrishnan, N.K.; Siebert, S.; Richter, C.; Groten, R.; Seide, G. Effect of colorants and process parameters on the properties of dope-dyed polylactic acid multifilament yarns. Polymers 2022, 14, 5021. [Google Scholar] [CrossRef]
- Wang, Y.; Chen, G.; Li, W.; Gan, X.; Wang, J. Reflectance model for filament yarn composed of different color monofilaments. J. Text. Inst. 2021, 112, 2039–2047. [Google Scholar] [CrossRef]
- Sun, X.; Xue, Y.; Liu, Y.; Zhang, G.; Liu, L.; Wang, L. Research on full-color gamut mixing model constructed by CNC spinning and Stearns-Noechel color prediction method. Text. Res. J. 2023, 93, 1358–1370. [Google Scholar] [CrossRef]
- Zhang, G.; Zhou, J.; Pan, R.; Wang, L.; Gao, W. Color prediction for pre-colored cotton fiber blends based on improved Kubelka-Munk double-constant theory. Fiber Polym. 2021, 22, 412–420. [Google Scholar] [CrossRef]
- Liu, Z.; Fan, S.; Liu, S.L.; Zhao, A.R.; Liu, L. Research on Prediction of Pigment Concentration in Color Painting Based on BOA-FRNN Spectral Model. Spectrosc. Spectr. Anal. 2025, 45, 322–331. [Google Scholar]
- Vadood, M.; Haji, A. Prediction of Color Coordinates of Polyester Fabrics Dyed with Madder Using Mamdani-Fuzzy Logic and Optimization Algorithm. Fibers Polym. 2025, 26, 3463–3472. [Google Scholar] [CrossRef]
- He, Z.; Tan, Y.; Li, S. A new CNN deep learning model for computer-intelligent color matching. Nonlinear Eng. 2025, 14, 20250098. [Google Scholar] [CrossRef]
- Zhu, W.; Xue, Y.; Chen, Y. Construction of a full color gamut color mixture model and a color prediction neural network model for rotor spinning melange yarn. J. Text. Inst. 2024, 116, 1603–1615. [Google Scholar] [CrossRef]
- Sun, X.; Xue, Y.; Liu, Y.; Wang, L.; Liu, L. Neuronal network algorithm towards color model of full color gamut yarn and its color prediction research. Text. Res. J. 2023, 93, 2694–2707. [Google Scholar] [CrossRef]
- Zhu, W.; Xue, Y.; Wang, Y.; Chen, Y.; Chen, G. Research on the construction of a full-color gamut color mixing model and Friele color prediction algorithm for rotor spinning. Text. Res. J. 2025. [Google Scholar] [CrossRef]
- Zhao, Z.; Wang, Z.; Yuan, J.; Ma, J.; He, Z.; Xu, Y.; Shen, X.; Zhu, L. Development of a novel feedforward neural network model based on controllable parameters for predicting effluent total nitrogen. Engineering 2021, 7, 195–202. [Google Scholar] [CrossRef]
- Şahin, C.; Balcı, O.; Işık, M.; Gökenç, İ. Artificial neural networks approach for prediction of CIELab values for yarn after dyeing and finishing process. J. Text. Inst. 2022, 114, 1326–1335. [Google Scholar] [CrossRef]
- Vadood, M.; Haji, A. Modeling the color coordinates of cotton fabric dyed with natural dyes using Sugeno-multi optimization approach. J. Text. Inst. 2025. [Google Scholar] [CrossRef]
- Atav, R.; Karagöz, G.; Ergünay, U. Enzymatic coloration of wool fabrics and its comparison with conventional dyeing. Color. Technol. 2025, 141, 305–324. [Google Scholar] [CrossRef]
- Li, H.C.; Wang, L.K.; Chang, Y.K.; Huang, K.Y. Establishing colour harmony evaluation and recommendation model for clothing colour matching based on machine learning and deep learning. Fash. Text. 2025, 12, 27. [Google Scholar] [CrossRef]
Disclaimer/Publisher’s Note: The statements, opinions and data contained in all publications are solely those of the individual author(s) and contributor(s) and not of MDPI and/or the editor(s). MDPI and/or the editor(s) disclaim responsibility for any injury to people or property resulting from any ideas, methods, instructions or products referred to in the content. |
© 2025 by the authors. Licensee MDPI, Basel, Switzerland. This article is an open access article distributed under the terms and conditions of the Creative Commons Attribution (CC BY) license (https://creativecommons.org/licenses/by/4.0/).