Abstract
Detecting chemical residues on surfaces is critical in environmental monitoring, industrial hygiene, public health, and incident management after chemical releases. Compounds such as acrylonitrile (ACN) and tetraethylguanidine (TEG), widely used in chemical processes, can pose risks upon residual exposure. Hyperspectral imaging (HSI), a high-resolution, non-destructive method, offers a secure and effective solution to identify and spatially map chemical contaminants based on spectral signatures. In this study, we present an HSI-based framework to detect and differentiate ACN and TEG residues on textile surfaces. High-resolution spectral data were collected from three representative textiles using a hyperspectral camera operating in the short-wave infrared range. The spectral datasets were processed using standard normal variate transformation, Savitzky–Golay filtering, and principal component analysis to enhance contrast and identify material-specific features. The results demonstrate the effectiveness of this approach in resolving spectral differences corresponding to distinct chemical residues and concentrations but also provide a practical and scalable method for detecting chemical contaminants in consumer and industrial textile materials, supporting reliable residue assessment and holding promise for broader applications in safety-critical fields.
1. Introduction
Chemical residues on textiles are a significant concern in industrial production, public health, disaster and incident response, and environmental safety. These residues may result from chemical processing steps such as dyeing or the use of additives, and can include volatile organic compounds, surfactants, antimicrobials, pesticides, and cleaning agents. They can also originate from chemical incidents during accidental or deliberate releases of substances in the environment affecting persons and their clothing. Detecting and controlling such residues is critical to meeting regulatory requirements and consumer safety standards such as OEKO-TEX® and REACH [1,2]. In incident management involving CBRN (chemical, biological, radiological, and nuclear) substances, screening affected persons or surfaces and determining whether someone or something is contaminated are crucial for an effective response.
So far, technologies and procedures are only established for radiological contamination. Conventional analytical methods, including gas chromatography-mass spectrometry (GC–MS), liquid chromatography (HPLC), and Fourier-transform infrared spectroscopy (FTIR), provide high sensitivity and specificity but are often labour-intensive, time-consuming, and require sample destruction [3,4]. In incident response, concerning contaminated persons (clothing and or skin), fast, real-time, non-destructive approaches are required. These limitations have prompted the exploration of alternative technologies that allow rapid, non-destructive, and large-area in situ analysis.
Acrylonitrile (ACN) is widely used in the production of synthetic fibres such as acrylics, as well as in resins, plastics, and rubber manufacturing. Residual ACN may be present in textiles due to incomplete polymerization processes or contamination during handling, and it is classified as a probable human carcinogen (IARC Group 2B), with both acute and chronic exposure risks. N,N,N′,N′-Tetraethylguanidine (TEG) is used as a strong organic base and catalyst in polymer processing and textile finishing. Residual TEG may occur from its application in industrial textile treatment processes, and it poses hazards due to its corrosive properties and potential for causing skin and respiratory irritation. Both compounds have been documented in environmental and occupational exposure incidents, making them relevant and representative chemical hazards for residue detection on textiles.
Hyperspectral imaging (HSI) has emerged as a powerful tool covering those aspects. HSI integrates imaging and spectroscopy by capturing spatial and spectral data across a broad wavelength range for each pixel in an image. This results in a hyperspectral data cube that provides detailed chemical and structural information, making it well-suited for detecting and mapping residues on textile surfaces [5,6]. In particular, the shortwave infrared (SWIR) range (1000–2500 nm) is sensitive to overtone and combination vibrations of C–H, N–H, and O–H functional groups, which are commonly present in organic chemicals [7]. One of the key strengths of HSI is its capacity for non-destructive, label-free detection, enabling real-time assessments without altering the sample, while also facilitating spatially resolved measurements. It has proven particularly effective in differentiating materials with subtle chemical or physical differences, which makes it ideal for complex and heterogeneous samples such as textiles [8]. As a result, HSI has been widely adopted in sectors ranging from agriculture and food safety to forensics and stand-off detection for chemical warfare agents [9,10,11,12,13]. Recent sensor technology, data processing, and machine learning advances have further propelled HSI into industrial applications. Innovations such as miniaturized sensors, faster acquisition speeds, and integrated chemometric toolkits have improved their suitability for on-site deployment and high-throughput screening [14].
In the context of textiles, HSI has been utilized not only for detecting chemical residues but also for classifying fibre types, assessing fabric quality, and monitoring wear or degradation [15,16,17,18]. Huang et al. (2022) demonstrated that HSI combined with deep learning could achieve accurate fibre classification even in blended and coloured fabrics [15]. Sioma (2023) reported on integrating HSI into automated recycling systems for sorting textiles based on spectral fingerprints [17]. Ktash et al. (2023) successfully applied UV-HSI to detect agricultural residue contamination on cotton samples [14]. These and similar studies affirm the versatility and reliability of HSI in addressing modern challenges in textile monitoring.
In this study, the application of HSI is extended to the application of HSI to the non-destructive detection of ACN and TEG as representative chemical residues on textiles. Using a SWIR hyperspectral camera and chemometric tools such as standard normal variate (SNV) correction, Savitzky–Golay filtering, and principal component analysis (PCA), we explore how different textile materials influence residue detection and how spectral signatures correlate with chemical concentration. This approach builds on the expanding use of HSI as a practical solution for monitoring chemical cleanliness in the textile industry.
2. Materials and Methods
2.1. Textiles
Three textiles were selected for this study to reflect common leisurewear materials in the European Union [19]. The textiles comprised 100% cotton (designated as “Textile A”), a blend of 95% cotton with 5% elastane (referred to as “Textile B”), and 100% polyester (identified as “Textile C”).
2.2. Chemical Substances
The chemicals Acrylonitrile (ACN) (grade ≥ 99%) was purchased from Sigma Aldrich Burlington, MA, USA, and N,N,N′,N′-Tetraethylguanidin (TEG; >95% purity) was purchased from CymitQuímica S.L., 08018 Barcelona, Spain.
2.3. Infinite Focus Microscopic (IFM) Imaging Data Collection
Imaging measurements were conducted using a focus-variation light microscope, specifically the Infinite Focus G4 (Alicona, Graz, Austria), in conjunction with the IFM 3.5.1.5 x 64 software. This methodology, known for its precision, involved constructing detailed 3-D surface models from a series of captured images, allowing for the precise calculation of x, y, and z co-ordinates within the scan’s defined resolution. For this comprehensive study, three textile samples (A, B, and C) were thoroughly analyzed utilizing a 5× objective lens. This approach provided a vertical resolution of 4 µm and a lateral resolution of 8 µm, facilitating the development of an accurate 3-D model. In addition, high precision 2-D optical micrographs were taken with the same parameter set.
2.4. Scanning Electron Microscopy
Scanning electron microscopy (SEM) was performed on an Axia ChemiSEM (Thermo Fischer Scientific Inc., Waltham, MA, USA) using xTm 27.3. software. Both LVD (secondary electrons) and CBS (backscatter electrons) detectors were used in low-vacuum mode to obtain images at 200× magnification with 2 or 5 kV acceleration voltage.
2.5. Imaging Data Processing and Analysis
Data processing and image assembly were conducted using IFM 3.5.1.5 x 64 software (Alicona, Graz, Austria). A 3-D surface was generated from the image stack in IFM-MeasureSuite 4.0.2.1 (Alicona, Graz, Austria) using a data reduction with a sampling interval factor of 2. The assembled 3-D images were also directly compared with optical images captured from the same textiles.
2.6. Hyperspectral Imaging
The SWIR spectra were obtained using the “Snapscan” Hyperspectral Camera (Imec GmbH, Leuven, Belgium) with 107 spectral bands and a spectral range of 1100–1700 nm. The camera has a 512 (H) × 640 (W) pixel InGaAs Sensor installed with a stepped filter design (step sizes 1 to 4 pixels per spectral band). The stepped Fabry–Perot filters allow for faster data acquisition, avoiding cross-talk between bands at larger step sizes and improving data quality at smaller step sizes. Each filter is a narrow band filter with a full-width half maximum between 10 and 15 nm. During acquisition, the sensor is moved internally within the camera housing to sequentially capture different spectral bands, eliminating the need to move either the camera or the specimen. Hence, neither the camera nor the specimen must be moved during data acquisition. Integrated active cooling technology further facilitates data acquisition with a high S/N ratio (up to 600:1). The Imec snapscan software (v1.8.1.1) features built-in white balancing of a scanned white reference target and automated aquicision of the dark reference with the installed mechanical shutter. The software was used for data acquisition and extraction in ENVI format.
The setup, including the 50 mm/F2.15 SWIR lens (Edmund Optics Inc., Barrington, NJ, USA) and the halogen lamps (OSRAM GmbH, Munich, Germany, 2800 K), can be seen in Figure 1.

Figure 1.
The experimental setup, featuring the 50 mm/F2.15 SWIR lens (Edmund Optics Inc.) and the halogen lamps (OSRAM GmbH, 2800 K) with representative textile specimens.
The applied measurement parameters are listed in Table 1, which yield a total acquisition time of 12.44 s per image. All measurements were therefore completed in less than 13 s after droplet placement, to avoid the evaporation of substances.

Table 1.
Applied measurement parameters in Imec Snapscan software (v1.8.1.1).
2.7. Experimental Procedure
Diluted solutions of ACN and TEG in isopropanol were prepared at concentrations of 10%, 20%, 40%, 60%, and 80% of the respective substance. In addition, measurements of the pure model substances and isopropanol on textiles were performed. Immediately before the data acquisition, 10 µL of the respective solution was applied to the textile with a calibrated pipette. Two textile samples of each type were collected for analysis. The 10 µL of each solution was applied to the textile samples just before measurement to ensure consistency and control during data acquisition. Two separate measurements were performed per concentration. To assess reproducibility, the relative standard deviation (RSD) of replicate spectra was calculated within defined spectral regions of interest, complemented by peak-to-trough variability as an amplitude-based metric (Supplementary Table S1). For reference measurements of textile wetting behaviour, 10 µL droplets of isopropanol were deposited onto the textile samples. After full absorption, the final wetted area was documented for each textile type (see Supplementary Figure S1), and the wetting process was visualized in Supplementary Video S1.
2.8. Data Analysis
Hypercubes were first loaded into MATLAB (MATLAB Version: 24.1.0.2628055 (R2024a) Update 4, Natick, MA, USA: The MathWorks Inc.) as ENVI-files, and a wavelength vector was created in the workspace. Further analysis was conducted using the Hyper-Tools3 software add-on, a MATLAB-based graphical user interface (GUI) for HSI analysis. Hyper-Tools3 combines spectral and spatial preprocessing with chemometric tools (exploratory data analysis, clustering, regression, and classification) and provides advanced visualization, multi-image support, and an intuitive interface [5,6]. The following data processing steps were carried out:
- Spatial binning (Sub-window: 5) to enhance the signal-to-noise-ratio (SNR) by combining neighbouring pixels. This process improves image quality while slightly reducing spatial resolution.
- Standard normal variate (SNV) to remove baseline shifts and scatter effects as well as to improve spectral data consistency for further analysis.
- Smoothing using a Savitzky–Golay filter (window (odd number): 5, polynomial degree: 2).
- Computing the first derivative using a Savitzky–Golay filter (window (odd number): 7, polynomial degree: 2, derivative degree: 1).
- PCA using single-value decomposition (SVD).
To assess reproducibility, the relative standard deviation (RSD) of replicate spectra was calculated within defined spectral regions of interest. In addition, peak-to-trough variability was determined as an amplitude-based metric. PCA was applied separately for each textile-substance combination, and score density plots were generated from the PC’s, which provided the clearest separation between uncontaminated textiles and contaminated regions, as visually identified.
3. Results
In this study, the suitability of HSI for detecting ACN and TEG on textiles was assessed. The experimental workflow for HSI data acquisition and analysis is illustrated in Figure 2. It outlines the sequence from droplet application and data collection to preprocessing and multivariate evaluation, providing the systematic basis for subsequent analysis.
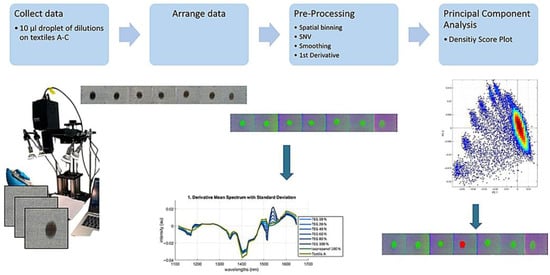
Figure 2.
Workflow for hyperspectral data collection and analysis. Hyperspectral images were captured immediately (within 13 s) of applying 10 µL droplets onto textiles A, B, and C. Data were arranged according to concentration levels using the HYPER-Tools3 Matlab tool. Preprocessing steps included spatial binning, SNV transformation, smoothing, and first derivative calculation. Spectra are then collected from the ROI and the uncontaminated textile areas. PCA was then performed, and results were visualized as score–density plots.
Duplicate measurements demonstrated high reproducibility, with mean RSD values typically between 0.2% and 3% (with two cases up to ~5%). Peak-to-trough differences were similarly small, confirming the robustness of the HSI measurements.
Optical microscopy, IFM, and SEM were employed to analyze weave patterns, fibre distribution, and surface topography (see Figure 3).
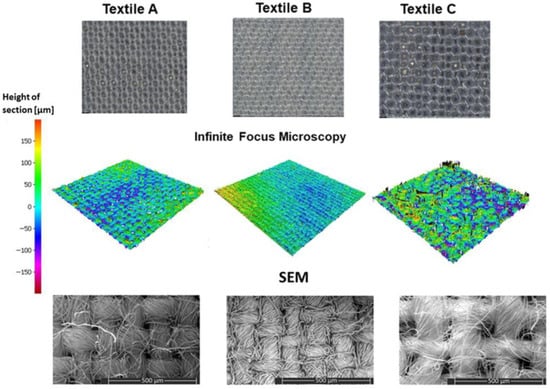
Figure 3.
Multiscale imaging analysis of textile samples A–C using optical microscopy (top row), IFM (middle row), and SEM (bottom row). Spectroscopic and chemometric characterization.
The optical micrographs in the first row of Figure 3 show differences in fabric density and weave structure. Textile B exhibits the finest structure, with tightly packed fibres forming a dense surface. Textile C shows a coarser architecture with a looser weave pattern and more pronounced gaps between fibres. Textile A presents similarities to Textile C. Textiles A and C follow a plain weave pattern, whereas Textile B adopts a satin-like weave.
The IFM topographies in the middle row of Figure 3 illustrate variations in roughness and homogeneity. Textile C displays pronounced surface irregularities with large deflections and individual fibres. Textile B exhibits a smooth and consistent surface Textile A presents intermediate roughness. SEM imaging in the bottom row of Figure 3 provides high-resolution images of fibre morphology and inter-fibre connectivity. Textile B shows a tightly structured fibre network with densely packed filaments, while Textile C displays loosely arranged fibres and visible interstitial spaces. Textile A appears intermediate, resembling textile C in overall structure. As depicted in Figure 3, these imaging modalities provide a detailed multiscale characterization of textile fabrics, illustrating how weave type, fibre density, and topographical variations contribute to their structural properties.
This is an exploratory work to examine the potential of HSI for detecting the presence of ACN and TEG s on three types of textiles (A, B, and C). The recorded mean spectra of the uncontaminated textile are shown in Figure 4a (top). Textiles A and B display a flat plateau around 1 a.u. up to approximately 1400 nm, followed by a moderate decrease at 1500 nm, and then an upward trend. Textile C shows a lower plateau of ~0.3 a.u. extending up to ~1600 nm, followed by a drop at ~1680 nm. Textile C also exhibits the widest spread in spectral values, as indicated by its larger standard deviation (SD)The spectra of pure ACN and TEG, together with their first derivatives, are presented in Figure 4a (bottom). To obtain spectra of the respective chemical characteristics, 10 µL droplets of each chemical were applied on a glazed white tile to avoid any changes in the measurements caused by chemical interactions. ACN shows a relatively flat spectral profile between 1100 and 1400 nm, followed by a decline with a distinct feature between 1600 and 1700 nm. TEG displays stronger variation across the full range, including depressions around 1200–1250 nm and a pronounced trough near 1500 nm. The derivative spectra further accentuate these differences.
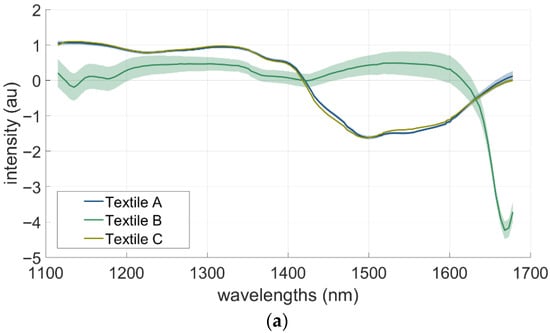
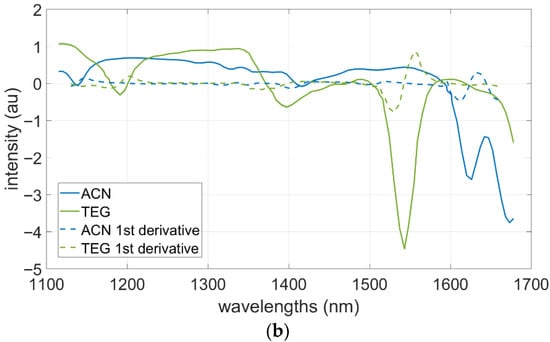
Figure 4.
(a). Mean spectra with standard deviations for uncontaminated textiles A–C (top panel) and the isolated chemicals TEG and acrylonitrile on a white glazed tile with the respective first derivation (bottom panel). (b). First derivative of mean spectra with standard deviations TEG (top panel) and acrylonitrile (bottom panel) after several time intervals. The times thereby indicate the respective time between application and start of measurement.
To further establish the timeframe for potential detection of ACN and TEG, 10 µL droplets of each chemical were applied again on a glazed white tile and measurements were taken after several time intervals. Figure 4b, shows the resulting time dependencies of the spectral features for TEG (top panel) and ACN (bottom panel). TEG features remained detectable after 30 min for TEG, whereas ACN features were no longer detectable after 30 s.
The processed spectral data after SNV, smoothing, and first derivative are shown in Figure 5. For ACN, the most pronounced changes occur between 1570 and 1650 nm in Textiles A and B and between 1570 and 1610 nm in Textile C. Similarly, the spectral response to TEG shows absorption features across the textiles, with characteristic spectral bands in the 1470 to 1570 nm range. For Textiles A and B, these informative bands fall within their general region of maximum absorbance (1400–1650 nm). Although the baseline absorbance of these two fabrics is lower than that of Textile C (see Figure 4a), the TEG-specific features remain clearly distinguishable across all textiles.

Figure 5.
First derivation of mean spectra with standard deviations resulting from HSI after SNV transformation, smoothing for acrylonitrile and TEG on different textiles (A–C).
Figure 6 and Figure 7 show region of interest (ROI)-focused first-derivative mean spectra (±1 SD) from HSI after SNV transformation and smoothing for Textile A (panel A) and Textile C (panel B) at 10%, 60%, and 100% nominal concentration and as well as for pure isopropanol (=0% ACN). For ACN (Figure 6), Textile A exhibits a broad feature within 1570–1650 nm with a local maximum near 1600–1610 nm and a shoulder at ~1580–1595 nm. Textile C shows a minimum near ~1600–1610 nm. In both textiles, spectral amplitude varies with concentration. For TEG (Figure 7), both textiles exhibit features between 1470 and 1570 nm with a local minimum near 1510–1520 nm and a local maximum near ~1535–1545 nm. Amplitude varies across concentrations, while band positions remain stable.

Figure 6.
Mean spectra with standard deviations resulting from HSI after SNV transformation, smoothing and first derivative for acrylonitrile on Textile A (panel A) and Textile C (panel B). Four concentration levels are shown (0% = 100% isopropanol, 10%, 60%, 100% ACN), focusing on the relevant region of interest.
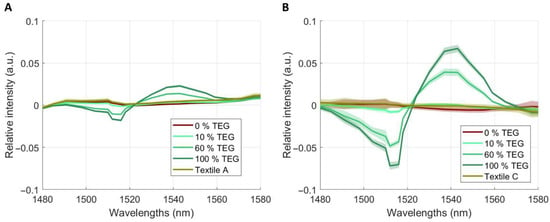
Figure 7.
Mean spectra with standard deviations resulting from HSI after SNV transformation, smoothing and first derivative for TEG on Textile A (panel A) and Textile C (panel B). Four concentration levels are shown (0% = 100% isopropanol, 10%, 60%, 100% TEG), focusing on the relevant region of interest.
Principal Component Analysis
PCA was conducted separately for each textile-substance combination to determine the clustering behaviour of the textiles upon chemical exposure. The PCA score density plots in Figure 8, Figure 9 and Figure 10 illustrate distinct groupings based on textile type and concentration level, reflecting how their spectral responses vary after contamination.
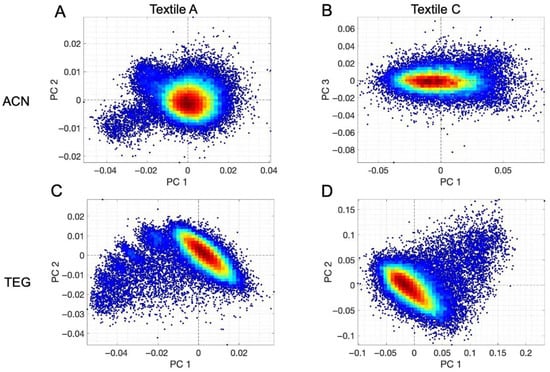
Figure 8.
PCA Score Density Plots for dilutions of acrylonitrile and TEG, respectively, with isopropanol across two textiles. Representations of the PCA as Score Density Plots of ACN for the following: (A): textile A as PC1 and PC2; (B): textile C as PC1 und PC3. Representation of the PCA as Score Density Plots of TEG for the following: (C): textile A as PC1 and PC2; (D): textile C as PC1 and PC2.
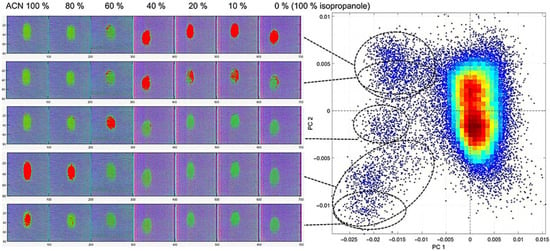
Figure 9.
Density score plot of PC1 and PC2 from PCA of acrylonitrile on textile B, with corresponding cluster regions highlighted in red in false-coloured hyperspectral images. The ACN dilution series ranges from 100% ACN to 0% ACN (=100% isopropanol), with isopropanol as the diluting agent.
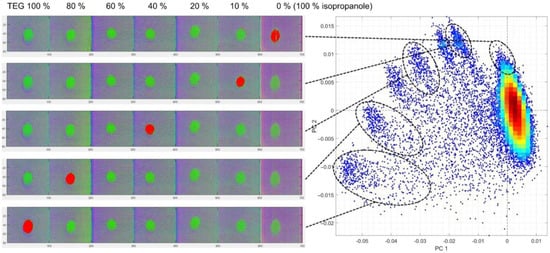
Figure 10.
Density score plot of PC1 and PC2 from PCA of TEG on textile B, with corresponding cluster regions highlighted in red in false-coloured hyperspectral images. The TEG dilution series ranges from 100% to 0% TEG (=100% isopropanol), with isopropanol as the diluting agent.
For ACN, Textiles A and B display distinct and well-defined clustering in PC1 and PC2 space. In contrast, Textile C exhibits a less pronounced clustering pattern with separation in PC1 and PC3For TEG (Figure 8C,D and Figure 10), more consistent clustering patterns were observed, with contaminated textiles exhibiting concentration-dependent clustering patterns based on their absorption behaviour.
Hyperspectral false-colour imaging was employed to visualize chemical distribution at different dilution levels to provide a spatial representation across the textiles. Figure 9 shows ACN applied to Textile B across concentrations from 100% to 10% as well as for 100% isopropanol to enable distinction to the diluting agent. The PCA clustering plot on the right illustrates distinct and well-separated clusters that correspond to increasing dilution levels of ACN.
Figure 10 presents the false-coloured HSI results for TEG interaction with Textile B, revealing a particularly strong and well-defined dilution-dependent clustering effect. Compared with ACN, TEG produced clearer separation across all concentration levels.
4. Discussion
This study demonstrates the potential of HSI in detecting and differentiating chemical residues, specifically ACN and TEG, on textiles with varying structural properties. By combining HSI with IFM and SEM, a comprehensive view was obtained of how surface morphology and fibre architecture influence chemical detectability. While the chemometric sequence combining SNV, Savitzky–Golay filtering, and PCA is widely established in hyperspectral imaging research, the novelty of this work lies in applying it to the detection of hazardous industrial agents such as ACN and TEG on textiles in a safety-critical context, despite their differing volatility and textile-dependent absorption behaviour, and in combining SWIR-HSI with high-resolution structural imaging to directly link textile morphology with spectral detectability. Although the preprocessing and PCA methods are standard, their targeted use under strict timing constraints (≤13 s post-application) and for high-volatility substances represents an innovative real-world application scenario not previously explored in this detail. This distinguishes the present study from prior work such as [14] which used UV-HSI for honeydew contamination detection in cotton, by targeting chemical hazard agents, employing a different spectral regime (UV), and integrating structural–spectral correlation for improved interpretability.
Structural differences were evident in Figure 3: Textile C exhibited a visibly coarser weave with wider inter-fibre gaps, whereas Textiles A and B presented finer, more uniform architectures. IFM confirmed these differences, showing greater surface irregularity and variability in height profile for Textile C. SEM images further revealed tightly packed and organized fibre networks in Textiles A and B, with Textile B appearing the most homogeneous. These surface characteristics directly influence the reproducibility and clarity of the spectral signals.
The mean spectra of the uncontaminated textiles (Figure 4a) underline these effects: Textiles A and B displayed nearly identical absorbance profiles with low variability. Textile C showed higher spectral variability, with a larger standard deviation and increased absorbance, particularly beyond 1600 nm. This can be attributed to both its coarse fibre structure and material composition (polyester), which differ from the cotton-based blends used in Textiles A and B.
After chemical application, distinct textile-specific spectral responses were observed. ACN produced its most informative bands in the 1570–1650 nm range for Textile A and B, but only between 1570 and 1610 nm for Textile C. For Textiles A and B, these bands are well defined and fall within regions of moderate textile absorbance, allowing the chemical signals to be clearly resolved. In contrast, for Textile C, the most informative spectral bands of ACN fall within its region of highest intrinsic absorbance (beyond 1600 nm), leading to a diminished signal-to-noise ratio. This reduces the detectability of ACN on this Textile C.
The ROI-focused spectra (Figure 6 and Figure 7) further illustrate that analyte-solvent-textile interactions depend on concentration and background absorbance. For ACN, Textile A allowed a clear separation of 60% and 100% from the textile background and isopropanol, whereas 10% ACN overlapped almost entirely with the solvent baseline. Textile C exhibited a similar concentration-dependent pattern, but with stronger dominance of intrinsic absorbance in the relevant range, reducing sensitivity at low concentrations. The spectra of 10% ACN closely follow the isopropanol baseline, reflecting the dominance of solvent-related features at low concentrations. In contrast, at 60% and 100% ACN, analyte-specific absorption dominates, shifting the spectra below the textile curve. This indicates a concentration-dependent interplay between solvent and analyte signals, further complicated by the textile’s intrinsic absorbance in this region. TEG spectra were more consistent, with stable band positions between 1470 and 1570 nm across concentrations and textiles and clearly distinguishable amplitudes (Figure 7). These features remained well resolved even in the presence of textile-related baseline variation, indicating that TEG provided a more robust spectral signature than ACN under the tested conditions.
The time-dependent measurements highlight the different temporal detectability of the two substances. The disappearance of ACN signals after 30 s (Figure 4b) is attributed to its high volatility and rapid evaporation under the influence of halogen lamp heat, which likely accelerated the process. In contrast, the persistence of TEG signals reflects its lower volatility and stronger affinity for textile surfaces. The spectral valleys and peaks in Figure 4a,b arise from overtone and combination band vibrations in the near-infrared region, particularly involving C–H and N–H bonds. For example, the TEG trough at ~1500 nm corresponds to the first overtone of N–H bending vibrations, while the ACN-associated shoulder near 1600–1650 nm can be attributed to C≡N-related overtones interacting with the textile matrix. These spectral features are further influenced by textile absorbance, solvent presence, and possible weak hydrogen bonding between analyte and fabric. While TEG features remained detectable even after 30 min, ACN signals disappeared within 30 s under the experimental conditions. Although ACN thus exhibited only a very short detection window, its identification remains relevant in real-world scenarios, where substantially larger amounts than the 10 µL tested here are typically released, leading to extended persistence on surfaces. At the same time, the high volatility of ACN underscores the importance of rapid, non-destructive screening methods such as HSI, which can provide decisive information within the critical early response phase. It should also be considered that the halogen lamps used in the HSI setup may have accelerated ACN evaporation, further shortening the detection window under laboratory conditions compared to real-world scenarios.
Multivariate analysis supported these findings. PCA score density plots (Figure 8, Figure 9 and Figure 10) reveal well-separated clusters for ACN and TEG on Textiles A and B, indicating consistent and distinguishable spectral responses across concentration levels. In contrast, Textile C shows broader, less defined clusters, especially for ACN, suggesting greater spectral variability. This may result from both structural inhomogeneity and reduced differentiation due to spectral overlap between the textile’s high absorbance regions and the compound’s most informative spectral bands. For TEG, tighter and more consistent clustering was observed across all textiles, confirming the robustness of its spectral features. These findings indicate that PCA can reliably visualize spectral differences linked to chemical residues, but the quality of separation depends strongly on both textile properties and analyte-specific spectral alignment.
As an exploratory approach, PCA was conducted separately for each textile–substance combination to visualize contamination-related spectral differences. This qualitative use of PCA emphasized pattern recognition and visualization rather than providing quantitative accuracy metrics. While this approach is suitable for demonstrating feasibility, it does not yield direct performance indicators of residue detection. This dataset-specific strategy highlights the potential of HSI for residue detection. Future work should therefore complement PCA with quantitative validation metrics and extend the analysis to time-resolved scenarios (immediate vs. delayed acquisition) with larger sample loads, in order to assess residue persistence and improve transferability across textiles.
The spatial distribution of chemical residues is visualized through false-colour HSI images and PCA cluster mapping. For ACN on Textile B (Figure 9), distinguishable clusters appear across different concentration levels, but these became less distinct at lower concentrations, likely due to its high volatility and overlap with textile absorbance. In contrast, TEG on Textile B (Figure 10) produced clear and well-separated clusters across all concentration levels, consistent with its stronger and more stable spectral features.
Together, these results support the following conclusions:
- (1)
- Textiles with finer, more uniform structures (A and B) yield more consistent and discriminable spectral signals, allowing clearer differentiation of chemical residues.
- (2)
- The detectability of chemical substances depends not only on textile structure but also on spectral alignment, i.e., whether a compound’s most informative spectral bands fall within high or low background absorbance regions of the textile. This explains the reduced detectability of ACN in Textile C.
- (3)
- Fibre arrangement, including mesh size, and surface roughness affect light–material interaction, with rougher textiles leading to increased scattering and spectral variability, contributing to reduced cluster separation in coarse textiles.
Although spectral preprocessing (e.g., SNV, derivatives) improved clarity, material-inherent factors such as surface roughness and intrinsic absorbance of the respective fabric significantly influence spectral consistency and interpretability. This highlights the need to adapt analysis strategies to material-specific backgrounds when applying HSI in real-world detection scenarios.
When combined with structural imaging and multivariate analysis, HSI provides a robust framework for visualizing and analyzing chemical residues on textile surfaces. While the approach demonstrates feasibility across selected fabrics, future work is needed to develop applicable models that account for the variability in textile architecture, composition, and background absorbance. This approach can be integrated into incident response workflows as a rapid, non-destructive scanning method, enabling shorter intervals between incident and detection and supporting three critical phases: identification, containment, and eradication. However, the diversity of textile structures, colours, and compositions still poses a challenge for fast and reliable incident response. Future work should therefore focus on complementing PCA with quantitative validation metrics, expanding the dataset to include a broader range of textiles, and performing time-resolved measurements (immediate vs. delayed acquisition) to evaluate analyte persistence and enhance transferability across textile types.
5. Conclusions
This study confirms that HSI is a powerful and versatile tool for detecting chemical residues on textile surfaces. By integrating HSI with multiscale imaging techniques (IFM and SEM) and chemometric analysis (PCA), a comprehensive, non-destructive framework was established to assess textile spectral response to exposure from hazardous agents such as ACN and TEG.
The results demonstrate that fibre structure and surface morphology strongly affect spectral response and detection sensitivity. Finer and more homogeneous textiles (e.g., Textiles A and B) yielded more consistent spectral signatures and well-separated PCA clusters, enabling the better identification of chemical residues. In contrast, coarser textiles (e.g., Textile C) exhibited higher spectral variability and lower detectability, particularly when the compounds’ most informative spectral bands overlapped with regions of high intrinsic textile absorbance. Notably, TEG produced more consistent and robust spectral features across textiles than ACN, which was more strongly affected by an overlap with textiles absorbance.
Processed spectral datasets, enhanced by SNV transformation and Savitzky–Golay filtering, revealed the clear differentiation of chemical signals across a range of concentrations. The spatial resolution and contrast offered by false-colour HSI and PCA mapping further support the technique’s capability for both qualitative and semi-quantitative assessment of surface contamination.
Given the importance of surface residue detection in environmental monitoring, industrial hygiene, and public health, HSI presents a secure, non-destructive, and scalable solution for identifying and mapping chemical contaminants based on their spectral signatures. With further technological refinement and field validation, HSI holds strong potential for integration into real-world applications, including contamination monitoring, chemical threat detection, and forensic investigations. Its ability to provide fast, non-destructive, and spatially resolved analysis as well as sensitivity makes it particularly valuable for incident response, supporting rapid identification, containment, and verification after decontamination. However, variability in textile structures and compositions remains a challenge for consistent and reliable detection. Future work should therefore focus on quantitative validation metrics, larger and more diverse textile datasets also including different fabric compositions and treatments, as well as time-resolved measurements to evaluate analyte persistence and enhance transferability across textile types.
Supplementary Materials
The following supporting information can be downloaded at: https://www.mdpi.com/article/10.3390/textiles5040042/s1, Figure S1: Wetting patterns of textiles visualized after isopropanol droplet absorption; Table S1: RSD analysis of hyperspectral measurements for solvents on different textiles; Video S1: Hyperspectral Imaging for Non-Destructive Detection of Chemical Residues on Textiles.
Author Contributions
Conceptualization, J.D.P., S.H.U., L.K., G.B., H.S., L.T. and S.H.G.; methodology, L.K., S.H.G., K.W., J.D.P. and S.H.U.; investigation, L.K., S.H.G., J.D.P. and S.H.U.; data curation, L.K., S.H.G. and K.W.; formal analysis, S.H.G. and L.K.; validation, J.D.P. and S.H.U.; resources, S.H.U. and J.D.P.; writing—original draft preparation, all authors; writing—review and editing, all authors; visualization, L.K. and S.H.G.; supervision, J.D.P. and S.H.U.; project administration, J.D.P. and S.H.U.; funding acquisition, J.D.P. and S.H.U. All authors have read and agreed to the published version of the manuscript.
Funding
The authors gratefully acknowledge financial support by the Austrian Federal Ministry of Finance (BMF), within the KIRAS-project (Austrian security research program) FO999914118 ‘Innovative spektroskopische Methoden zum kontaktlosen Nachweis von C und B Substanzen auf Oberflächen und Personen’ (‘Innovative Spectroscopic Methods for Contactless Detection of C and B Substances on Surfaces and Humans’).
Institutional Review Board Statement
Not applicable.
Informed Consent Statement
Not applicable.
Data Availability Statement
The original contributions presented in this study are included in the article/Supplementary Materials. Further inquiries can be directed to the corresponding authors.
Acknowledgments
The authors would like to thank Miranda Klosterhuber for her outstanding technical assistance and invaluable organisational support throughout this study.
Conflicts of Interest
The authors declare no conflicts of interest.
Abbreviations
The following abbreviations are used in this manuscript:
| ACN | Acrylonitrile |
| GUI | graphical user interface |
| HSI | Hyperspectral imaging |
| TEG | N,N,N′,N′-Tetraethylguanidine |
| PCA | principal component analysis |
| RSD | relative standard deviation |
| SWIR | shortwave infrared |
| SNR | signal-to-noise-ratio |
| SVD | single-value decomposition |
| SNV | Standard normal variate |
References
- Hunt, N.; Kestens, V.; Rasmussen, K.; Badetti, E.; Soeteman-Hernández, L.G.; Oomen, A.G.; Peijnenburg, W.; Hristozov, D.; Rauscher, H. Regulatory preparedness for multicomponent nanomaterials: Current state, gaps and challenges of REACH. NanoImpact 2025, 37, 100538. [Google Scholar] [CrossRef] [PubMed]
- Bielak, E.; Marcinkowska, E. Heavy metals in leathers, artificial leathers, and textiles in the context of quality and safety of use. Sci. Rep. 2022, 12, 5061. [Google Scholar] [CrossRef] [PubMed]
- Hackshaw, K.V.; Miller, J.S.; Aykas, D.P.; Rodriguez-Saona, L. Vibrational Spectroscopy for Identification of Metabolites in Biologic Samples. Molecules 2020, 25, 4725. [Google Scholar] [CrossRef] [PubMed]
- Lima, C.; Muhamadali, H.; Goodacre, R. Simultaneous Raman and Infrared Spectroscopy of Stable Isotope Labelled Escherichia coli. Sensors 2022, 22, 3928. [Google Scholar] [CrossRef] [PubMed]
- Amigo, J.M.; Babamoradi, H.; Elcoroaristizabal, S. Hyperspectral image analysis. A tutorial. Anal. Chim. Acta 2015, 896, 34–51. [Google Scholar] [CrossRef] [PubMed]
- Mobaraki, N.; Amigo, J.M. HYPER-Tools. A graphical user-friendly interface for hyperspectral image analysis. Chemom. Intell. Lab. Syst. 2018, 172, 174–187. [Google Scholar] [CrossRef]
- Weyer, L.G.; Lo, S.-C. Spectra—Structure Correlations in the Near-Infrared. In Handbook of Vibrational Spectroscopy; John Wiley & Sons: Hoboken, NJ, USA, 2001. [Google Scholar] [CrossRef]
- Ortega, S.; Fabelo, H.; Iakovidis, D.K.; Koulaouzidis, A.; Callico, G.M. Use of Hyperspectral/Multispectral Imaging in Gastroenterology. Shedding Some-Different-Light into the Dark. J. Clin. Med. 2019, 8, 36. [Google Scholar] [CrossRef] [PubMed]
- Nelson, M.; Mangold, P.; Gomer, N.; Klueva, O.; Treado, P. SWIR Hyperspectral Imaging Detector for Surface Residues; SPIE: Bellingham, WA, USA, 2013; Volume 8710. [Google Scholar] [CrossRef]
- Ram, B.G.; Oduor, P.; Igathinathane, C.; Howatt, K.; Sun, X. A systematic review of hyperspectral imaging in precision agriculture: Analysis of its current state and future prospects. Comput. Electron. Agric. 2024, 222, 109037. [Google Scholar] [CrossRef]
- Weatherbee, O.; Janaskie, J.; Hyvärinen, T. Advanced Hyperspectral Imaging Solutions for Near Real-Time Target Detection; SPIE: Bellingham, WA, USA, 2012; Volume 8542. [Google Scholar] [CrossRef]
- Krekeler, M.P.S.; Burke, M.; Allen, S.; Sather, B.; Chappell, C.; McLeod, C.L.; Loertscher, C.; Loertscher, S.; Dawson, C.; Brum, J.; et al. A novel hyperspectral remote sensing tool for detecting and analyzing human materials in the environment: A geoenvironmental approach to aid in emergency response. Environ. Earth Sci. 2023, 82, 109. [Google Scholar] [CrossRef]
- Gomer, N.; Gardner, C.; Nelson, M. Handheld and Mobile Hyperspectral Imaging Sensors for Wide-Area Standoff Detection of Explosives and Chemical Warfare Agents; SPIE: Bellingham, WA, USA, 2016; Volume 9855. [Google Scholar] [CrossRef]
- Al Ktash, M.; Stefanakis, M.; Wackenhut, F.; Jehle, V.; Ostertag, E.; Rebner, K.; Brecht, M. Prediction of Honeydew Contaminations on Cotton Samples by In-Line UV Hyperspectral Imaging. Sensors 2023, 23, 319. [Google Scholar] [CrossRef] [PubMed]
- Huang, J.; He, H.; Lv, R.; Zhang, G.; Zhou, Z.; Wang, X. Non-destructive detection and classification of textile fibres based on hyperspectral imaging and 1D-CNN. Anal. Chim. Acta 2022, 1224, 340238. [Google Scholar] [CrossRef] [PubMed]
- Mirschel, G.; Daikos, O.; Scherzer, T.; Steckert, C. Near-infrared chemical imaging used for in-line analysis of inside adhesive layers in textile laminates. Anal. Chim. Acta 2016, 932, 69–79. [Google Scholar] [CrossRef] [PubMed]
- Sioma, A. Vision System in Product Quality Control Systems. Appl. Sci. 2023, 13, 751. [Google Scholar] [CrossRef]
- Ndagano, U.N.; Cahill, L.; Smullen, C.; Gaughran, J.; Kelleher, S.M. The Current State-of-the-Art of the Processes Involved in the Chemical Recycling of Textile Waste. Molecules 2025, 30, 299. [Google Scholar] [CrossRef] [PubMed]
- Gray, S. Mapping Clothing Impacts in Europe: The Environmental Cost; WRAP: Banbury, UK, 2017; pp. 1–41. Available online: http://www.ecap.eu.com/wp-content/uploads/2018/07/Mapping-clothing-impacts-in-Europe.pdf (accessed on 15 August 2025).
Disclaimer/Publisher’s Note: The statements, opinions and data contained in all publications are solely those of the individual author(s) and contributor(s) and not of MDPI and/or the editor(s). MDPI and/or the editor(s) disclaim responsibility for any injury to people or property resulting from any ideas, methods, instructions or products referred to in the content. |
© 2025 by the authors. Licensee MDPI, Basel, Switzerland. This article is an open access article distributed under the terms and conditions of the Creative Commons Attribution (CC BY) license (https://creativecommons.org/licenses/by/4.0/).