Abstract
Soil permeability is an important factor in the mining and geotechnical industry, impacting slope stability and tailings management. It directly influences the stability of structures, the control of water in tailings ponds, and the safety of workers. Various additives, such as cement kiln dust (CKD), bentonite, fly ash, polymers, lime, and asphalt, are incorporated into soil structures to improve permeability and stability. Any significant changes in soil permeability will alter the soil’s behavior. However, the long-term effect of most additives on structures remains unexplored. This study investigates the long-term impact of CKD on the permeability of a CKD-treated slope. The slope surface was treated with 0%, 5%, 10%, and 15% of CKD by the dry weight of the soil in 2008 and was evaluated in 2024. The permeability test results of the collected soil sample from the slope (2024) showed that the permeability of the soil decreases with an increase in the soil CKD content. The coefficient of permeability, k, is more than 100 times less for a CKD content of 15% by the dry weight of the soil compared to the permeability of the untreated native soil. The treated soil becomes almost impermeable when the CKD content increases to 20% (by the dry weight of the soil). However, the treated slope’s permeability increased over time, possibly due to erosion, resulting in a reduction in CKD content. The surface permeability of the slope exhibits an irregular distribution, resulting from the evolving spatial distribution of Cement Kiln Dust over time.
1. Introduction
Soil permeability, a soil’s capacity to transmit fluids through its pore network, stands as a foundational parameter in geotechnical engineering [1,2]. This property critically governs drainage behavior, directly influencing the stability of engineering structures such as tailings storage facilities [3] and slopes ranging from highway embankments to excavated cut slopes [4]. Soils typically consist of a mixture of fine and coarse particles, which contribute differently to the material’s overall permeability. When permeability is excessively low, precipitation runoff accelerates, triggering surface erosion and compromising slope integrity. Conversely, highly permeable strata permit rapid water infiltration, displacing air from pore spaces and elevating pore water pressures [5]. This hydraulic mechanism can reduce effective stress, potentially initiating landslides or differential settlement in critical infrastructure.
Physical/Chemical modification involves a range of physiochemical alterations in the ground’s composition and/or structure of soil elements. This occurs through the addition of materials that change fundamental soil qualities, for instance, by physical mixing of additives (such as lime, fly ash, cement, and CKD), material injections (grouting), or thermal treatments involving temperature extremes, to change the properties and/or behavior of the soil. Modification by inclusion and confinement may incorporate the use of manufactured materials integrated with the ground or structural components. These may include the use of lightweight materials like polystyrene foam or other lightweight fillers; confinement of (mostly granular) materials using cribs, gabions, and webs; reinforcing geosynthetics; and reinforcement with tensile components. This kind of ground improvement often uses only structural components, making it physical in nature. This could also apply to vegetating the ground’s surface to reinforce the soil [6].
Chemical stabilization techniques using additives like lime, cement, and fly have proven to be one of the most economical and effective methods, widely used in various geotechnical applications for stabilizing subgrade soil material [7,8]. These materials react with soil constituents in the presence of water, altering fabric geometry and hydraulic conductivity to enhance slope resilience.
Some additives, such as geofiber and geogrid, rely on their physical impacts to enhance the characteristics of the soil [9].
Additionally, chemical and physical stabilization can be integrated, for instance, by combining lime with geotextile or geofiber [10]. In recent years, additives for soil stabilization have gained significant attention in geotechnical engineering [11]. One such additive is cement kiln dust (CKD), a by-product of cement production mainly used as raw feed. CKD is rich in lime and other minerals (making it suitable for improving the engineering properties of soil. Miller and Azad (2000) [11] report that the United States disposes of over 3.5 million tons of CKD annually. The cement industry could benefit economically by utilizing CKD in commercial applications instead of disposing of it as waste.
Recent concerns of field engineers have led to the need for further probing into the effect of these stabilization methods on the mechanical and chemical properties of the stabilized soils. According to Sherwood (1993) [12], most stabilized soils show a decrease in their mechanical strength properties over time, particularly under prolonged exposure to environmental factors. These factors could result in the leaching of stabilizing agents as well as chemical transformations in the soil matrix [13,14]. For instance, cement-stabilized soils can undergo micro-cracking due to shrinkage or thermal expansion, which could weaken the bonds between the soil particles. Likewise, lime-treated soils may experience pozzolanic reactions that diminish in efficacy over time due to insufficient long-term curing or environmental interactions [15]. In addition to mechanical degradation, chemical instability in stabilized soils poses significant challenges. The interaction of stabilized soils with groundwater or environmental chemicals can lead to undesirable reactions, such as sulfate attack, which compromises soil integrity [16,17]. Also, leaching stabilizing agents like calcium can reduce the long-term effectiveness of stabilization, especially in areas with high rainfall or fluctuating water tables [18]. This study investigates the long-term effects of CKD on the permeability of a CKD-treated soil slope with the aim of helping engineers and researchers gain valuable insights into the effectiveness and sustainability of this treatment method and ultimately improving the design, construction, and maintenance of similar slopes in the future.
2. Materials and Methods
- Slope Location and Soil Engineering Properties
To assess the impact of cement kiln dust (CKD) on the engineering and geotechnical properties of soil, a natural soil slope west of the New Mexico Institute of Mining and Technology in Socorro, NM (34°04′48.2″ N and 106°55′03.3″ W) at about 20 m wide at about 45° slope angle, was treated with CKD in 2008 [19]. The slope surface was divided into four sections to study the effect of different CKD contents on soil erosion (Figure 1). The surface soil of these sections, stabilized at a depth of 0.3 m, was treated with 0%, 5%, 10%, and 15% of CKD (by the dry weight of the soil) from left to right, respectively.
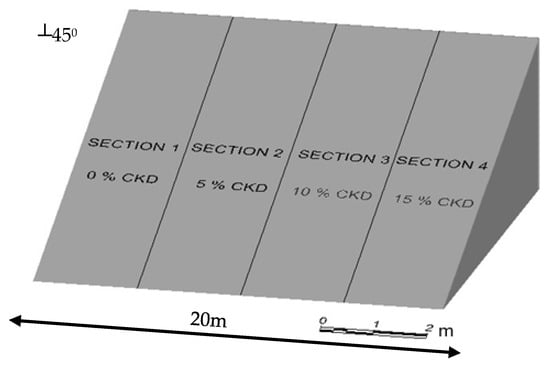
Figure 1.
The amount of added CKD (by dry weight of the soil) to the topsoil of the different sections in 2008.
Soil samples were collected from the treated and untreated slope sections up to 0.50 m in depth. Collecting samples from both treated and untreated sections helped in comparing the properties and behavior of the CKD-treated soil with the untreated soil, serving as a control. Samples were collected, prepared and stored in airtight containers to prevent moisture loss or gain before testing to ensure preservation of moisture content, which is relevant to the analysis. For CKD-treated samples, curing conditions such as temperature, humidity, and curing time were properly controlled to mitigate errors.
A portion of the untreated soil was used to prepare current treated samples using 0%, 5%, 10%, 15% and 20% in the laboratory for analysis. These laboratory samples were prepared using standard protocols to ensure accurate and reliable results. Soil mechanics laboratory tests were performed to determine the geotechnical and engineering properties of soil samples collected from the slope.
The pH of the slope was measured at three distinct depths: the surface (0 m), 0.15 m, and 0.30 m at each of four locations along the slope dip for each of the four sections to estimate the present CKD content. The soil samples were collected at the center of each section at various depths measured from the slope surface, using coring equipment, to reduce/mitigate contamination.
Figure 2 shows the sampling locations on the slope to measure the soil pH.
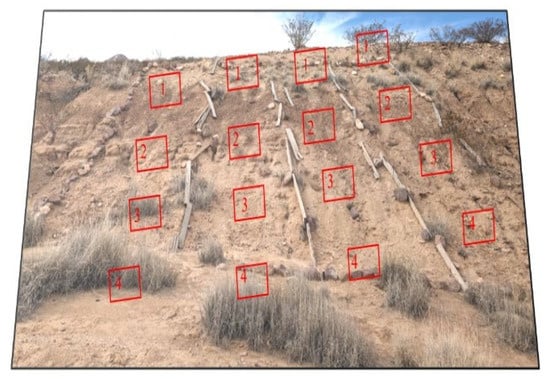
Figure 2.
Slope location for sample collection.
The soil’s pH was measured using a laboratory pH meter.
- Soil Permeability
Two test methods (i.e., constant head test and falling head test) were used in determining the coefficient of permeability of the samples. These two tests were used mainly due to the number of fine particles present in the soil sample. After the particle size distribution test, it was observed that samples from the slope generally had less than 10% of fines, and as such, the constant head test method was appropriate for these samples. The addition of CKD to the native soil for the laboratory-prepared samples introduced more fines into the samples, necessitating the use of the falling head test for those samples.
The samples collected from various sections of the site, each with different percentages of CKD content (0%, 5%, 10%, and 15%), were sifted using a No. 4 sieve (4.75 mm). They were found to be non-plastic, with less than 10% of particles passing through a No. 200 sieve for each section’s sample, making them suitable for the constant head testing method. The testing procedure involved placing 750 g of the soil sample in a rigid-wall permeameter from Humboldt Mfg. Co., Elgin, IL, USA equipped with porous stones and filter paper to prevent sample loss, as shown in Figure 3. The permeameter diameter was eight to twelve times larger than the maximum particle size, ensuring constant head conditions. A double-tube manometer from Humboldt Mfg. Co. USA was connected to monitor head pressure variations during the test.
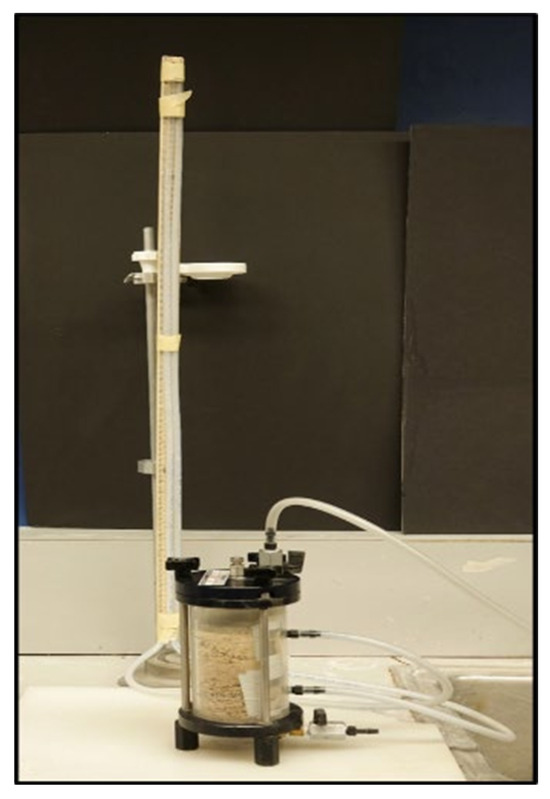
Figure 3.
Constant head test setup.
For the constant head test, the specimen was saturated with deaired water from a constant head tank, and compaction with a tamper was performed to achieve a higher relative density. After vacuum saturation, the test commenced, with time and head readings taken at steady state. Readings of temperature and flow quantity were also recorded at intervals as the head pressure rose. These data were tabulated and substituted into Darcy equation to calculate the coefficient of permeability, k. Each test was repeated three times, and the average result was calculated.
The falling head test was used for testing the laboratory-prepared mixture of CKD and native soil from the site. The native soil (i.e., soils with no CKD content) was collected from the site, and particle-size testing was performed. After particle size testing, the sample was divided into four equal parts and mixed with 0%, 5%, 10%, and 15% CKD. It was observed that the samples were more cohesive than those from the field; as such, Falling Head Testing was a more appropriate method for determining the coefficient of permeability.
The test was conducted using 750 g of sample in a permeameter equipped by Humboldt Mfg. Co. USA with a wire mesh and a spring to hold the sample in place. The permeameter was connected to tubes at both openings as an intake and an outlet for deaired water. At saturation, the standpipe filled with deaired water was connected to the permeameter’s intake valve, as shown in Figure 4. Water from the standpipe flows through the sample, and the time required for the water level to drop from a higher level (e.g., 80 mm) to a lower level of 20 mm (i.e., 60 mm) is measured. Also, the water temperature was measured. The readings of water level drop, time, and temperature were taken three times for every sample, with an allowable error of 10% and the average was calculated. For each sample type (0%, 5%, 10%, and 15% CKD content), five samples were run to generate more reliable data. A 20% CKD content sample was tested as a buffer to help validate the results.
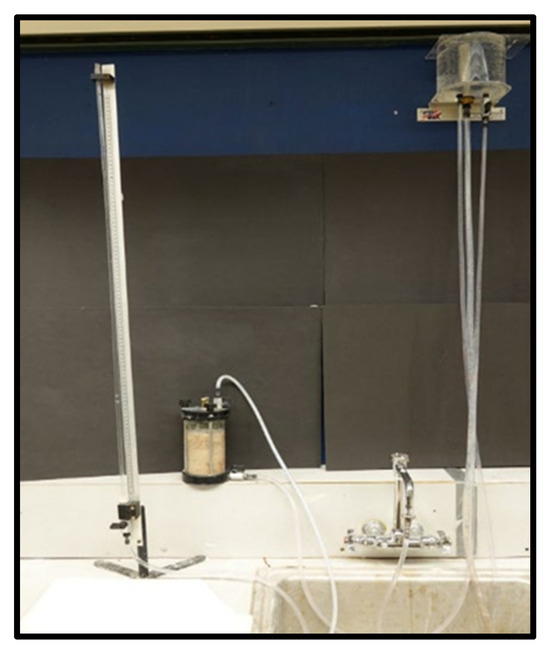
Figure 4.
Falling head test setup.
3. Results and Discussions
- Geotechnical properties of the soils
The geotechnical properties of the soil are presented in Table 1. It is observed that the specific gravity of the soils is generally about 2.5–2.6, and the in situ natural moisture content ranges between 2.5% and 2.8%, with the highest natural moisture content obtained for soils with 0% CKD. The dry unit weight of the soil was found to range between 16.4 and 16.8 kN/m3, and the grading characteristics of the soil are shown in Figure 5. It is observed that the samples are poorly graded because they lack all particle sizes and have more sand present in the soil curve. The liquid and plastic limits were not determined because the soils were mainly nonplastic. Based on the typical values, the specific gravity of most inorganic soils ranges from 2.60 to 2.80. Sands typically range from 2.63–2.67, silts from 2.65–2.70, and clays from 2.67–2.90, whereas organic soils generally measure below 2.00 [20]. The sample can be described as sand, with sodium and calcium feldspar and chlorite minerals.

Table 1.
Properties of the soil sample.
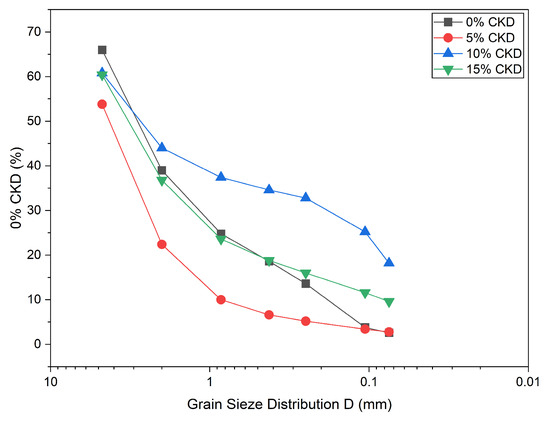
Figure 5.
Grain size distribution of soil samples.
- Variation in pH of the CKD-stabilized soils.
Figure 6 shows the pH levels of soil treated with different amounts of CKD by dry weight. The pH of the soil present in Section 1 (0% CKD) was measured as 8.38 in 2008 and 2019, and as 9.1 in 2024. Factors contributing to alkaline soil pH include the type of parent material, particularly those rich in calcium carbonate (e.g., limestone), low rainfall, low rainfall leading to salt and mineral accumulation, and the presence of basic cations like calcium, sodium, and magnesium in higher concentrations than acidic hydrogen ions. Over-application of lime and the use of alkaline irrigation water can also increase soil alkalinity [21,22]. In sections treated with CKD, these changes were more pronounced, indicating that even small additions of CKD can lead to considerable increases in soil pH, making it more alkaline [23,24]. These results suggest that CKD can effectively adjust soil pH, making it a potential soil conditioner for pH alteration. This may be observed from the trend of the plots in the graph, where the pH of the present soil samples is higher than that of the samples from 2008 and 2019. The increased pH can affect water flow through the soil in several ways: Increased clay dispersion: Higher pH can cause clay particles to disperse, reducing soil permeability and increasing water retention [25,26]. Alkaline soils may experience reduced infiltration rates, potentially leading to increased runoff and erosion [27]. Changes in soil structure and pore-size distribution due to CKD treatment can affect soil hydraulic conductivity, influencing water flow and plant water availability [28]. However, the effectiveness of CKD in modifying soil pH and water flow may vary depending on soil type, CKD composition, and environmental conditions [11]. Despite this promising result, further investigation across different soil types is necessary to better quantify the CKD’s effect on soil properties, as this experiment was run solely on moderately silty-clay sandy soil. This broader research will clarify the effectiveness and suitability of CKD for soil pH adjustment across various environmental contexts.
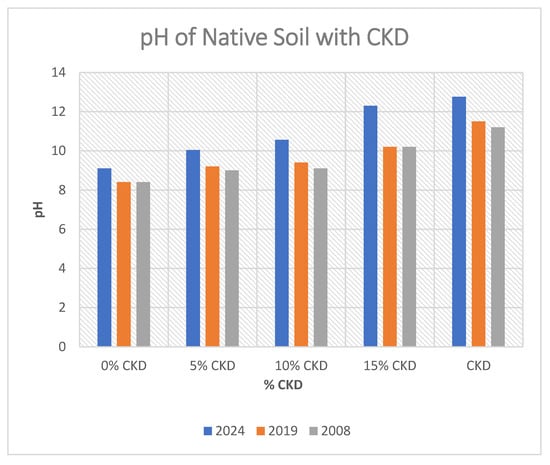
Figure 6.
pH of soil samples treated with CKD.
Figure 7, Figure 8 and Figure 9 show the pH contours of the slope at depths of 0 m (surface), 0.15 m, and 0.30 m, respectively, in November 2023.
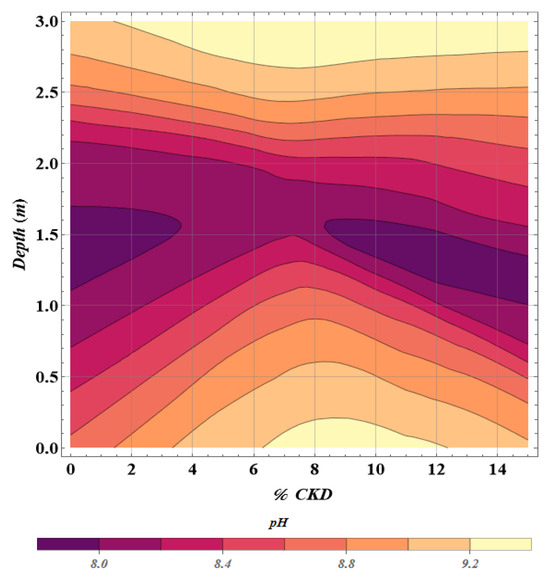
Figure 7.
Soil pH contours at a depth of 0.00 m (on the slope surface).
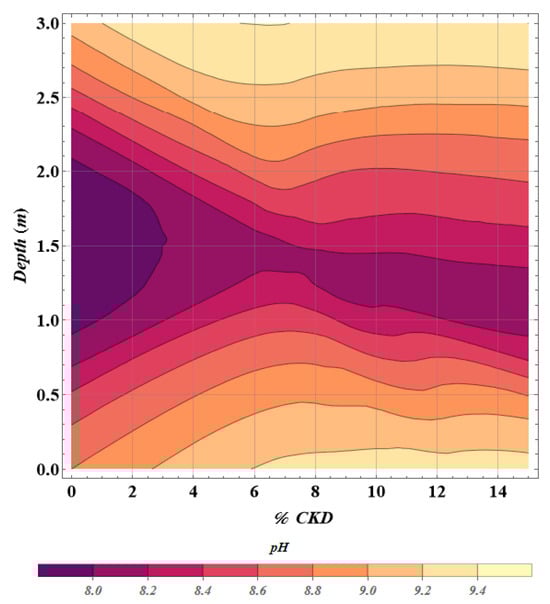
Figure 8.
Soil pH contours at 0.15 m from the slope surface.
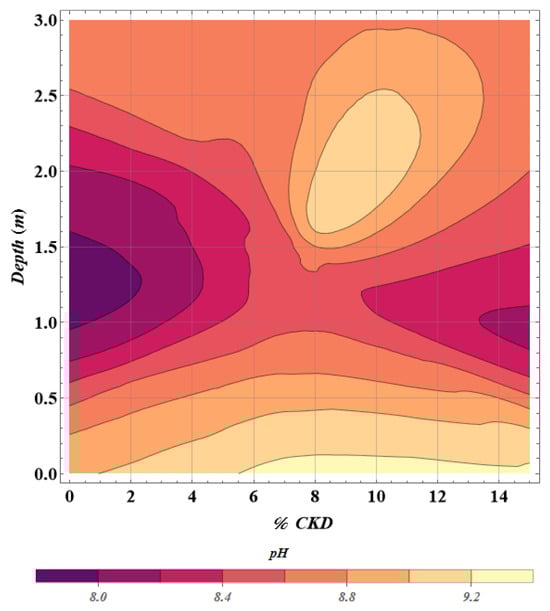
Figure 9.
Soil pH contours at a depth of 0.30 m (on the slope surface).
The soil pH increases from 0% to 15%, as shown in Figure 7. Sariosseiri (2010) [19], treated Section 4 with 15% (CKD) by dry weight of soil, and this section still displays the highest concentration of CKD based on the soil pH values.
The soil pH in Section 1 (0% CKD) is higher at the toe of the slope and lower at the top. This indicates that the treated soil moved from other sections to this section due to wind or surface runoff. The slope topography and field observations support this hypothesis.
Another important observation is the difference in pH at different points on the slope surface. The pH at the slope’s toe (horizontal section) is higher than at the upper surface. In addition, it may be established that erosion occurred laterally, from the top to the bottom. Thus, the treated soils slid down the slope from sections with higher CKD concentrations to sections with lower CKD concentrations.
An almost consistently increasing pH value trend is observed from Section 1 to Section 4 (i.e., these sections indicate the percentage of CKD from left to right of the slope, in 5% increments) at a depth of 0.15 m from the slope surface, with Section 4 showing a higher pH concentration near the slope’s toe (Figure 8). The parallel contour lines demonstrate that, at this depth, there has been little to no soil disturbance because of natural events. The increased pH concentration near the slope’s toe at this depth is probably due to infiltration.
With a high pH concentration near the slope toe under Section 4 (Figure 9), pH values (or CKD concentration) are close to the native soil pH at 0.30 m below the slope surface. The layer treated atop the untreated native soil ends at this depth. Due to settlements and errors in measuring depth during the stabilization and sampling process, this depth may vary. For this reason, the pH contours appear differently from those in Figure 8. Infiltration could be the reason for the high pH concentration in the lower right corner of the slope.
Figure 10 shows the estimated 2024 pH distribution from 0% to 15% CKD sections on the slope surface based on the pH value measured at that time. Comparing the plot of the initial distribution to that of 2024, it is observed that the pH in all four sections has relatively decreased from the surface to a depth of 0.30 m below the slope surface. This observation may be the result of CKD depletion in the slope surface. Notice must be taken of the fact that this estimation was done based on the 2024 pH value of CKD and, as such, may involve some marginal errors, though infinitesimal.
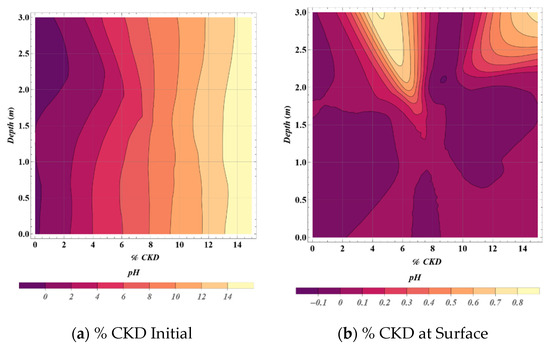
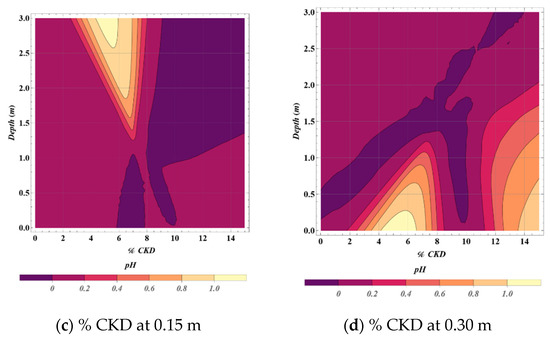
Figure 10.
Plot of pH against % CKD for depth at the slope surface.
- Long-Term Effects of CKD on Permeability
The observed decrease in permeability of slope soil with increasing Cement Kiln Dust (CKD) content, as shown in Figure 11, can be attributed to reduced porosity and changes in pore-size distribution. The coefficient of permeability (k) is directly related to porosity (n) and can be expressed using the Kozeny–Carman equation (Equation (1)) [29,30]:
where ρ is the fluid density, g is the acceleration due to gravity, μ is the dynamic viscosity, n is the porosity, and de is the effective grain diameter.
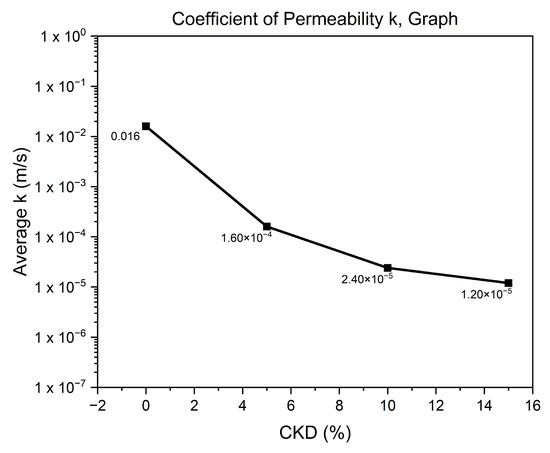
Figure 11.
Coefficient of Permeability Graph for slope samples.
As CKD content increases, soil porosity decreases due to pore filling by CKD particles, thereby reducing permeability [31,32]. The rate of change in the permeability coefficient becomes less significant at higher CKD contents (≥10%), suggesting that the pore spaces are filled and that further additions of CKD have minimal impact on permeability [33].
Figure 12 shows a relative comparison of permeability coefficients for soil treated with 0%, 5%, 10%, and 15% CKD, expressed as a percentage of the dry weight of the soil. The significant reduction in the permeability coefficient with increasing CKD content can be attributed to changes in the soil’s volumetric characteristics. The addition of CKD fills the pore spaces, reducing the porosity (n) and void ratio (e), and increasing the dry unit weight of the soil as seen in Table 1 [34]. The reduction in porosity and void ratio leads to a decrease in the permeability coefficient, as water flow paths become more indirect and narrower [35]. The non-linear trend in permeability reduction can be attributed to the changes in soil structure and fabric with increasing CKD content. At lower CKD contents (5%), the CKD particles fill the larger pores, leading to a significant reduction in permeability. At higher CKD contents (10–15%), the CKD particles continue to fill the smaller pores, but the rate of reduction in permeability decreases as the soil becomes denser and less permeable [33].
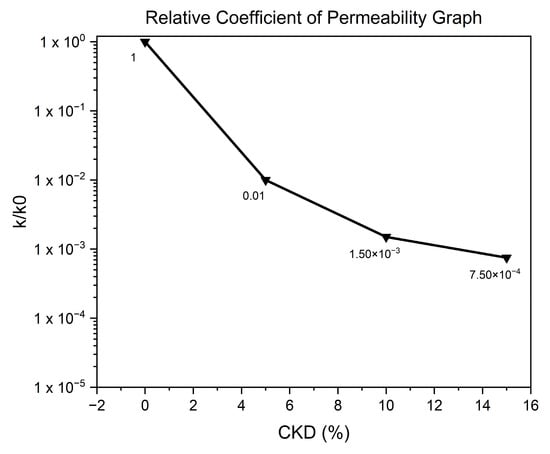
Figure 12.
Relative Coefficient of Permeability Graph for slope samples.
Table 2 presents the coefficient of permeability (k) for samples prepared in the laboratory using a native, untreated soil sample from the slope with varying percentages of Cement Kiln Dust (CKD): 0%, 5%, 10%, and 15%. Five tests were conducted for each CKD percentage, providing insights into the impact of CKD content on sample permeability. There’s a clear trend of decreasing permeability with increasing CKD content. Samples with 0% CKD show the highest permeability values (order of 1 × 10⁻⁴ m/s), while those with 15% CKD exhibit the lowest permeability (order of 1 × 10⁻⁶ m/s). Variability in permeability values is observed across tests for each CKD percentage, potentially indicating differences in sample preparation or inherent material heterogeneity. The addition of CKD appears to significantly reduce permeability. For instance, moving from 0% CKD to 5% CKD shows a notable drop in permeability, suggesting CKD’s role in densifying the material and reducing pore connectivity, which is a confirmation of the results achieved from the samples obtained from the slope above and the literature.
Table 2.
Table of the coefficient of permeability of the sample prepared in the laboratory.
Figure 13a shows the Coefficient of Permeability Graph, which plots the Average k (m/s) against the percentage of CKD for both laboratory-prepared and slope samples. The permeability of lab samples decreases with increasing CKD percentage. Starting at approximately 1.42 × 10⁻⁴ m/s at 0% CKD, it reduces to about 1.23 × 10⁻⁶ m/s at 15% CKD. Similarly, the slope samples exhibit a decrease in permeability with increasing CKD content, from around 1.00 × 10⁻² m/s at 0% CKD to approximately 1.20 × 10⁻⁵ m/s at 15% CKD. The permeability values for slope samples are higher than those for lab samples across the CKD percentages tested. The higher permeability in slope samples compared to lab samples could be attributed to differences in compaction, structure, or initial conditions. Lab samples were prepared under controlled conditions, which might lead to a more uniform, denser structure than slope samples, which could have greater variability, less compaction, and have endured other uncontrolled conditions, such as erosion and fine particle migration over time.
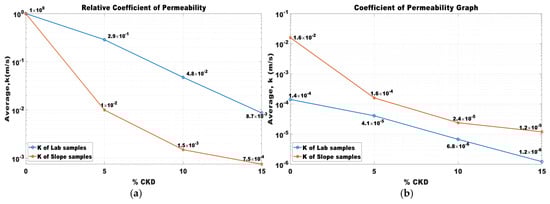
Figure 13.
(a) Coefficient of Permeability and (b) Relative Coefficient of Permeability Graph.
Figure 13b is the Relative Coefficient of Permeability graph showing k/k0 (the ratio of permeability at a given CKD percentage to the initial permeability at 0% CKD) versus % CKD for laboratory-prepared and slope samples. This normalization helps compare the rate of change in permeability between the two sample types. Relative permeability decreases by increasing CKD, reaching about 8.67 × 10⁻³ at 15% CKD, indicating a significant reduction in permeability relative to the untreated state for the laboratory samples. In contrast, the slope samples show a more pronounced decrease in relative permeability, dropping to approximately 7.50 × 10⁻⁴ at 15% CKD. This suggests a more substantial effect of CKD in reducing permeability in slope samples compared to lab samples when considering relative changes. The steeper decline in relative permeability for slope samples indicates that CKD might be more effective, relative to lab samples, in reducing permeability in slope samples, despite the absolute permeability values being higher for slope samples.
The 2024 distribution of permeability across the various sections of CKD, expressed as percentages, is graphically represented in the contour plot in Figure 14 (from left to right). It is observed that permeability decreases with increasing CKD percentage, confirming previous observations.
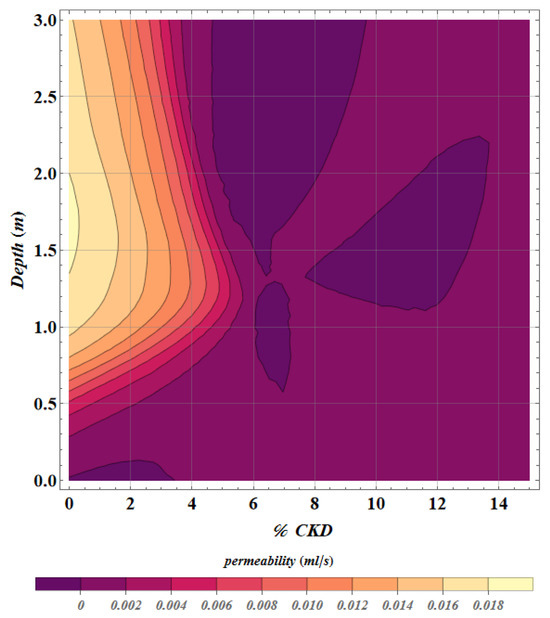
Figure 14.
Permeability distribution for % CKD Graph.
To ensure this observation was valid for higher percentages of CKD, another sample was prepared with 20% CKD, and the falling head test was performed. At 20% CKD, the sample became somewhat impermeable. Thus, the observations of the steady trend from 10% to 15% CKD above can be attested to as an accurate representation of the effect of CKD on the permeability of soil samples. Figure 15 below shows a picture of the sample result with 20% CKD, which resembles a dried concrete mix after two weeks without achieving saturation.
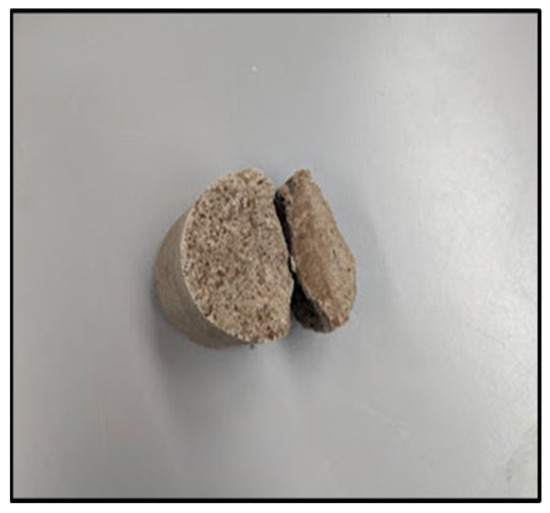
Figure 15.
Picture of the sample mixed with 20% CKD.
4. Conclusions
In conclusion, it was observed that the permeability of slopes treated with CKD increased over time, possibly due to the weather conditions in the area and the reduction in CKD content. This implies that over a long period, CKD is lost in the slope, reducing its initial effect on soil permeability and, consequently, the observed increase in permeability in 2024. The performance evaluation results show that increasing CKD content decreases soil permeability, making it a suitable ground improvement material for slopes, foundation soils, hydraulic structures, and stable earth structures. The effect of the CKD over the fourteen years on the permeability of the soil surface is observed to be infinitesimal looking at the results from the tests run where the presently prepared samples have k values of order 10−4, 10−5, 10−6 and 10−6 m/s and the treated slope samples have k values ranging from order 10−2, 10−4, 10−5, and 10−5 m/s for the various 0%, 5%, 10% and 15% CKD content mix, respectively. It is also worth noting that the higher the CKD content, the more resistant the slope is to weather conditions (heat, water, and wind effects). Thus, structures improved with CKD are less susceptible to erosion, landslides, and collapses. Finally, CKD is an excellent stabilizing material for ground improvement. As much as it is good, it is also important to note that a measure must be put on its utilization in geotechnical works, as too much of it can make the ground impermeable and thus susceptible to liquefaction and other unwanted effects of low to no permeability. Based on the results and observations from this work, the following are recommended for future research:
- Other advanced permeability methods, such as using a membrane to run the permeability test, should be implemented.
- Investigate how higher CKD content (20%) and beyond affect the geomechanical properties of soil.
- Investigate how pH directly affects the type of soil and its geomechanical properties.
Author Contributions
S.A.A.O.D. and M.R. created experimental methods and the theoretical foundation for the study’s investigation of the long-term effects of CKD. In addition to helping with the experimental work, B.A. and R.O. wrote the first draft of the manuscript, which included the introduction and discussion sections. C.M.D.W. and A.A. worked on reviewing the manuscript. In addition to participating in the experimental work, each author helped with the manuscript’s critical revision, which improved clarity and ensured that publication requirements were followed. All authors have read and agreed to the published version of the manuscript.
Funding
This research received no external funding.
Institutional Review Board Statement
Not applicable.
Informed Consent Statement
Not applicable.
Data Availability Statement
The original contributions presented in this study are included in the article. Further inquiries can be directed at the corresponding authors.
Acknowledgments
The authors thank The Minerals Commission, Ghana, for their support, and The Mineral Engineering Department of the New Mexico Institute of Mining and Technology for their support and opportunity to utilize the Laboratory for this work.
Conflicts of Interest
The authors declare no conflicts of interest.
Abbreviations
The following abbreviations are used in this manuscript:
| CKD | Cement Kiln Dust |
| NP | Nonplastic |
| k/k0 | The Ratio of Permeability Coefficient to the Permeability Coefficient of the Treated Soil with CKD |
| K | Coefficient of permeability |
| ┴ | Slope angle |
References
- Alawaji, H.A. Settlement and bearing capacity of geogrid-reinforced sand over collapsible soil. Geotext. Geomembr. 2001, 19, 75–88. [Google Scholar] [CrossRef]
- Housing, B.Y.; Desk, N. Permeability of soil: Importance, and formula. 2023. Available online: https://housing.com/news/what-is-the-permeability-of-soil/ (accessed on 9 December 2025).
- Otoo, R.; Razavi, M.; Abankwa, B.; Armah, A.; Donkor, S.; Brakohiapa, E. Review of the Combined Effects of Mineralogy and Particle Size on Tailings Dewatering Mechanism. Am. J. Min. Metall. 2025, 8, 13–19. [Google Scholar] [CrossRef]
- Jawad, I.T.; Taha, M.R.; Majeed, Z.H.; Khan, T.A. Soil stabilization using lime: Advantages, disadvantages and proposing a potential alternative. Res. J. Appl. Sci. Eng. Technol. 2014, 8, 510–520. [Google Scholar] [CrossRef]
- Barman, D.; Dash, S.K. Stabilization of expansive soils using chemical additives: A review. J. Rock Mech. Geotech. Eng. 2022, 14, 1319–1342. [Google Scholar] [CrossRef]
- Nicholson, P.G. Ground Improvement Techniques and Applications. In Butterworth-Heinemann Soil Improvement and Ground Modification Methods; Elsevier: Amsterdam, The Netherlands, 2015; pp. 9–17. [Google Scholar] [CrossRef]
- Abankwa, B.; Razavi, M.; Otoo, R.; Armah, A.; Donkor, S. Effects of Sand–Cement Columns on Primary Consolidation Settlement. Appl. Sci. 2025, 15, 7690. [Google Scholar] [CrossRef]
- Braja, M.D. Principles of Geotechnical Engineering, 7th ed.; Cengage Learning: Melbourne, Australia, 2010. [Google Scholar]
- Braja, M.D.; Khaled, S. Principles of Geotechnical Engineering, 8th ed.; Cengage Learning: Melbourne, Australia, 2014; Volume 5. [Google Scholar]
- Yang, G.; Liu, H.; Lv, P.; Zhang, B. Geogrid-reinforced lime-treated cohesive soil retaining wall: Case study and implications. Geotext. Geomembr. 2012, 35, 112–118. [Google Scholar] [CrossRef]
- Miller, G.A.; Azad, M. Influence of soil type on stabilization with cement kiln dust. Constr. Build. Mater. 2000, 14, 89–97. [Google Scholar] [CrossRef]
- Sherwood, P. Soil Stabilization with Cement and Lime; Her Majesty Stationary Office, HMSO: London, UK, 1993. [Google Scholar]
- Nalbantoglu, Z.; Tuncer, E.R. Compressibility and hydraulic conductivity of a chemically treated expansive clay. Can. Geotech. J. 2001, 38, 154–160. [Google Scholar] [CrossRef]
- Higgins, D.D. Soil stabilization with ground granulated blast furnace slag. Proc. ICE-Ground Improv. 2005, 9, 13–22. [Google Scholar]
- Mallela, J.; Quintus, H.V.; Smith, K.L. Consideration of Lime-Stabilized Layers in Mechanistic-Empirical Pavement Design; National Lime Association: Arlington, VA, USA, 2004. [Google Scholar]
- Petry, T.M.; Little, D.N. Review of stabilization of clays and expansive soils in pavements and lightly loaded structures—History, practice, and future. J. Mater. Civ. Eng. 2002, 14, 447–460. [Google Scholar] [CrossRef]
- Hunter, D. Lime-induced heave in sulfate-bearing clay soils. J. Geotech. Eng. 1988, 114, 150167. [Google Scholar] [CrossRef]
- Rios, S.; Cristelo, N.; da Fonseca, A.V.; Ferreira, C. Structural performance of alkali-activated soil ash versus soil cement. J. Mater. Civ. Eng. 2016, 28, 04016132. [Google Scholar] [CrossRef]
- Sariosseiri, F.; Razavi, M.; Carlson, K.; Ghazvinian, B. Stabilization of Soils with Portland Cement and CKD and Application of CKD on Slope Erosion Control. In Geo-Frontiers 2011: Advances in Geotechnical Engineering; American Society of Civil Engineers (ASCE): Reston, VA, USA, 2010. [Google Scholar]
- Das, B.M. Soil Mechanics Laboratory Manual, 2nd ed.; Oxford University Press: Oxford, UK, 2002. [Google Scholar]
- Brady, N.C.; Weil, R.R. The Nature and Properties of Soils, 15th ed.; Pearson Education, Inc.: Hoboken, NJ, USA, 2016. [Google Scholar]
- Sparks, D.L. Environmental Soil Chemistry, 2nd ed.; Academic Press: New York, NY, USA, 2003. [Google Scholar]
- Siddique, R. Utilization of cement kiln dust in cement mortar and concrete. J. Mater. Civ. Eng. 2006, 18, 655–662. [Google Scholar]
- Rahman, M.A.; Siddique, R. Use of cement kiln dust in soil stabilization. J. Mater. Civ. Eng. 2011, 23, 611–618. [Google Scholar]
- Shainberg, I.; Letey, J. Response of soils to sodic conditions. Hilgardia 1981, 49, 1–57. [Google Scholar]
- Suarez, D.L.; Rhoades, J.D. Soil pH and its effect on soil hydraulic conductivity. J. Environ. Qual. 2006, 35, 1041–1048. [Google Scholar]
- Abedi-Koupai, J.; Asadkazemi, J. Effects of alkaline water on infiltration and hydraulic conductivity of soil. J. Agric. Sci. Technol. 2006, 8, 121–130. [Google Scholar]
- Sridharan, A.; Rao, S.M. Hydraulic conductivity of compacted clays. J. Geotech. Eng. 1988, 114, 233–246. [Google Scholar]
- Carman, P.C. Flow of Gases Through Porous Media; Butterworths Scientific Publications: Waltham, MA, USA, 1956. [Google Scholar]
- Kozeny, J. Über kapillare Leitung des Wassers im Boden. Sitzungsberichte Akad. Wiss. Wien 1927, 136, 271–306. [Google Scholar]
- Al-Rawas, A.A.; Hago, A.W.; Al-Sarmi, H. Effect of cement kiln dust on the engineering properties of clayey soils. J. Mater. Civ. Eng. 2005, 17, 338–344. [Google Scholar]
- Sridharan, A.; Nagaraj, T.S. Compressibility and permeability of clays treated with cement kiln dust. J. Geotech. Geoenviron. Eng. 2005, 131, 1277–1285. [Google Scholar]
- Sivapullaiah, P.V.; Prashanth, J.P.; Sridharan, A. Effect of cement kiln dust on the strength of lime-treated soils. Ground Improv. 2000, 4, 111–118. [Google Scholar]
- Horpibulsuk, S.; Rachan, R.; Suddeepong, A. Assessment of strength development in cement-stabilized Bangkok clay. J. Geotech. Geoenviron. Eng. 2010, 136, 1546–1555. [Google Scholar]
- Mitchell, J.K.; Soga, K. Fundamentals of Soil Behavior, 3rd ed.; John Wiley & Sons: Hoboken, NJ, USA, 2005. [Google Scholar]
Disclaimer/Publisher’s Note: The statements, opinions and data contained in all publications are solely those of the individual author(s) and contributor(s) and not of MDPI and/or the editor(s). MDPI and/or the editor(s) disclaim responsibility for any injury to people or property resulting from any ideas, methods, instructions or products referred to in the content. |
© 2025 by the authors. Licensee MDPI, Basel, Switzerland. This article is an open access article distributed under the terms and conditions of the Creative Commons Attribution (CC BY) license (https://creativecommons.org/licenses/by/4.0/).