Abstract
Environmental stressors, such as freeze–thaw (F–T) cycling and acid rain, affect the durability of carbonate rocks used in engineering and cultural heritage structures. This study investigates the mechanical degradation and strain evolution of Carrara marble subjected to 10 F–T cycles and immersion in a simulated sulfuric acid solution (pH 5) for 3, 7, and 28 days. The mechanical strength of the samples was tested under uniaxial compression using a displacement-controlled loading rate, while full-field deformation and fracture evolution were analyzed with Digital Image Correlation (DIC). Results show that F–T cycling led to a substantial reduction in uniaxial compressive strength (UCS) and a very large decrease in tangent Young’s modulus. Acid exposure also caused progressive degradation, with both UCS and stiffness continuing to decline as exposure time increased, reaching their greatest reduction at the longest treatment duration. Additionally, DIC strain maps revealed a change in deformation response as a function of the treatment. The findings provide the integrated assessment of Carrara marble mechanical response under both F–T and acid weathering, linking bulk strength loss with changes in strain localization behavior, highlighting the vulnerability of marble to environmental stressors, and providing mechanical insights relevant to infrastructure resilience and heritage conservation.
1. Introduction
Carbonate rocks, particularly marble, have been widely used throughout history for buildings, monuments, sculptures, and modern architectural elements due to their abundance, workability, aesthetic appeal, and mechanical integrity. White Carrara marble in Italy, noted for its relatively uniform white color, fine-to-medium calcite crystals, high density, and strength, has been employed in iconic structures such as the Piazza dei Miracoli in Pisa, Carrara Cathedral, Palazzo Ducale in Massa Carrara, and Michelangelo’s David [1,2,3]. However, exterior exposure makes Carrara marble vulnerable to environmental stressors, including rainfall, humidity, temperature fluctuations, and air pollution. These processes accelerate chemical weathering, salt crystallization, and thermal stress [4,5,6]. As a result, marble develops microcracks, experiences surface erosion and discoloration, and suffers a reduction in strength, which can sometimes lead to exfoliation or structural damage [2,7]. Furthermore, the study by [8] highlights that SO2, NOₓ, and airborne particulates accelerate sulfation, dissolution, and microstructural deterioration in calcitic heritage stones.
F-T weathering is a key factor in the degradation of porous geomaterials in regions with temperatures fluctuating around freezing [9]. Freezing pore water generates internal stresses, which are partially released upon thawing. While a single cycle rarely causes significant damage, repeated F-T cycles promote microcrack formation, increase porosity, and weaken the material [10,11]. F-T damage arises from ice crystallization, ice lens formation, volumetric expansion, and hydraulic pressures (in partially saturated pores), which collectively generate stress and promote microcrack growth [10,12,13,14]. In fine-to-medium crystalline calcitic rocks such as Carrara marble, these processes progressively reduce cohesion, tensile and compressive strength, and stiffness, while promoting surface flaking, delamination, and grain loss [2,7,10,15,16,17]. Findings by [18] further indicate that thermo-mechanical fluctuations can modify marble’s fracture mechanisms, alter its failure mode, and decrease post-peak stability. Experimental results from [19] also show that repeated freeze–thaw cycles substantially reduce wave velocities, tensile strength, uniaxial compressive strength (UCS), and elastic modulus in marble, confirming the strong coupling between temperature variation and microstructural deterioration.
Chemical weathering, particularly from sulfuric acid in acid rain, poses another threat to carbonate rocks. Acidic environments dissolve calcite, creating micro-voids, initiating cracks, and weakening mechanical properties such as UCS and elastic modulus (E) [20]. Liu et al. [18] reported that marble subjected to acidic corrosion combined with cyclic wetting–drying experiences substantial reductions in UCS and elastic modulus, along with notable increases in energy dissipation and microcrack density. Such chemical degradation mechanisms are critical concerns for both engineering applications and the preservation of stone-built cultural heritage.
Despite extensive research on thermal and chemical weathering in rocks [20,21,22,23], the coupled impacts of these processes on the deformation behavior of Carrara marble remain poorly understood. Existing studies mainly emphasize macroscopic strength reduction or surface deterioration, while the evolution of deformation mechanisms, particularly strain localization and crack development, has received far less attention [24]. Rock deformation typically progresses through sequential stages of crack closure, initiation, growth, coalescence, and final failure [25,26]. However, conventional measurement tools such as extensometers and strain gauges capture only localized deformation, offering limited capability to resolve the full-field strain distribution and its evolution during loading [2,15,16,27]. In this case, the combined use of Digital Image Correlation (DIC) and Linear Variable Differential Transformers (LVDTs) enables a more comprehensive evaluation of strain evolution after artificial weathering, providing both full-field and global deformation measurements, which represents a significant contribution to the current understanding of weathered marble behavior.
Digital Image Correlation (DIC), a non-contact full-field optical technique, provides high-resolution measurements of displacement and strain, enabling visualization of deformation localization and fracture evolution in laboratory-tested rocks [25,26,28,29]. Recent studies emphasize that rock texture and speckle characteristics strongly influence the accuracy of DIC strain maps, particularly in fine-grained rocks such as marble [30]. Moreover, freeze–thaw-induced damage alters the spatial deformation patterns of rocks in ways not detectable by conventional sensors. For instance, Zhang [31] applied a 3D DIC to map strain evolution in freeze-thawed fault-zone rock masses, revealing heterogeneous strain fields, crack-network restructuring, and a shift from tensile-dominated to mixed shear–tensile failure modes with increasing F–T cycles. Despite these, the application of DIC to characterize deformation and fracture evolution in Carrara marble subjected to freeze–thaw cycling and acid-induced weathering remains limited.
This study investigates the effects of environmental weathering on the mechanical and strain localization evolution of Carrara marble. Two scenarios were considered: (i) 10 F-T cycles and (ii) immersion in simulated sulfuric acid rain (pH 5) for 3, 7, and 28 days. Mechanical degradation was quantified through UCS and elastic modulus testing, while deformation behavior and failure evolution were characterized using axial LVDT and full-field DIC. By linking bulk strength loss to strain evolution, this work provides insights into the strain evolution and deterioration mechanisms of Carrara marble under physical and chemical weathering, contributing to a better comprehension of material selection, infrastructure resilience, and conservation strategies for stone-built cultural heritage.
2. Materials and Methods
Carrara marble is a metamorphic rock formed under the polyphasic tectonic-metamorphic deformation of the northern Apennine orogenic belt [32]. It exhibits variability in color, ranging from white and statuary to veined and grey. The tested material is white fine-medium-grained Carrara marble, mainly composed of calcite grains, with minor dolomite and trace amounts of terrigenous minerals [33].
A total of 24 prismatic samples, each 60 mm high and 30 mm thick, were prepared by cutting six 60 × 60 × 60 mm cubic blocks (Figure 1a). The geometry of each specimen was measured using a caliper with an accuracy of 0.001 mm. The resulting prismatic specimens, with a height-to-width ratio (H/D) of 2, conform to the ASTM D7012 [34] recommended range of 2–2.5 for intact rock specimens, ensuring proper uniaxial stress distribution and minimizing end effects. This geometry also allows high-resolution full-field strain monitoring using DIC coupled with LVDTs, enabling accurate observation of strain localization and deformation mechanisms. The samples were subsequently divided into five treatment groups, each containing four specimens. The first group served as an untreated base, while the second group underwent freeze–thaw cycling. The third, fourth, and fifth groups were subjected to acid rain chemical weathering simulation for 3, 7, and 28 days, respectively.
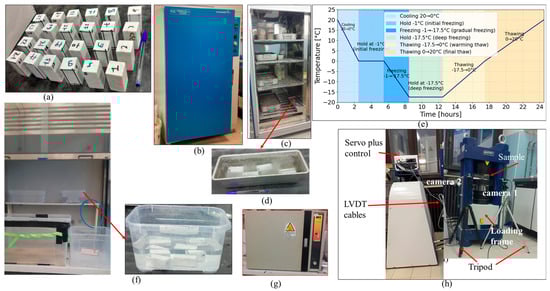
Figure 1.
Experimental setup and sample preparation: (a) marble samples used in this study; (b) freeze–thaw chamber; (c) samples placed inside the freeze–thaw chamber; (d) samples after freeze–thaw cycling; (e) freeze–thaw cycling temperature versus time; (f) samples inside the acid bath under the lab glass-covered hood; (g) Oven; (h) uniaxial compressive strength apparatus with cameras set up.
The first part of the laboratory testing campaign aimed at studying the effects of freeze–thaw cycling on Carrara marble. F–T conditioning was carried out in accordance with UNI EN 1367-1:2020 [35], which is the standard procedure for evaluating natural stone durability under cyclic freezing and thawing. Samples underwent 10 cycles between −17.5 °C (freezing) and +20 °C (thawing), with each cycle lasting 24 h. The temperature program consisted of gradual cooling, a sustained freezing phase, and controlled thawing to replicate natural environmental conditions (Figure 1e). Before conditioning, all samples were cleaned, dried in an oven at 105 °C, saturated by immersion in water, and placed inside the F–T chamber. Upon completion of the 10 cycles, the samples were allowed to equilibrate in air, rinsed with clean water to remove residual loose particles, and subsequently oven-dried at 105 °C to ensure consistent testing conditions for mechanical testing.
The second part of the laboratory testing campaign aimed at simulating sulfuric acid rain-induced chemical weathering. Marble samples were exposed to sulfuric acid for durations of 3, 7, and 28 days to represent short-, medium-, and long-term chemical exposure, enabling a systematic assessment of progressive degradation.
Samples were first washed with clean deionized water and then immersed in a 10−5 mol/L sulfuric acid solution at pH 5 inside a rectangular bath (Figure 1f). The bath was placed in a protected environment covered by glass. After 3 days of exposure, the samples of the first set were removed from the solution, carefully rinsed with clean water, and dried in an oven at 105 °C. The second and third sets of specimens were kept in the solution for 7 and 28 days, respectively, and were subsequently rinsed and dried in the same manner.
The uniaxial compressive strength (UCS), stress–strain response, and tangential Young’s modulus were determined for both untreated and treated marble specimens. Tests were conducted using the Matest Compressive Servo Plus system at the Applied Geology Laboratory, University of Turin. The machine has a maximum load capacity of 3000 kN, and the test was performed under displacement-controlled conditions. Axial strain was measured using the machine-mounted LVDT of the Matest elastic modulus test system performed under displacement control at 0.036–0.037 mm/min (strain rate ≈ 10−5 s−1). The Universal Testing Machine 2 (UTM2) software recorded load–displacement data in real time. In the most degraded groups (28-day acid treatment and 10 F–T cycles), two specimens in each set failed prematurely and were excluded from UCS analysis. For groups with sufficient replication (n ≥ 3), variability in mechanical properties was quantified using the coefficient of variation (CV%), the ratio of standard deviation to mean, expressed as a percentage of the mean. For groups with fewer than three specimens, variability is reported as the observed range.
Digital Image Correlation (DIC) was used to characterize the full-field surface deformation and strain evolution of marble specimens during uniaxial compressive tests [30,36,37,38,39,40]. Before imaging, sample surfaces were carefully cleaned, and a rectangular reference line was drawn using a permanent marker to enhance feature tracking (Figure 2g). During testing, two Basler Ace 2 high-frequency optical cameras recorded adjacent lateral surfaces simultaneously until specimen failure. The recorded videos were then converted into individual image frames using Free Video to JPG Converter (v5.2.3, Digital Wave Ltd., London, UK), and 9–18 representative frames were selected to correspond with key stages of the stress–strain curve, including the elastic phase, onset of strain localization, peak stress, and post-peak deformation. Frame selection was performed by converting time points into frame numbers based on the total recording time and frame count, ensuring accurate alignment of the mechanical and visual data while maintaining computational efficiency.
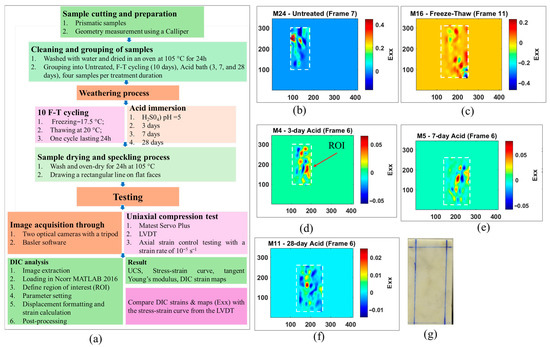
Figure 2.
(a) Systematic diagram of the DIC approach, illustrating the workflow from sample preparation to post-processing; (b–f) Horizontal strain maps showing the region of interest (ROI) across different treatment groups; (g) Representative sample with a rectangular polygon marking the surface area used for DIC analysis.
Selected frames were loaded into Ncorr v1.2.2 within MATLAB R2024b for analysis [36]. The first undeformed frame was defined as the reference image, while subsequent frames served as deformed images. A region of interest (ROI) was manually defined on the reference image and automatically subdivided into smaller pixel subsets for correlation. DIC parameters were set with a Reliability-Guided (RG) radius of 65 mm, a strain radius of 15 mm, and a subset spacing of 5 mm. Pixel-based displacement data were converted to physical units using a scale factor derived from known sample dimensions. The Ncorr algorithm then computed horizontal (U) and vertical (V) displacement fields by identifying the best match for each subset in the reference image across deformed images. Strain components (εxx, εγγ, γxγ) were calculated from the displacement gradients using a least-squares plane-fit approach, producing both Green–Lagrangian and Euler–Almansi strain measures [41]. In this study, the horizontal strain component (εxx) was primarily used to compare DIC-derived strain evolution with LVDT-based stress–strain curves. Post-processing of displacement and strain fields allowed visualization of deformation patterns, strain localization, and crack initiation and propagation. Strain maps were displayed with a range of color scales that represent progressive deformation zones, deep blue indicates compression, and red colors show tensile microcrack opening. Two approaches were applied for visualization: (1) pre-peak-only maps isolating early strain evolution and (2) full-range maps capturing both pre-peak and post-peak deformation, including fracture propagation and crack coalescence. Quantitative analyses of εxx were performed for each frame within the ROI (Figure 2b–f), extracting both pixel-level strain values and the mean strain to relate local surface deformation to strain evolution across treatment groups.
Although pre-peak stress–strain data provide essential information on elastic behavior and peak strength, post-peak DIC analysis was included to investigate fracture evolution, damage localization, and residual deformation. This approach enables a comprehensive understanding of the failure process, revealing localized deformation patterns and the mechanisms of crack initiation, propagation, and coalescence that are not captured by global stress–strain measurements alone. Figure 2a illustrates the overall methodological approach adopted in this study.
3. Results
3.1. Mechanical Properties
3.1.1. Uniaxial Compressive Strength
Table 1 presents UCS and tangential Young’s modulus (Et) values for untreated and treated samples. The reported UCS reductions and mean values reflect the observed response under accelerated aging conditions. These conditions allow us to study early-stage fracture initiation and strain evolution, which is the main focus of this work, rather than predicting long-term natural deterioration. The results reveal that, despite considerable data dispersion, untreated samples showed the highest mean UCS (93.72 MPa) with a standard deviation of 18.51 MPa, corresponding to a CV of ~20%. The highest and lowest UCS values were 115.87 MPa and 74.13 MPa, respectively, reflecting natural microstructural heterogeneity. After 3 and 7 days of acid bath exposure, mean UCS declined moderately (Table 1), with CVs of ~17% and ~13%, respectively, indicating that early chemical degradation acted relatively uniformly across specimens. Et exhibited higher variability (CV ~38–36%) in these groups, consistent with the elastic response being more sensitive to microstructural heterogeneities than peak strength.

Table 1.
Summary of uniaxial compressive strength (UCS) and tangent elastic modulus (Et) for samples subjected to different acid bath exposure durations and freeze–thaw (F–T) treatment. The table reports individual sample values, means, and standard deviations for both UCS (MPa) and Et (GPa) across 0, 3, 7, and 28 days of acid treatment, as well as 10-cycle freeze–thaw conditions.
After 28 days of acid exposure, UCS decreased substantially compared with untreated samples, while Et remained nearly uniform. The wide range of UCS values (47.39–82.50 MPa) highlights heterogeneous long-term degradation resulting from uneven calcite dissolution and microcrack propagation. F–T-treated samples showed a large decrease in UCS (40.70–46.35 MPa, mean 43.53 MPa). The narrow range of values for F–T samples suggests that mechanical weakening was relatively uniform across specimens, despite the overall reduction in strength and stiffness.
Focusing on acid treatment, Figure 3 reports the number of acid bath days against the mean UCS (Figure 3a) and the mean Et (Figure 3b). The result indicates that UCS decreases as the days of acid bath exposure increase (Figure 3a), identifying a linear relationship. The slope of the relationship indicates a consistent reduction in UCS by approximately 1.006 MPa per day of acid exposure. The y-intercept (93.72) represents the approximate initial UCS of untreated samples.
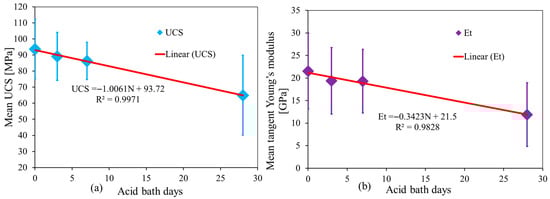
Figure 3.
Relationship between (a) uniaxial compressive strength and acid bath exposure days; (b) mean tangent Young’s modulus and acid bath exposure days.
Acid exposure progressively deteriorates the mechanical integrity of the rock, leading to a reduction in UCS. This is likely due to chemical reactions between the acid and the mineralogical composition of the rock, particularly carbonates (e.g., calcite and dolomite). These reactions can weaken the microstructure by forming soluble salts or inducing microcracks. After 28 days of acid exposure, the UCS drops from approximately 93.72 MPa to 64.96 MPa, as previously said. This trend highlights the vulnerability of carbonate rocks to prolonged acid exposure.
3.1.2. Elastic Modulus
The mean tangential Young’s modulus (Et) of the untreated samples is approximately 21.53 GPa, with a standard deviation of 8.62 GPa, corresponding to a CV of ~40%, reflecting high variability in stiffness due to microstructural heterogeneity. After 3 and 7 days of acid bath exposure, mean Et declines moderately (Table 1), with CVs of ~38% and ~36%, respectively, indicating that early chemical degradation reduces stiffness while maintaining relatively consistent variability across specimens. As shown in Figure 3b, this decrease is partially masked by sample-to-sample differences. After 28 days of acid exposure, the mean Et decreased significantly compared with untreated samples. Because of premature failure, probably due to treatment effects, only two specimens were successful, and CV could not be reliably calculated; however, the individual Et values indicate that long-term acid exposure leads to substantial weakening. Similarly, the Et of F–T-treated samples decreased to 5.56 GPa, with a narrow range of values (5.56–6.18 GPa), suggesting that freeze–thaw-induced stiffness loss is more uniform across specimens despite the overall reduction. As seen in Figure 3b, the Et decreases linearly with increasing acid exposure time. The slope of the relation shows that modulus reduces by approximately 0.34 GPa per day of acid exposure. The y-intercept (21.5) represents the initial modulus of untreated samples. The Et represents the stiffness of the rock. The decline in Et implies that acid exposure reduces the rock’s ability to resist deformation under load. For example, after 28 days, the Et decreases from 21.53 GPa to 11.89 GPa, indicating a reduction in stiffness. This degradation might result from mineral dissolution, increased porosity, and micro-structural weakening caused by acid attack. The steeper reduction in modulus compared to UCS indicates that stiffness is more sensitive to acid-induced changes than compressive strength.
In general, both UCS and Et exhibit strong linear reductions with prolonged acid exposure, underscoring the impact of chemical weathering on the mechanical properties of carbonate rocks. The data suggest that short-term acid exposure (3–7 days) causes relatively moderate degradation, but prolonged exposure (28 days) and F-T cycling led to enhanced weakening. The difference in reduction rates for UCS emphasizes the need to consider both properties when assessing rock durability and performance under acid conditions.
3.2. Stress–Strain Curve After Acid Bath
Stress–strain curves in Figure 4a–d present how acid exposure affects the behavior of marble under uniaxial compression. Initially, the stress–strain relationship is non-linear, possibly due to the closure of existing micro-fractures, then it changes to linear as the loading increases. Stress–strain curves of untreated samples show, compared to those of acid-treated samples, a relatively higher peak stress, indicating greater compressive strength, and a steeper elastic slope (Figure 4a). In contrast, for samples exposed to the acid bath, the peak stress and elastic slope decrease relatively with increased acid bath exposure, suggesting weakening of the material (Figure 4b–d). The strain behavior of 3 and 7 days of acid-treated samples generally shows low strain at the peak stress (Figure 4b,c). Samples after 28 days of acid bath display higher strain before failure and lower peak stress. They reached their peak around 0.0095 strain, indicating strain values that are slightly higher than those of untreated samples. Although strain shows variability across samples, generally, it increases as acid bath exposure increases.
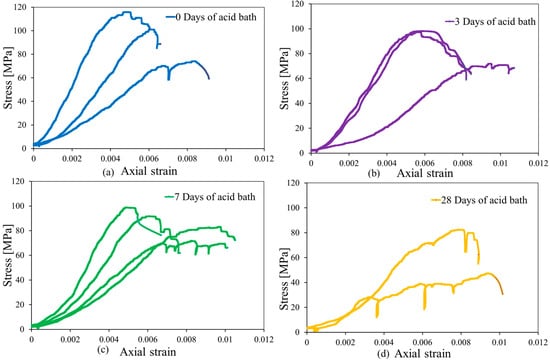
Figure 4.
Stress–strain curves of marble samples after acid bath exposure for different durations: (a) 0 days (untreated); (b) 3 days; (c) 7 days, and (d) 28 days.
In most of the curves of both treated and untreated samples, the post-peak behavior is characterized by numerous strength drops (Figure 4, Figure 5, Figure 6, Figure 7, Figure 8, Figure 9 and Figure 10iii), suggesting a stick-slip behavior, consistent with what has been observed at the laboratory scale by several authors in different lithologies [40,42].
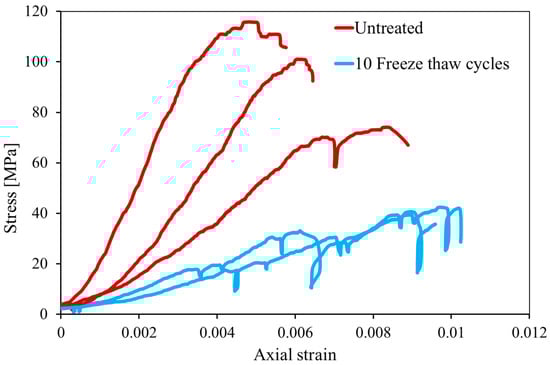
Figure 5.
Stress–strain curves of untreated and treated marble samples (treated samples shown in blue).
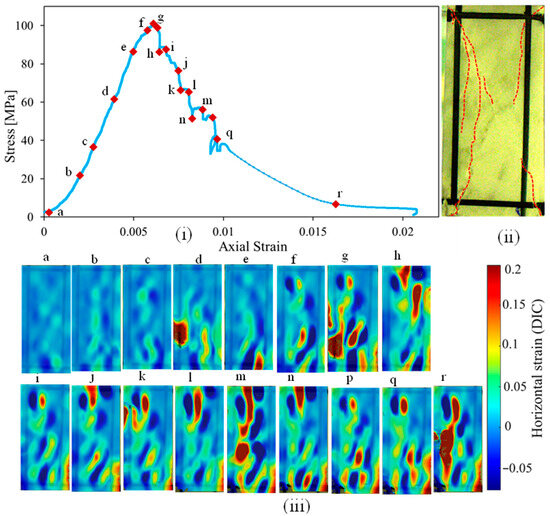
Figure 6.
Untreated marble sample: (i) stress–strain curve; (ii) photograph of the specimen; (iii) DIC strain map along the horizontal axis.
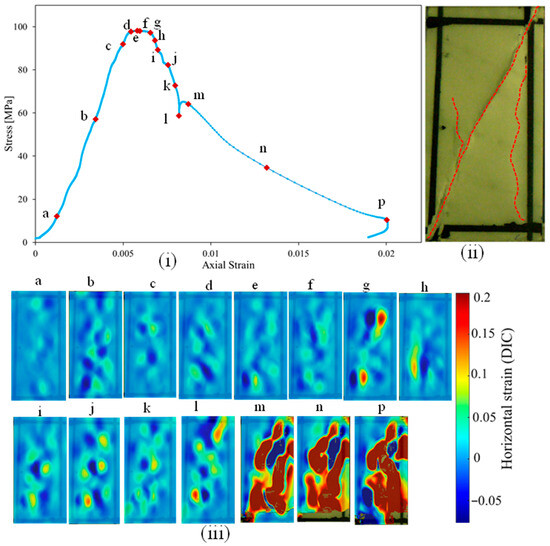
Figure 7.
Marble sample after 3 days of acid bath exposure: (i) stress–strain curve; (ii) photograph of the specimen after peak stress; (iii) DIC strain map along the horizontal axis (Exx) post-peak.
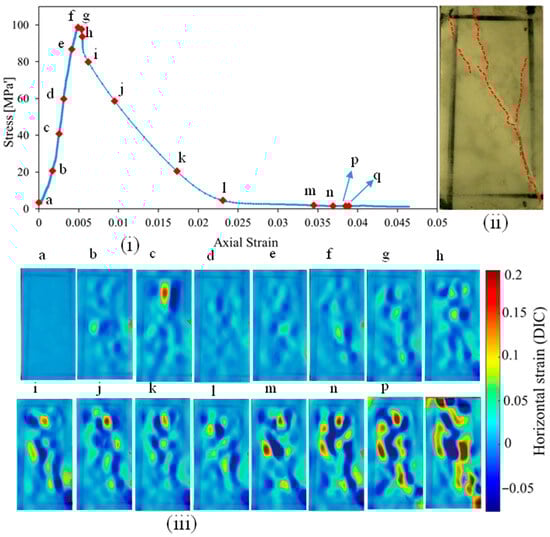
Figure 8.
Marble sample after 7 days of acid bath exposure: (i) stress–strain curve; (ii) specimen photograph after peak stress; (iii) DIC strain map along the horizontal axis (Exx) post-peak.
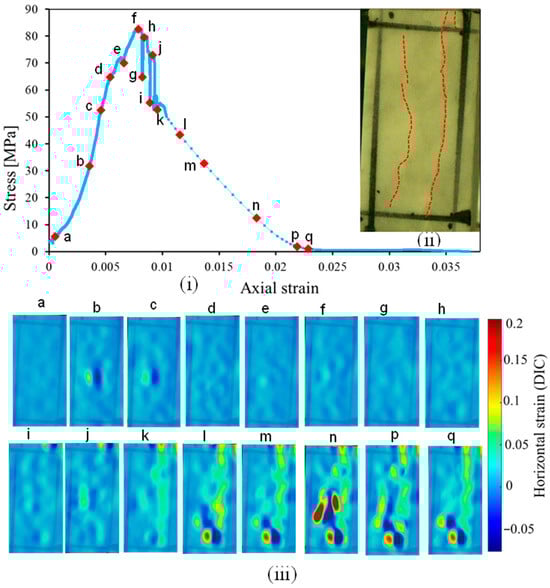
Figure 9.
Marble sample after 28 days of acid bath exposure: (i) stress–strain curve; (ii) specimen photograph after peak stress; (iii) DIC strain map along the horizontal axis (Exx) post-peak.
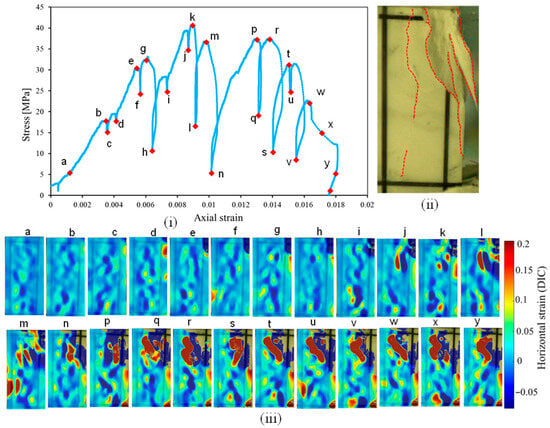
Figure 10.
Treated marble sample (10 freeze–thaw cycles): (i) stress–strain curve; (ii) specimen photograph; (iii) DIC strain map along the horizontal axis.
3.3. Stress–Strain Curves After F-T
The stress–strain curves (Figure 5) illustrate the mechanical response of marble samples subjected to 0 F-T cycles (red curves) and those subjected to 10 F-T cycles (light blue curves). Compared to untreated samples, F-T treated samples show a more gradual stress increase during loading, a lower peak stress, and a progressive post-peak stress decline (see Figure 10 for the post-peak). Initial stress drops begin in the elastic phase and become more frequent with increasing strain. The elastic region is less steep and contains several localized stress drops before the peak stress. Stick–slip behavior in F–T treated samples occurs at high frequency, may be due to the combined effects of preexisting and F-T-induced microfractures. These microfractures act as stress concentrators, producing sudden stress drops during loading. Following each stress release, stress redistributes across the material, and in some cases, partial self-healing of non-penetrating microcracks leads to a temporary increase in stress. Surface observations confirm that microcracks form without fully penetrating the specimen, and spall out of surface fragments, triggering additional stress fluctuations. This cyclic process of stress accumulation, release, redistribution, and microfracture evolution underlies the characteristic stick–slip response observed in F–T degraded materials. The samples treated failed at higher axial strains, approximately 0.009 to 0.015 (Figure 5, light blue curves).
These curves indicate that F-T cycling reduces the peak stress, the stress drops perturb the linearity of the elastic region, and modify the failure process. The progression of stress drops and strain increases suggests changes in the mechanical integrity of the marble samples after freeze–thaw treatment.
3.4. Strain Evolution
In this section, the strain evolution results are presented in two parts. First, the full range of pre- to post-peak DIC strain maps is shown for representative samples across treatment groups to illustrate the complete sequence of fracture initiation, propagation, and final failure (Figure 6, Figure 7, Figure 8, Figure 9 and Figure 10). Second, a strain map up to peak strain maps is presented across all treatment groups to compare the development of localized deformation before failure (Figure 11). In each strain map, the colour bar represents the magnitude of the measured strain, where warmer colours indicate high (extensional) strain concentrations and cooler colours correspond to low and/or compressional strain values.
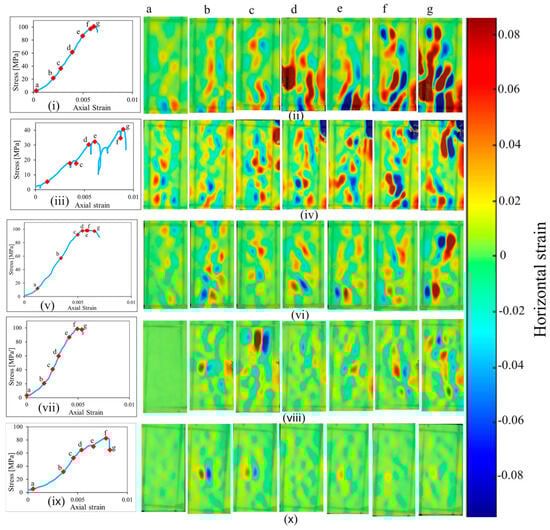
Figure 11.
Pre-peak strain evolution comparison across treatment groups and their corresponding stress–strain curves: (i) Stress–strain curves of untreated samples; (ii) strain maps of untreated samples; (iii) stress–strain curves after 10 freeze–thaw cycles; (iv) strain maps after 10 freeze–thaw cycles; (v) stress–strain curves after 3 days of acid bath exposure; (vi) strain maps after 3 days of acid bath exposure; (vii) stress–strain curves after 7 days of acid bath exposure; (viii) strain maps after 7 days of acid bath exposure; (ix) stress–strain curves after 28 days of acid bath exposure; (x) strain maps after 28 days of acid bath exposure. Letters a–g indicate the stress–strain curve stages that correspond to the DIC strain maps. Roman numerals i–x denote the subfigures associated with the stress–strain curves and strain maps.
To enable comparison across samples, fixed colour bars were used. For the full pre- to post-peak evolution, a wider strain range (−0.05 to 0.20) was applied to capture the large strain concentrations occurring after peak stress. For the up-to-peak maps, a narrower symmetric range (−0.08 to 0.08) was used because the high post-peak strains would otherwise dominate the colour scale and visually mask the small-scale strain localization patterns that develop before failure. The corresponding DIC frame numbers are also marked on the LVDT-based stress–strain curves, allowing direct correlation between the mechanical response and the observed strain-localization behavior.
3.4.1. Untreated Samples
Figure 6 demonstrates the results of DIC analysis for one representative sample used to illustrate the strain evolution of the untreated group. Horizontal strain maps in Figure 6iii correspond to points a to r in the stress–strain curve, representing different stages of the deformation and failure process. The color bar on the right indicates strain values, where red represents high strain localization in extension and light blue indicates low strain and minimal deformation.
Strain maps at points a and b, corresponding to compaction and early elastic regions, show a relatively uniform blue coloration, indicating an even stress distribution with few localized deformations (Figure 6iii). At points c and d, yellow (c) and red (d) zones start to appear, showing the development of strain concentration areas. Before the peak stress (point d), distinct red zones emerge, marking critical points of strain localization.
In the plastic deformation region before the peak (e–g), the red zones enlarge. After the peak, micro-cracks appear increasingly interconnected, reflecting progressive crack growth and coalescence. Strain localization becomes dominant, with some regions showing very high strain concentration (red areas). The image on the top right (Figure 6ii), representing the picture of the sample at the end of the test, shows a visible, sub-vertical crack (red dot lines), confirming the strain localization observed in the strain map (point r).
Stick-slip stress drops in the post-peak region coincide with progressive failure mechanisms such as crack growth and fragmentation. The DIC strain maps illustrate a transition from early uniform strain distribution to highly localized deformation as failure progresses, correlating well with the stress–strain curve.
3.4.2. 3 Days of Acid Bath
Figure 7 shows the DIC maps of lateral strains obtained from a representative sample treated in a 3-day acid bath. As can be seen, in the early stages of loading and in the elastic deformation stage (around points a–c), the DIC strain maps show a uniform distribution of strain with only minor localized zones (blue, light blue, and green). The minimal concentration of strain indicates that the rock is undergoing elastic deformation, where stresses are distributed evenly, and few visible micro-cracks are initiated.
At points d–f, as the sample approaches its peak stress, strain localization begins to emerge in isolated regions. The strain maps show areas transitioning from cooler colors (blue/green) to warmer colors (light green/yellow), indicating an increase in strain magnitude. This suggests the initiation of micro-fractures, but these remain isolated and do not coalesce at this stage. Damage accumulation (points f–h), after the peak stress, strain concentration intensifies and distinct zones of red emerge in DIC maps, reflecting high strain areas where micro-fractures are actively growing and beginning to interact. This strain zones align with the sharp stress drop visible in the stress–strain curve, indicating that micro-fractures are beginning to coalesce, leading to localized weakening.
Following the peak stress (points i–l), the strain maps show extensive growth and coalescence of strain localization zones. The red zones become more interconnected, representing the transition from distributed micro-fracture damage to macroscopic cracks. The unstable growth of these interconnected fractures corresponds to the post-peak softening behavior in the stress–strain curve. In the final stages (m–p), strain maps exhibit fully developed interconnected strain zones, with large red regions indicative of major fracture planes. The post-failure fracture image (ii, red dot lines) shows a well-defined fracture surface that corresponds to the high-strain zones observed in the DIC maps, confirming the spatial accuracy of strain localization data.
In general, the progression from uniform strain distribution to localized high-strain zones highlights the role of microfractures in controlling the rock’s deformation behavior. The transition from isolated microfractures to interconnected fracture networks drives the peak and post-peak behavior.
3.4.3. 7 Days of Acid Bath
Figure 8 reports the strain maps of a representative sample of the 7-day acid bath group. Strain maps in Figure 8iii (points a–e) show uniform blue colouring except for a few localizations at c, indicating minimal deformation and relatively homogenous strain distribution, and no significant strain localization is observed. The strain map at peak stress (point f) begins to show localized light blue, green, and yellow zones, indicating the initiation of strain concentration. These regions correspond to stress localization, where microcracks may start to form. At post-peak failure (points g–l), strain maps display an increase in the intensity and spread of yellow and red zones, signifying the evolution of strain localization into prominent failure zones. This aligns with the sharp stress drop after peak stress. The strain maps (points m–q) show a well-defined red zone, highlighting the primary failure planes. These are regions of extreme deformation that align with the fracture observed in the physical sample (Figure 8ii, red dot lines).
In general, strain maps effectively track the progression of strain localization, starting from minimal deformation (blue) in the elastic stage to intense strain concentration (red) during and after failure. The labeled points on the curve (e.g., f, g, j, n, and q) correspond to critical stages in the strain maps, such as initiation, propagation, and stabilization of localized deformation zones.
3.4.4. 28 Days of Acid Bath
Figure 9 presents the stress–strain curve and the corresponding strain maps of a representative sample of the 28-day acid-bath group. The strain maps in the early stages of loading (up to point h) show predominantly blue regions, indicating uniform strain distribution throughout the sample. This uniformity reflects homogeneous deformation where no visible signs of localized strain are observed. The absence of concentrated strain zones implies that the material has not yet experienced severe damage or microcracking. At point i, corresponding to the post-peak stress, the strain maps show the first emergence of localized strain zones, indicated by the appearance of light blue, green, and yellow regions. These localized zones represent areas of stress concentration, leading to the microcrack initiation. By points j and k, these light blue, green, and yellow zones become more pronounced and start to expand and begin the strain localization. As the stress drops post-peak (l), the light blue, green, yellow, and red zones intensify and expand across the sample, forming distinct regions of concentrated strain. The maps clearly capture the evolution of micro-cracks into more organized patterns, indicative of damage propagation. At this stage, strain redistribution occurs where some areas experience low strain concentration while others exhibit an increase in strain concentration. The transition from distributed microcracking to macroscopic damage is evident. From points l–n, strain maps reveal the development of well-defined, slightly vertical light blue, green, yellow, and red bands characterized by continuous zones extending slightly vertically across the sample. In the final stages of loading (p–q), the strain maps stabilize, showing persistent light blue, green, yellow, and red zones along the concentrated bands. These high-strain regions correspond to the residual stress plateau, where frictional sliding dominates along the established fracture surface. The minimal redistribution of strain suggests that the sample has reached a fully damaged state with no further significant changes in the failure pattern. The labeled points on the stress–strain curve correspond directly to the strain maps, providing a detailed understanding of mechanical behavior at each stage of loading. For instance, point i marks the onset of strain localization, while point p reflects strain stabilization. The post-test image (ii, red dot lines) shows sub-vertical cracks, confirming the high strain zones on DIC strain maps (q).
3.4.5. 10 Freeze–Thaw Cycling
The horizontal strain DIC maps for one of the representative samples treated with 10 F-T cycles are shown and discussed in Figure 10. The DIC strain maps reveal the evolution of strain corresponding to points a-y on the stress–strain curves (Figure 10i). In the elastic region (a–d), the proportional increase in stress and strain, aside from minor stress fluctuations between points b and d, reflects a predominantly elastic response. At points e–g, deviation from linearity marks the initiation of microcrack formation. Between points g and k, and especially in the post-peak phase (l–y), the increased frequency and amplitude of stress fluctuations indicate dynamic crack propagation and the onset of structural instability.
The corresponding DIC strain maps (Figure 10iii) support these observations. From a–d, the maps display a uniform and low-intensity strain distribution (blue zones), consistent with elastic deformation. At points e–g, strain localization emerges as small red clusters, indicating concentrated deformation zones. In the later stages (l–y), these localized regions expand and merge, forming connected fracture paths. The high-intensity red areas signify severe strain accumulation and the progressive failure of the material.
Additionally, the physical fracture trace observed in the top-right image (Figure 10ii, red dot lines) aligns with the DIC-identified strain concentrations, especially at point y, providing visual confirmation of material breakdown due to intensive F-T-induced degradation.
3.4.6. Pre-Peak DIC Strain Evolution Comparison
Figure 11i–ix presents the stress–strain curves together with the corresponding DIC axial strain (εxx) maps, enabling a stage-by-stage interpretation of strain evolution up to the peak stress for all treatment groups. In the untreated sample (Figure 11iia), the initial loading stage is characterized by a broad range of strain intensities, visible as deep blue and light-blue regions representing low tension, emerging green zones, and scattered yellow, orange, and red spots indicating localized tensile strain development. At stage b, these yellow–orange–red tensile hotspots increase in both frequency and intensity, marking the onset of localized crack initiation. As loading progresses (stages c–g), these high-strain zones intensify and expand vertically, forming a relatively continuous tensile localization zone with inclined red patches that trace the developing macro-fracture.
The sample subjected to 10 freeze–thaw cycles exhibits a similar overall sequence of deformation, but with notable differences (Figure 11iv). Red tensile spots appear earlier in the loading path, indicating that microcrack networks formed during freeze–thaw cycling promote premature strain concentration. These hotspots intensify toward the peak stress, but the overall color saturation and spatial continuity of the high-strain zones are lower than in the untreated specimen, reflecting reduced tensile capacity and more fragmented localization due to freeze–thaw-induced microstructural damage.
The 3-day acid-treated sample follows a broadly similar trend to the freeze–thaw specimen, showing an early appearance of red tensile patches but with noticeably lower colour intensity (Figure 11vi). Strain localizes more diffusely, suggesting that early-stage dissolution weakens grain boundaries but does not yet generate strong or sharply defined tensile bands. After 7 days of acid exposure (Figure 11viii), the pattern remains similar, though the intensity of tensile strain becomes even weaker, and the strain field at all stages appears more muted, indicating progressive loss of tensile stiffness and reduced ability to develop concentrated fracture-opening strains.
The 28-day acid-exposed sample tends to enhance these characteristics. At stages b and c, isolated red and deep-blue spots appear simultaneously, suggesting highly heterogeneous and chemically driven weakening (Figure 11x). However, as loading approaches the peak, the strain distribution becomes diffused and low in intensity, lacking the strong tensile characteristic of mechanical cracking. Even at peak stress, a well-defined tensile fracture does not open.
4. Discussion
This study examined the degradation of Carrara marble under freeze–thaw (F–T) cycling and sulfuric acid weathering by integrating conventional mechanical testing with digital image correlation (DIC). The mechanical results demonstrate that both treatments significantly reduce strength and stiffness, with the elastic modulus showing greater sensitivity than UCS. Under acid exposure, the progressive reduction in stiffness indicates that dissolution-induced porosity and grain-boundary weakening impair elastic behavior before bulk strength loss occurs, consistent with previous findings [18,43]. Longer acid exposure reduces peak stress but increases deformation capacity, suggesting that dissolution softens the microstructure and allows more strain accumulation before collapse. Variability analysis reported a high heterogeneity in measured mechanical parameters. Untreated samples exhibit moderate UCS variability (~20% CV) and higher modulus variability (~40% CV), reflecting inherent microcracks and grain defects. Early acid exposure (3–7 days) leads to a slight reduction in both UCS and modulus variability, indicative of more uniform early-stage chemical weakening. After 28 days, UCS variability becomes notably high (47–83 MPa), likely due to heterogeneous dissolution, while F–T treated samples show more consistent strength reductions (41–46 MPa). Stiffness remains relatively uniform in acid-treated specimens but varies moderately in F–T samples, underscoring the distinct mechanisms of chemical dissolution versus microcrack-driven physical damage. Across all conditions, stiffness emerges as the most sensitive indicator of early microstructural degradation. Freeze–thaw cycling induces more severe mechanical deterioration, particularly in modulus, which declines more sharply than UCS due to the initiation and propagation of microcracks during repeated freezing and thawing. These results align with studies on carbonate rocks and sandstone [2,24,43,44], as well as the work of Wang et al. [45], who emphasized intergranular crack expansion in F–T cycled marble. The broader strain range observed in F–T samples suggests increased deformability despite reduced strength, reflecting progressive crack coalescence and cumulative microstructural damage. Similarly, Liu et al. [18] demonstrated that F–T cycling increases porosity and microfracture density in sandstone, leading to reductions in both strength and stiffness.
DIC observations provide complementary evidence of treatment-dependent deformation behavior and internal damage. Untreated samples exhibit sharply localized tensile strain bands at peak stress, indicating failure governed by the opening of macroscopically visible tensile cracks. In contrast, F–T treated samples show fragmented, patchy localization zones that frequently appear before peak stress, consistent with the activation and enlargement of pre-existing defects caused by freeze–thaw cycling. The stick–slip patterns observed in DIC maps denote unstable crack propagation and stress redistribution, in agreement with the mechanisms proposed by Wang et al [42]. The larger strain range in F–T samples reinforces the mechanical evidence of increased compliance and microcrack accumulation.
Acid-treated samples exhibit markedly reduced tensile strain concentrations at peak stress and often lack macroscopic tensile openings. This indicates that chemical alteration, not mechanical damage alone, governs the weakening. Dissolution of calcite and potential precipitation of secondary salts (e.g., gypsum) likely lowers fracture toughness, enabling failure at peak load even when tensile cracks are not yet visible (Figure 12(ie)). This is also consistent with previous studies on crack initiation and coalescence of cracks in gypsum and marble, which observed clear differences in the behavior of these two materials [46,47] and a usual post-peak position of DIC-revealed strain concentrations in gypsum (e.g., [34].
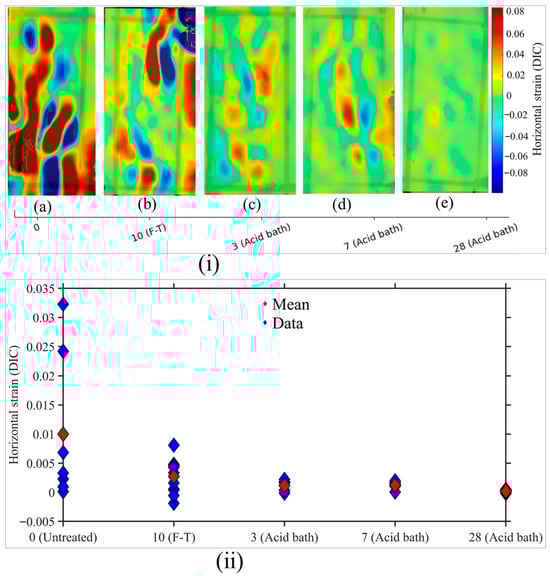
Figure 12.
DIC strain maps of marble specimens at the peak (i) and horizontal strain opening (ii): (a) untreated; (b) after 10 freeze–thaw cycles; (c) 3-day acid bath; (d) 7-day acid bath; (e) 28-day acid bath.
Quantitative strain data confirm these trends: the mean εxx at peak stress systematically decreases with increasing treatment severity, with untreated samples showing the highest tensile strain, followed by F–T samples, and finally acid-treated specimens, which show the lowest strain accumulation (Figure 12ii).
Overall, DIC and mechanical results consistently demonstrate that environmental treatments fundamentally modify both the magnitude and evolution of strain in marble. Untreated specimens show distinct and localized tensile cracking, F–T samples display early, and dispersed localization driven by microcrack growth, and acid-treated specimens exhibit strongly suppressed tensile strain due to dissolution-driven weakening. These combined findings highlight the distinct mechanical signatures of physical (F–T) and chemical (acid) weathering. These consistent patterns across both full-range and pre-peak strain maps confirm that environmental treatments fundamentally modify how strain initiates, evolves, and concentrates within the specimens.
The findings have important implications for marble’s durability in cold or acidic environments. Carrara marble exposed to such conditions exhibits reductions in stiffness and strength, compromising structural performance and aesthetic values. For heritage structures, sculptures, and architectural facades, these results highlight marble’s vulnerability to damage from environmental stressors. These underscore the need for preventive measures and conservation strategies.
Future research should extend the experimental framework to encompass longer freeze–thaw cycling and sequential physical–chemical weathering, thereby capturing more realistic degradation pathways. Mass and porosity measurement as well as advanced microstructural characterization techniques, including scanning electron microscopy (SEM) and X-ray micro-computed tomography (µCT), should be employed to quantify porosity evolution, crack density, and mineral dissolution with high spatial resolution. In addition, cycling acid exposure systems would better replicate environmental conditions, providing more representative insights into long-term durability and fracture evolution in carbonate rocks. Such integrated approaches will enable a more comprehensive understanding of the coupled mechanical and chemical processes driving deterioration, ultimately improving predictive models of rock performance under natural weathering scenarios.
5. Conclusions
This study investigates the mechanical degradation and deformation behavior of Carrara marble subjected to 10 freeze–thaw (F–T) cycles and sulfuric acid exposure (3, 7, and 28 days) using conventional mechanical testing and Digital Image Correlation (DIC). Both environmental stressors compromised the material’s integrity and altered its failure mechanisms, providing new insights into how Carrara marble deteriorates under thermal and chemical conditions.
Key Findings:
- Both freeze–thaw cycling and acid exposure produced clear reductions in the strength and stiffness of Carrara marble.
- Untreated marble exhibited high tensile fracture opening behavior characterized by a concentrated strain localization band at failure.
- Freeze–thaw–treated specimens developed heterogeneous and fragmented strain fields, with multiple high-strain zones indicative of extensive microcrack growth and early damage activation.
- Acid-treated samples showed delayed strain concentration and more diffuse, plastic-like deformation, reflecting dissolution-driven softening and suppressed tensile cracking.
- Digital image correlation effectively captured the progressive evolution of damage and clearly distinguished the strain evolution pattern across treatments, demonstrating a strong link between macroscopic strength loss and the development of treatment-dependent strain fields.
The results highlight marble’s susceptibility to both cold-climate and acidic environments, underscoring the importance of considering environmental durability in engineering design, material selection, and heritage conservation strategies. Despite these insights, the study is limited by its separate evaluation of freeze–thaw and acid weathering under controlled laboratory conditions, whereas natural environments typically involve coupled or sequential stressors. Additionally, acid exposure was primarily static, and DIC measurements captured only surface strain, providing no direct information on internal crack evolution or porosity changes. Future work should therefore examine combined F–T–acid weathering scenarios, incorporate dynamic acid flow to better simulate natural rainfall and runoff, increase the number and severity of environmental cycles, and employ advanced microstructural characterization techniques such as SEM and X-ray micro-CT to quantify internal deterioration processes with higher spatial resolution. Such integrated approaches will enable a more complete understanding of the mechanisms driving marble degradation and support the development of more effective conservation and durability assessment frameworks.
Author Contributions
Conceptualization, A.W. and C.C.; methodology, A.W.; software, A.W. and C.C.; validation, A.W., C.C., G.U. and A.M.F.; formal analysis, A.W.; investigation, A.W. and C.C.; resources, A.M.F.; data curation, A.W.; writing—original draft preparation, A.W.; writing—review and editing, A.W., C.C. and G.U.; visualization, A.W.; supervision, A.M.F.; project administration, A.M.F.; funding acquisition, A.M.F. All authors have read and agreed to the published version of the manuscript.
Funding
This research received no external funding.
Institutional Review Board Statement
Not applicable.
Informed Consent Statement
Not applicable.
Data Availability Statement
The original contributions presented in this study are included in the article. Further inquiries can be directed to the corresponding author.
Conflicts of Interest
The authors declare no conflicts of interest.
References
- Calvo, J.P.; Regueiro, M. Carbonate Rocks in the Mediterranean Region—From Classical to Innovative Uses of Building Stone. Geol. Soc. Lond. Spec. Publ. 2010, 331, 27–35. [Google Scholar] [CrossRef]
- Guler, S.; Türkmenoğlu, Z.F.; Varol, O.O. Thermal Shock and Freeze-Thaw Resistance of Different Types of Carbonate Rocks. Int. J. Rock Mech. Min. Sci. 2021, 137, 104545. [Google Scholar] [CrossRef]
- Vagnon, F.; Costanzo, D.; Ferrero, A.M.; Migliazza, M.R.; Pastero, L.; Umili, G. Simulation of Temperature and Chemical Weathering Effect on Marble Rocks; IOP Publishing Ltd.: Bristol, UK, 2021; Volume 833. [Google Scholar]
- Siegesmund, S.; Menningen, J.; Shushakova, V. Marble Decay: Towards a Measure of Marble Degradation Based on Ultrasonic Wave Velocities and Thermal Expansion Data. Environ. Earth Sci. 2021, 80, 395. [Google Scholar] [CrossRef]
- Bonazza, A.; Sabbioni, C.; Messina, P.; Guaraldi, C.; De Nuntiis, P. Climate Change Impact: Mapping Thermal Stress on Carrara Marble in Europe. Sci. Total Environ. 2009, 407, 4506–4512. [Google Scholar] [CrossRef]
- Lobarinhas, R.; Dionísio, A.; Paneiro, G. High Temperature Effects on Global Heritage Stone Resources: A Systematic Review. Heritage 2024, 7, 6310–6342. [Google Scholar] [CrossRef]
- Song, Z.; Wang, Y.; Konietzky, H.; Cai, X. Mechanical Behavior of Marble Exposed to Freeze-Thaw-Fatigue Loading. Int. J. Rock Mech. Min. Sci. 2021, 138, 104648. [Google Scholar] [CrossRef]
- Yan, Y.; Wang, Y. A Review of Atmospheric Deterioration and Sustainable Conservation of Calcareous Stone in Historical Buildings and Monuments. Sustainability 2024, 16, 10751. [Google Scholar] [CrossRef]
- Matsuoka, N. Frost Weathering and Rockwall Erosion in the Southeastern Swiss Alps: Long-Term (1994–2006) Observations. Geomorphology 2008, 99, 353–368. [Google Scholar] [CrossRef]
- Deprez, M.; De Kock, T.; De Schutter, G.; Cnudde, V. A Review on Freeze-Thaw Action and Weathering of Rocks. Earth Sci. Rev. 2020, 203, 103143. [Google Scholar] [CrossRef]
- Martínez-Martínez, J.; Benavente, D.; Gomez-Heras, M.; Marco-Castaño, L.; García-Del-Cura, M.Á. Non-Linear Decay of Building Stones during Freeze–Thaw Weathering Processes. Constr. Build. Mater. 2013, 38, 443–454. [Google Scholar] [CrossRef]
- Steiger, M. Crystal Growth in Porous Materials—I: The Crystallization Pressure of Large Crystals. J. Cryst. Growth 2005, 282, 455–469. [Google Scholar] [CrossRef]
- Taber, S. The Mechanics of Frost Heaving. J. Geol. 1930, 38, 303–317. [Google Scholar] [CrossRef]
- Winkler, E.M. Frost Damage to Stone and Concrete: Geological Considerations. Eng. Geol. 1968, 2, 315–323. [Google Scholar] [CrossRef]
- Huang, C.; Zhu, C.; Ma, Y. Investigating Mechanical Characteristics of Rocks Under Freeze–Thaw Cycles Using Grain-Based Model. Rock Mech. Rock Eng. 2025, 58, 603–622. [Google Scholar] [CrossRef]
- Khanlari, G.; Sahamieh, R.Z.; Abdilor, Y. The Effect of Freeze–Thaw Cycles on Physical and Mechanical Properties of Upper Red Formation Sandstones, Central Part of Iran. Arab. J. Geosci. 2015, 8, 5991–6001. [Google Scholar] [CrossRef]
- Park, K.; Kim, K.; Lee, K.; Kim, D. Analysis of Effects of Rock Physical Properties Changes from Freeze-Thaw Weathering in Ny-Ålesund Region: Part 1-Experimental Study. Appl. Sci. 2020, 10, 1707. [Google Scholar] [CrossRef]
- Liu, Y.; Zhai, M.; Liu, W. Mechanical Properties and Energy Evolution Law of Marble under the Coupled Effects of Chemical Corrosion and Dry-Wet Cycles. PLoS ONE 2024, 19, e0313359. [Google Scholar] [CrossRef]
- Faramarzi, L.; Dehghani, B.; Azhari, A. Influences of Freezing and Thermal Cyclic Loading on Physical and Mechanical Properties of Marble. Int. J. Geo-Eng. 2025, 16, 2. [Google Scholar] [CrossRef]
- Wu, J.; Lu, Y.; Wang, K.; Cai, Y.; Xiao, C. Combined Effects of Freeze–Thaw Cycles and Chemical Corrosion on Triaxial Mechanical Properties of Sandstone. Geomech. Geophys. Geo-Energy Geo-Resour. 2023, 9, 57. [Google Scholar] [CrossRef]
- Fan, L.; Xu, C.; Wu, Z. Effects of Cyclic Freezing and Thawing on the Mechanical Behavior of Dried and Saturated Sandstone. Bull. Eng. Geol. Environ. 2020, 79, 755–765. [Google Scholar] [CrossRef]
- Hou, C.; Jin, X.; He, J.; Li, H. Experimental Studies on the Pore Structure and Mechanical Properties of Anhydrite Rock under Freeze-Thaw Cycles. J. Rock Mech. Geotech. Eng. 2022, 14, 781–797. [Google Scholar] [CrossRef]
- Zhang, J.; Yang, X.; Chen, B.; Wang, X.; Hu, G.; Tao, N.; Sun, J. Study of the Freeze–Thaw Weathering’s Influence on Thermal Properties of Stone Artifacts. Atmosphere 2023, 14, 666. [Google Scholar] [CrossRef]
- Wang, Y.; Yang, H.; Zhu, C.; Gao, S. On the Fracture Evolution and Instability of Pyrite-Filled Marble Exposed to Freeze-Thaw-Compression Loads. Lithosphere 2021, 2021, 7599916. [Google Scholar] [CrossRef]
- Cheng, H.; Yang, X.; Pei, Y.; Song, Y. Quantitative Investigation on the Heterogeneity of Deformation Fields in Sandstone Pre-Existing Cracks during Damage Evolution. Sci. Rep. 2022, 12, 5951. [Google Scholar] [CrossRef]
- Zhang, H.; Nath, F.; Parrikar, P.N.; Mokhtari, M. Analyzing the Validity of Brazilian Testing Using Digital Image Correlation and Numerical Simulation Techniques. Energies 2020, 13, 1441. [Google Scholar] [CrossRef]
- Aly Abdelhamid, M.M.; Li, D.; Ren, G. Predicting Unconfined Compressive Strength Decrease of Carbonate Building Materials against Frost Attack Using Nondestructive Physical Tests. Sustainability 2020, 12, 1379. [Google Scholar] [CrossRef]
- Chai, J.; Liu, Y.; Ouyang, Y.B.; Zhang, D.; Du, W. Application of Digital Image Correlation Technique for the Damage Characteristic of Rock-like Specimens under Uniaxial Compression. Adv. Civ. Eng. 2020, 2020, 8857495. [Google Scholar] [CrossRef]
- Li, D.; Li, B.; Han, Z.; Zhu, Q.; Liu, M. Evaluation of Bi-Modular Behavior of Rocks Subjected to Uniaxial Compression and Brazilian Tensile Testing. Rock Mech. Rock Eng. 2021, 54, 3961–3975. [Google Scholar] [CrossRef]
- Wubalem, A.; Caselle, C.; Taboni, B.; Umili, G. Effects of Rock Texture on Digital Image Correlation. Geosciences 2025, 15, 145. [Google Scholar] [CrossRef]
- Zhang, Y.; Sun, B.; Ren, Y. Full-Field Deformation Evolution Characteristics of Freeze-Thawed Fault Zone Rock Mass Revealed by Digital Image Correlation: A Lab-Scale Investigation. Front. Mater. 2025, 12, 1615128. [Google Scholar] [CrossRef]
- Coli, M.; Criscuolo, A. The Carrara Marble: Geology, Geomechanics and Quarrying; IOP Publishing Ltd.: Bristol, UK, 2021; Volume 833. [Google Scholar]
- Rutter, E.; Wallis, D. Application of Electron Backscatter Diffraction to Calcite-Twinning Paleopiezometry. Geosciences 2022, 12, 222. [Google Scholar] [CrossRef]
- ASTM D7012-14; Standard Test Method for Compressive Strength and Elastic Moduli of Intact Rock Core Specimens under Varying States of Stress and Temperatures. ASTM International: West Conshohocken, PA, USA, 2014.
- UNI EN 1367-1; Tests for Thermal and Weathering Properties of Aggregates: Part 1—Determination of Resistance to Freeze and Thawing. Ente Nazionale Italiano di Unificazione (UNI): Milan, Italy, 2007.
- Blaber, J.; Adair, B.; Antoniou, A. Ncorr: Open-Source 2D Digital Image Correlation Matlab Software. Exp. Mech. 2015, 55, 1105–1122. [Google Scholar] [CrossRef]
- Caselle, C.; Umili, G.; Bonetto, S.; Ferrero, A.M. Application of DIC Analysis Method to the Study of Failure Initiation in Gypsum Rocks. Geotech. Lett. 2019, 9, 35–45. [Google Scholar] [CrossRef]
- Ferrero, A.M.; Migliazza, M.R. Theoretical and Numerical Study on Uniaxial Compressive Behaviour of Marl. Mech. Mater. 2009, 41, 561–572. [Google Scholar] [CrossRef]
- Stirling, R.A.; Simpson, D.J.; Davie, C.T. The Application of Digital Image Correlation to Brazilian Testing of Sandstone. Int. J. Rock Mech. Min. Sci. 2013, 60, 1–11. [Google Scholar] [CrossRef]
- Caselle, C.; Umili, G.; Bonetto, S.; Costanzo, D.; Ferrero, A.M. Evolution of Local Strains Under Uniaxial Compression in an Anisotropic Gypsum Sample. In Lecture Notes in Civil Engineering; Springer: Berlin/Heidelberg, Germany, 2020; Volume 40. [Google Scholar] [CrossRef]
- Pan, B.; Asundi, A.; Xie, H.; Gao, J. Digital Image Correlation Using Iterative Least Squares and Pointwise Least Squares for Displacement Field and Strain Field Measurements. Opt. Lasers Eng. 2009, 47, 865–874. [Google Scholar] [CrossRef]
- Caselle, C.; Bonetto, S.; Costanzo, D. Crack Coalescence and Strain Accommodation in Gypsum Rock. Frat. Ed Integrita Strutt. 2020, 14, 247–255. [Google Scholar] [CrossRef]
- Tao, M.; Wang, J.; Zhao, H.; Peng, K.; Shi, Y.; Cao, W. The Influence of Acid Corrosion on Dynamic Properties and Microscopic Mechanism of Marble. Geomech. Geophys. Geo-Energy Geo-Resour. 2022, 8, 36. [Google Scholar] [CrossRef]
- Ondrasina, J.; Kirchner, D.; Siegesmund, S. Freeze-Thaw Cycles and Their Influence on Marble Deterioration: A Long-Term Experiment. Geol. Soc. Spec. Publ. 2002, 205, 9–18. [Google Scholar] [CrossRef]
- Wang, M.; Shao, X.; Sun, Q.; Han, J. Degradation of Physico-Mechanical Properties and Damage Mechanisms of Sandstone under the Combined Action of Freeze–Thaw Cycles, Chemical Solution, and Compressive Stress. Cold Reg. Sci. Technol. 2024, 217, 104017. [Google Scholar] [CrossRef]
- Wong, L.N.Y.; Einstein, H.H. Crack Coalescence in Molded Gypsum and Carrara Marble: Part 2—Microscopic Observations and Interpretation. Rock Mech. Rock Eng. 2009, 42, 513–545. [Google Scholar] [CrossRef]
- Wong, L.N.Y.; Einstein, H.H. Crack Coalescence in Molded Gypsum and Carrara Marble: Part 1—Macroscopic Observations and Interpretation. Rock Mech. Rock Eng. 2009, 42, 475–511. [Google Scholar] [CrossRef]
Disclaimer/Publisher’s Note: The statements, opinions and data contained in all publications are solely those of the individual author(s) and contributor(s) and not of MDPI and/or the editor(s). MDPI and/or the editor(s) disclaim responsibility for any injury to people or property resulting from any ideas, methods, instructions or products referred to in the content. |
© 2025 by the authors. Licensee MDPI, Basel, Switzerland. This article is an open access article distributed under the terms and conditions of the Creative Commons Attribution (CC BY) license (https://creativecommons.org/licenses/by/4.0/).