Abstract
The cementation medium for ureolytic microbially induced calcium carbonate precipitation (MICP) typically consists of urea and a calcium source. While some studies have augmented this basic medium, the effects of adding substrates such as ammonium chloride are unclear. The studies detailed in this paper sought to quantify the effect of the ammonium chloride augmentation of cementation medium (CM) on the process of MICP. An aqueous MICP study was initially carried out to study the effects of adding ammonium chloride to the urea–calcium cementation medium. This batch test also explored the effect of varying the concentration of calcium chloride dihydrate (calcium source) in the CM. A subsequent sand column study was undertaken, whereby multiple treatments of CM were injected over several days to produce a biocement. Six columns were prepared using F65 sand bioaugmented with Sporosarcina pasteurii, half of which were injected with the basic medium only and half with the augmented medium for treatment two onwards. Effluent displaced from columns was tested using ion chromatography and Nesslerisation to determine the calcium and ammonium ion concentrations, respectively, and hence the treatment efficiency. Conductivity and pH testing of effluent gave insights into the bacterial urease activity. The addition of 0.187 M ammonium chloride to the CM resulted in approximately 100% chemical conversion efficiency within columns, based on calcium ion measurements, compared to only 57% and 33% efficiency for treatments three and four, respectively, when using the urea–calcium medium. Columns treated with the CM containing ammonium chloride had unconfined compressive strengths which were 1.8 times higher on average than columns treated with the urea–calcium medium only.
1. Introduction
The biogeochemical process of microbially induced calcium carbonate precipitation (MICP) has been studied as an innovative and potentially sustainable method of improving the properties of soil and geotechnical structures. The precipitated calcium carbonate binds soil particles together, with the resulting material referred to as a biocement. The traditional method of cementing soil particles involves the mixing of Portland cement and soil to create a soil-cement. The manufacture of Portland cement contributes to global warming through the release of CO2 [1,2,3]. Producing one tonne of Portland cement releases roughly one tonne of CO2 into the atmosphere; the cement industry accounts for seven to eight percent of human-produced CO2 emissions [4]. Soil-cement obtains its stability primarily by the hydration of cement and not by cohesion and internal friction [5]. For this reason, such mixtures are susceptible to swelling, which is undesirable. In contrast, the strength of an MICP cemented soil is obtained by cohesion between the soil particles achieved via the calcium carbonate bonds. The inter-particle binding, in addition to pore filling by the precipitated calcium carbonate, resulted in improved soil strength and stiffness and reduced permeability [6].
The process of MICP requires a suitable bacterium, along with nutrients to feed the bacteria and the precursor chemicals for the MICP process. These precursor chemicals are often referred to as the cementation medium (CM). The basic constituents of the cementation medium, in function of the precursor chemicals used, will depend upon the metabolic pathway by which MICP transpires. MICP may occur through a variety of metabolic pathways; including photosynthesis [7], ureolysis [8,9,10], the ammonification of amino acids [11], denitrification (microbially induced desaturation and precipitation) [12,13] and methane oxidation [14], in addition to sulphate reduction and iron reduction [15]. The ureolysis or urea hydrolysis is the most efficient process among all MICP methods, as it has the potential to produce a large amount of calcite (CaCO3) within a short period of time [16], and hence is of particular interest for Engineering applications. The ureolytic pathway has hence been selected for this study and has been widely studied for engineering applications of MICP.
Biocementation via ureolysis requires urea and a calcium source as the basic constituents of the cementation medium. Calcium chloride or calcium chloride dihydrate is typically selected as the calcium source. Ureolysis increases the alkalinity of fluid in sand/soil pore spaces as a result of the degradation of urea to carbonate and ammonium, and induces calcium carbonate precipitation. The chemical process, as reported by De Belie [17], is outlined in Equations (1)–(6). Active ureolytic bacteria produce urease enzyme, which catalyses the hydrolysis of urea, resulting in the production of carbamate (NH2COOH) and ammonia (NH3), as per Equation (1). Carbamate spontaneously hydrolyses to produce ammonia and carbonic acid (Equation (2)). Simultaneously, in the presence of water, the ammonia and carbonic acid products equilibrate to produce ammonium (NH4+), hydroxide (OH−) (Equation (3)) and carbonate (CO32−) ions (Equation (4)). This results in a pH increase and increased alkalinity of the reaction medium. Since carbonic is a weak acid, it will only partially dissociate into ions, until equilibrium is reached.
The global reaction can be written as per Equation (5), summarising Equation (1) to Equation (4). In the presence of calcium, in an alkaline environment, calcium carbonate is precipitated at nucleation sites (Equation (6)).
The nucleation sites include sand or other soil participles, as well as the bacteria themselves. Calcium carbonate (CaCO3) can deposit at the soil particles’ contact area (contact-cementing), coat soil particles (grain-coating), or create a cementation bridge between soil grains (matrix-supporting) [18].
While many studies on the engineering applications of MICP use a basic urea–calcium source medium to achieve biocementation via ureolysis, a small number of studies have also included additional substrates such as ammonium chloride in the cementation medium [8,19,20,21,22,23,24,25]. There is, however, a lack of clarity in terms of the effects of this augmentation of the basic urea–calcium medium and hence a lack of justification for the use of additional substrates such as ammonium chloride. In addition to ammonium chloride, some studies also include a small amount of sodium chloride in the cementation medium. One of the first studies in this field by Stocks-Fischer et al. [19], and subsequently research by Al Qabany and Soga [20] and Montoya and Dejong [26], also included 2.12 g/L sodium bicarbonate in the cementation medium. Sodium bicarbonate is reported to stabilise the pH of the cementation solution prior to injections [20]. It is also likely that adding 0.025 M sodium bicarbonate may cause precipitation to occur earlier, as the cementation medium solution will be supersaturated from the start. Effects of the addition of ammonium chloride to the cementation medium have not specifically been reported; hence, there is a lack of justification for the use of this additional substate in MICP treatments.
This paper reports on studies undertaken to investigate the effect on the multiple-treatment MICP process of augmentation of the basic urea–calcium cementation medium with ammonium chloride and a small quantity of sodium chloride. The multiple treatment process is of interest within the context of engineering since numerous MICP treatments are required to achieve the desired levels of soil improvement. This study gives further insight into the optimum cementation medium for the multiple treatment MICP process, to achieve biocementation via ureolysis. This study aimed to quantify the effects of the augmentation of cementation medium with ammonium chloride, and thus further the development of more efficient biocementation treatments. This research builds upon results of prior studies on the development of a microbially mediated self-healing biocement for geotechnical infrastructure and the enhancement of biocement through the incorporation of additives [27,28]. The prior study by Spencer et al. [27] utilised a cementation medium augmented with ammonium chloride, following on from studies by Botusharova [29].
The concentration of the calcium source, and hence calcium chloride dihydrate for this study, also needs to be taken into consideration when investigating the effects of augmenting the cementation medium. An aqueous MICP batch study was first undertaken using Sporosarcina pasteurii and cementation media prepared with and without ammonium chloride to (1) explore the effect of varying the calcium concentration on the MICP process and (2) obtain a preliminary insight into the effects of the ammonium chloride addition. This brief 24 h study was undertaken to ascertain whether more a more in-depth columns study would be justified. These initial findings would also provide feed into the columns study in function of the selection of a suitable calcium concentration for use in the cementation medium. The findings suggested that a 0.5 M calcium concentration would be suitable, and enable a comparison with prior studies which used this same concentration. A subsequent sand column study was undertaken to determine the effects of augmenting the cementation medium when columns containing Sporosarcina pasteurii were injected with four treatments of cementation media over a 120 h period. The aim of the columns study was to (1) quantify the effects of using the augmented cementation medium and (2) determine how these effects changed over time during the course of the MICP treatment process. Findings would give further insights into improving resource use efficiency in MICP treatments. Furthermore, a reduction in the use of Portland cement for the stabilisation of soil, for applications such as road bases [30], will contribute to achieving the UN Sustainable Development Goals.
2. Materials and Methods
2.1. Bacterial Culture
Sporosarcina pasteurii was obtained from the American Type Culture Collection, USA, (ATCC 11859, ACDP Group 1) as a freeze-dried culture and used to produce a stab culture (working stock) for storage at 4 °C. Growth media were prepared as per Table 1, using deionised water. Sterilisation was achieved by autoclaving solutions without urea at 120 °C for 20 min, then adding a 20 g/L urea solution aseptically using a 0.2 µm syringe filter. The working bacterial stocks were streaked onto plates of LB agar amended with 20 g/L urea [31]. The sealed plates were left at 23 °C room temperature for 48 h. Single colonies from these plates were used to inoculate liquid growth medium, prepared in triplicate in 50 mL quantities using 250 mL Erlenmeyer flasks. The flasks were shaken at 23 °C, 150 rpm, until a late-exponential phase of bacterial growth was reached. The resulting liquid broth cultures were used as an inoculant to produce larger quantities of liquid broth cultures used in the experimental studies.

Table 1.
Growth media constituents.
To produce the liquid broth cultures used in the batch and columns studies, flasks of sterile liquid broth were prepared and inoculated with 100 µL of the aforementioned liquid broth culture, per 50 mL of growth medium. These cultures were aerobically grown at 23 °C, 150 rpm, until an optical density at a wavelength of 600 nm (OD600) of 0.9–1.2 was obtained. Optical density, as an indication of biomass concentration, was measured using a spectrophotometer (Hach DR 6000, Loveland, CO, USA).
The urease activity of the liquid broth culture (mM urea hydrolysed/min) was calculated as per Equation (7), in accordance with the relationship derived by Whiffin [9], based on a conductivity assay.
Upon adding 9 mL of 1.1 M sterile urea solution to a 1 mL sample of the liquid broth culture, conductivity was measured over five minutes, to obtain the average urease activity per minute, as per Harkes et al. [32]. This measurement was repeated three times for each tested sample and an average was taken from the three results.
2.2. MICP Batch Test
An aqueous MICP study was initially carried out over a 24 h period at an ambient room temperature of 23 °C to test the effects of adding ammonium chloride and sodium bicarbonate to the urea–calcium cementation medium. This test also explored the effect of varying the concentration of the calcium source. The calcium source used in the CM was calcium chloride dihydrate.
Liquid broth cultures of S. pasteurii were produced for this test, as per Section 2.1, using four 250 mL Erlenmeyer flasks. The individual liquid broth cultures were transferred to a sterile 500 mL Erlenmeyer flask. The liquid culture was gently shaken to ensure an even distribution of bacteria and poured into 16 × 50 mL sterile polypropylene centrifuge tubes, in 10 mL quantities. These tubes were centrifuged at 5000 rpm for 20 min to pelletise the bacteria, after which the supernatant was drained. The polypropylene tubes were weighed and labelled prior to use. A small amount of autoclave-sterilised phosphate-buffered saline (PBS) was added using a sterile pipette tip to each tube to make the quantities of bacterial suspension up to 5 mL and to enable the bacteria cells to be dispersed using a pipette, prior to the addition of the cementation medium. Two sets of eight polypropylene tubes containing varying concentrations of cementation medium components were prepared, as per Table 2. This duplication would test the reproducibility of the procedures developed and improve the accuracy of results.

Table 2.
Contents of tubes prepared for batch test to test the effect of the augmentation of the cementation medium with ammonium chloride and sodium bicarbonate.
Individual flasks of cementation medium were prepared for each pair of tubes. The concentration of these media was initially prepared to be double that given in Table 2 to achieve the concentrations given in this table, since this CM would be diluted by the PBS solution. Then, 5 mL of cementation medium was added to each set of tubes, with the resulting concentrations of the medium components given in Table 2. Tubes were then gently mixed using a vortex mixer, transferred to large beakers to keep these upright and incubated at 23 °C, 150 rpm for 24 h. The cementation medium for tubes 9a–10b was added to empty sterile centrifuge tubes, which did not contain the inoculant, and was otherwise subjected to the same treatment as per the inoculated tubes.
Following 24 h of incubation, the tubes were centrifuged at 5000 rpm to separate out the precipitate and supernatant. The pH and electrical conductivity of the drained supernatant was measured. The tubes were then transferred to an oven to dry the contents at 105 °C for 24 h. After cooling, the tubes were weighed to determine the mass of precipitate, whilst the mass of bacteria was assumed negligible at this stage.
2.3. Columns Test
2.3.1. Materials
Fine F65 sand (US Silica, Ottawa plant, Ottawa, IL, USA) was selected for this study. The optimum grain size for MICP was 0.005 mm–0.4 mm [33]. Particle size distribution tests were conducted in accordance with ASTM D6913/D6913M-17 [34], to verify the product data provided by US Silica, in addition to the Proctor compaction tests in accordance with ASTM D1557-12 [35], to establish target density for the sand columns. Properties of the F65 sand as reported by U.S. Silica Company are given in Table 3. Prior to use in the experiments, the F65 sand was sterilised by autoclaving at 120 °C for 20 min and oven dried at 105 °C. Since the sand was found to have negligible calcium carbonate content when tested using a Calcimeter, no further treatment of this material was required.

Table 3.
General properties of US silica foundry sand.
2.3.2. Preparation of Cementation Medium
Two variations of the cementation medium (CM) were produced for the columns test, as per Table 4, these being CM1a and CM2a. For consistency, a sufficient quantity of each medium used was prepared in one batch at the start of the test. The basic constituents of the CM, as required for the process of MICP, are urea and a calcium source. Calcium chloride dihydrate was selected as the calcium source for this study. A slightly higher molarity of urea was used in comparison to the calcium chloride dihydrate to help ensure that all of the calcium can be utilised. (Oxoid CM0001, Thermo Scientific, Basingstoke, UK) was added to the CM as the nutrient source to promote ongoing bacterial growth during treatment. CM1a consisted of 0.67 M urea and 0.50 M calcium chloride dihydrate, in addition to 3 g/L Oxoid CM0001. CM1a was also used for the bacterial fixation treatment, to fix the bacteria to the sand within the columns. CM2a contained the same concentration of urea, calcium chloride dihydrate and quantity of Oxoid CM0001 as CM1a with the addition of 0.187 M Ammonium chloride and 0.0252 M sodium bicarbonate. The concentrations of ammonium chloride and sodium bicarbonate used were as per studies by Stocks-Fischer et al. [19] and the prior study by Spencer et al. [27].

Table 4.
Cementation medium components and sterilisation methods used for columns test.
The cementation media were prepared using tap water. CM1a was produced by first autoclaving a solution containing calcium chloride dihydrate and Oxoid CM0001, into which a urea solution was syringe filtered. To prepare 2.0 L of CM2a, a 1.6 L solution of ammonium chloride and Oxoid CM0001 was prepared using tap water and adjusted to pH 6.0 using 2.0 M HCl. Calcium chloride dihydrate was then added to this solution in the solid powder form. The pH adjustment prevented the calcium precipitating out into the solution after the calcium chloride addition. This solution was autoclaved and then made up to 2.0 L by adding a solution containing 40 g/L urea and 2.12 g/L sodium bicarbonate using a 0.2 µm syringe filter in close proximity to a Bunsen burner.
2.3.3. Column Assembly
Columns were assembled as shown in Figure 1. Each column was prepared with 143 g of F65 sand, with an approximately 1:2 diameter to depth ratio, as required for samples to be subjected to the UCS test in accordance with BS 1377-7:1990 [36]. Two sets of columns were prepared in triplicate for greater accuracy in the results. The prepared columns had an average length of 75.3 ± 0.6 cm and average diameter of 38.7 ± 0.7 mm. Prior to use, the apparatus was sterilised, either by autoclaving or washing with 1% Virkon solution and rinsing with autoclaved deionised water.
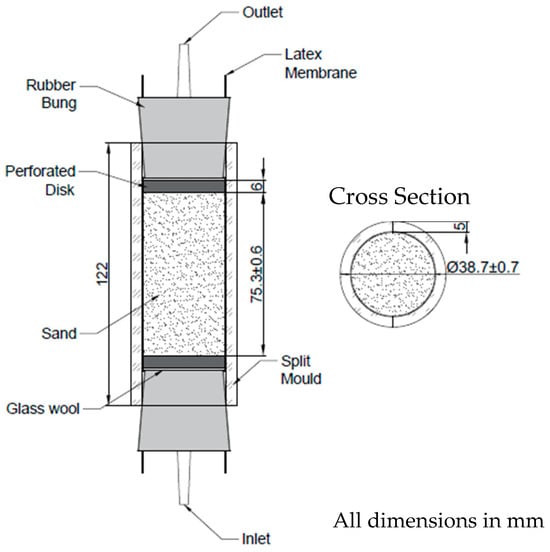
Figure 1.
Column assembly.
Each sand column was enclosed by a 150 mm long, 38 mm diameter, 0.3 mm thick latex membrane (Controls Group), encased by clear perspex split moulds of 5 mm thickness and approximately 39 mm inner diameter. To prepare the columns, split moulds were secured together using cable ties and latex sleeves were placed inside the moulds, with the ends wrapped over the sides. Perforated 3D printed plastic disks (6 mm depth, 38 mm diameter) wrapped with glass wool were placed into the inlet ends of the moulds, inside the membrane, followed by the inlet bung plugged with a temporary 3.99 mm × 8 mm silicone tapered plug. The latex membrane was then wrapped around the inlet bung. The glass wool around the perforated disk prevented the washout of fine grains of sand during treatments and provided a gap between the bung and perforated disk.
Columns were filled one by one. A small beaker was used to keep the columns vertical while filling. A funnel held by a clamp was positioned above the top of the column, leaving 1.5 cm between the funnel and column edge. A lit Bunsen was placed nearby to minimise potential contamination. Then, 35 mL of sterile CM1a was poured inside the latex sleeve, into which the sand was then wet pluviated. Columns were vibrated three times during the filling process, using a vortexer to aid compaction. Once filled, a second perforated disk, also wrapped with glass wool, was then placed into the outlet end of the column and the outlet bung firmly inserted. The latex membrane was then wrapped around the outlet bung. The column was then transferred to a frame consisting of 30 × 60 cm pegboard, with metal feet attached, onto which up to six columns could be secured using rubber tipped clamps. This process was repeated for each column.
2.3.4. Bioaugmentation and CM Treatments
Liquid broth cultures were produced as detailed in Section 2.1, using five 250 mL Erlenmeyer flasks. A total of 210 mL of liquid broth culture was required for the columns study. A sterile 500 mL Erlenmeyer flask was used to combine the liquid broth culture from individual flasks. After gently mixing, this was poured into six 50 mL polypropylene tubes, each containing 35 mL of the liquid broth culture and subsequently centrifuged at 5000 rpm for 20 min. Of the remaining liquid broth, samples were taken to measure the urease activity, in addition to measuring the optical density. The supernatant was then removed from the centrifuged tubes. The pelletised bacteria were resuspended in PBS, with 10 mL PBS added to each tube, and dispersed using a pipette to produce the bacterial suspension for injection into columns.
The individual tubes of bacterial suspension were injected upwards into all columns simultaneously, using a multichannel peristaltic pump and a pumping rate of 1.5 mL/min, immediately followed by one and a half pore volumes of CM1a, to fix bacteria within columns. Cementation media consisting of urea and calcium chloride dihydrate were found to be particularly effective for fixing bacteria to sand [32]. The outlet tubing from columns was then disconnected, drained and reconnected. The inlet tubing was clamped and disconnected from the pump tubing following each treatment. On each of the subsequent three days, approximately one and a half pore volumes of CM2a were pumped upwards through the columns, as per the schedule detailed in Table 5. This assumes a pore volume of approximately 30 mL. On day eight, the columns were flushed with tap water prior to UCS testing; to ensure testing would be unaffected by any remaining substrates. The timing between treatments was determined by previous studies, based on activity in columns containing biocemented sand. While injecting columns with CM, the effluent was collected in a series of 5 mL quantities in 15 mL polypropylene tubes. Once testing was completed, effluent was disposed of in accordance with local requirements.

Table 5.
Treatment schedule for columns test.
2.3.5. Measurement of Conductivity, pH of Effluent and Bacterial Fixing Effectiveness
For each 5 mL of column effluent displaced and collected during CM injections, the conductivity and pH were measured using a Consort multi-parameter analyser C3010, pH probe and conductivity probe with temperature compensation. The measurement of pH and electrical conductivity provides an indication of the extent of substrate conversion and hence bacterial/urease activity. On day one of the treatment process, a 1 mL sample of effluent from the 5–10 mL sample from each column was taken to measure the optical density, using a spectrophotometer at a wavelength of 600 nm. The optical density measurement gives an indication of biomass concentration and can therefore be used to determine the effectiveness of bacteria fixing. The first 5 mL (0–5 mL) was not used since this may include unreacted substrates that were retained in the column outlet bung after treatment.
2.3.6. Geochemical Analysis—Calcium Ion Concentration
The calcium ion concentration of the columns’ effluent was measured using an ion chromatograph (IC, Thermo Scientific Dionex ICS 5000+, Thermo Fisher Scientific, Waltham, MA, USA). Dionex ICS 5000+ Cation analysis was conducted using 20 mM methanesulfonic acid eluent starting concentration, on a Dionex CS12A column, using 112 mA suppressor output. The calcium ion concentration was measured as a means of quantifying the chemical conversion efficiency and hence the efficiency of each MICP treatment. The effluent from between 5 mL and 20 mL of displaced effluent were mixed for each column to obtain a representative average calcium ion concentration for each column. The effluent beyond this point was not tested since this may contain unreacted substrates from the new medium injected at later stages in the treatment process. Pore volumes within columns decrease as these become filled with calcium carbonate precipitate. To ensure the accuracy of the test results, samples of effluent were tested within two hours of collection. Prior to cation measurement, all effluent samples were syringe filtered, using a 0.2 µm syringe filter. Samples were diluted before testing, to ensure that the measured concentrations did not exceed 100 mg/L and were otherwise not below the detection limit.
2.3.7. Colorimetric Determination of Ammonium Ion Concentration
The colorimetric method was used to determine the ammonium ion concentration, given inaccuracies which may arise in ammonium ion measurement when using the suppressor method of ion chromatography [37]. Samples of columns effluent were diluted to be in the range of 0–0.5 mM prior to testing and tested within 2 h of collection. Firstly, an ammonium chloride stock solution was prepared, 1.0 mL = 1.0 mg NH3-N, by dissolving 3.819 g NH4Cl in deionised water so that the total volume was 1 L. This was used to prepare an ammonium chloride standard solution, 1.0 mL = 0.01 mg NH3-N, by diluting 10.0 mL of the stock solution in 1.0 L deionised water [38].
The ammonium chloride standard solution was used to prepare a series of dilutions ranging from 0 to 2 mg/L concentrations of ammonium chloride, to produce a calibration curve. The blank contained deionised water and 100 µL of Nessler’s reagent NH3-N (VWR chemicals). Then, 2 mL of each dilution was added to a cuvette, to which 100 mL of Nessler reagent was added using a pipette and left for 1 min before measuring the absorbance at 425 nm using a spectrophotometer, in accordance with the modified Nessler method as reported by Pastero [39], from Greenburg et al. [40].
From the calibration curve, the relationship shown in Equation (8) was obtained:
Testing was undertaken on the same samples obtained for IC, i.e., from the 5 mL to 20 mL range of the displaced columns’ effluent. Samples taken from the columns’ effluent were diluted (1:10,000) and the procedure as outlined above was followed whereby 2 mL of the dilution was transferred to a cuvette using a pipette, to which 100 µL of the Nessler reagent was added. This was left for 1 min and the absorbance was measured at 425 nm. Using this reading, the concentration of ammonium ions was calculated using Equation (4) and factoring in the dilution.
2.3.8. Quantification of Calcium Carbonate Precipitate
The calcium carbonate content of the sand columns was quantified using a Calcimeter, and in accordance with the procedures outlined by Eijkelkamp [41]. The calcimeter works in accordance with the method of Scheibler to determine the calcium carbonate content based upon a volumetric method whereby carbonates in the sample are converted to CO2 by adding HCl to the sample. The pressure of the CO2 released causes water in a burette to rise and this difference in the level from the start of the test enables the calcium carbonate content by mass, w(CaCO3), to be calculated according to Equation (9), as obtained via the following calibration, whereby V1 is the volume of carbon dioxide produced by the reaction of the test portion.
The result of the above divided by the mass of the sample tested gives the percentage of the sample containing calcium carbonate. To obtain the average calcium carbonate content of each column, as a percentage of the total dry mass, samples between 4 g and 5 g were taken from the top, centre and base of each column after oven drying at 105 °C. Tests were conducted at a constant room temperature of 23 °C.
2.3.9. Unconfined Compressive Strength Testing
Five days following the last injection of CM, unconfined compressive strength (UCS) tests were conducted in accordance with BS 1377-7: 1990 [36]. A loading rate of 1.27 mm/min (0.05 in/min) was applied. Columns were tested in a saturated state. Membranes were kept in place for this test to retain moisture and 38 mm thickness Perspex end caps used to provide a level testing surface between the column and UCS testing apparatus, to ensure that axial force was transmitted equally through each end of the test specimen. Prior to the UCS test, the columns were flushed with one and a half pore volumes of tap water to remove any remaining unreacted substrates.
3. Results and Discussion
3.1. Batch Test Results
Bacteria for this test were grown to a late exponential-stage optical density (OD600) of 0.833, with minimal loss of bacteria in the supernatant, this having been measured as having an optical density (OD600) of 0.004 and therefore considered negligible. The measured electrical conductivities, as shown in Figure 2, were observed to be higher for the samples augmented with ammonium chloride, particularly for the lowest and highest calcium concentrations used. The inhibiting effect of a high calcium concentration on the MICP process has been reported [9,42]. The ammonium chloride addition appears to counteract against this inhibiting effect and otherwise stimulated the MICP process when the calcium concentration drops below 0.5 M. The R squared values in Figure 2 are indicative of a good fit between the polynomial trendlines on the Excel plot and the data.
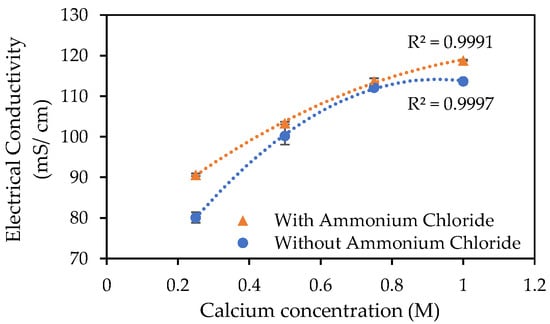
Figure 2.
Electrical conductivity following 24 h incubation at 23 °C of S. pasteurii inoculated tubes containing urea–calcium cementation media and urea–calcium cementation media augmented with ammonium chloride. Error bars show standard errors of the means for the triplicates.
The pH readings, as presented in Figure 3, were slightly lower for the samples containing ammonium chloride. However, when error bars are taken into consideration, there appears to be minimal difference between the two sets of results shown. Similarly, Hang et al. [43], reported that the use of urea as the nitrogen source for MICP, when conducting aqueous studies over 24 h, led to an increase in pH and that this increase was not observed when supplying ammonium chloride (NH4Cl) as the only nitrogen source.
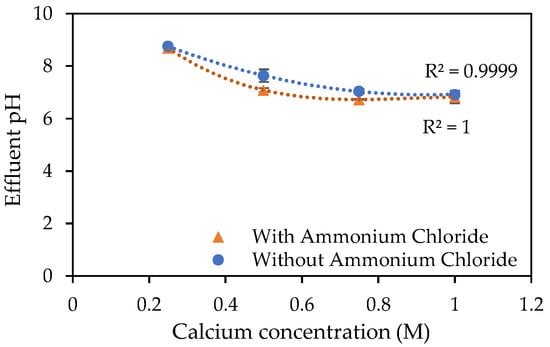
Figure 3.
pH of effluent following 24 h incubation at 23 °C of S. pasteurii inoculated tubes containing urea–calcium cementation media and urea–calcium cementation media augmented with ammonium chloride. Error bars show standard errors of the means for the triplicates.
The results for the mass of precipitate (assumed at this stage to be calcium carbonate) deposited within the centrifuge tubes after 24 h, are presented in Figure 4. The results for the augmented medium in Figure 4 appear to have a linear correlation, compared to the curved (polynomial) trendline for the urea–calcium medium. These results also suggest that the augmentation of the cementation medium with ammonium chloride has counteracted the inhibitory effect of the high calcium concentration (greater than 0.75 M) in the cementation medium.
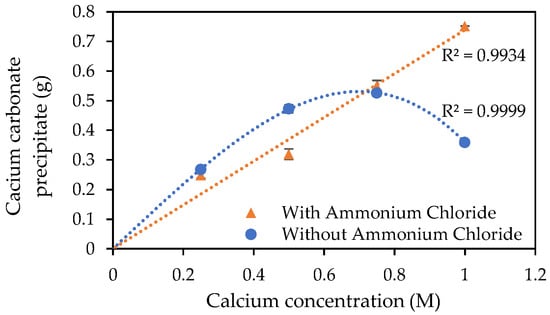
Figure 4.
CaCO3 precipitated after 24 h incubation at 23 °C of S. pasteurii inoculated tubes containing urea–calcium cementation media and urea–calcium cementation media augmented with ammonium chloride. Error bars show standard errors of the means for the triplicates.
For this 24 h batch test, the use of the augmented cementation medium appears to have had an inhibitory effect on the precipitation of CaCO3 when the calcium chloride dihydrate concentration is below approximately 0.75 M, as shown in Figure 4.
3.2. Columns Study
3.2.1. Material Properties
Figure 5 gives the optimum dry density of the F65 sand for compaction, this being 1.710 g/cm3. This value was used to determine the target density for compacting the sand within the columns.
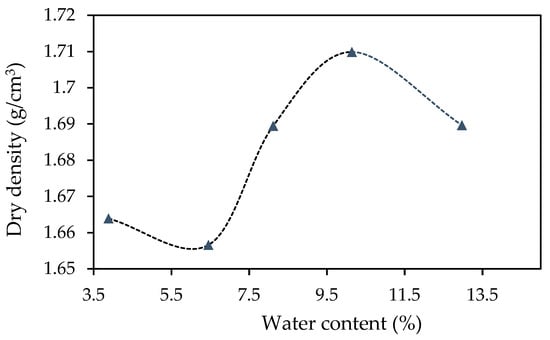
Figure 5.
Proctor compaction test results for Ottawa F65 sand.
Results obtained for particle size distribution, as presented in Figure 6, are in close alignment with those reported by U.S. Silica. The parameters determined from the gradation curve for the F65 sand are given in Table 6.
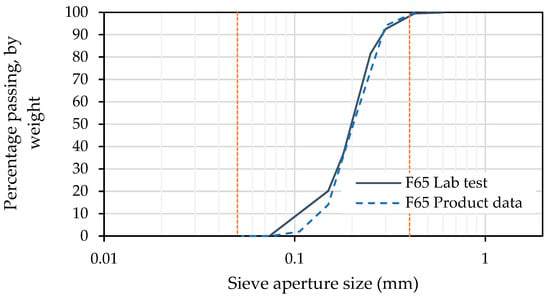
Figure 6.
Particle size distribution of F65 sand, as measured in the laboratory, and as per product data provided by US Silica.

Table 6.
F65 sand parameters, as derived from laboratory test data for particle size distribution.
The coefficient of curvature (Cz) value of 1.280 indicates, along with the low coefficient of uniformity (Cu) value of 2.038, that the F65 sand is poorly graded, albeit with slightly better grading than the F60 used in prior studies by Spencer et al. [27].
3.2.2. Bacterial Fixation and Initial Activity
The columns study further explored the effect of the use of the cementation medium augmented with ammonium chloride, when biocementing fine sand using multiple treatments consisting of injections of cementation media.
The optical density (OD600) of the liquid broth culture of S. pasteurii grown for this study was measured as 1.086 using a spectrophotometer. Urease activity was measured as 5.67 mM/min, taken as an average of three tests in accordance with the procedure outlined by Harkes et al. [32]. The bacteria was successfully fixed using CM1a, as shown by the low optical densities of column effluent in Table 7, as measured during treatment two. While indicative of the bacteria fixing the effectiveness, these optical density measurements may be affected by suspended CaCO3 minerals within effluent. Some bacterial losses were observed in effluent just after one pore volume of CM had been pumped into the column. The cloudiness (precipitation) within the effluent displaced from columns at this point was indicative of some leaching of S. pasteurii bacteria from the columns.

Table 7.
Optical density of effluent discharged from 5–10 mm depth from columns, during biocementation treatment two, following the fixing of bacteria by treatment one.
3.2.3. Distribution of Bacterial Activity
Figure 7a–h shows the measured electricity conductivities and pH of the effluent displaced from columns during biocementation treatments.
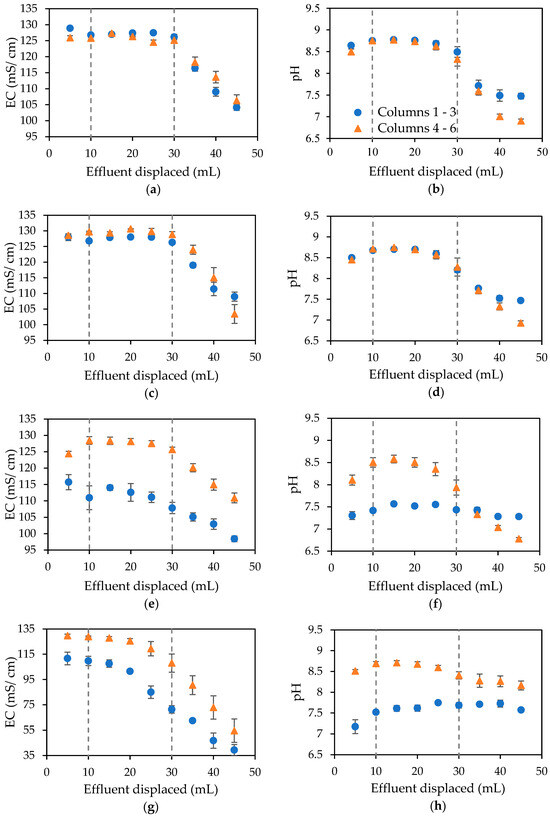
Figure 7.
Electrical conductivity and pH of effluent displaced from columns following biocementation treatments 1 (a,b), 2 (c,d), 3 (e,f) and 4 (g,h), with error bars showing standard errors of the means for the triplicates.
The electrical conductivities shown in Figure 7a–h are indicative of the distribution of the bacteria within the columns and thus indicate that the distribution is fairly even for columns one to three, with slightly more variation in the columns injected with the augmented medium CM2a from treatment two onwards, as shown by the error bars. The dashed lines in these figures represent the approximate locations of the column boundaries at the outlet and inlet.
The pH of the standard urea–calcium medium and medium containing ammonium chloride and sodium bicarbonate was 7.66 and 6.89, respectively. The tap water in the Tempe area of Arizona in the US had a slightly alkaline pH, resulting in the pH of CM1a being slightly alkaline.
Treatment one was the same for all columns. Following the results of the batch test, the standard urea–calcium medium (CM1a) was used for all columns for the first treatment and for all treatments for control columns one to three, with the augmented medium (CM2a) injected into columns four to six from treatment two onwards. There was little difference observed between the results for the two sets of columns for pH and electrical conductivity measurements resulting from treatment two, as shown in Figure 7c,d. Treatments three and four (Figure 7e–h) resulted in a significant increase in pH and electricity conductivity readings for columns treated using the augmented medium CM2a. These results suggest that the addition of ammonium chloride to the cementation medium has a beneficial effect on the MICP process beyond the second biocementation treatment and hence helps stimulate the process when multiple treatments are required. Following biocementation treatment four, columns were flushed with sterile tap water and therefore the electrical conductivity, as shown in Figure 7g, is reduced to almost zero, and the pH (Figure 7h) remains at around 8 given the slight alkalinity of the tap water in the Tempe area of the US.
3.2.4. Efficiency of Chemical Conversion
Figure 8 shows the chemical conversion efficiency, as determined through the measurement of calcium ions within columns effluent, following all four biocementation treatments.
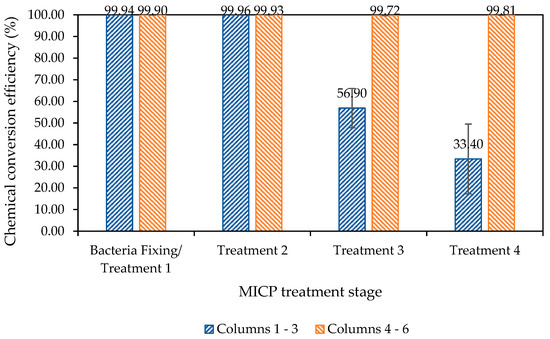
Figure 8.
Chemical conversion efficiency over the eight-day treatment process for the columns test, based on the measurement of calcium ions in columns’ effluent, with retention times of 16 h, 22 h, 24 h and 120 h for treatments one to four, respectively. Error bars represent the standard errors of the means for each triplicate set of columns.
The results presented in Figure 8 show that the chemical conversion efficiency within columns four to six, which were injected with a CM containing ammonium chloride (CM2a) from treatment two onwards, is close to 100% efficiency following all four treatments. In contrast, there is a significant reduction in the chemical conversion efficiency beyond treatment two for columns injected with the standard urea–calcium medium (CM1a) only. The average chemical conversion efficiency for columns one to three declined to 57% and 33%, respectively, following treatments three and four.
The results presented in Figure 8 also demonstrate the effect and further importance of the initial concentration of the bacteria injected, when compared with prior studies by Spencer et al. [27]. This provides some further insight into the previous study by Spencer et al. [27], suggesting that Jute additions were particularly beneficial when the bacterial concentration was lower. The development of an efficient MICP process is dependent upon several physiological and biological variables, of which the initial bacterial cell concentration is a major factor [44].
The Nessler method was used to measure the conversion of urea (nitrogen source) into ammonium ions, with results presented in Figure 9. The ammonium chloride is added to the cementation medium following treatment one, and therefore the effects of this addition can be seen in results from treatment two onwards. For this set of columns, there had been lower activity in one of the controls; however, despite this, the efficiency increased and the individual results for this particular column improved. The analysis takes into account the addition of 0.187 M ammonium chloride to the cementation from treatment two onwards and deducts this from the measured result before calculating the conversion efficiency. Excess urea is included within the cementation medium so as not to inhibit the calcium ion conversion. Results indicate that it may be possible to include less ammonium chloride in the medium than used in this study.
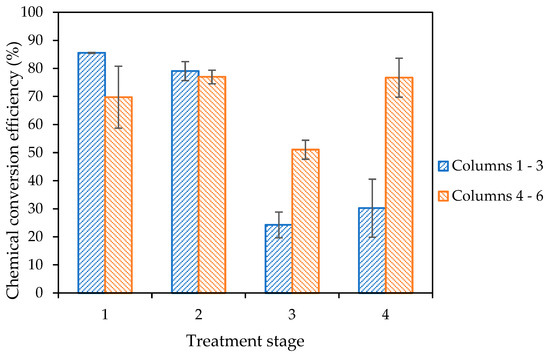
Figure 9.
Efficiency of substrate conversion to form ammonium ions based on urea concentration of medium and concentration of ammonium ions in columns effluent as determined by Nesslerisation, taking into account added ammonium chloride, with error bars showing standard errors of means.
While the nitrogen source provided for ureolytic MICP studies is typically urea, ammonium chloride can also be a source of nitrogen [43]. Hang et al. [43] reported that the optimum nitrogen source for MICP, when compared to ammonium chloride, was urea. Furthermore, Hang et al. [43] found that the use of urea as the nitrogen source in the medium also led to an increase in pH, which was not observed when supplying NH4Cl as the only nitrogen source. The higher pH of effluent from columns treated with ammonium chloride, as shown in Figure 7 f and h, therefore suggests that the urea is still being used as the nitrogen source. It is not possible, however, to ascertain from the results obtained in this study whether ammonium chloride was utilised as a calcium source or not. It is noted here that the amount of urea provided within biocementation treatments applied to all columns was in excess of that needed for the full utilisation of the calcium component of the CM. The results reported by Hang et al. [43] were derived from a 24 h aqueous MICP study, with a subsequent sand columns study utilising the urea–calcium medium only.
3.2.5. Unconfined Compressive Strength
Unconfined compression test results are shown in Figure 10 and Table 8. The average unconfined compressive strength (UCS) of columns (1–3) treated using the urea–calcium CM only was 149.91 kPa. For columns (4–5) injected using the CM augmented with ammonium chloride for biocementation treatments two to four, the average UCS was 271.28 kPa. The addition of ammonium chloride to the CM resulted in a compressive strength increase of approximately 80% on average, when comparing these two results. There is more deviation between results for columns injected with the medium containing ammonium chloride; however, all UCS results for this set of three columns are higher than those for columns one to three. The point of failure was taken as the highest point before 5% strain is reached, since columns had been visually observed to fail within this period. The unconfined compression test is intended for use on saturated cohesive soils. This test has, however, been used by a number of researchers to test the unconfined compressive strength (UCS) of biocemented sand [16,20,45,46] in the absence of an otherwise recommended test for this material. Although columns were tested in a saturated state, the material tested is granular and this may therefore give rise to some inaccuracies and inconsistencies in results. Therefore, this test alone is not used to assess the effect of augmenting the cementation medium.
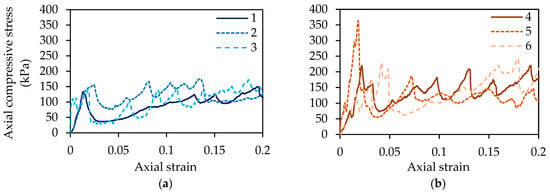
Figure 10.
Unconfined compressive strength (UCS) test results for columns 1–3 (a) and 4–6 (b).

Table 8.
UCS test parameters for columns test.
Although some variation in density is observed, there does not appear to be a close correlation with UCS within the range of results presented in Table 8. For example, among columns one to three, the column with the lowest UCS value, this being column 1, has the highest density. The average percentage of target density achieved for compaction across all columns was 95%.
Images of the columns shortly after the onset of failure are shown in Figure 11a–f. Clear failure planes can be seen in these images. For clarity, the dashed orange line annotations were added to each image just below the failure planes.
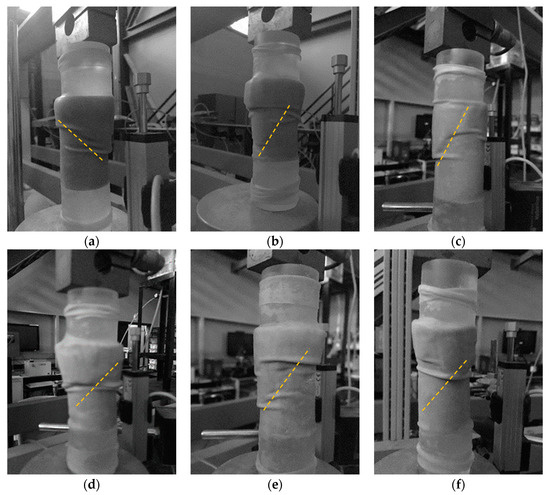
Figure 11.
Photographic images of columns one to six (a–f) during UCS testing, shortly after failure, with annotation highlighting the approximate path of the shear failure.
The average calcium carbonate contents of the six columns, as determined using a Calcimeter, are shown in Figure 12. This analysis relates the calcium carbonate contents to the tested unconfined compressive strengths of the columns. It can be observed that the columns treated with a cementation medium containing ammonium chloride all have higher calcium carbonate contents than those only treated with the urea–calcium medium only. While there is some variation in unconfined compressive strength between columns four to six, the calcium carbonate contents of these columns show much less deviation when compared to results for columns one to three. The average calcium carbonate content was 3.18% for columns one to three and 3.90% for columns four to six.
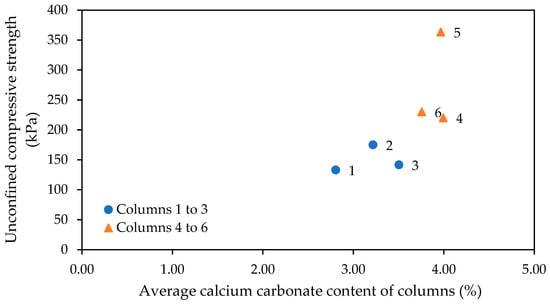
Figure 12.
Average calcium carbonate content of columns, as measured using a Calcimeter, showing relationship to UCS results.
The calcium carbonate distribution, as quantified via Calcimeter measurement, at the base, centre and top of the six columns is shown in Figure 13. When compared to previous column studies published by Spencer et Al. [27], it can be seen that the wet pluviation of the sand into PBS within the column has not improved the distribution of bacterial/urease activity when comparing to wet pluviation into a cementation medium and therefore the preparation of columns with cementation medium would not appear to have had an adverse effect. Greater investigation is required to improve this distribution of calcium carbonate precipitated within sand columns.
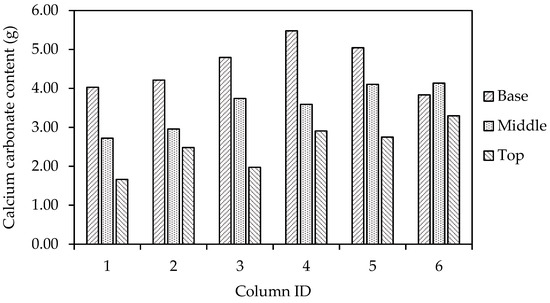
Figure 13.
Distribution of calcium carbonate precipitated at the base, middle and top of columns.
Figure 14 shows the distribution of the Calcimeter measured calcium carbonate content at the base, middle and top of columns, as a percentage of the total measured mass per column. Overall, there is greater homogeneity in the calcium carbonate distribution when using the augmented medium (columns 4 to 6). Behzadipour and Sadrekarimi [24] reported that they used ammonium chloride within the cementation medium to lower the CaCO3 precipitation rate and prevent the early clogging of pores, and thus promote more uniform precipitation. While the aforementioned study did not evidence this effect of using ammonium chloride, the results presented in Figure 14 potentially support this outcome. However, given the variation across columns in the results presented below in Figure 14, more studies would be needed to assess the effect of the addition of ammonium chloride on homogeneity in the calcium carbonate precipitation.
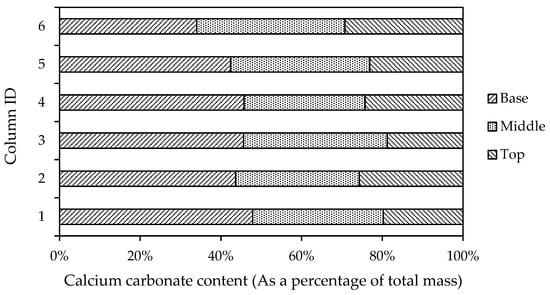
Figure 14.
Distribution of calcium carbonate precipitate within columns, shown as a percentage of total mass, based upon measurements of the calcium carbonate content of samples taken from the base, middle and top of columns.
4. Conclusions
The effect of adding ammonium chloride to the basic urea–calcium source cementation medium was explored. The results of the initial aqueous MICP batch test indicated that it may not be beneficial to augment the cementation medium with ammonium chloride for the first columns treatment if the concentration of calcium chloride dihydrate in this medium is below 0.75 M. The batch results otherwise suggest that the augmentation of the cementation medium with ammonium chloride could help improve the chemical conversion efficiency and hence the calcium carbonate precipitation when using a 1.0 M calcium source in the cementation medium. Therefore, any benefits of augmenting the basic cementation medium used for early treatment stages (first 24 h) may be dependent upon the concentration of the calcium source used in the medium.
It was found that the addition of 0.187 M ammonium chloride to the urea–calcium cementation medium had a particularly noticeable positive effect following the third injection of this medium into a set of sand columns, compared with columns treated with the urea–calcium medium only. Significant increases in electrical conductivity, pH and calcium ion depletion resulted from use of the augmented medium from this point onwards and consequently increased the calcium carbonate precipitation. Nesslerisation was used to measure the ammonium ion content of the columns effluent and also indicated the greater efficiency of chemical conversion from the third treatment onwards when using the augmented cementation medium. The use of the augmented medium also resulted in a significant increase in the unconfined compressive strength of the biocemented columns. The concentration of ammonium chloride used was based upon prior studies and may be further refined by conducting additional studies.
The results also demonstrated the influence of the initial concentration of the bacterial inoculant, and therefore urease activity, when compared to prior studies by Spencer et al. [27]. When compared to these earlier studies, despite the lack of carrier material in this study, there was still an observed greater concentration of calcium carbonate towards the inlet end of the columns, less so overall when the augmented medium was used. Furthermore, the results for this study indicate that the addition of ammonium chloride to the cementation medium may have had a beneficial effect in terms of the improved homogeneity of the calcium carbonate precipitated within columns. Further studies are needed in relation to this finding and the improvement of the homogeneity of precipitation in general for the biocementation processes.
In addition to augmenting the urea–calcium source cementation medium with ammonium chloride, a relatively small amount of sodium bicarbonate was added to the augmented medium to stabilise the pH of this solution prior to injection [20]. Further work is required to better understand the influence, if any, of this addition of sodium bicarbonate over the cementation medium.
Improving the efficiency of the chemical conversion for MICP treatments results in reduced substrate waste, and may thus further contribute to achieving the twelfth UN Sustainable Development Goal concerning resource use when utilising MICP for engineering applications.
Author Contributions
Conceptualisation, C.A.S.; methodology, C.A.S. and L.v.P.; formal analysis, C.A.S.; investigation, C.A.S.; resources, C.A.S. and L.v.P.; data curation, C.A.S.; writing—original draft preparation, C.A.S.; writing—review and editing, H.S. and L.v.P.; supervision, H.S. and L.v.P.; laboratory funding, L.v.P. All authors have read and agreed to the published version of the manuscript.
Funding
This research was funded by a doctoral stipend provided by the Cardiff University School of Engineering and laboratory resources provided by the Centre for Bio-mediated and Bio-inspired Geotechnics at Arizona State University.
Data Availability Statement
The data presented in this study are available on request from the corresponding author.
Conflicts of Interest
The authors declare no conflict of interest.
References
- Yin, J.; Wu, J.-X.; Zhang, K.; Shahin, M.A.; Cheng, L. Comparison between MICP-Based Bio-Cementation Versus Traditional Portland Cementation for Oil-Contaminated Soil Stabilisation. Sustainability 2022, 15, 434. [Google Scholar] [CrossRef]
- Al-Rawas, A.; Hassan, H.F.; Taha, R.; Hago, A.; Al-Shandoudi, B.; Al-Suleimani, Y. Stabilization of oil-contaminated soils using cement and cement by-pass dust. Manag. Environ. Qual. Int. J. 2005, 16, 670–680. [Google Scholar] [CrossRef]
- DeJong, J.T.; Mortensen, B.M.; Martinez, B.C.; Nelson, D.C. Bio-mediated soil improvement. Ecol. Eng. 2010, 36, 197–210. [Google Scholar] [CrossRef]
- UN Environment. Greening Cement Production Has a Big Role to Play in Reducing Greenhouse Gas Emissions-UNEP Global Environmental Alert Service (GEAS)—November 2010. UNEP—UN Environment Programme, 16 September 2017. Available online: http://www.unep.org/resources/report/greening-cement-production-has-big-role-play-reducing-greenhouse-gas-emissions (accessed on 24 September 2023).
- Portland Cement Association. Soil-Cement Construction Handbook; Portland Cement Association: Skokie, IL, USA, 1995. [Google Scholar]
- Hamed Khodadadi, T.; Kavazanjian, E.; van Paassen, L.; DeJong, J. Bio-Grout Materials: A Review. Grouting 2017, 1–12. [Google Scholar] [CrossRef]
- Arp, G.; Reimer, A.; Reitner, J. Photosynthesis-Induced Biofilm Calcification and Calcium Concentrations in Phanerozoic Oceans. Science 2001, 292, 1701–1704. [Google Scholar] [CrossRef] [PubMed]
- Ribeiro, B.G.O.; Gomez, M.G. Dissolution Behavior of Ureolytic Biocementation: Physical Experiments and Reactive Transport Modeling. J. Geotech. Geoenviron. Eng. 2023, 149, 04023071. [Google Scholar] [CrossRef]
- Whiffin, V.S. Murdoch University; Division of Science and Engineering. Microbial CaCO3 Precipitation for the Production of Biocement. Ph.D. Thesis, Murdoch University, Perth, Australia, 2004. [Google Scholar]
- Van Paassen, L.A.; Ghose, R.; van der Linden, T.J.M.; van der Star, W.R.L.; van Loosdrecht, M.C.M. Quantifying Biomediated Ground Improvement by Ureolysis: Large-Scale Biogrout Experiment. J. Geotech. Geoenviron. Eng. 2010, 136, 1721–1728. [Google Scholar] [CrossRef]
- Dong, Y.; Guo, Z.; Guo, N.; Liu, T. One-Step Removal of Calcium, Magnesium, and Nickel in Desalination by Alcaligenes aquatilis via Biomineralization. Crystals 2019, 9, 633. [Google Scholar] [CrossRef]
- O’donnell, S.T.; Rittmann, B.E.; Kavazanjian, K., Jr. Factors Controlling Microbially Induced Desaturation and Precipitation (MIDP) via Denitrification during Continuous Flow. Geomicrobiol. J. 2019, 36, 543–558. [Google Scholar] [CrossRef]
- Erşan, Y.; de Belie, N.; Boon, N. Microbially induced CaCO3 precipitation through denitrification: An optimization study in minimal nutrient environment. Biochem. Eng. J. 2015, 101, 108–118. [Google Scholar] [CrossRef]
- Ganendra, G.; Wang, J.; Ramos, J.A.; Derluyn, H.; Rahier, H.; Cnudde, V.; Ho, A.; Boon, N. Biogenic concrete protection driven by the formate oxidation by Methylocystis parvus OBBP. Front. Microbiol. 2015, 6, 786. [Google Scholar] [CrossRef] [PubMed]
- Ohan, J.A.; Saneiyan, S.; Lee, J.; Bartlow, A.W.; Ntarlagiannis, D.; Burns, S.E.; Colwell, F.S. Microbial and Geochemical Dynamics of an Aquifer Stimulated for Microbial Induced Calcite Precipitation (MICP). Front. Microbiol. 2020, 11, 1327. [Google Scholar] [CrossRef] [PubMed]
- Mukherjee, S.; Sahu, R.B.; Mukherjee, J.; Sadhu, S. Application of Microbial-Induced Carbonate Precipitation for Soil Improvement via Ureolysis. In Ground Improvement Techniques and Geosynthetics; Thyagaraj, T., Ed.; Lecture Notes in Civil Engineering; Springer: Singapore, 2019; pp. 85–94. [Google Scholar] [CrossRef]
- De Belie, N. Microorganisms versus stony materials: A love–hate relationship. Mater. Struct. 2010, 43, 1191–1202. [Google Scholar] [CrossRef]
- Lin, H.; Suleiman, M.T.; Brown, D.G. Investigation of pore-scale CaCO3 distributions and their effects on stiffness and permeability of sands treated by microbially induced carbonate precipitation (MICP). Soils Found. 2020, 60, 944–961. [Google Scholar] [CrossRef]
- Stocks-Fischer, S.; Galinat, J.K.; Bang, S.S. Microbiological precipitation of CaCO3. Soil Biol. Biochem. 1999, 31, 1563–1571. [Google Scholar] [CrossRef]
- Qabany, A.; Soga, K. Effect of chemical treatment used in MICP on engineering properties of cemented soils. Geotechnique 2013, 63, 331–339. [Google Scholar] [CrossRef]
- Montoya, B.M.; Dejong, J.T. Healing of biologically induced cemented sands. Geotech. Lett. 2013, 3, 147–151. [Google Scholar] [CrossRef]
- Gat, D.; Ronen, Z.; Tsesarsky, M. Soil Bacteria Population Dynamics Following Stimulation for Ureolytic Microbial-Induced CaCO3 Precipitation. Environ. Sci. Technol. 2016, 50, 616–624. [Google Scholar] [CrossRef] [PubMed]
- Gomez, M.G.; Graddy, C.M.R.; DeJong, J.T.; Nelson, D.C.; Tsesarsky, M. Stimulation of Native Microorganisms for Biocementation in Samples Recovered from Field-Scale Treatment Depths. J. Geotech. Geoenviron. Eng. 2018, 144, 1804. [Google Scholar] [CrossRef]
- Behzadipour, H.; Sadrekarimi, A. Effect of microbial-induced calcite precipitation on shear strength of gold mine tailings. Bull. Eng. Geol. Environ. 2023, 82, 331. [Google Scholar] [CrossRef]
- Osinubi, K.J.; Gadzama, E.W.; Eberemu, A.O.; Ijimdiya, T.S.; Yakubu, S.E. Evaluation of the Strength of Compacted Lateritic Soil Treated with Sporosarcina Pasteurii. In Proceedings of the 8th International Congress on Environmental Geotechnics, ICEG 2018, Hangzhou, China, 28 October–1 November 2018; Springer: Berlin/Heidelberg, Germany, 2019; pp. 419–428. [Google Scholar] [CrossRef]
- Montoya, B.M.; DeJong, J.T. Stress-Strain Behavior of Sands Cemented by Microbially Induced Calcite Precipitation. J. Geotech. Geoenviron. Eng. 2015, 141, 04015019. [Google Scholar] [CrossRef]
- Spencer, C.A.; van Paassen, L.; Sass, H. Effect of Jute Fibres on the Process of MICP and Properties of Biocemented Sand. Materials 2020, 13, 5429. [Google Scholar] [CrossRef] [PubMed]
- Spencer, C.A. Enhancing Biocement through Incorporation of Additives; Cardiff University: Cardiff, UK, 2021; Available online: https://orca.cardiff.ac.uk/id/eprint/146016/ (accessed on 11 July 2023).
- Botusharova, S. Self-Healing Geotechnical Structures via Microbial Action. Ph.D. Thesis, Cardiff University, Cardiff, UK, 2017. [Google Scholar]
- Ramachandran, A.L.; Ghalib, M.; Dhami, N.K.; Cheema, D.; Mukherjee, A. Multi-functional performance of biopolymers and biocement in stabilisation of road bases. Proc. Inst. Civ. Eng. Constr. Mater. 2022, 1–15. [Google Scholar] [CrossRef]
- Tobler, D.J.; Cuthbert, M.O.; Greswell, R.B.; Riley, M.S.; Renshaw, J.C.; Handley-Sidhu, S.; Phoenix, V.R. Comparison of rates of ureolysis between Sporosarcina pasteurii and an indigenous groundwater community under conditions required to precipitate large volumes of calcite. Geochim. Cosmochim. Acta 2011, 75, 3290–3301. [Google Scholar] [CrossRef]
- Harkes, M.P.; van Paassen, L.A.; Booster, J.L.; Whiffin, V.S.; van Loosdrecht, M.C.M. Fixation and distribution of bacterial activity in sand to induce carbonate precipitation for ground reinforcement. Ecol. Eng. 2010, 36, 112–117. [Google Scholar] [CrossRef]
- Rebata-Landa, V. Microbial Activity in Sediments: Effects on Soil Behaviour. Ph.D. Thesis, Georgia Institute of Technology, Atlanta, GA, USA, 2007. [Google Scholar]
- ASTM D6913/D6913M-17; Standard Test Methods for Particle-Size Distribution (Gradation) of Soils Using Sieve Analysis. ASTM International: West Conshohocken, PA, USA, 2017.
- ASTM D1557-12e1; Standard Test Methods for Laboratory Compaction Characteristics of Soil Using Modified Effort (56,000 ft-lbf/ft3 (2700 kN-m/m3)). ASTM International: West Conshohocken, PA, USA, 2012.
- BS 1377-7:1990; Methods of Test for Soils for Civil Engineering Purposes. Part 7: Shear Strength Tests (Total Stress). British Standards Institution: London, UK, 1999. Available online: https://shop.bsigroup.com/ProductDetail?pid=000000000000211981 (accessed on 26 November 2020).
- Shimadzu. Important Points about Ion Chromatography. 2021. Available online: https://www.shimadzu.com/an/service-support/technical-support/analysis-basics/ion/42lab.html (accessed on 20 April 2021).
- United States Environmental Protection Agency. Methods for Chemical Analysis of Water and Wastes; United States Environmental Protection Agency: Washington, DC, USA, 1983.
- Pastero, L. Carbonates; MDPI: Basel, Switzerland, 2019. [Google Scholar]
- Greenburg, A.E.; Clesceri, L.S.; Eaton, A.D. Standard Methods: For the Examination of Water and Wastewater, 18th ed.; American Public Health Association: Washington, DC, USA, 1992. [Google Scholar]
- Eijkelkamp Soil & Water. Calcimeter: Manual; Eijkelkamp Soil & Water: Giesbeek, The Netherlands, 2018; Available online: https://www.eijkelkamp.com/download.php?file=M0853e_Calcimeter_b21b.pdf (accessed on 1 November 2019).
- Erdmann, N.; Strieth, D. Influencing factors on ureolytic microbiologically induced calcium carbonate precipitation for biocementation. World J. Microbiol. Biotechnol. 2022, 39, 61. [Google Scholar] [CrossRef] [PubMed]
- Hang, L.; Yang, F.; Xu, J.; Zhao, Z.; Xiao, W.; He, J. Experimental Study on the Effective Production of Biocement for Soil Solidification and Wind Erosion Control. Sustainability 2023, 15, 5402. [Google Scholar] [CrossRef]
- Murugan, R.; Suraishkumar, G.K.; Mukherjee, A.; Dhami, N.K. Insights into the influence of cell concentration in design and development of microbially induced calcium carbonate precipitation (MICP) process. PLoS ONE 2021, 16, e0254536. [Google Scholar] [CrossRef] [PubMed]
- Mahawish, A.; Bouazza, A.; Gates, W.P. Unconfined Compressive Strength and Visualization of the Microstructure of Coarse Sand Subjected to Different Biocementation Levels. J. Geotech. Geoenviron. Eng. 2019, 145, 04019033. [Google Scholar] [CrossRef]
- Mujah, D.; Cheng, L.; Shahin, M.A. Microstructural and Geomechanical Study on Biocemented Sand for Optimization of MICP Process. J. Mater. Civ. Eng. 2019, 31, 04019025. [Google Scholar] [CrossRef]
Disclaimer/Publisher’s Note: The statements, opinions and data contained in all publications are solely those of the individual author(s) and contributor(s) and not of MDPI and/or the editor(s). MDPI and/or the editor(s) disclaim responsibility for any injury to people or property resulting from any ideas, methods, instructions or products referred to in the content. |
© 2023 by the authors. Licensee MDPI, Basel, Switzerland. This article is an open access article distributed under the terms and conditions of the Creative Commons Attribution (CC BY) license (https://creativecommons.org/licenses/by/4.0/).