Abstract
Building information modeling (BIM) in the planning and construction of infrastructure projects, such as roads, tunnels, and excavations, requires the generation of comprehensive 3D subsoil models that encompass relevant geological and geotechnical information. Presently, this process relies on the deterministic interpolation of discrete data points obtained from exploratory boreholes and soundings, resulting in a single deterministic prediction. Commonly employed interpolation methods for this purpose include radial basis function and kriging. This contribution introduces probabilistic methods for quantifying prediction uncertainty. The proposed modeling approach is illustrated using simple examples, demonstrating how to use sequential Gaussian and Indicator Simulation techniques to model sedimentary processes such as erosion and lenticular bedding. Subsequently, a site in Munich serves as a case study. The widely used industry foundation classes (IFC) schema allows the integration of the model into the BIM environment. A mapping procedure allows transferring voxel models to the IFC schema. This article discusses the significance of incorporating uncertainty quantification into subsoil modeling and shows its integration into the BIM framework. The proposed approach and its efficient integration with evolving BIM standards and methodologies provides valuable insights for the planning and construction of infrastructure projects.
1. Introduction
Geological units do not occur randomly in space but result from geological processes. Sedimentary soils and rocks are the most common geological formations encountered near the ground surface. The governing processes for the formation of sedimentary rocks are erosion, transport, and deposition. Glaciers, water, and wind often drive these processes. Geological formations can develop at different scales depending on the process and the specific environmental conditions. Changes in environmental conditions and geological processes lead to the formation of stratigraphic boundaries. Understanding these processes is essential for developing a subsoil model.
During site investigation, soundings and boreholes are used to determine ground conditions and bedding. Since these exploration methods only provide information about the subsoil at a few locations, interpolation must be performed between the explored punctual locations where factual data are unavailable. Thus, spatial interpolation methods create spatially continuous datasets from the sparsely distributed punctual information.
There are different interpolation methods, e.g., deterministic and geostatistic. The accuracy of the interpolated results depends on the number and distribution of the data points used in the calculation. In the following sections, different conventional methods available in commercial software will be presented and compared. In Civil 3D ®, for example, linear interpolation is used by connecting boreholes with straight lines or triangular surfaces. Radial basis functions (RBF) are used, for example, in LeapfrogTM [1].
Misjudgments regarding the subsoil model can have significant technical and economic implications and affect sustainability. Due to the deterministic nature of the interpolation procedures, conventional subsoil models do not reflect the natural variability of the subsoil: A deterministic model is “unambiguously” defined at every point in space and does not allow deviating interpretations. Therefore, the choice of the interpolation method influences, for example, the determination of quantities, design efficiency, construction techniques, and risk assessment. Moreover, deterministic models do not consider spatial uncertainties related to interpolating discretely distributed borehole and sounding data. This paper will describe simulation methods, enabling the implicit generation of many geologically plausible subsoil models. Scenarios and uncertainties can be derived from these possible subsoil models employing probabilistic analyses.
Sequential simulation methods are applied for the quantification of uncertainty. Sequential Gaussian simulation (SGSIM) can be applied to describe the spatial variability of field test results, e.g., the tip resistance of cone penetration tests (CPTs). References [2,3,4] showcase the utilization of conditional simulation to spatially model CPT data, which can be used for soil classification, e.g., according to [5]. Sequential simulation methods can also be effectively employed for categorical variables, such as the layers in a borehole description. In [6], a two-step approach was presented. First, plurigaussian simulation (PGSIM) was carried out to generate the layers. After that, soil mechanical parameters were simulated for each layer separately. Likewise, Ref. [7] utilized PGSIM to predict the mixed face conditions in a tunnel constructed by a tunnel boring machine.
Moreover, Ref. [8] combined sequential indicator simulation (SISIM) and SGSIM to analyze slope stability, employing rock quality designation values as continuous variables and fault zones as categorical variables. This approach resulted in a comprehensive assessment of the geological setting. The study conducted by [9] applied object-oriented parametric geological modeling for the execution of a probabilistic analysis for shield tunnel excavation. In [10], a 3D geological model was created with RevitTM and combined with random fields for probabilistic analyses to implement probabilistic methods in BIM. In [11], an optimization of geotechnical surveys through a geostatistical analysis and kriging method was conducted and integrated with building information modeling (BIM).
The primary objective of this article is to introduce methods for uncertainty quantification and promote awareness of it in subsoil modeling, within the context of the architectural, engineering, and construction (AEC) industry. First, we introduce the different methodologies employed for 3D modeling, comparing geostatistical and non-geostatistical methods. A particular focus thereby lies on sequential simulation methods, which enable the quantification of prediction uncertainty. In the results section, we provide illustrative examples showcasing the application of SGSIM and SISIM, followed by a comprehensive case study for a site in Munich. Subsequently, we present a mapping method to integrate the voxel-based modeling approach into the IFC framework and the probabilistic subsoil model into the BIM-based planning process. Additionally, we introduce a classification system designed to effectively incorporate prediction uncertainty into BIM.
2. Materials and Methods
2.1. General
Interpolation enables the estimation of values between known data points. It consists of finding a mathematical function that passes through the data points, allowing for the estimation of values at an intermediate point.
Geostatistics is used for statistically analyzing and modeling geospatial data. The first step in geostatistical modeling is spatial analysis of the data, called variography. Geostatistical modeling techniques include kriging interpolation and sequential simulation techniques. Kriging interpolation is a deterministic technique based on a geostatistical analysis of the site-specific correlation structure, and therefore it works better with geodata than the RBF interpolation technique. Sequential simulations are based on kriging and enable a probabilistic estimation of values at unsampled locations and evaluate their uncertainty.
The following chapter introduces some frequently used non-geostatistical interpolation methods, followed by geostatistical techniques, including variography, kriging, and simulation. Additionally, metrics are introduced for quantifying and visualizing uncertainty in the context of geospatial data analysis.
2.2. Non-Geostatistical Interpolation Methods
The linear interpolation method, such as used that in Civil 3D ®, is based on the direct connection between boreholes with a line in 2D or triangular surface in 3D. In linear interpolation, the borehole logs are linked by triangles (triangulation). Mathematically, the procedure can be described as a system of equations with two unknowns: The elevation grades are known, while the longitudinal slope and transverse slope are sought, and geologically, one would speak of strike and dip. In contrast to industrially manufactured components, the deviations between model and reality concerning geometry are often considerable in the case of geologically formed soil.
The RBFs occupy a particular position among the interpolation methods. This method is used for constructing layered surfaces in Leapfrog™, for example, [1]. Gaussian, quadratic, cubic, or linear functions can be employed for RBF interpolation. Similarly to other interpolation techniques, RBF determines weights based on neighboring data points. These weights are computed by establishing a set of linear equations associated with a known data point. The distances between known and unknown points are utilized for each equation, to calculate factors using the selected RBF function. Solving this system of linear equations yields the respective weights. These calculated weights are subsequently multiplied by the corresponding values to derive an estimate at any given point in space.
RBFs are known for their ability to provide smooth and flexible interpolations. The smoothness is a consequence of the radial nature of the basis functions, which ensures that nearby data points strongly influence the interpolation, while more distant points contribute less. RBF interpolation is suitable when dealing with irregularly spaced data or when there is a need for high-quality surface reconstruction or approximation. RBF is also suitable for scenarios where the underlying spatial structure is poorly understood. LeapfrogTM, among the leading software solutions for subsoil modeling in mining, and geological modeling for BIM, leverages the RBF method for interpolating layer surfaces [1].
One of the primary drawbacks of the RBF method is its inflexibility in the adoption of local correlation structures. Unlike kriging, which explicitly accounts for the spatial autocorrelation or variogram of the data, RBF does not inherently capture the intricate correlation structures that may exist in a particular geospatial context. This limitation can lead to suboptimal results when dealing with datasets characterized by strong spatial dependencies or anisotropy, where the correlation between points varies with direction. Furthermore, RBF interpolation heavily relies on the selected RBF. The choice of these RBFs can significantly impact the quality of the interpolation. In cases where the spatial correlation structure is complex and not well-represented by the chosen RBF, the method may struggle to provide plausible results.
2.3. Geostatistical Methods
2.3.1. Variography
Geostatistical methods require functions to be fitted to the available data. The selection of appropriate functions for geostatistical analysis and the analysis of the available data with these functions is called variography. Variography consists of two steps. The data are analyzed for spatial correlation in the first step, to calculate a so-called experimental semivariogram. This experimental semivariogram essentially quantifies the spatial dependence or variability between pairs of data points at various distances from each other. By calculating the differences between data values at different locations, the semivariogram depicts how the data’s similarity or dissimilarity changes with increasing spatial separation. In the second step, the experimental semivariogram is best fitted with a mathematical function, e.g., an exponential, Gaussian, polynomial, or power function. In this way, the correlation structure of the data in different spatial directions can be modeled (see [12]).
An experimental semivariogram is defined as half of the expected value of a squared difference [13]:
Z is a stationary random function with known mean and variance , independent of location. Before analyzing the spatial semivariance within the dataset, it is advisable to check the dataset for outliers or trends and consider their removal. If the data distribution exhibits skewness, applying a transformation to achieve a normal distribution becomes necessary. A variogram computation algorithm (e.g., [12]) employs a binning approach to organize the data (see Figure 1).
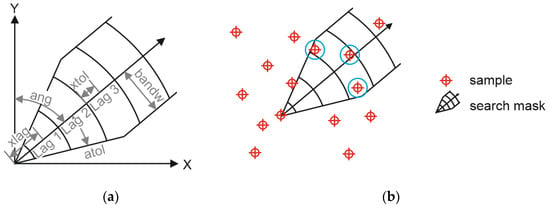
Figure 1.
Semivariogram search mask and parameters (a) and example application (b).
A lag separation distance (xlag) and its associated tolerance (xtol) specify these bins (see Figure 1a). Additionally, the algorithm requires the definition of azimuth (ang), its tolerance (atol), and bandwidth (bandw). Figure 1b illustrates the application of a search mask in a two-dimensional context. For 3D data, a dip angle and tolerance must be defined. This scheme is essential, as the algorithm scans the provided data to identify pairs falling within the specified bins. It becomes evident that the user-defined search parameters play a pivotal role in the subsequent interpretation of the resulting variograms.
Among the functions used to fit the experimental variograms, the spherical or polynomial and the exponential function are the most popular [13]:
Herein, is the range, is the distance, and is the maximum value of the semivariance, called the sill. Figure 2 shows the theoretical semivariograms obtained by Functions (2) and (3), along with the concepts of sill, range, and nugget. The nugget characterizes the data correlation near the origin. Analogous to the presence of gold nuggets, variability at short distances does not commence from zero. As suggested by [14], a nugget exceeding one-third of the sill is unusual. Vertical discontinuities, e.g., induced by erosion, can cause a nugget effect in geological layers. Detecting the nugget effect would require an exceptionally high-resolution sampling, a rarity in geotechnical investigations. Consequently, we will not delve further into discussing the nugget effect.
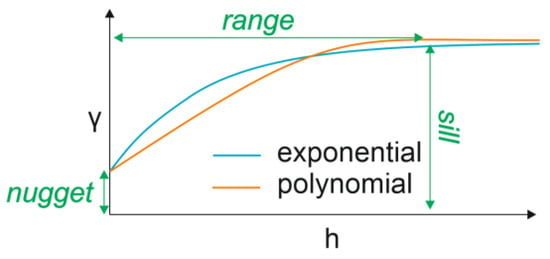
Figure 2.
Semivariogram showing semivariance in relation to distance for a polynomial and an exponential function.
The sill is the semivariance at which the correlation levels off, indicating that data points beyond this distance are essentially uncorrelated. The range parameter determines the distance at which spatial correlation reaches a certain percentage (often 95% or 99%) of the sill. Beyond this range, the spatial correlation is negligible. These concepts are essential for understanding and modeling spatial variability in geostatistical analyses.
2.3.2. Kriging Interpolation and Geostatistical Simulations
Kriging estimation, a fundamental geostatistical technique, aims to provide the optimal linear estimate of an unknown value by minimizing the estimation variance, while preserving spatial correlation. This technique is particularly useful for spatial prediction and interpolation tasks, as it seeks to strike a balance between the proximity to observed data points and the inherent spatial correlation structure.
The data are interpolated using the semivariogram in kriging, and the kriging variance is calculated. With this aim, two matrices are generated for an unsampled point, the first containing the distances between the known data points. The second matrix contains the distances of the known data points to the unsampled point. Then, the covariances are calculated for the distances using the values from the semivariogram. The generated covariance matrix is inverted and multiplied by the covariance of the distances between the unsampled point and the known data points. The product is a vector with the weights to calculate the unknown value at the unsampled point, the weighted mean value of the known data points [14].
However, the nature of kriging, which involves smoothing the true variability of the data, presents limitations in its applicability, as the smoothed estimates fail to capture the intricate variations required for accurate uncertainty quantification [14]. Moreover, kriging is inherently deterministic, offering a single solution that does not reproduce the histogram and, thus, cannot quantify uncertainty.
On the contrary, geostatistical simulation methods offer an alternative approach for characterizing uncertainty, while accounting for spatial correlation. As illustrated in Figure 3, the sequential simulation workflow comprises several key steps replicating the semivariogram and histogram properties, yielding a comprehensive global uncertainty model. In addition to sequential simulation techniques, alternative methods such as turning bands or simulated annealing can generate random realizations. Over the past two decades, multiple-point geostatistics (MPS), which utilizes training images, has become increasingly popular [14]. MPS offers distinct advantages in flow simulation as it uniquely preserves the connectivity of conductive layers, distinguishing it from other methods. However, it is important to note that selecting appropriate training images remains a challenge within the framework of MPS.
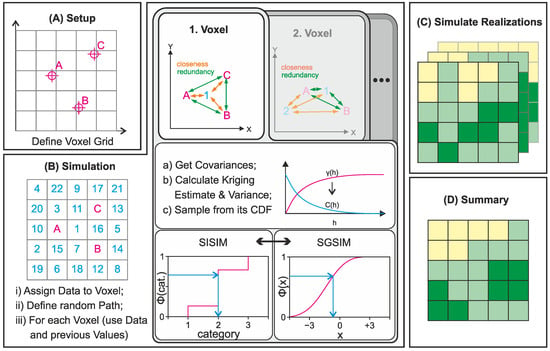
Figure 3.
Geostatistical simulation steps: (A) setup of a grid, (B) simulation, (C) generation of realizations, and (D) summary.
In step (A), a voxel grid is defined that encompasses the study area. Depending on the model dimension, the voxel grid can be either 2D or 3D. Typically, a regular rectangular grid is employed for numerical efficiency, but this is not mandatory for the method. In step (B), the simulation is performed, which involves the substeps of (i) assigning the borehole data to the nearest voxels, (ii) establishing a random path indicated by ascending numbers, and (iii) computing the kriging estimate using both previously computed nodes and known data. The covariance is derived from the theoretical semivariogram and represents the inverse of semivariance. This is used to calculate the kriging estimate and variance. Notably, these covariances are pivotal in quantifying spatial correlation and uncertainty. The estimate and variance values are utilized to construct a cumulative distribution function (CDF). The CDF is a step function for sequential indicator simulation (SISIM). At the same time, sequential Gaussian simulation (SGSIM) assumes a Gaussian distribution characterized by mean and variance parameters based on the kriging estimates. From these distributions, a random value is drawn. The process outlined in substep (iii) is repeated for each voxel, thereby accounting for the spatially varying properties of the dataset. This iterative approach captures the intricate spatial correlations and accounts for previous estimations and their impacts on subsequent voxel estimations. Step (C) involves repeating the simulation process detailed in step (B) across numerous iterations, generating multiple realizations of the subsurface model. This ensemble of realizations comprehensively characterizes the range of possible outcomes and associated uncertainties, effectively capturing the inherent variability of the geological system. The computational cost of a single simulation surpasses that of interpolation, due to its non-parallelizable nature. However, running multiple simulations concurrently can significantly reduce the computation time.
Finally, in step (D), the outcomes of the simulation process are summarized. By calculating summary statistics such as the mean or variance for each voxel, it becomes feasible to gain insights into the overarching trends and uncertainties within the geostatistical model.
2.4. Quantifying and Visualizing Uncertainty
The quantification, visualization, and communication of uncertainty in predictive models constitute an essential element of scientific analysis and prediction. When measurements or borehole data are unavailable, the true value of a property remains unknown. Hence, when making predictions, it becomes imperative to delineate the potential margins of error associated with those predictions. In civil engineering and, more specifically, geotechnical engineering, subsoil models play a pivotal role in the construction process, including the conception, design, and construction phases. Awareness of the spatially varying uncertainties inherent in these models is essential for decision-making in all the process phases. In this context, information entropy and variability are commonly utilized metrics for quantifying uncertainty [15]. On the one hand, the information entropy H is computed by summing the products of the probabilities of occurrence p for N soil layers and their respective logarithms, as represented by Equation (4) [15]:
H = −ΣiN (pi × log (pi))
A low entropy value indicates a high level of certainty in classifying soil within a specific layer, implying a more reliable prediction. Conversely, higher entropy values suggest ambiguity in the classification, leading to increased uncertainty and reduced reliability in the model’s prediction. In contrast to visual representations of probabilistic estimations, as indicated in [16], information entropy offers a distinct advantage by consolidating probabilities from multiple soil layers into a single numerical metric for each sub-region within the model.
On the other hand, variability provides insights into the likelihood of incorrect predictions, thus offering an overall assessment of the model’s prediction uncertainty [17]. The variability is the probability of an incorrect prediction and is calculated by subtracting the probability of the most probable soil layer from one:
Though information entropy may be advantageous for visualization, it is not necessarily effective for assessing uncertainties and decision-making. Entropy as a metric inherently lacks a direct probabilistic interpretation, potentially posing challenges in terms of meaningful interpretation. In contrast, the variability metric serves as a clear and intuitive measure of the prediction reliability at specific spatial points. While entropy may distinguish between qualitative levels of uncertainty, such distinctions often hold limited practical significance. What holds greater importance is understanding the absolute prediction uncertainty. In cases where the prediction is unlikely to be correct, a more precise analysis of the specific problem becomes imperative. Eventually, measures to reduce the uncertainty, e.g., additional subsoil investigations, may be implemented. Therefore, although both presented metrics provide valuable information about the prediction uncertainty, the variability is more suitable in the context of BIM.
3. Results
3.1. Layer Boundaries
Sedimentary sequences are formed by deposition and erosion. If the depositional conditions change, a new layer is formed. We first consider the case of a continuous layer surface in the model area. The layer boundary, described in 2D by a line, separates two layers. The elevation of this line is determined at a few points by drilling or sounding and predicted in between. In the following, the borehole data in Figure 4 are interpolated, and the uncertainties of the predicted layer boundary are exemplarily quantified using sequential Gaussian simulation (SGSIM).Then, 2D pixels or 3D volume pixels (voxels) are used to analyze and present the uncertainties.
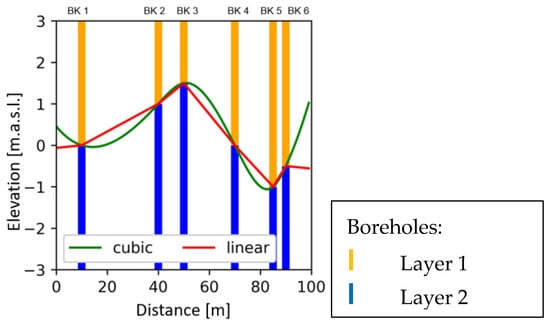
Figure 4.
Layer boundaries interpolated with RBF (cubic and linear). Vertical lines indicate borehole profiles where orange indicates layer 1 and blue layer 2.
Figure 4 shows the results of deterministic interpolation using the RBF technique with a linear and a cubic function.
Figure 5 compares the predicted layer boundary resulting from kriging and SGSIM. In Figure 5a, besides the results of kriging interpolation, the boundaries obtained in the individual, along with the mean elevation, are shown. In Figure 5b, the kriging variance is compared with the variance calculated from 500 simulated layer boundaries. As shown by [16], the global entropy becomes quasi-stationary after a certain number of simulations. Therefore, the minimum number of simulations must be equal to or larger than the number required to achieve the stationary entropy value. Additionally, as indicated in [18], a substantially larger number of simulations is required for precise quantile values at a high confidence level. In the geological context, these statistical uncertainties are less significant than the uncertainties resulting from the variography, the adopted simulation grid, and the presence of unidentified subsoil structures.
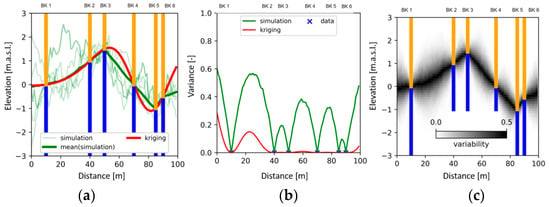
Figure 5.
Comparison of kriging and geostatistical simulations (a) five selected simulations, mean of elevation profiles of 500 simulations and kriging; (b) variance calculated from 500 simulations and kriging variance; (c) variability (V = 1 − P(predicted layer)) shown in pixels. Vertical lines indicate borehole profiles where orange indicates layer 1 and blue layer 2.
Figure 5 shows that the kriging variance consistently remains lower than the variance observed in the geostatistical simulations. Kriging, which operates as a linear regression of covariances, characterizes the kriging variance as a representation of unaccounted variance or as an indicator of the smoothing effect (for a comprehensive mathematical explanation, refer to [4,14]). The kriging variance is proportional to the distance from the sampled points. However, for a comprehensive assessment of spatial uncertainty, methods such as SGSIM are mandatory, to mitigate the smoothing effect inherent in kriging and reproduce the semivariogram and histogram in each simulation run. Subsequently, these simulations form the basis for quantifying the uncertainty associated with the prediction.
By categorizing pixels based on their relative position with respect to the layer boundary, it becomes possible to compute a corresponding probability. Figure 5c shows the variability for every pixel. At the mean elevation of the simulations, the variability reaches its highest values. There, the prediction of the occurring layer is very uncertain, while in the vertical direction above or below the mean, the variability decreases with the distance. The variability below and above the mean of the simulation is low, meaning that no erosion gully or ridge is likely to be encountered.
3.2. Lenticular Bedding
Lenticular bedding develops through different sedimentary processes (e.g., spatial and temporal changes in the depositional environment and water flow patterns) that result in lens-like layers within a larger body of soil and rock. The manual modeling of lens-like layers is highly laborious, and the uncertainty of the predictions is relatively large in comparison to the case of continuous layer boundaries. Even more than for the location of a continuous layer surface, the lens’s model depends on the expert’s interpretation. Alternatively, deterministic interpolation methods and geostatistical simulations can also be used to implicitly model lenses and discontinuous soil layers.
RBF requires fewer computational steps than kriging and can be used for large models with large amounts of data. It has been implemented in LeapfrogTM by ARANTZTM and is numerically efficient [1]. It does not require geostatistical analysis or specification of the range of correlation but is thus less flexible and less adaptable to specific geologic conditions. Kriging estimates closely resemble those of RBF interpolations. However, as shown in Figure 6, the kriging variance in a point of the model only depends on the distance of this point to the nearest borehole data; the shape of the lenses does not influence the kriging variance (Figure 6c).
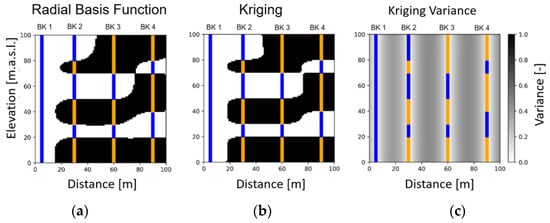
Figure 6.
Subsoil models from fictitious drilling profiles: (a) RBF interpolation, (b) kriging interpolation, and (c) kriging variance. Vertical lines indicate borehole profiles where orange indicates layer 1 and blue layer 2.
Figure 7 shows the results of a geostatistical simulation using the SISIM method. Figure 7a depicts the results of one simulation, Figure 7b the mean value of 500 simulations (expected value), and Figure 7c the variability. The layer boundaries fit the data perfectly along the borehole profiles. At the same time, a random component can be seen in areas where no information is available based on the small-scale heterogeneity. As can be seen, the relative probability of occurrence or variability of the boundaries can be more realistically assessed using the geostatistical simulation than using the kriging variance; along the expected layer boundaries in Figure 7b, the uncertainty is the highest (high variability).
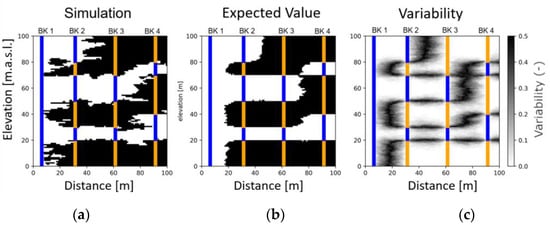
Figure 7.
Fictitious drilling profiles showing (a) simulation, (b) most frequent value (simulation), and (c) variability. Vertical lines indicate borehole profiles where orange indicates layer 1 and blue layer 2.
By examining Figure 6a,b, one can realize that interpolation methods generate smoother lens boundaries, while rough boundaries are predicted by the geostatistical simulation (Figure 7b). Though smoothness in the geostatistical simulation can be somewhat improved by increasing the number of simulations, in our opinion, the ultimate aim of the simulation is not to achieve a flawlessly smooth model but rather to quantify uncertainties effectively. Nevertheless, mathematical algorithms can be developed to smooth the boundaries of the predicted lenses.
3.3. Case Study—Combination of Simulation Methods
Figure 8 shows the workflow for a probabilistic model located in the Munich region. In the Neogene, sands and clays were deposited (lenticular bedding). During the glaciation of the Alps in the Quaternary, these deposits were eroded, and the so-called gravel plane was deposited [19]. The coexisting sedimentation of sands and clays generated discontinuous layer boundaries. For the expected formation geometry, the indicator-based interpolation and SISIM are better suited [15]. The surface of the Neogene formation was modeled with the SGSIM, as SISIM is not able to simulate interfaces such as faults or erosion surfaces reliably [12].
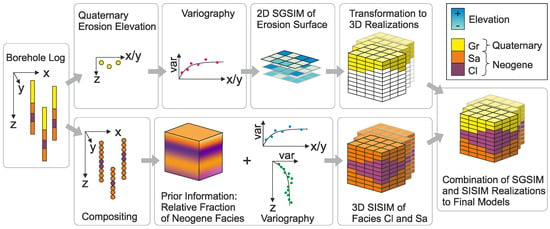
Figure 8.
Combination of SGSIM and SISIM (modified after [20]).
In the presented approach, the depth-dependent relative fraction of Clay (Cl) and Sand (Sa) facies was used as prior information to deal with the anisotropy. For oil reservoir modeling, soft data from seismic investigations often proves valuable for parameter inference and could complement simulation efforts.
Figure 8 shows the workflow for combining realizations from 3D SISIM and 2D SGSIM. First, the 2D SGSIMs need to be mapped to 3D by classifying the voxels above and below the layer boundary. Then, the models for the Quaternary and Neogene can be combined.
Figure 9 shows 3D visualizations of a subsoil model for a construction site in Munich, including the boreholes and the enclosing walls of a construction pit. Figure 9a shows the most probable soil type and Figure 9b the entropy of the prediction as an indicator of the uncertainty. The vanishing entropy near the boreholes indicates the low uncertainty in these regions. On the contrary, the entropy increases with increasing the distance to the boreholes. The accuracy of the input data is an essential prerequisite for the quality of the prediction. An inaccurate or biased soil description in the borehole inevitably compromises the meaningfulness of the model.
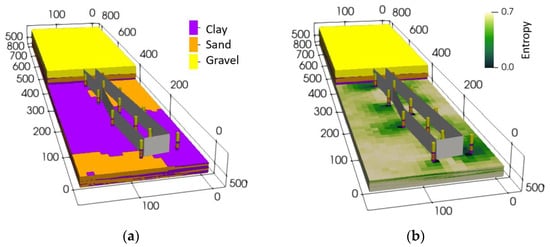
Figure 9.
Example of a probabilistic foundation soil model with boreholes and pit enclosure (a): the most probable soil layer, and (b) entropy of the clay layer (modified after [20]).
The model can be applied to the optimization of the horizontal excavation support, the detection of potential openings in the clay layer affecting the vertical water tightness of the construction pit, the estimation of water discharge, and the evaluation of the risk of a hydraulic failure water ingress into the excavation. It also helps in planning additional subsoil investigations and estimating the volume of excavated materials for different scenarios, among other applications [21]. Though this is beyond the scope of this contribution, cross-validation and plausibility checks of the subsoil model by experts would be mandatory before it is used. Validation should include both the subsoil prediction and the uncertainty (e.g., [21] for an illustrative example).
The present study elucidates the potential advantages of integrating uncertainty into subsoil digitalization. Visualization of the uncertainties related to the subsoil characterization is essential for assessing geotechnical risks, helping decision-makers and experts develop and implement efficient mitigation measures, e.g., optimizing the number of additional subsoil investigations and ultimately yielding more sustainable project outcomes.
3.4. Incorporation in BIM
In the construction industry context, geotechnical engineering is responsible for developing a BIM discipline model containing specific subsoil information [22]. A discipline model does not contain all the available information, and it is a model specifically prepared for integration into the overall BIM (coordination) model [23]. The primary role of the overall model lies in facilitating interdisciplinary integration and verifying and defining dependencies among the trades involved in the construction project, such as collision checks. However, the widespread adoption of consolidating all subdomain models into a coordination model within the DACH region (Germany, Austria, Switzerland) is still pending [24].
The discipline model for the subsoil comprises a digital terrain model (DTM) and incorporates data from site investigations (e.g., boreholes, surveys, predicted geological models, etc.). Furthermore, it should encompass layer information and soil properties of the subsoil based on geotechnical reports [25]. The subsoil discipline model includes geometric information (layers, lenses) and semantic data of geotechnical properties. The discipline model for the subsoil complements and builds upon the “working model” or “domain model”, containing all “working data” used for the geotechnical report [23]. The discipline models validity depends on the latter’s inclusion [22].
In Germany, according to [26], the domain model for the subsoil serves as a communication interface between the geotechnical expert and the project stakeholders. This standard governs the domain model independently of the BIM methodology. While certain parts of the geotechnical report are transferred to the discipline BIM model, other information, such as geotechnical calculations and other related measures not performed by the geotechnical expert, may be excluded. The information transferred from the domain model to the BIM discipline model is project-specific. It is based on the requirements of all stakeholders and the long-term application of the BIM model [23]. The complexity of the attributes and property transfer presents challenges and may lead to discrepancies with the original geotechnical report. As a result, the geotechnical report will remain indispensable for the foreseeable future, as certain information may not be effectively captured with equivalent quality within the discipline model [27]. It is outside the scope of the present study to summarize and discuss the present developments of, e.g., the Eurocode [28]. The following implementation fulfills the requirements of current design codes and presents a practical solution for the incorporation of prediction uncertainties in BIM.
Open BIM represents a collaborative approach to the design, construction, and operation of buildings and infrastructure. It emphasizes the interoperability of digital data between various software applications and stakeholders in the AEC industry. Open BIM’s core is the industry foundation classes (IFC) data model, which serves as a standardized format for exchanging information about building elements and their properties. IFC facilitates the seamless sharing of 3D models, drawings, and other project-related data, ensuring that all project participants can work cohesively, irrespective of the software they utilize. This interoperability enhances efficiency, reduces errors, and fosters a more transparent and collaborative environment in construction. While IFC versions 4.3 and 4.4 provide entities tailored to geologic and geotechnical features, they are not yet established as an ISO standard. This emphasizes the importance of relying on earlier IFC versions for practical applications. The established IFC schema versions aligning with [29] and [30] encompass IFC versions 2.3 and 4.0.
Currently, practical scenarios, including recent bid calls in pilot projects, underscore the significance of adhering to schema version 2.3. This particular emphasis on generating geotechnical models within schema version 2.3 stems from the realization that, while version 4.4 is set to introduce enhancements and specific geoscience entities, the practical integration of these versions into commercial software and industry workflows will still take time. This delay can be attributed to the intricacies of transitioning to new schema versions and ensuring compatibility with existing tools. From this standpoint, utilizing schema versions 2.3 and 4.0 emerges as a pragmatic solution, to promptly convey crucial information to planners and stakeholders. This approach recognizes the practical timeline for the industry to embrace the improvements offered by schema versions 4.3 and 4.4, while ensuring alignment with current practices and available tools. In versions 2.3 and 4.0 of IFC, no designated entities exist for boreholes, soil, prediction uncertainty, or groundwater.
Consequently, a need arises to align the components of the geotechnical subsoil model with the existing entities and framework. This approach has been previously employed, for instance, in the interface of LeapfrogTM or in [31]. However, it is worth mentioning that a reference implementation of this mapping currently needs to be included. The development of such an implementation falls outside the scope of the present study, but it is part of our future plans.
A Python interface based on the implementation of [31] was used to convert boreholes and the layer boundaries to the IFC schema 2.3. The method presented in Section 3.4 relies on a discretization approach utilizing rectangular voxels. Currently, voxels are not implemented in IFC versions 2.3 and 4.0, but they are expected to be implemented in IFC 4.4 [32], which is currently in the software deployment phase. In general, voxels pose a significant challenge to widely used planning software such as RevitTM. Each individual voxel block necessitates a separate geometry construction, consuming substantial storage space, often in the order of hundreds of megabytes to gigabytes for medium-sized models (250,000 voxels). This poses a formidable challenge for BIM viewers, in efficiently rendering these complex 3D representations.
Furthermore, the analytical tools within BIM viewers need to be better-suited for handling such models. Unlike more advanced tools such as ParaView, which enables the display of diverse information for categories and prediction variability using the same voxels, this capability is lacking in conventional BIM software(version. 9.2.0.128), e.g., RevitTM. Consequently, voxels of the same category (e.g., soil type) obtained from the simulations are consolidated into 3D structures representing layers (see Figure 10) or classes of prediction variability (see Figure 11). Figure 10 shows the model from Section 3.3 displayed in the BIM viewer BIMVision® and the corresponding IFC structure. Each soil type can be selected separately, and information from the geotechnical report can be referenced. In this way, the subsoil model complements the geotechnical report.

Figure 10.
Visualization of the IFC model in BIMVision® (a) and IFC Structure Tree (b).
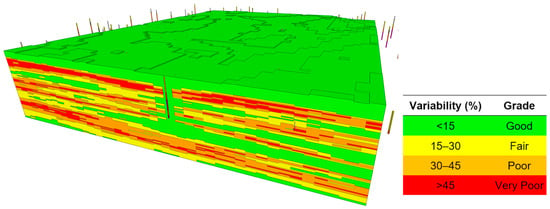
Figure 11.
BIM-IFC subsoil model showing the prediction variability in BIMVision®.
The introduction of a novel classification, as outlined in Table 1, acknowledges the intrinsic variability in prediction results by assigning discrete grades to different ranges of prediction variability. These discrete categories enable the effective communication of the level of confidence one can place in the 3D model’s predictions at a particular point in the model.

Table 1.
Categorizing Prediction Uncertainty by Variability with a Grading.
In this classification scheme, the boundaries of each range are strategically defined to demarcate transitions in prediction variability. A prediction variability lower than 15% is categorized as good. The fair classification corresponds to prediction variabilities within the 15–30% range, indicating an acceptable level of precision. As the variability drops into the 30–45% range, the classification shifts to “poor”, signifying a reduced precision. The very poor classification, encompasses a prediction variability above 45%. Figure 11 shows an example of an IFC-BIM subsoil model, showing the variability classes of the prediction.
Where information is available near the boreholes, the green colors indicate a low variability and prediction uncertainty. Red colors occur where the depth of the interface between two adjacent layers is very uncertain. The model can be sliced in any direction, providing the planner or geotechnical expert valuable with insights concerning the uncertainty of the prediction.
4. Discussion
The spatial uncertainty of subsoil models is rarely assessed in geotechnical engineering. A lack of detailed guidelines and technical competence, and the complexity of geoscience software for performing such analysis, are recognized obstacles to improving the state of practice in uncertainty modeling. However, experience shows that conventional deterministic subsoil models are insufficient for reliable uncertainty identification, risk assessment, and decision-making, especially in complex infrastructure projects.
The growing digitization in the construction industry and the necessity of including the subsoil in BIM, especially in underground construction projects, is pushing forward the development and implementation of implicit modeling methods to quantify and visualize uncertainties. Commercially available geotechnical software for soil modeling does not yet provide simulation tools, such as SGSIM and SISIM, required to quantify uncertainty. Therefore, suitable and affordable tools, as available and standard in the oil and gas and, to some extent, the mining industry, with a focus on geotechnical problems such as tunnels, deep excavations, slope stability, retaining structures, dams, embankments, and foundations are an essential prerequisite for the practical implementation of the probabilistic subsoil modeling concepts presented above.
Despite its potential for subsoil modeling and evaluating uncertainty, sequential simulation demands careful parametrization, expertise in its application, and considerable computational effort. Cross-validation and plausibility checks of the generated subsoil model and the resulting uncertainty by experts are mandatory to overcome the limitations of the methods and increase the reliability of geostatistical simulations. An example of cross-validation, where individual or groups of boreholes are sequentially removed from the simulation dataset and used as a test dataset to check the prediction, is presented in [21].
5. Conclusions
In this article, a comprehensive comparison of different interpolation methods for subsoil modeling and uncertainty quantification, including radial basis function, kriging, and sequential simulation, has been presented. The crucial distinction between kriging variance and sequential simulation variance has been highlighted with the help of illustrative examples. It has also been shown that simulation variance is a suitable indicator of model uncertainty. In contrast, the kriging variance, which is only dependent on the distance to the sampled data, can lead to an unrealistic uncertainty evaluation, particularly in the presence of soil lenses. It is crucial to acknowledge that attaining an “exact” quantification of uncertainty is impossible, given the multifaceted nature of uncertainty within the subsoil domain. Consequently, uncertainty quantification should not be misinterpreted as an absolute truth. Instead, it serves to augment engineering judgments and support decision-making processes.
Integrating geostatistical simulations and uncertainty quantification with evolving BIM standards would improve the quality and reliability of geotechnical information and contribute to more efficient and informed decision-making processes, enhancing the sustainability of civil construction. Our review of the state of development of OpenBIM has shown that standards for geotechnical entities are not yet fully available and are still under development. Direct transfer of the information of our voxel models to BIM is not possible in the available software. In this context, the proposed consolidation of voxel information into layers is a promising approach to integrating voxel models into the BIM environment.
It is worth noting that only the spatial uncertainty of the geological subsoil model was considered in this article. Simulating the spatial distribution of geotechnical features, e.g., relative density, consistency, shear strength, and stiffness, is theoretically possible but challenging, regarding the source and the quality of the data. Frequently, experimental values are employed for correlations and statistical analyses, often overlooking the relatively high uncertainties in the sampling and testing procedures. As the options to correct such biases are limited, the selection of characteristic geotechnical values for design and construction will remain in the hands of experienced engineers and, to a certain extent, depend on empirical knowledge.
Author Contributions
A.W. conceptualization, programming validation, visualization, and writing—original draft preparation; A.A.P.-O. conceptualization and writing—review, project administration, and supervision; R.C. conceptualization, review and improvement of the manuscript, scientific supervision. All authors have read and agreed to the published version of the manuscript.
Funding
This research received no external funding.
Data Availability Statement
Publicly available datasets were analyzed in this study. The data can be found here: Bayerisches Landesamt für Umwelt, www.lfu.bayern.de (accessed on 7 September 2023).
Conflicts of Interest
The authors declare no conflict of interest.
References
- Cowan, E.J.; Beatson, R.K.; Fright, W.R.; McLennan, T.J.; Mitchell, T.J. Rapid Geological Modelling; Australian Institute of Geoscientists: Kalgoorlie, Australia, 2002. [Google Scholar]
- Griffiths, D.V.; Huang, J.; Fenton, G.A. Influence of Spatial Variability on Slope Reliability Using 2-D Random Fields. J. Geotech. Geoenviron. Eng. 2009, 135, 1367–1378. [Google Scholar] [CrossRef]
- Lloret-Cabot, M.; Hicks, M.A.; van den Eijnden, A.P. Investigation of the reduction in uncertainty due to soil variability when conditioning a random field using Kriging. Géotechnique Lett. 2012, 2, 123–127. [Google Scholar] [CrossRef]
- Yang, R.; Huang, J.; Griffiths, D.V.; Sheng, D. Probabilistic Stability Analysis of Slopes by Conditional Random Fields; American Society of Civil Engineers: Reston, VA, USA, 2017. [Google Scholar]
- Robertson, P.K. Soil behavior type from the CPT: An update. In Proceedings of the 2nd International Symposium on Cone Penetration Testing, Huntington Beach, CA, USA, 9–11 May 2010. [Google Scholar]
- Grasmick, J.G.; Mooney, M.A.; Trainor-Guitton, W.J.; Walton, G. Global versus Local Simulation of Geotechnical Parameters for Tunneling Projects. J. Geotech. Geoenviron. Eng. 2020, 146, 04020048. [Google Scholar] [CrossRef]
- Gangrade, R.M.; Grasmick, J.G.; Mooney, M.A. Probabilistic Assessment of Void Risk and Grouting Volume for Tunneling Applications. Rock Mech. Rock Eng. 2022, 55, 2771–2786. [Google Scholar] [CrossRef]
- Kring, K.; Chatterjee, S. Uncertainty quantification of structural and geotechnical parameter by geostatistical simulations applied to a stability analysis case study with limited exploration data. Int. J. Rock Mech. Min. Sci. 2020, 125, 104157. [Google Scholar] [CrossRef]
- Xie, P.; Chen, K.; Skibniewski, M.J.; Wang, J.; Luo, H. Parametric geological model update and probabilistic analysis of shield tunnel excavation: A borehole-based conditional random fields approach. Comput. Geotech. 2023, 157, 105349. [Google Scholar] [CrossRef]
- Xie, P.; Zhang, R.; Zheng, J.; Li, Z. Probabilistic analysis of subway station excavation based on BIM-RF integrated technology. Autom. Constr. 2022, 135, 104114. [Google Scholar] [CrossRef]
- Mahmoudi, E.; Stepien, M.; König, M. Optimisation of geotechnical surveys using a BIM-based geostatistical analysis. SASBE 2021, 10, 420–437. [Google Scholar] [CrossRef]
- Deutsch, C.V.; Journel, A.G. GSLIB Geostatistical Software Library and User’s Guide, 2nd ed.; Oxford University Press: New York, NY, USA, 1997. [Google Scholar]
- Isaaks, E.H.; Srivastava, R.M. Applied Geostatistics; Oxford University Press: Oxford, UK, 1989; ISBN 0195050126. [Google Scholar]
- Pyrcz, M.; Deutsch, C.V. Geostatistical Reservoir Modeling, 2nd ed.; Oxford University Press: New York, NY, USA; Oxford, UK, 2014; ISBN 9780199731442. [Google Scholar]
- Shannon, C.E. A Mathematical Theory of Communication. Bell Syst. Tech. J. 1948, 27, 379–423. [Google Scholar] [CrossRef]
- Wellmann, J.F.; Regenauer-Lieb, K. Uncertainties have a meaning: Information entropy as a quality measure for 3-D geological models. Tectonophysics 2012, 526–529, 207–216. [Google Scholar] [CrossRef]
- Lindsay, M.D.; Aillères, L.; Jessell, M.W.; de Kemp, E.A.; Betts, P.G. Locating and quantifying geological uncertainty in three-dimensional models: Analysis of the Gippsland Basin, southeastern Australia. Tectonophysics 2012, 546–547, 10–27. [Google Scholar] [CrossRef]
- Wald, A. Tests of Statistical Hypotheses Concerning Several Parameters When the Number of Observations is Large. Trans. Am. Math. Soc. 1943, 54, 426. [Google Scholar] [CrossRef]
- Bauer, M.; Thuro, K.; Scholz, M.; Neumann, P. The Geology of Munich (Germany) and Its Significance for Ground Modelling in Urban Areas; IAEG: San Francisco, CA, USA, 2006. [Google Scholar]
- Witty, A.; Peña-Olarte, A.; Cudmani, R. Application of Geostatistical Sequential Simulation Methods for Probabilistic 3D Subsoil Modeling and Uncertainty Quantification—Concept and Examples. In Proceedings of the Geo-Congress 2023, Los Angeles, CA, USA, 26–29 March 2023. [Google Scholar] [CrossRef]
- Witty, A.; Peña-Olarte, A.; Cudmani, R. Comparison of Gaussian and Indicator Based Sequential Simulation Methods for 3D Spatial Uncertainty Quantification in Subsoil Modelling Using Cone Penetration Tests. In Proceedings of the Geo-Risk 2023, Arlington, VA, USA, 23–26 July 2023. [Google Scholar] [CrossRef]
- Molzahn, M.; Bauer, J.; Henke, S.; Tilger, K. Entwicklungsstufen und Attribuierung des Fachmodells Baugrund—Empfehlungen Nr. 2 des Arbeitskreises 2.14 der DGGT „Digitalisierung in der Geotechnik“. Geotechnik 2021, 44, 209–218. [Google Scholar] [CrossRef]
- Erharter, G.H.; Weil, J.; Bacher, L.; Heil, F.; Kompolschek, P. Building information modelling based ground modelling for tunnel projects—Tunnel Angath/Austria. Tunn. Undergr. Space Technol. 2023, 135, 105039. [Google Scholar] [CrossRef]
- Weil, J. Digitale Baugrundmodelle im Tunnelbau—Status, Chancen und Risiken. Geomech. Tunn. 2020, 13, 221–236. [Google Scholar] [CrossRef]
- Stütz, D.; Herten, M. Evaluation von Software zur Generierung von Baugrundschichtenmodellen. Geotechnik 2020, 43, 275–282. [Google Scholar] [CrossRef]
- DIN 4020: 2010-12; Geotechnische Untersuchungen für Bautechnische Zwecke—Ergänzende Regelungen zu DIN EN 1997-2. Deutsche Institut für Normung e. V. (DIN): Berlin, Germany, 2010.
- Bauer, J. Digitalisierung in der Geotechnik: Status Quo und aktuelle Entwicklungen. In 13. Kolloquium Bauen in Boden und Fels: Fachtagung über Aktuelle Herausforderungen der Geotechnik; Expert Verlag: Tübingen, Germany, 2022. [Google Scholar]
- DIN EN 1997-1:2014-03; Eurocode 7—Entwurf, Berechnung und Bemessung in der Geotechnik—Teil 1: Allgemeine Regeln; Deutsche Fassung EN 1997-1:2004 + AC:2009 + A1:2013. Deutsche Institut für Normung e. V. (DIN): Berlin, Germany, 2014.
- ISO 16739-1:2005; Industry Foundation Classes, Release 2x, Platform Specification (IFC2x Platform). International Organization for Standardization (ISO): Geneva, Switzerland, 2005.
- ISO 16739-1:2018; Industry Foundation Classes (IFC) for Data Sharing in the Construction and Facility Management Industries—Part 1: Data Schema. International Organization for Standardization (ISO): Geneva, Switzerland, 2018.
- Köbberich, M.; Schneider, O.; Schildknecht, L.; Gafner, T.; Volken, S.; Wehrens, P.; Preisig, M.; Schwab, P.; Staub, B.; Grischott, R.; et al. GEOL_BIM Innovation Project—Final Report; CHGEOL: Solothurn, Switzerland, 2022. [Google Scholar]
- Borrmann, A.; Rives, M.; Muhic, S.; Wikström, L.; Weil, J. The IFC-Tunnel project–Extending the IFC standard to enable high-quality exchange of tunnel information models. In Advances in Information Technology in Civil and Building Engineering; Springer: Cham, Switzerland, 2022. [Google Scholar]
Disclaimer/Publisher’s Note: The statements, opinions and data contained in all publications are solely those of the individual author(s) and contributor(s) and not of MDPI and/or the editor(s). MDPI and/or the editor(s) disclaim responsibility for any injury to people or property resulting from any ideas, methods, instructions or products referred to in the content. |
© 2023 by the authors. Licensee MDPI, Basel, Switzerland. This article is an open access article distributed under the terms and conditions of the Creative Commons Attribution (CC BY) license (https://creativecommons.org/licenses/by/4.0/).