Abstract
Effective forest trail planning requires objective and transparent tools to balance user accessibility, recreation quality, and environmental protection. This research explores how geospatial analysis and multi-criteria decision-making can be integrated to optimize the allocation of rest and recreation facilities within forest trail networks, where limited resources and ecological constraints often restrict development. The Mount Paiko trail system in northern Greece was analyzed using a hybrid GIS–AHP–PROMETHEE II framework. Five evaluation criteria—trail difficulty, trail class, scenic attractiveness, distance from the trailhead, and traversal time from the nearest facility—were assessed to represent both physical effort and spatial accessibility. Stakeholder-based AHP weighting identified traversal time (C5) and trail difficulty (C1) as the most influential criteria, emphasizing the importance of user fatigue and service gaps. PROMETHEE II produced a clear hierarchy of forty candidate sites, prioritizing medium-difficulty and visually appealing routes located over 10 km from the starting point. Net flow values ranged from −0.228 to +0.309, with the highest-ranked location (PTF 12) highlighting a medium-difficulty, scenic segment with one of the longest traversal times from the nearest facility. By merging quantitative network analysis with structured expert judgment, the proposed framework offers a reproducible and evidence-based decision-support tool for forest planners and policymakers, promoting sustainable trail development that maximizes accessibility while minimizing environmental disturbance.
1. Introduction
Modern approaches to sustainable forest management emphasize a multi-functional strategy that merges ecological conservation with social and recreational goals [,,,]. Within this framework, forest trail planning plays a crucial role by providing controlled opportunities for public recreation while safeguarding sensitive environments. Carefully planned trail networks serve as critical links between human visitors and protected natural areas, helping ensure that new paths and rest sites are implemented in line with long-term conservation goals []. Sustainable trail systems must balance recreational demand with the protection of ecological and cultural resources, while simultaneously supporting the socio-economic well-being of local communities [,]. Thus, truly sustainable trail networks seek to minimize environmental impacts while simultaneously enhancing visitor experience and supporting the well-being of local communities.
Trail planning has increasingly moved away from focusing solely on challenging wilderness routes for very fit hikers. Instead, the emphasis is now on inclusive trail systems designed to accommodate users of all ages and ability levels []. Modern trail development often follows universal accessibility guidelines, so that outdoor recreation is available to a wider and more diverse range of people [,,]. This shift is partly driven by demographic trends and evolving social demand: the global population is aging rapidly, with the number of adults over 65 projected to more than double by 2050 [,]. Ensuring that outdoor recreation infrastructure accommodates older adults and individuals with limited mobility has become increasingly important for both public health and social equity. Inclusive trail design—such as gentle gradients, smooth surfaces, and shorter loop options—enables families with young children, seniors, and people with disabilities to enjoy forest environments safely and comfortably []. By designing trails with different difficulty levels and removing barriers, managers can make nature recreation accessible to everyone, which ultimately improves the well-being of more people. Recent studies [,] also indicate that adapting forest recreation areas to the needs of older adults through improved accessibility fosters active aging and emotional well-being.
A key factor that enhances both the attractiveness and accessibility of trail networks is the presence of supportive infrastructure along the routes. Amenities like rest stops, benches, shelters, or viewpoints greatly enhance the hiking experience and allow a broader range of people (including less fit or older visitors) to enjoy longer trails []. Such facilities provide visitors with opportunities to rest and recover, thereby making longer or more demanding trails accessible to children, older adults, and less physically fit individuals by enabling them to pause comfortably before continuing. Empirical research indicates that trail users (particularly seniors) place high value on features such as shaded seating, clean restrooms, and clear signage during forest visits []. The availability of well-placed rest stops not only enhances comfort and safety (e.g., by offering shelter from adverse weather) but also contributes to higher levels of user satisfaction. From a design perspective, these amenities can enrich the visual landscape and create focal points that increase the overall attractiveness of the trail []. For instance, Lee et al. (2019) [] found that trail appeal correlates closely with the presence of good infrastructure (restrooms, water, signage, etc.), which can greatly improve hikers’ overall experience and influence their preferences. Overall, well-placed infrastructure makes trails more accessible and enjoyable, which in turn attracts a wider range of visitors to appreciate the forest.
Despite these benefits, planners face considerable challenges in determining the optimal location of recreational facilities along trails. Construction and maintenance resources are typically limited, meaning that not every suitable location can be equipped with a bench or shelter. Unplanned or ad hoc placement of amenities often results in inefficiencies—for example, clusters of benches in certain areas while other critical sections remain underserved. Moreover, environmental impacts must be minimized, as establishing a rest area may involve local clearing or terrain reinforcement that should be justified by substantial user benefit. Consequently, the spatial distribution of trail facilities represents an optimization problem in which decision-makers must identify locations that maximize accessibility and user comfort relative to the resources invested [,].
GIS tools provide essential support for this type of planning [,,]. GIS-based network analysis can represent the trail system as an interconnected network of paths and compute service areas or travel distances to potential facility locations, thereby ensuring that new rest areas maximize spatial coverage of the trail network []. For instance, location–allocation modeling can identify optimal points that serve the greatest number of users within a given walking radius or fill accessibility gaps between existing rest stops []. However, distance-based optimization alone is insufficient; planners must also consider multiple decision factors—such as scenic quality, proximity to viewpoints or water sources, trail usage intensity, terrain difficulty, wildlife sensitivity, and cost constraints—when selecting suitable sites. This necessitates a multi-criteria decision-making (MCDM) framework to systematically evaluate and prioritize candidate locations under complex and often conflicting criteria []. By adopting a structured decision-support methodology, agencies can allocate limited resources more transparently and ensure that investments yield the greatest possible improvements to the trail system [,].
Accordingly, a growing body of research has explored the use of integrated GIS and Multi-Attribute Decision-Making (MADM) techniques in environmental planning and resource allocation [,,]. GIS provides the spatial data management and analytical capabilities—such as mapping potential sites and calculating slope, distance, and visibility—while MCDM frameworks incorporate expert judgment and stakeholder preferences into the evaluation process. Numerous studies [,,] have highlighted the effectiveness of combining these methods in recreation and conservation planning. For example, European researchers have applied GIS-based MCDM approaches to reconcile trail development with ecological conservation, prioritizing routes that enhance accessibility and visitor experience while minimizing environmental disturbance [,].
Within the broader spectrum of multi-criteria decision-making (MCDM) techniques, this study adopts a multi-attribute decision-making (MADM) formulation, in which a finite set of candidate on-trail locations is ranked according to five evaluation criteria. In this context, the Analytic Hierarchy Process (AHP) and PROMETHEE II have frequently been used as MADM tools for the allocation of land uses or recreational facilities. AHP is particularly valued for its ability to derive criterion weights through pairwise comparisons, generating a quantitative hierarchy of importance that reflects expert judgment or stakeholder priorities []. PROMETHEE II, by contrast, is an outranking method that evaluates alternatives across all criteria to produce a complete preference order [,]. It has been praised for its intuitive logic and proven effectiveness in environmental decision-making contexts involving multiple, often conflicting, criteria. Outranking techniques such as PROMETHEE are especially advantageous in environmental planning because they accommodate heterogeneous (quantitative and qualitative) criteria without requiring proportional trade-offs, thereby capturing the complexity of real-world decisions []. Recent applications highlight the synergy achieved by combining AHP and PROMETHEE II [,,,,]. For instance, Lakićević et al. (2021) [] integrated the two methods to select a sustainable management plan for a national park—using AHP to weight criteria such as biodiversity, wilderness, tourism, education, and resource use, and PROMETHEE to rank alternative plans—ultimately identifying eco-tourism development as the optimal strategy. Similarly, an AHP–PROMETHEE approach was applied to determine the most suitable forest land-use zones in Serbia’s Djerdap National Park, with AHP capturing the importance of ecological and economic criteria and PROMETHEE prioritizing zones accordingly. These studies demonstrate how hybrid MADM frameworks can provide robust decision support for forest planning by combining the weighting strengths of AHP with the outranking capabilities of PROMETHEE. They also underscore the flexibility of the AHP–PROMETHEE II approach, which can be effectively applied to problems ranging from strategic management planning to fine-scale spatial allocation of land uses or recreational facilities [,,].
Despite the recognized importance of forest trails for recreation and local development, planners often face a practical dilemma: where and how to allocate limited resources for new facilities such as benches, shelters, and rest areas along extensive trail networks. In many cases, decisions are made empirically or based on convenience rather than systematic analysis, leading to uneven facility distribution—some trail sections are overserved, while others lack even basic amenities. This imbalance reduces both user satisfaction and the overall functionality of the trail system. The problem is further compounded by environmental restrictions and budget constraints, which demand that every new installation be justified in terms of accessibility improvement and ecological responsibility.
To address this challenge, the present study seeks to answer the following research question: How can geospatial and multi-criteria decision-making tools be combined to objectively identify the most suitable locations for new forest trail facilities, ensuring maximum accessibility and user comfort under environmental and resource constraints?
To this end, the study applies an integrated GIS–AHP–PROMETHEE II framework designed to support spatially explicit and evidence-based planning decisions. GIS is employed to represent the trail network as a connected system and to quantify spatial indicators such as distance, slope, and travel time between existing and potential facilities. The Analytic Hierarchy Process (AHP) captures expert and stakeholder perceptions of the relative importance of trail characteristics—such as difficulty, attractiveness, and accessibility—while the PROMETHEE II method translates these weighted criteria into a transparent ranking of candidate locations. Through this synthesis, the approach provides a reproducible and policy-relevant pathway for prioritizing facility placement, enabling planners to design trail systems that are both user-centered and environmentally sustainable.
2. Materials and Methods
2.1. Research Area
The research was conducted on Mount Paiko, located in Central Macedonia, northern Greece (Figure 1). Administratively, the area belongs to the Municipality of Pella, under the jurisdiction of the Forest Service of Edessa. The trail network under study extends for approximately 81.8 km, comprising fifteen hiking and four cycling routes (a total of 19 routes) that traverse a diverse forested landscape of beech, oak, and chestnut stands, interspersed with agricultural clearings and traditional settlements such as Elutherochori and Kromni. Elevations range from about 200 m in the lowlands to over 1650 m at the highest peaks, offering varied topography and scenic diversity.
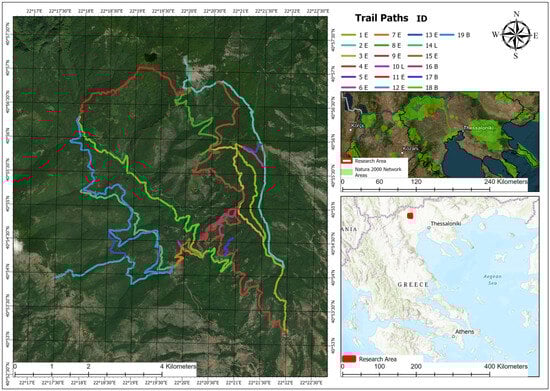
Figure 1.
Map of the study area on Mount Paiko, Central Macedonia, northern Greece, showing the administrative boundaries and the general layout of the trail network.
Mount Paiko lies within the Natura 2000 network, encompassing the protected sites GR1240003 “Oros Paiko” (SCI) and GR1240009 “Oros Paiko, Stena Apsalou kai Moglentissas” (SPA). These areas host important forest habitats and numerous protected species, requiring any recreational development to respect ecological sensitivity and follow the corresponding management framework. The combination of environmental richness, accessibility, and cultural heritage makes Paiko a representative site for testing decision-support methodologies in forest recreation planning.
The region’s transitional Mediterranean–continental climate, with mild winters and dry summers, allows year-round outdoor activity. The trail network includes routes of different difficulty levels and forms a fully interconnected system, enabling continuous movement between paths and attractions. Existing infrastructure—such as benches, wooden shelters, and rest areas—already supports visitor comfort and safety. The network is managed by local municipalities in cooperation with the Forest Service of Edessa, which aims to upgrade and expand facilities to enhance the area’s attractiveness, promote sustainable ecotourism, and strengthen local development. These characteristics justify the selection of Mount Paiko as a case study for applying GIS-based network analysis and hybrid multi-criteria evaluation in the spatial optimization of trail facilities.
2.2. Determination of Trail Facilities Potential Locations
The selection of potential locations for trail facilities was carried out through a combination of GIS-based network analysis and on-site evaluation. The existing trail network of Mount Paiko was processed in a GIS environment, where all hiking and cycling routes were mapped as a connected system. The aim was to locate points along the network that are technically suitable for developing small-scale infrastructure, such as wooden benches, shelters, picnic tables, information signs, waste bins, viewing platforms, and bicycle racks—facilities intended to improve comfort, safety, and the overall recreational quality of the trails.
The total network, approximately 81.8 km in length, was segmented into 100 m intervals to ensure balanced spatial coverage of candidate sites. At the center of each 100 m segment, a candidate point was generated and evaluated according to terrain slope, ground stability, accessibility, visibility, and proximity to intersections or scenic viewpoints. Areas within steep gradients, dense vegetation, or environmentally sensitive zones of the Natura 2000 sites were excluded, ensuring minimal ecological disturbance and compliance with environmental management restrictions. In addition to spatial analysis, a series of field visits and measurements were conducted during spring and summer 2023 to verify the suitability of each potential site. These visits included direct observation of trail condition, accessibility, shading, and user safety, as well as the documentation of existing infrastructure. At the main starting point of the network (Figure 2), a wooden shelter and a parking area already serve visitors and provide a reference model for similar rest facilities along the trails. Furthermore, three existing resting sites were identified at other parts of the network, each equipped with wooden benches, tables, and partial shading structures.
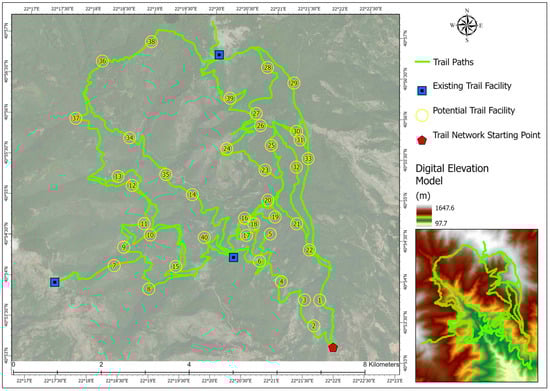
Figure 2.
Mount Paiko trail network showing the main starting point, the existing resting sites, and the forty (40) selected potential locations for new rest and recreation facilities along the trail network.
By combining the GIS-based spatial analysis with field observations, forty (40) potential locations were ultimately selected for further evaluation. These candidate sites represent the most appropriate positions for developing new resting and recreation facilities, balancing accessibility, technical feasibility, and environmental compatibility. The spatial distribution of the 40 proposed locations and the existing infrastructure is presented in Figure 2. Illustrative field photographs of selected Trail Facilities Potential Locations are provided in Figure A1.
2.3. Criteria Selection
To evaluate the forty potential trail facility locations, five criteria were selected to represent the main spatial, functional, and experiential factors influencing the suitability of each site for the development of resting and recreation infrastructure. The criteria were designed to be measurable, comparable, and compatible with the AHP–PROMETHEE II framework, which requires clearly defined beneficial or non-beneficial indicators. Each criterion was expressed on a point scale, facilitating normalization and enabling both the weighting and ranking procedures within the multi-criteria analysis. This step is formulated as a classical multi-attribute decision-making (MADM) problem, in which each candidate trail location is treated as a discrete alternative evaluated on the five attributes.
The first criterion, C1: Trail Level of Difficulty, expresses how physically demanding each route segment is, using a five-point scale from 1 (Very Easy) to 5 (Very Hard). As trail difficulty increases, the likelihood that users will need resting opportunities also rises, especially on steep or challenging sections. For this reason, C1 is beneficial and should be maximized, meaning that higher difficulty values indicate a greater need for installing rest facilities.
The second criterion, C2: Trail Class, differentiates between educational/thematic, entertainment, and cycling routes, on a three-point scale (1 = Educational, 2 = Entertainment, 3 = Cycling). Educational trails generally attract a wide range of visitors with diverse physical capabilities, making them more likely to require shaded and accessible resting spots. Entertainment trails accommodate moderately active users, while cycling routes, due to higher speeds and lower dwell times, typically require fewer rest points. Consequently, C2 is non-beneficial and should be minimized, since lower class values correspond to a higher need for resting facilities.
The third criterion, C3: Trail Attractiveness Rank, measures the scenic and experiential quality of each trail segment on a 19-point scale (1 = Most attractive, 19 = Least attractive). Sections rated as more attractive tend to draw more visitors and longer stops, increasing the demand for rest areas and observation points. Although scenic attractiveness is conceptually a beneficial attribute, in this study, it is expressed as a rank where lower numerical values indicate more attractive trails (1 = most attractive, 19 = least attractive). For this reason, C3 is coded as a non-beneficial criterion, and its raw values are minimized and then inverted during the normalization step, so that more attractive segments receive higher normalized scores and are favored in the PROMETHEE II ranking.
The fourth criterion, C4: Distance from the Starting Point, measures the linear distance (in meters) between each candidate location and the main trailhead. Greater distances correspond to longer walking periods, after which users are more likely to need rest and recovery. Thus, C4 is beneficial and should be maximized, prioritizing sites farther from the starting point where physical fatigue increases.
Finally, the fifth criterion, C5: Traversal Time from the Nearest Trail Facility, quantifies the walking time (in minutes) from each candidate point to the closest existing facility. Longer walking times indicate sections that are currently underserved by infrastructure. Accordingly, C5 is beneficial and should be maximized, since higher values identify trail areas with greater spatial gaps between resting facilities. These five criteria were selected because, taken together, they capture the main physical, experiential, and accessibility-related dimensions that local trail managers and stakeholders identified as critical for prioritizing rest facilities along the network.
Table 1 summarizes the selected criteria, their units, orientation (maximize/minimize), and type (beneficial/non-beneficial), forming the analytical basis for the subsequent stages of the methodology. Overall, these five criteria capture the interplay between user demand, accessibility, and spatial distribution, providing a structured framework for evaluating the forty candidate sites. The use of a point scale across all qualitative indicators allows consistent integration of expert judgment within the AHP weighting process and supports the PROMETHEE II ranking analysis.

Table 1.
Selected criteria, measurement units, goal orientation, and corresponding codes used in the multi-criteria evaluation process.
Monetary construction and maintenance cost was not included as a separate criterion because no site-specific cost estimates were available at this planning stage and preliminary consultations suggested that cost differences among the small, standardized facilities considered here would be relatively minor compared to differences in accessibility and trail characteristics; nevertheless, explicitly modeling spatial variation in investment and maintenance costs, including potential cost interactions among nearby facilities, would be a valuable extension of the framework in future applications.
2.4. Implementation of Analytical Hierarchy Process (AHP)
The Analytic Hierarchy Process (AHP), originally introduced by Saaty (1987) [], is a structured method for multi-criteria decision analysis. It breaks down complex problems into a hierarchy consisting of an overall goal, a set of criteria and sub-criteria, and the available alternatives. This hierarchical organization enables decision-makers to systematically assess how each alternative contributes to the overall objective, taking into account multiple—often conflicting—factors. AHP combines quantitative data with expert judgment in a transparent and logically consistent framework, providing a clear rationale for prioritization. As shown in Figure 3, the procedure consists of five main steps. In the present application, AHP is used in a restricted way, namely only to obtain the relative weights of the five criteria through pairwise comparisons, without additional sub-criteria levels or comparisons at the alternative level.
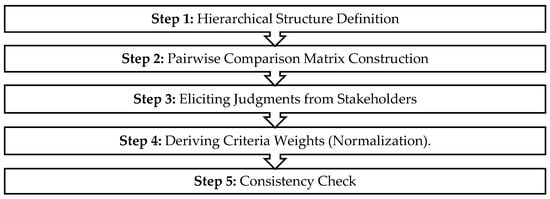
Figure 3.
Sequential workflow of the Analytical Hierarchy Process (AHP) applied in the study [].
The first step of the Analytic Hierarchy Process (AHP) involves structuring the decision problem into a hierarchical framework composed of three main levels: the overall goal, the evaluation criteria, and the available alternatives. In this study, the objective of the AHP was to determine the relative importance (weighting factors) of the criteria that influence the suitability of potential sites for developing resting and stop facilities along forest trails. As illustrated in Figure 4, the top level of the hierarchy represents the overall goal—to identify the optimal locations for the construction of rest and stop areas along the trail network. The second level includes the five evaluation criteria (Trail Level of Difficulty, Trail Class, Trail Attractiveness Rank, Distance from Starting Point, and Traversal Time from Nearest Trail Facility), which capture both environmental and user-oriented aspects of trail design. The third level comprises the forty (40) potential trail facility locations derived from the GIS-based network analysis described in Section 2.2. By organizing the problem in this hierarchical form, AHP provides a transparent and systematic framework for assessing how strongly each criterion contributes to the overall objective. This structure also allows expert judgments to be consistently incorporated into the weighting process, ensuring a well-founded basis for the subsequent PROMETHEE II ranking of candidate sites.
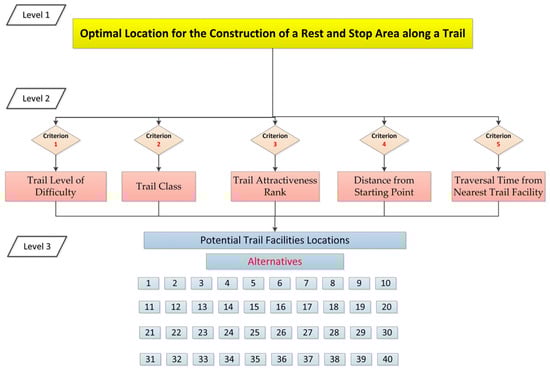
Figure 4.
Hierarchical structure of the AHP model used to determine the weighting factors of the five evaluation criteria for prioritizing potential trail facility locations.
In the second step, after defining the hierarchy, the AHP proceeds with pairwise comparisons among the criteria to assess their relative importance toward achieving the goal. Each pair of criteria is compared using the fundamental 1–9 Saaty scale [], where 1 indicates equal importance, 3 moderate, 5 strong, 7 very strong, and 9 extreme importance of one criterion over another; intermediate values (2, 4, 6, 8) refine the judgments. These comparisons form a pairwise comparison matrix , in which each element expresses how much more important criterion i is compared to j. The matrix is reciprocal by definition. For example, if then . This structure ensures internal consistency and allows a complete evaluation with direct comparisons for N criteria. The resulting matrix captures expert judgments in a transparent and systematic form, forming the foundation for deriving the criteria weights in the next step.
For the third step of implementation of AHP, in this study, the pairwise comparison values were derived from expert stakeholder input rather than a single analyst’s judgment. A panel of six stakeholders was convened, including one representative of the Forest Service responsible for trail infrastructure, two municipal representatives overseeing trail management and development, and two members of the local mountaineering club who regularly organize activities on the trails. Together, they covered the full spectrum of perspectives related to trail use and maintenance. During a series of consultation sessions, the AHP method was explained, and participants were guided through the pairwise comparison process. For each pair of criteria, the group discussed which was more influential for achieving the goal of optimizing trail facility placement and to what extent. Consensus was reached for every comparison, producing a single, collectively endorsed matrix rather than separate individual assessments. This consensus-based approach ensured that the final weighting structure reflected shared priorities among all involved parties.
The fourth stage in AHP involves calculating the priority weight of each criterion from the finalized pairwise comparison matrix. The N * N matrix A (here N = 5 criteria) is positive and reciprocal. In this approach, each column of the pairwise matrix is divided by its sum, and then the average of each row provides the normalized weight for that criterion:
where N: number of criteria, : relative importance of criterion i over criterion j, : column sum for criterion j, : normalized weight (priority value) of criterion i.
The resulting weight vector sums to 1.00 and represents the relative importance of each factor. Higher weights indicate criteria judged as more influential by the stakeholder panel in determining optimal trail facility locations. These weights were later used as inputs to the PROMETHEE II ranking procedure.
The fifth and final step of AHP is to build a mechanism for testing the logical consistency of expert judgments. Because human evaluations are rarely perfectly transitive, inconsistencies can arise and must be quantified to ensure the reliability of the resulting weights. After estimating the priority vector, the Consistency Index (CI) is calculated as:
where : Consistency Index, N: number of criteria, : principal eigenvalue of the comparison matrix.
The maximum eigenvalue is obtained by multiplying the original pairwise comparison matrix A with the derived weight vector w, and then dividing each component of the resulting vector by the corresponding weight value. The average of these ratios provides the estimate of :
where : principal eigenvalue of the comparison matrix, : the i-th element of the product between matrix A and vector w.
If all pairwise comparisons are perfectly consistent, and thus CI = 0. As the deviation of from N increases, inconsistency also grows. To evaluate whether this inconsistency is acceptable, Saaty (1980, 2001) [,] introduced the Consistency Ratio (CR), defined as:
where RI is the Random Index, representing the average CI value from randomly generated matrices of the same size. A CR < 0.10 (i.e., less than 10%) is generally considered acceptable; higher values indicate that judgments should be reviewed or refined. In this study, the Random Index (RI) was obtained from Saaty’s (1987) [] reference table, based on simulations of randomly generated reciprocal matrices. For N = 5 criteria, the corresponding value is RI = 1.12.
2.5. Calculation of Criteria Values and Network Analysis
The ranking of the potential sites for the establishment of trail facilities required the calculation of the selected five main criteria. All forty potential facility locations were spatially constrained along the existing trail paths to ensure that every candidate point corresponds to a realistic on-trail position accessible to users. This spatial alignment was achieved through a network-based GIS overlay process, ensuring that the entire assessment was confined to the linear geometry of the trail system.
2.5.1. Evaluation of Qualitative Criteria
The first two criteria—Trail Difficulty (C1) and Trail Class (C2)—were derived directly from the official dataset maintained by the trail management authority responsible for the design and maintenance of the Mount Paiko trail network. These data form part of the standardized classification framework defined by the Greek Ministry of Environment and Energy, which specifies trail attributes such as terrain slope, surface type, and accessibility. The Trail Difficulty parameter expresses the relative challenge a visitor encounters when traversing a given segment, integrating the combined effects of slope, length, and terrain roughness. The Trail Class, in turn, captures the physical and managerial characteristics of each trail, distinguishing between developed recreational routes, thematic or educational paths, and more primitive segments.
The third criterion—Trail Attractiveness Rank (C3)—was obtained from previous research, which ranked the trail paths in the specific study area based on their attractiveness []. In that study, a multi-attribute decision-making approach (MADM-VIKOR) was used to evaluate nineteen trail paths in Mount Paiko based on both physical and experiential attributes, including length, slope, percentage of natural trail surface, and view area coverage. The resulting attractiveness scores were normalized and aggregated through the VIKOR ranking process, yielding a composite Trail Attractiveness Rank for each trail. In the present research, these pre-established ranks were adopted to represent the relative attractiveness of the underlying trails associated with each potential facility location. Thus, sites located along trails of higher scenic or experiential value were assigned correspondingly higher attractiveness scores.
2.5.2. Network Analysis and Spatial Derivation of Criteria
The spatially dependent criteria—Distance from Starting Point (C4) and Traversal Time from Nearest Trail Facility (C5)—were calculated through a GIS-based Network Analysis designed to quantify the accessibility of each candidate site within the trail system. These parameters reflect both the geometric configuration of the network and the physical effort required for visitors to reach or move between facilities.
A network database was first established to represent the trail connectivity in topological form. All trails were digitized as polyline features from high-resolution orthophotos and topographic maps, assigned unique identification codes and surface attributes, and validated for continuity using the Build Network tool in ArcGIS PRO 3.5 software. Elevation data extracted from the Digital Elevation Model (DEM) were integrated into each segment, allowing the network to store three-dimensional information on slope and altitude. This enabled realistic cost–distance computations and accurate path modeling.
The Distance from Starting Point criterion was computed by determining the shortest route between the main trailhead and each candidate facility using the network’s optimal path algorithm. The resulting values represent the actual walking distance along the trail geometry, accounting for curvature and elevation rather than straight-line proximity.
The Traversal Time from Nearest Trail Facility was derived through the Closest Facility function, which identified the minimal-cost path connecting each candidate point with the nearest existing facility. For each path, elevation differences were extracted from the DEM, and travel time was estimated following Naismith’s Rule [], which provides an empirical model for predicting hiking duration based on terrain. Importantly, these traversal times were computed with respect to the current configuration of existing facilities only; the hypothetical new facilities were not iteratively added to the network when deriving criterion C5.
According to Naismith’s principle [,], first formulated in 1892 and widely applied in modern GIS-based route modeling, the total walking time equals a base speed of 5 km per hour (12 min per km) plus an allowance of roughly 10 min for every 300 m of ascent. Later refinements introduced adjustments for descent and terrain roughness—reducing time slightly on gentle downhills and increasing it on steep or uneven ground. This rule offers a balanced estimation of hiking effort, incorporating both horizontal and vertical components of movement, and remains one of the most reliable references for pedestrian travel-time modeling in mountainous terrain.
A simplified GIS workflow was implemented: points were generated every 50 m along the trails, lines were split at those points, elevations were extracted to determine slope per segment, and Naismith’s time coefficients were applied to each section. The segment times were aggregated and spatially joined to the candidate sites to obtain the final traversal-time dataset. By integrating geometric and topographic parameters, this approach produced a realistic representation of accessibility within the Mount Paiko trail network. The derived distance and time values were then normalized and incorporated into the multi-criteria evaluation, ensuring that the spatial dimension of visitor effort was objectively represented in the final decision model. Throughout the analysis, each alternative corresponds to a discrete candidate point located along the existing trail polylines (i.e., a potential on-trail site for installing a rest facility), and the PROMETHEE II ranking therefore prioritizes on-network locations rather than off-trail sites.
2.6. Implementation of PROMETHEE II
The Preference Ranking Organization Method for Enrichment Evaluation II (PROMETHEE II) is a well-established outranking technique for multi-attribute decision-making (MADM) problems []. PROMETHEE belongs to the concordance family of MADM methods and can be implemented with different types of preference functions, among which the present study adopts the linear form. It provides a complete ranking of alternatives through pairwise comparisons based on weighted evaluation criteria. The method is particularly suitable for complex environmental and spatial planning contexts, where both quantitative and qualitative criteria must be jointly assessed [,]. In the present study, PROMETHEE II was used to rank forty candidate locations for new trail facilities, integrating the AHP-derived weights to ensure that the relative importance of the five criteria (C1–C5) was properly reflected. The process followed six sequential steps commonly adopted in PROMETHEE applications.
- Step 1—Normalization of criteria values.
The initial decision matrix was constructed with alternatives (sites) as rows and criteria as columns. To make all indicators comparable, criteria were normalized. For beneficial criteria (to be maximized),
And for non-beneficial criteria (to be minimized),
where is the original value of alternative j on criterion i.
The normalized matrix rescales all criteria to the [0,1] range.
- Step 2—Evaluative differences.
For evaluating the differences for each criterion from the normalized matrix R, the following equation is applied:
where : the pairwise performance gap for each criterion from the normalized matrix
- Step 3—Preference function.
The difference is transformed into a preference degree using the usual preference function:
where . This expresses how strongly a is preferred to b on criterion i.
It should be noted that the linear preference function adopted here is only one of the standard PROMETHEE preference types; other shapes (e.g., U-shaped, level, or Gaussian) could be used in applications where the decision maker perceives threshold or non-linear responses to differences between alternatives.
- Step 4—Aggregated preference index.
The overall preference of a over b is computed as the weighted sum:
where is the AHP-derived weight of criterion i and . The aggregated preference matrix represents all pairwise comparisons among alternatives.
- Step 5—Outranking flows.
Two flows summarize how each alternative performs relative to all others:
where is the leaving flow (how much a outranks others) and the entering flow (how much a is outranked).
- Step 6—Final Ranking.
The overall score for each alternative is given by:
with higher values indicating more favorable locations. Sorting the alternatives by yields the final PROMETHEE II ranking. In PROMETHEE II, the net flow φ(a) of an alternative a is defined as the difference between its leaving flow φ+(a) and its entering flow φ−(a).
This procedure integrates both expert-derived importance weights and spatially measured criteria, producing a transparent and reproducible ranking of trail facility sites. PROMETHEE II thus enables a holistic evaluation where the best-ranked sites simultaneously maximize accessibility, attractiveness, and spatial equity while minimizing environmental or physical constraints.
3. Results
3.1. Evaluation of Criteria Weighting Factors
Τhe AHP was applied to determine the relative importance of the five evaluation criteria influencing the suitability of potential trail facility locations. Following the methodological steps described in Section 2.4, a consensus pairwise comparison matrix was established based on expert input from six stakeholders representing forest management, municipal planning, and local mountaineering associations. The resulting pairwise comparison matrix (Table 2) captures these judgments. Each value represents the importance of criterion i over criterion j, using the fundamental 1–9 Saaty scale. Reciprocal values were automatically assigned to maintain consistency .
Table 2.
Pairwise comparison matrix representing the relative importance of the five criteria (C1–C5) for trail facility site selection.
To ensure numerical consistency and enable computation of the priority vector, the qualitative pairwise judgments were converted into their corresponding arithmetic values according to the fundamental 1–9 Saaty scale. The resulting numerical representation of the decision makers’ preferences is shown in Table 3, which serves as the quantitative foundation for normalization and eigenvalue computation.
Table 3.
Arithmetic representation of the pairwise comparison matrix after conversion of expert judgments to numerical form.
This arithmetic transformation enabled the calculation of column sums and normalized weights according to Equation (1). The resulting normalized matrix and calculated weight factors are presented in Table 4. After this, the testing for internal consistency of the judgments occurred. The weighted sum value for each criterion was evaluated, and the Consistency Ratio λ was calculated, initially for each criterion, and then the principal eigenvalue λmax was computed using Equation (3).
Table 4.
Normalized comparison matrix and derived weighting factors for the five criteria.
The maximum eigenvalue of the comparison matrix was λmax = 5.0943, yielding a Consistency Index CI = 0.0236 and a Consistency Ratio CR = 0.021, well below the 0.10 threshold. This indicates that the stakeholder judgments are highly coherent and that the resulting weights provide a reliable basis for the subsequent PROMETHEE II ranking. As illustrated in Figure 5, Traversal Time from the Nearest Trail Facility (C5) receives the highest weight (0.41), followed by Trail Level of Difficulty (C1), while the remaining criteria play a more moderate role in the decision structure.
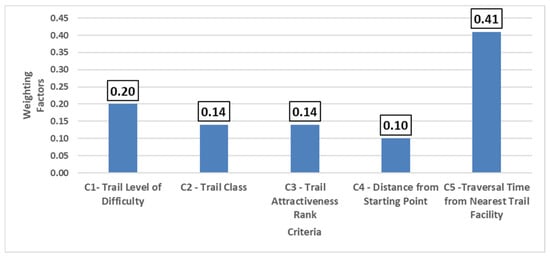
Figure 5.
Graphical representation of the AHP-derived weighting factors for the five evaluation criteria used in the trail facility site selection process.
3.2. Evaluation of Criteria Values
The five criteria (C1–C5) were evaluated for all forty potential trail facility (PTF) locations along the mapped trail network, using the qualitative trail attributes and the GIS-based accessibility indicators defined in Section 2. The resulting distributions are summarized below.
Figure 6 illustrates the three qualitative criteria. For Trail Level of Difficulty (C1), most locations correspond to Easy (17) and Medium (17) trails, while Hard and Very Hard account for only three cases, and Very Easy for three. This indicates that the majority of candidate facilities are positioned along moderately demanding routes, where resting opportunities can enhance accessibility. The Trail Class (C2) results show that Entertainment trails dominate (27 sites), followed by Cycling (11) and Educational/Thematic (2), confirming the network’s primarily recreational profile. For Trail Attractiveness Rank (C3), values range from 1 (most attractive) to 19 (least), with approximately 50% of the facilities located on highly attractive paths (top 6), emphasizing their alignment with routes of elevated scenic or experiential quality.
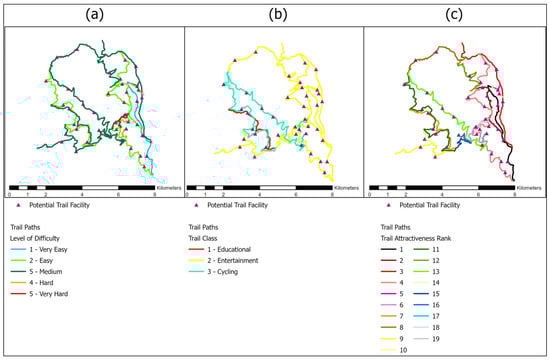
Figure 6.
Spatial distribution of the qualitative criteria along the Mount Paiko trail network and location of the forty potential trail facility (PTF) sites: (a) trail paths classified by level of difficulty; (b) trail paths categorized by trail class; (c) trail paths coded by trail attractiveness rank.
Figure 7 presents the Distance from Starting Point (C4), ranging from 959 m to 15,616 m, with a mean distance of 8124 m. Sites farther from the trailhead indicate longer hiking sections and a greater need for resting infrastructure to maintain visitor comfort over extended distances.
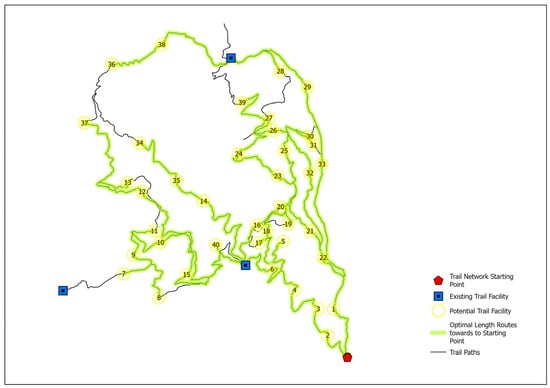
Figure 7.
Spatial distribution of the Distance from Starting Point (C4) for each potential trail facility (PTF), calculated through network-based optimal route analysis.
Figure 8 depicts the Traversal Time from Nearest Trail Facility (C5), derived through Network Analysis using Naismith’s Rule. Values vary between 7.21 and 108.98 min, with an average of 48.34 min and standard deviation of 23.21 min. Longer times highlight insufficient facility coverage, mainly on the upper western and northern slopes, whereas shorter times correspond to already serviced areas near the main entry point.
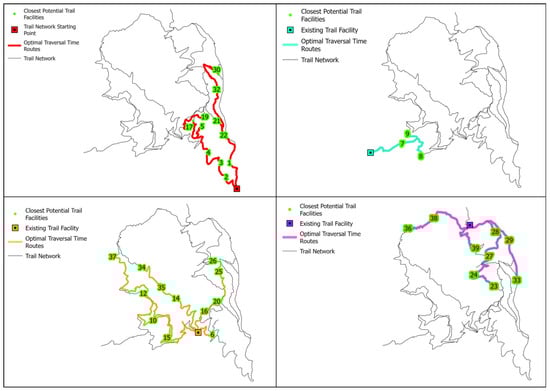
Figure 8.
Results of the Network Analysis showing the Traversal Time from Nearest Trail Facility (C5), estimated using Naismith’s Rule based on DEM-derived elevation data.
Table 5 summarizes the complete set of calculated criteria values for the forty candidate sites. The results reflect significant variation across the network in both physical and spatial aspects, confirming the diversity of trail conditions. These data form the basis for the PROMETHEE II analysis, which integrates the criteria values and weights to produce the final ranking of potential facility locations.
Table 5.
Computed values of the five evaluation criteria (C1–C5) for the forty potential trail facility (PTF) locations in the Mount Paiko trail network.
3.3. Trail Facility Potential Locations Ranking
The PROMETHEE II analysis was implemented to establish a final ranking of the forty (40) potential trail facility (PTF) locations, following the computational framework presented in Section 2.6. The procedure combined the criteria values (C1–C5) derived in the previous sections with the AHP-based weighting factors obtained in Section 3.1 (C1 = 0.20, C2 = 0.14, C3 = 0.14, C4 = 0.10, C5 = 0.41). After the computation of all five criteria values presented in Table 5, a unified numerical dataset was constructed to serve as the input for the PROMETHEE II analysis. This table (Table A1 in Appendix A) compiles the arithmetic values of each criterion for the forty (40) potential trail facility (PTF) locations, ensuring that both qualitative and quantitative indicators were expressed in consistent numeric form according to the scaling system defined in Table 1. In addition, Table 6 summarizes the minimum and maximum values of the five evaluation criteria (C1–C5) used in the PROMETHEE II analysis. These limits define the range of variation for each criterion and were used as reference values during the normalization process.
Table 6.
Minimum and maximum values of the five evaluation criteria (C1–C5) defining the input range for the normalization phase of the PROMETHEE II analysis.
The raw values of the five criteria (C1–C5) were transformed into dimensionless scores in the [0,1] range so that indicators with different units and directions of preference could be compared directly. Beneficial criteria (C1, C4, C5) were rescaled so that higher values denote more desirable conditions, whereas non-beneficial criteria (C2, C3) were inversely rescaled. The resulting normalized decision matrix for the forty PTF locations is reported in Table A2 in Appendix A.
On this basis, pairwise differences were computed for all combinations of PTF locations and converted into criterion-specific preference degrees using the PROMETHEE II preference functions, as outlined in Section 2.6. These comparisons reveal substantial dispersion among alternatives for Trail Attractiveness Rank (C3) and Traversal Time from Nearest Facility (C5), which frequently exhibit strong positive or negative gaps between sites. By contrast, Trail Class (C2) and Distance from Starting Point (C4) display more moderate contrasts, indicating broadly similar conditions across much of the network.
The criterion-level preference degrees were aggregated using the AHP-derived weights (Table 4) to obtain global preference indices for each ordered pair of PTF locations. In this way, expert judgments on the relative importance of the criteria and the quantitative trail attributes were combined into a single multi-criteria decision structure. These global indices summarize the extent to which one site is preferred over another when all weighted criteria are considered simultaneously and form the basis for the leaving, entering, and net flow values discussed in the following paragraphs.
In the final phase of the PROMETHEE II procedure, the aggregated preference indices were synthesized into three principal measures: the leaving flow (φ+) represents the extent to which each alternative dominates others; the entering flow (φ−) indicates the degree to which it is dominated by others; and the net flow (φ) is defined as the difference between the two. These values were calculated for all forty (40) potential trail facility (PTF) locations and are presented in Table 7.
Table 7.
Distribution of PROMETHEE II net outranking flows (φ) for the forty potential trail facility (PTF) locations, illustrating the most and least suitable positions for new resting facilities.
The results exhibit a clear differentiation among the alternatives, with φ values ranging between −0.228 and +0.309, demonstrating the discriminating capacity of the model. The highest-ranking site (PTF 12) achieved a net flow of +0.309, representing the most suitable location for the installation of a new resting facility. This site is located along an educational trail of medium difficulty and corresponds to one of the longest traversal times from the nearest facility, indicating both high user exposure and limited existing infrastructure. Following this, PTF 37 (φ = +0.173), PTF 30 (φ = +0.166), and PTF 31 (φ = +0.147) also scored highly, corresponding to mid- and upper-elevation segments of the network where long walking distances and high scenic attractiveness coincide with limited accessibility. These areas are therefore characterized by both high recreational value and a substantial need for service enhancement. Conversely, locations such as PTF 6 (φ = −0.228), PTF 2 (φ = −0.185), and PTF 1 (φ = −0.167) occupy the lowest positions in the ranking. These sites are found near the main trailheads, along routes of low difficulty and short distance, where existing resting facilities already provide sufficient coverage. Their negative net flow values indicate a limited necessity for further infrastructure development. The intermediate sites display φ values close to zero, suggesting that they offer balanced but non-critical conditions in terms of facility needs. Overall, the distribution of the PROMETHEE II net flows reflects a consistent and spatially balanced prioritization pattern, distinguishing between overserved and underserved trail segments. Figure 9 shows that only a subset of the forty candidate locations achieves clearly positive net flows, with PTF12, PTF36, and PTF2 emerging as the highest-priority sites. Several locations display slightly positive values, indicating moderate suitability, whereas a larger group of candidates has negative φ(a), reflecting low relative preference once all five criteria and their weights are considered.
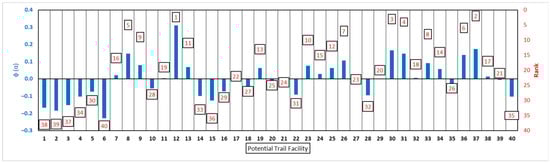
Figure 9.
PROMETHEE II net flow values φ(a) for the forty candidate trail facilities (blue bars); the red labels indicate the corresponding rank of each location (1 = highest priority, 40 = lowest) in the final ordering.
4. Discussion
Τhe results demonstrate that integrating GIS-based network analysis with a hybrid AHP–PROMETHEE II framework provides a reliable and transparent means for identifying optimal forest trail facility locations. The integration of spatial and experiential criteria yielded a ranking that reflects both user accessibility and environmental suitability. As shown in Table 5 and Table 7, the highest-ranking potential trail facilities (PTF 12, 37, 30, 31, and 8) correspond to trail segments combining medium difficulty (C1 = 3–4), educational or entertainment class routes (C2 = 1–2), and moderately high scenic attractiveness (C3 ≈ 5–9), with long distances from the trailhead (C4 ≈ 9–15 km) and extended traversal times from existing facilities (C5 = 65–90 min). These quantitative characteristics explain their superior PROMETHEE II net flows (φ > 0.14), indicating that they provide the greatest marginal improvement in trail comfort and spatial service coverage. In contrast, the lowest-ranked alternatives (PTF 6, 2, 1) exhibit the opposite pattern: low trail difficulty (C1 = 1–2), cycling class (C2 = 3), and short travel distances (C4 < 5 km), with minimal gaps in service (C5 < 20 min). Their negative φ values (−0.167 to −0.228) confirm that additional facilities near the main trailhead would contribute little to overall accessibility. These contrasts show that the model successfully discriminates between over-served and under-served areas based on objective trail parameters.
The quantitative correspondence between the criteria values and the outranking flows reinforces the internal validity of the hybrid AHP–PROMETHEE II system. The predominance of C5 (Traversal Time from Nearest Facility) in the weighting structure (0.41) explains why the longest uninterrupted trail segments—particularly on the upper western and northern slopes—achieved the highest scores. These segments represent the greatest accessibility gaps, and improving them would extend the functional reach of the trail network. Similarly, the significance of C1 (Trail Difficulty) in the AHP weights (0.20) elevated sites located on moderately challenging paths, where fatigue and recovery demand are higher. This pattern is consistent with the expectation that rest areas should be strategically placed on intermediate slopes rather than at easily accessible or excessively steep points. The combination of physical effort, scenic appeal, and remoteness defines an optimal balance for facility placement—an equilibrium also recognized by studies such as Tomczyk et al. (2017) [] and Callau et al. (2025) [], who emphasized that effective trail planning must align infrastructure with both environmental context and user experience.
When compared to earlier GIS–MCDM studies, the present results extend previous approaches by quantifying not only environmental or physical suitability but also spatial accessibility along the trail network. In this respect, the study does not propose a new decision-making algorithm, but rather adapts established GIS-based network analysis and AHP–PROMETHEE II tools to explicitly capture and prioritize spatial service gaps along a forest trail network. Similarly to the road-network optimization by Talebi et al. (2019) [], which weighted slope and environmental sensitivity, our model integrates the geometric realities of trail connectivity. Moreover, the hybrid decision structure mirrors successful implementations in park and landscape management [,], where AHP establishes coherent weighting and PROMETHEE delivers robust ranking differentiation. The observed φ-range (−0.228 to +0.309) indicates strong discriminating power—comparable to the rank stability reported in those studies—confirming that Mount Paiko’s facility prioritization is both methodologically sound and contextually relevant.
From a management standpoint, the high-ranking sites correspond to medium-difficulty, high-attractiveness routes located more than 10 km from the starting point, implying that new facilities should target areas where user effort and distance converge. These are the sections where resting infrastructure would yield the greatest user benefit and redistribute visitation pressure across the network. Conversely, the lowest-scoring sites, concentrated near entry points and flat terrain, already enjoy sufficient infrastructure coverage and thus require no further development. This spatial differentiation echoes sustainable recreation planning principles: optimizing facility placement enhances comfort and safety without unnecessary environmental disturbance, as advocated by Akbarian Ronizi et al. (2023) [].
Finally, the integration of AHP-derived expert priorities with quantitative network metrics proved effective in producing stable and interpretable rankings. Sensitivity checks showed that minor variations in weights did not alter the position of the top-tier alternatives, confirming the model’s robustness. These outcomes collectively validate the working hypothesis that GIS-based hybrid MADM frameworks can serve as powerful decision-support tools for sustainable trail planning. The AHP-derived weights therefore play a key role in shaping the ranking: the relatively high importance assigned to traversal time from the nearest facility (C5) and to trail attractiveness (C3) drives the prioritization towards locations that close large accessibility gaps along appealing sections of the network, whereas criteria such as trail difficulty and proximity to the main trailhead (C1–C2) have a more secondary influence on the final ordering of sites.
Future research should expand this framework to other ecosystems and trail types, incorporate user perception and behavioral data to refine experiential criteria, and integrate dynamic ecological indicators (e.g., habitat sensitivity, erosion monitoring) to ensure adaptive management under changing environmental conditions. A key limitation of the present implementation is that the PROMETHEE II ranking is computed in a single-shot manner: the traversal-time criterion (C5) is evaluated with respect to the existing configuration of facilities and is not updated after each new site is hypothetically installed. An important avenue for future work would be to embed the same evaluation criteria in an iterative location–allocation scheme, recalculating C5 after each selected site so as to explicitly account for the progressive reduction of accessibility gaps along the trail network. A further limitation is that the framework operates without dynamic visitor-flow measurements; all scores and weights rely on static information and stakeholder knowledge, which may not fully represent temporal variations in trail use.
5. Conclusions
This study demonstrates that integrating GIS-based network analysis with a hybrid AHP–PROMETHEE II multi-criteria framework effectively resolves the core planning challenge identified in this research—determining where limited resources for forest trail facilities should be allocated to achieve the greatest accessibility and user benefit with minimal environmental impact. By combining spatial analytics with structured expert judgment, the proposed approach transforms a traditionally intuitive and subjective decision process into an objective, transparent, and reproducible model. The results confirm that this integration enables planners to identify the most suitable trail segments for new facilities, ensuring that infrastructure development aligns with both user needs and ecological constraints. The consistency of the ranking outcomes, supported by their agreement with empirical observations and comparable studies, validates the framework’s capacity to provide clear, evidence-based guidance for spatial prioritization. In doing so, the study successfully answers its central research question by demonstrating how GIS and MADM tools can jointly support rational, data-driven, and sustainable decision-making in forest recreation planning.
Beyond its methodological contribution, the findings have direct policy and management implications. Forest administrations and local authorities can use the model as a decision-support instrument to prioritize investments, ensuring that limited financial and material resources are allocated to trail segments with the greatest recreational demand and accessibility deficits. The resulting spatial prioritization can guide the design of regional recreation plans, the inclusion of rest-area infrastructure in sustainable tourism strategies, and alignment with national or EU forest policy objectives for social inclusion and ecosystem protection. Moreover, the approach enhances transparency and accountability in planning decisions, offering a replicable procedure that can be integrated into participatory planning processes involving municipalities, forest services, and local communities.
In practical terms, the methodology supports adaptive forest management by identifying where facility development will yield the highest social return with minimal environmental cost. It thus contributes to the implementation of broader sustainability frameworks, such as the EU Green Infrastructure Strategy and the UN Sustainable Development Goals (SDG 11 and SDG 15), by promoting equitable access to natural recreation spaces and responsible land stewardship.
Acknowledging the framework’s current limitations—such as the absence of dynamic visitor flow data, ecological monitoring, and the non-iterative treatment of accessibility (criterion C5)—future research should seek to integrate behavioral and environmental feedback to refine suitability assessments. Expanding the model to different ecosystems or trail typologies will further test its generalizability and inform cross-regional recreation planning. Overall, this work provides a reproducible and policy-relevant pathway for designing forest trail systems that enhance visitor experience, support local development, and uphold environmental integrity.
Funding
This research received no external funding.
Data Availability Statement
All data from the research are available upon request from the corresponding author.
Acknowledgments
The author warmly thanks the stakeholders of the Mount Paiko trail network for their generous collaboration through consultation meetings and field discussions. Special appreciation is extended to the representatives of the Forest Service of Pella, the Municipality of Pella, and the Mount Paiko Mountaineering Club, who provided data and local knowledge and participated in the consensus-based AHP pairwise comparisons. Their input and feedback were invaluable in validating the evaluation criteria and the proposed facility locations.
Conflicts of Interest
The author declares no conflicts of interest.
Abbreviations
The following abbreviations are used in this manuscript:
| PROMETHEE | Preference Ranking Organization Method for Enrichment Evaluation |
| AHP | Analytical Hierarchy Process |
| GIS | Geographical Information Systems |
| MADM | Multi Attribute Decision Making |
| MCDM | Multi Criteria Decision Making |
| DEM | Digital Elevation Model |
| PTF | Potential Trail Facility |
Appendix A


Figure A1.
Representative photographs of the study area: (a) Potential trail facility location 38 (PTF 38), a characteristic site suitable for small-scale resting infrastructure (b) section of Trail 2E, illustrating typical terrain and tread width (c) PTF 29, with favorable alignment and adequate sight distance along the corridor (d) PTF 32, a local widening appropriate for short stop-and-rest.
Table A1.
Arithmetic decision matrix comprising the raw numeric values of the five evaluation criteria (C1–C5) for the forty potential trail facility (PTF) locations used as input in the PROMETHEE II procedure.
Table A1.
Arithmetic decision matrix comprising the raw numeric values of the five evaluation criteria (C1–C5) for the forty potential trail facility (PTF) locations used as input in the PROMETHEE II procedure.
| PTF | C1 | C2 | C3 | C4 | C5 | PTF | C1 | C2 | C3 | C4 | C5 |
|---|---|---|---|---|---|---|---|---|---|---|---|
| 1 | 1 | 2 | 1 | 1412 | 17.47 | 21 | 2 | 2 | 2 | 3610 | 40.61 |
| 2 | 2 | 2 | 4 | 959 | 7.21 | 22 | 1 | 2 | 1 | 2894 | 34.55 |
| 3 | 2 | 2 | 4 | 1770 | 14.38 | 23 | 2 | 2 | 4 | 7603 | 63.55 |
| 4 | 2 | 2 | 4 | 3124 | 24.97 | 24 | 2 | 2 | 4 | 9100 | 48.73 |
| 5 | 4 | 3 | 17 | 5150 | 50.06 | 25 | 2 | 2 | 2 | 5997 | 58.98 |
| 6 | 3 | 3 | 13 | 4849 | 14.62 | 26 | 2 | 2 | 2 | 6820 | 68.59 |
| 7 | 3 | 2 | 9 | 14,553 | 34.86 | 27 | 2 | 2 | 4 | 10,694 | 32.71 |
| 8 | 3 | 2 | 9 | 15,050 | 66.95 | 28 | 2 | 2 | 4 | 9019 | 16.52 |
| 9 | 3 | 2 | 10 | 13,307 | 54.92 | 29 | 3 | 2 | 3 | 6874 | 29.86 |
| 10 | 2 | 3 | 11 | 11,591 | 56.59 | 30 | 3 | 2 | 5 | 7024 | 77.53 |
| 11 | 2 | 3 | 11 | 13,149 | 69.14 | 31 | 4 | 2 | 14 | 7212 | 78.65 |
| 12 | 3 | 1 | 7 | 12,196 | 91.12 | 32 | 1 | 2 | 1 | 5103 | 55.77 |
| 13 | 2 | 3 | 11 | 14,312 | 84.28 | 33 | 3 | 2 | 3 | 5067 | 57.22 |
| 14 | 3 | 3 | 13 | 9579 | 39.77 | 34 | 3 | 3 | 13 | 12,182 | 75.88 |
| 15 | 2 | 3 | 11 | 9743 | 41.15 | 35 | 3 | 3 | 13 | 10,421 | 50.79 |
| 16 | 3 | 2 | 6 | 5378 | 20.33 | 36 | 3 | 2 | 8 | 12,908 | 66.37 |
| 17 | 2 | 2 | 4 | 5445 | 43.43 | 37 | 2 | 3 | 11 | 15,616 | 108.98 |
| 18 | 5 | 3 | 19 | 5410 | 46.66 | 38 | 3 | 2 | 8 | 11,466 | 36.56 |
| 19 | 2 | 2 | 4 | 6966 | 61.50 | 39 | 3 | 2 | 12 | 9231 | 43.75 |
| 20 | 3 | 2 | 6 | 4623 | 33.54 | 40 | 3 | 1 | 18 | 7539 | 15.18 |
Table A2.
Normalized decision matrix for the forty potential trail facility (PTF) locations during the PROMETHEE II analysis.
Table A2.
Normalized decision matrix for the forty potential trail facility (PTF) locations during the PROMETHEE II analysis.
| PTF | C1 | C2 | C3 | C4 | C5 | PTF | C1 | C2 | C3 | C4 | C5 |
|---|---|---|---|---|---|---|---|---|---|---|---|
| 1 | 0.0000 | 0.5000 | 1.0000 | 0.0309 | 0.1008 | 21 | 0.2500 | 0.5000 | 0.9444 | 0.1809 | 0.3282 |
| 2 | 0.2500 | 0.5000 | 0.8333 | 0.0000 | 0.0000 | 22 | 0.0000 | 0.5000 | 1.0000 | 0.1320 | 0.2687 |
| 3 | 0.2500 | 0.5000 | 0.8333 | 0.0554 | 0.0705 | 23 | 0.2500 | 0.5000 | 0.8333 | 0.4533 | 0.5536 |
| 4 | 0.2500 | 0.5000 | 0.8333 | 0.1477 | 0.1746 | 24 | 0.2500 | 0.5000 | 0.8333 | 0.5555 | 0.4079 |
| 5 | 0.7500 | 0.0000 | 0.1111 | 0.2859 | 0.4210 | 25 | 0.2500 | 0.5000 | 0.9444 | 0.3438 | 0.5088 |
| 6 | 0.5000 | 0.0000 | 0.3333 | 0.2654 | 0.0728 | 26 | 0.2500 | 0.5000 | 0.9444 | 0.3999 | 0.6031 |
| 7 | 0.5000 | 0.5000 | 0.5556 | 0.9275 | 0.2717 | 27 | 0.2500 | 0.5000 | 0.8333 | 0.6642 | 0.2505 |
| 8 | 0.5000 | 0.5000 | 0.5556 | 0.9614 | 0.5870 | 28 | 0.2500 | 0.5000 | 0.8333 | 0.5499 | 0.0915 |
| 9 | 0.5000 | 0.5000 | 0.5000 | 0.8425 | 0.4688 | 29 | 0.5000 | 0.5000 | 0.8889 | 0.4036 | 0.2225 |
| 10 | 0.2500 | 0.0000 | 0.4444 | 0.7254 | 0.4852 | 30 | 0.5000 | 0.5000 | 0.7778 | 0.4138 | 0.6910 |
| 11 | 0.2500 | 0.0000 | 0.4444 | 0.8317 | 0.6085 | 31 | 0.7500 | 0.5000 | 0.2778 | 0.4266 | 0.7020 |
| 12 | 0.5000 | 1.0000 | 0.6667 | 0.7667 | 0.8245 | 32 | 0.0000 | 0.5000 | 1.0000 | 0.2827 | 0.4772 |
| 13 | 0.2500 | 0.0000 | 0.4444 | 0.9110 | 0.7573 | 33 | 0.5000 | 0.5000 | 0.8889 | 0.2803 | 0.4914 |
| 14 | 0.5000 | 0.0000 | 0.3333 | 0.5881 | 0.3200 | 34 | 0.5000 | 0.0000 | 0.3333 | 0.7657 | 0.6748 |
| 15 | 0.2500 | 0.0000 | 0.4444 | 0.5993 | 0.3335 | 35 | 0.5000 | 0.0000 | 0.3333 | 0.6456 | 0.4282 |
| 16 | 0.5000 | 0.5000 | 0.7222 | 0.3015 | 0.1289 | 36 | 0.5000 | 0.5000 | 0.6111 | 0.8152 | 0.5813 |
| 17 | 0.2500 | 0.5000 | 0.8333 | 0.3060 | 0.3559 | 37 | 0.2500 | 0.0000 | 0.4444 | 1.0000 | 1.0000 |
| 18 | 1.0000 | 0.0000 | 0.0000 | 0.3037 | 0.3877 | 38 | 0.5000 | 0.5000 | 0.6111 | 0.7168 | 0.2884 |
| 19 | 0.2500 | 0.5000 | 0.8333 | 0.4099 | 0.5335 | 39 | 0.5000 | 0.5000 | 0.3889 | 0.5644 | 0.3591 |
| 20 | 0.5000 | 0.5000 | 0.7222 | 0.2500 | 0.2587 | 40 | 0.5000 | 1.0000 | 0.0556 | 0.4490 | 0.0783 |
References
- Focacci, M.; Schaffer, C.; De Meo, I.; Paletto, A.; Salbitano, F. Exploration of the functions and potentials of urban forest gardens in Sweden. Urban For. Urban Green. 2025, 112, 128990. [Google Scholar] [CrossRef]
- Reza, M.I.H.; Hossain, M.A.; Bokhtear, U.S. Editorial: Recreational forests for co-benefits: Conservation, tourism and well-being. Front. For. Glob. Change 2025, 8, 1670540. [Google Scholar] [CrossRef]
- Ghai, S. Development of agritourism through perspective of sustainable development: A systematic review and bibliometric analysis. Int. J. Sustain. Agric. Manag. Inform. 2025, 11, 204–225. [Google Scholar] [CrossRef]
- Koutroumanidis, T.; Zafeiriou, E.; Arabatzis, G. Asymmetry in price transmission between the producer and the consumer prices in the wood sector and the role of imports: The case of Greece. For. Policy Econ. 2009, 11, 56–64. [Google Scholar] [CrossRef]
- Kyriakopoulos, G.L. Land Use Planning and Green Environment Services: The Contribution of Trail Paths to Sustainable Development. Land 2023, 12, 1041. [Google Scholar] [CrossRef]
- Marion, J.L.; Wilkins, E.J. Trail sustainability broadly defined. J. Outdoor Recreat. Tour. 2024, 47, 100805. [Google Scholar] [CrossRef]
- Louka, V.; Arabatzis, G.; Kantartzis, A. The infrastructure contribution to the regional development and the environmental protection: Typologies of regional units based on forest operations engineering. IOP Conf. Ser. Earth Environ. Sci. 2022, 1123, 012010. [Google Scholar] [CrossRef]
- Mantuano, A.; Bruno, F. Classification of Hiking Difficulty Levels of Accessible Natural Trails. Sustainability 2025, 17, 5699. [Google Scholar] [CrossRef]
- Tomczyk, A.M.; Ewertowski, M.W.; White, P.C.L.; Kasprzak, L. A new framework for prioritising decisions on recreational trail management. Landsc. Urban Plan. 2017, 167, 1–13. [Google Scholar] [CrossRef]
- Kantartzis, A.; Arabatzis, G.; Christopoulou, O.; Sfougaris, A.; Sakellariou, S.; Malesios, C.; Tsiaras, E.; Samara, F.; Th Tampekis, S. Forest roads planning and management in terms of Social-Ecological Systems (SES) framework. IOP Conf. Ser. Earth Environ. Sci. 2021, 899, 012052. [Google Scholar] [CrossRef]
- Janeczko, E.; Jakubisová, M.; Woźnicka, M.; Fialova, J.; Kotásková, P. Preferences of people with disabilities on wheelchairs in relation to forest trails for recreational in selected European countries. Folia For. Pol. 2016, 58, 116–122. [Google Scholar] [CrossRef]
- United Nations Department of Economic and Social Affairs, Population Division. World Population Prospects 2024: Summary of Results (UN DESA/POP/2024/TR/NO. 9); United Nations Department of Economic and Social Affairs, Population Division: New York, NY, USA, 2024; Available online: https://desapublications.un.org/file/20847/download (accessed on 1 October 2025).
- Spiegel, Y.; Collins-Kreiner, N.; Ketter, E. Forest- and Nature-Based Recreation for Older Adults: Preferences, Well-Being, and the Need for Inclusive Planning. Forests 2025, 16, 1213. [Google Scholar] [CrossRef]
- Schamel, J.; Job, H. National Parks and demographic change—Modelling the effects of ageing hikers on mountain landscape intra-area accessibility. Landsc. Urban Plan. 2017, 163, 32–43. [Google Scholar] [CrossRef]
- Malec, M.M.; Ziernicka-Wojtaszek, A.; Kędzior, R. Can Tourists’ Preferences Determine the Direction of Sustainable Development in Mountain Landscapes? Sustainability 2024, 16, 10133. [Google Scholar] [CrossRef]
- Gupta, A.; Yadav, M.; Nayak, B.K. A Systematic Literature Review on Inclusive Public Open Spaces: Accessibility Standards and Universal Design Principles. Urban Sci. 2025, 9, 181. [Google Scholar] [CrossRef]
- Lee, J.; Lee, H.-S.; Jeong, D.; Shafer, C.S.; Chon, J. The Relationship between User Perception and Preference of Greenway Trail Characteristics in Urban Areas. Sustainability 2019, 11, 4438. [Google Scholar] [CrossRef]
- Reed, J.A.; Ballard, R.M.; Hill, M.; Berrigan, D. Identification of Effective Programs to Improve Access to and Use of Trails Among Youth from Under-Resourced Communities: A Review. Int. J. Environ. Res. Public Health 2020, 17, 7707. [Google Scholar] [CrossRef]
- Oswald Beiler, M.; McGoff, R.; McLaughlin, S. Trail Network Accessibility: Analyzing Collector Pathways to Support Pedestrian and Cycling Mobility. J. Urban Plan. Dev. 2017, 143, 04016024. [Google Scholar] [CrossRef]
- Àvila Callau, A.; Erdozain, M.; Farías-Torbidoni, E.I.; de-Miguel, S. Linking Forest Planning and Recreational Trail Design: A GIS Approach for Enhancing the Social Use of Forests. Environ. Manag. 2025, 75, 2150–2168. [Google Scholar] [CrossRef]
- Ishbulatov, M.; Miftakhov, I.; Churagulova, Z.; Mindibayev, R.; Komissarov, A. Applying GIS Technologies for Mapping Natural and Anthropogenic Transformed Soils in the Southern Forest-Steppe of the Republic of Bashkortostan. Agris-Line Pap. Econ. Inform. 2020, 12, 29–45. [Google Scholar] [CrossRef]
- Olafsson, A.S.; Skov-Petersen, H. The use of GIS-based support of recreational trail planning by local governments. Appl. Spat. Anal. Policy 2014, 7, 149–168. [Google Scholar] [CrossRef]
- Dubuc, S. GIS-based accessibility analysis for network optimal location model: An application for bio-energy projects of the mineral Industry in the UK. Cybergeo 2007. [Google Scholar] [CrossRef]
- Baerenklau, K.A.; González-Cabán, A.; Paez, C.; Chavez, E. Spatial allocation of forest recreation value. J. For. Econ. 2010, 16, 113–126. [Google Scholar] [CrossRef]
- Nouri, J.; Arjmandi, R.; Riazi, B.; Aleshekh, A.A.; Motahari, S. Comparing multi-criteria decision-making (MCDM) tool and huff model to determine the most appropriate method for selecting mountain tourism sites. Environ. Eng. Manag. J. 2016, 15, 41–52. [Google Scholar] [CrossRef]
- Türk, E. Multi-criteria Decision-Making for Greenways: The Case of Trabzon, Turkey. Plan. Pract. Res. 2017, 33, 326–343. [Google Scholar] [CrossRef]
- Özkan, B.; Özceylan, E.; Sarıçiçek, İ. GIS-based MCDM modeling for landfill site suitability analysis: A comprehensive review of the literature. Environ. Sci. Pollut. Res. 2019, 26, 30711–30730. [Google Scholar] [CrossRef]
- Tohidi, A.; Ghorbani, M.; Karbasi, A.-R.; Asgharpourmasouleh, A.; Hassani-Mahmooei, B. Comparison of Fuzzy Multi-Criteria Decision-Making Methods to Rank Business Strategies and Marketing Resources. Agris-Line Pap. Econ. Inform. 2020, 12, 101–114. [Google Scholar] [CrossRef]
- Kantartzis, A. Implementation of multi-criteria evaluation for mapping the spatial variability of optimal forest road network. Int. J. Sustain. Agric. Manag. Inform. 2023, 9, 275–293. [Google Scholar] [CrossRef]
- Ioannou, K.; Tsantopoulos, G.; Arabatzis, G. A Decision Support System methodology for selecting wind farm installation locations using AHP and TOPSIS: Case study in Eastern Macedonia and Thrace region, Greece. Energy Policy 2019, 132, 232–246. [Google Scholar] [CrossRef]
- Fung, T.; Wong, F.K.-K. Ecotourism planning using multiple criteria evaluation with GIS. Geocarto Int. 2007, 22, 87–105. [Google Scholar] [CrossRef]
- Tahri, M.; Kaspar, J.; Vacik, H.; Marusak, R. Multi-attribute decision making and geographic information systems: Potential tools for evaluating forest ecosystem services. Ann. For. Sci. 2021, 78, 41. [Google Scholar] [CrossRef]
- Akbarian Ronizi, S.R.; Mokarram, M.; Negahban, S. Investigation of Sustainable Rural Tourism Activities with Different Risk: A GIS—MCDM Case in Isfahan, Iran. Earth Space Sci. 2023, 10, e2021EA002153. [Google Scholar] [CrossRef]
- Tomczyk, A.M. A GIS assessment and modelling of environmental sensitivity of recreational trails: The case of Gorce National Park, Poland. Hazards 2011, 31, 339–351. [Google Scholar] [CrossRef]
- Prasetyo, E.D.W.; Handajani, M. Ismiyati Criteria Analysis, Weight and Priority for Handling Bridges in Kudus District Using AHP and Promethee II Methods. J. Phys. Conf. Ser. 2019, 1167, 012009. [Google Scholar] [CrossRef]
- Singh, A.; Gupta, A.; Mehra, A. Best criteria selection based PROMETHEE II method. OPSEARCH 2021, 58, 160–180. [Google Scholar] [CrossRef]
- Athawale, V.M.; Chatterjee, P.; Chakraborty, S. Decision making for facility location selection using PROMETHEE II method. Int. J. Ind. Syst. Eng. 2012, 11, 16. [Google Scholar] [CrossRef]
- Kuncova, M.; Seknickova, J. Two-stage weighted PROMETHEE II with results’ visualization. Cent. Eur. J. Oper. Res. 2022, 30, 547–571. [Google Scholar] [CrossRef]
- Krouska, A.; Kabassi, K.; Troussas, C.; Sgouropoulou, C. Personalizing Environmental Awareness Through Smartphones Using AHP and PROMETHEE II. Future Internet 2022, 14, 66. [Google Scholar] [CrossRef]
- Macharis, C.; Springael, J.; De Brucker, K.; Verbeke, A. PROMETHEE and AHP: The design of operational synergies in multicriteria analysis: Strengthening PROMETHEE with ideas of AHP. Manag. Future MCDA Dyn. Ethical Contrib. 2004, 153, 307–317. [Google Scholar] [CrossRef]
- Haddad, M.; Sanders, D.; Bausch, N.; Tewkesbury, G.; Gegov, A.; Hassan, M. Learning to Make Intelligent Decisions Using an Expert System for the Intelligent Selection of Either PROMETHEE II or the Analytical Hierarchy Process. In Intelligent Systems and Applications; Arai, K., Kapoor, S., Bhatia, R., Eds.; Springer International Publishing: Berlin/Heidelberg, Germany, 2019; pp. 1303–1316. [Google Scholar]
- Nasiri, H.; Boloorani, A.D.; Sabokbar, H.A.F.; Jafari, H.R.; Hamzeh, M.; Rafii, Y. Determining the most suitable areas for artificial groundwater recharge via an integrated PROMETHEE II-AHP method in GIS environment (case study: Garabaygan Basin, Iran). Environ. Monit. Assess. 2013, 185, 707–718. [Google Scholar] [CrossRef]
- Dağdeviren, M. Decision making in equipment selection: An integrated approach with AHP and PROMETHEE. J. Intell. Manuf. 2008, 19, 397–406. [Google Scholar] [CrossRef]
- Lakićević, M.D.; Reynolds, K.M.; Gawryszewska, B.J. An integrated application of AHP and PROMETHEE in decision making for landscape management. Austrian J. For. Sci. 2021, 138, 137–182. [Google Scholar]
- Isa, M.A.M.; Saharudin, N.S.; Anuar, N.B.; Mahad, N.F. The application of AHP-PROMETHEE II for supplier selection. J. Phys. Conf. Ser. 2021, 1988, 012062. [Google Scholar] [CrossRef]
- Roodposhti, M.S.; Rahimi, S.; Beglou, M.J. PROMETHEE II and fuzzy AHP: An enhanced GIS-based landslide susceptibility mapping. Nat. Hazards 2014, 73, 77–95. [Google Scholar] [CrossRef]
- Srivastava, A.; Mishra, P.K. Energy efficient clustering using modified PROMETHEE-II and AHP approach in wireless sensor networks. Multimed. Tools Appl. 2023, 82, 47049–47080. [Google Scholar] [CrossRef]
- Saaty, R.W. The analytic hierarchy process—What it is and how it is used. Math. Model. 1987, 9, 161–176. [Google Scholar] [CrossRef]
- Saaty, T.L. Fundamentals of the Analytic Hierarchy Process. In The Analytic Hierarchy Process in Natural Resource and Environmental Decision Making; Schmoldt, D.L., Kangas, J., Mendoza, G.A., Pesonen, M., Eds.; Springer: Dordrecht, The Netherlands, 2001; pp. 15–35. [Google Scholar] [CrossRef]
- Kolkos, G.; Kantartzis, A.; Stergiadou, A.; Arabatzis, G. Development of Semi-Mountainous and Mountainous Areas: Design of Trail Paths, Optimal Spatial Distribution of Trail Facilities, and Trail Ranking via MCDM-VIKOR Method. Sustainability 2024, 16, 9966. [Google Scholar] [CrossRef]
- Scarf, P. Route choice in mountain navigation, Naismith’s rule, and the equivalence of distance and climb. J. Sports Sci. 2007, 25, 719–726. [Google Scholar] [CrossRef]
- Norman, J.M. Running Uphill: Energy Needs and Naismith’s Rule. J. Oper. Res. Soc. 2004, 55, 308–311. [Google Scholar] [CrossRef]
- Verriest, E.I. A variant to Naismith’s problem with application to path planning. IFAC Proc. Vol. 2008, 41, 7136–7141. [Google Scholar] [CrossRef]
- Brans, J.P.; Vincke, P. Note—A Preference Ranking Organisation Method: (The PROMETHEE Method for Multiple Criteria Decision-Making). Manag. Sci. 1985, 31, 647–656. [Google Scholar] [CrossRef]
- Ghorbani, S.; Bour, K.; Javdan, R. Applying the PROMETHEE II, WASPAS, and CoCoSo models for assessment of geotechnical hazards in TBM tunneling. Sci. Rep. 2025, 15, 491. [Google Scholar] [CrossRef]
- Pelit, İ.; Avşar, İ.İ. Turkiye’s Carbon Emission Profile: A Global Analysis with the MEREC-PROMETHEE Hybrid Method. Sustainability 2025, 17, 6527. [Google Scholar] [CrossRef]
- Callau, A.; Perez, Y.; Farías-Torbidoni, E.; Mas-Alòs, S.; González, J.; Peris, M. Enhancing outdoor recreational experience: A methodology for assessing peri-urban greenway suitability based on hiker physical activity levels and motivations. J. Outdoor Recreat. Tour. 2025, 50, 100893. [Google Scholar] [CrossRef]
- Talebi, M.; Majnounian, B.; Makhdoum, M.; Abdi, E.; Omid, M.; Marchi, E.; Laschi, A. A GIS-MCDM-based road network planning for tourism development and management in Arasbaran forest, Iran. Environ. Monit. Assess. 2019, 191, 647. [Google Scholar] [CrossRef]
Disclaimer/Publisher’s Note: The statements, opinions and data contained in all publications are solely those of the individual author(s) and contributor(s) and not of MDPI and/or the editor(s). MDPI and/or the editor(s) disclaim responsibility for any injury to people or property resulting from any ideas, methods, instructions or products referred to in the content. |
© 2025 by the author. Licensee MDPI, Basel, Switzerland. This article is an open access article distributed under the terms and conditions of the Creative Commons Attribution (CC BY) license (https://creativecommons.org/licenses/by/4.0/).