
An Environmental Equity Assessment Using a Social Vulnerability Index during the SARS-CoV-2 Pandemic for Siting of Wastewater-Based Epidemiology Locations in the United States

 ,
,  , , , , and
Abstract
1. Introduction
Wastewater-Based Epidemiology Proliferation, Costs, Utilization, Testing and Strategy
2. Materials and Methods
2.1. Hypotheses
2.2. Measures and Data Collection
2.3. Data Linkage and Analyses
2.3.1. Geospatial Analysis
2.3.2. Statistical Analysis
3. Results
3.1. Geospatial Analysis
3.2. Regression Analysis
4. Discussion
4.1. Limitations
4.2. Areas for Further Research
Author Contributions
Funding
Data Availability Statement
Conflicts of Interest
References
- O’Brien, D.A.; Clements, C.F. Early warning signal reliability varies with COVID-19 waves. Biol. Lett. 2021, 17, 1–6. [Google Scholar] [CrossRef]
- Alwan, N.A. Surveillance is underestimating the burden of the COVID-19 pandemic. Lancet 2020, 396, e24. [Google Scholar] [CrossRef] [PubMed]
- Daughton, C.G. Wastewater surveillance for population-wide COVID-19: The present and future. Sci. Total Environ. 2020, 736, 139631. [Google Scholar] [CrossRef] [PubMed]
- Medina, C.Y.; Kadonsky, K.F.; Roman, F.A.; Tariqi, A.Q.; Sinclair, R.G.; D’Aoust, P.M.; Delatolla, R.; Bischel, H.N.; Naughton, C.C. The need of an environmental justice approach for wastewater-based epidemiology for rural and disadvantaged communities: A review in California. Curr. Opin. Environ. Sci. Health 2022, 27, 100348. [Google Scholar] [CrossRef] [PubMed]
- Naughton, C.C.; Roman, F.A.; Alvarado, A.G.; Tariqi, A.Q.; Deeming, M.A.; Bibby, K.; Bivins, A.; Rose, J.B.; Medema, G.; Ahmed, W.; et al. Show us the data: Global COVID-19 wastewater monitoring efforts, equity, and gaps. FEMS Microbes 2023, 4, xtad003. [Google Scholar] [CrossRef] [PubMed]
- Ritchey, M.D.; Rosenblum, H.G.; Del Guercio, K.; Humbard, M.; Santos, S.; Hall, J.; Chaitram, J.; Salerno, R.M. COVID-19 self-test data: Challenges and opportunities—United States, 31 October 2021–11 June 2022. MMWR. Morb. Mortal. Wkly. Rep. 2022, 71, 1005–1010. [Google Scholar] [CrossRef] [PubMed]
- Lee, R.M.; Handunge, V.L.; Augenbraun, S.L.; Nguyen, H.; Torres, C.H.; Ruiz, A.; Emmons, K.M. Addressing COVID-19 testing inequities among underserved populations in Massachusetts: A rapid qualitative exploration of Health Center staff, partner, and resident perceptions. Front. Public Health 2022, 10, 838544. [Google Scholar] [CrossRef] [PubMed]
- Rader, B.; Gertz, A.; Iuliano, A.D.; Gilmer, M.; Wronski, L.; Astley, C.M.; Sewalk, K.; Varrelman, T.J.; Cohen, J.; Parikh, R.; et al. Use of at-home COVID-19 tests—United States, 23 August 2021–12 March 2022. MMWR. Morb. Mortal. Wkly. Rep. 2022, 71, 489–494. [Google Scholar] [CrossRef]
- Alvarez, E.; Bielska, I.A.; Hopkins, S.; Belal, A.A.; Goldstein, D.M.; Slick, J.; Pavalagantharajah, S.; Wynfield, A.; Dakey, S.; Gedeon, M.-C.; et al. Limitations of COVID-19 testing and case data for evidence-informed Health Policy and practice. Health Res. Policy Syst. 2023, 21, 11. [Google Scholar] [CrossRef]
- Sinclair, R.G.; Choi, C.Y.; Riley, M.R.; Gerba, C.P. Pathogen surveillance through monitoring of sewer systems. Adv. Appl. Microbiol. 2008, 65, 249–269. [Google Scholar] [CrossRef]
- Carrera, J.S.; Coffman, M.M.; Guest, J.S.; Wolfe, M.K.; Naughton, C.C.; Boehm, A.B.; Vela, J.D. Preventing scientific and ethical misuse of wastewater surveillance data. Environ. Sci. Technol. 2021, 55, 11473–11475. [Google Scholar]
- Betancourt, W.Q.; Schmitz, B.W.; Innes, G.K.; Prasek, S.M.; Pogreba Brown, K.M.; Stark, E.R.; Foster, A.R.; Sprissler, R.S.; Harris, D.T.; Sherchan, S.P.; et al. COVID-19 containment on a college campus via wastewater-based epidemiology, targeted clinical testing and an intervention. Sci. Total Environ. 2021, 779, 146408. [Google Scholar] [CrossRef] [PubMed]
- LaTurner, Z.W.; Zong, D.M.; Kalvapalle, P.; Gamas, K.R.; Terwilliger, A.; Crosby, T.; Ali, P.; Avadhanula, V.; Santos, H.H.; Weesner, K.; et al. Evaluating recovery, cost, and throughput of different concentration methods for SARS-CoV-2 wastewater-based epidemiology. Water Res. 2021, 197, 117043. [Google Scholar] [CrossRef] [PubMed]
- Lodder, W.; de Roda Husman, A.M. SARS-CoV-2 in wastewater: Potential health risk, but also data source. Lancet Gastroenterol. Hepatol. 2020, 5, 533–534. [Google Scholar] [CrossRef]
- Cuadros, D.F.; Branscum, A.J.; Mukandavire, Z.; Miller, F.D.; MacKinnon, N. Dynamics of the COVID-19 epidemic in urban and rural areas in the United States. Ann. Epidemiol. 2021, 59, 16–20. [Google Scholar] [CrossRef]
- CDPH. COVID-19 Wastewater Surveillance. California Department of Public Health. 2022. Available online: https://www.cdph.ca.gov/Programs/CID/DCDC/Pages/COVID-19/Wastewater-Surveillance.aspx (accessed on 5 April 2022).
- Centers for Disease Control and Prevention. CDC Social Vulnerability Index 2020. Agency for Toxic Substances and Disease Registry (ATSDR). 2022. Available online: https://www.atsdr.cdc.gov/placeandhealth/svi/documentation/pdf/SVI2020Documentation_08.05.22.pdf (accessed on 15 January 2023).
- Centers for Disease Control and Prevention. Health Equity Considerations and Racial and Ethnic Minority Groups. Centers for Disease Control and Prevention. 2022. Available online: https://www.cdc.gov/coronavirus/2019-ncov/community/health-equity/race-ethnicity.html (accessed on 8 March 2022).
- ESRI. ArcGIS 9: What is ArcGIS? ESRI: Redlands, CA, USA, 2001. [Google Scholar]
- Wolkin, A.; Collier, S.; House, J.S.; Reif, D.; Motsinger-Reif, A.; Duca, L.; Sharpe, J.D. Comparison of national vulnerability indices used by the centers for disease control and prevention for the COVID-19 response. Public Health Rep. 2022, 137, 803–812. [Google Scholar] [CrossRef]
- Wakefield, M.K.; Williams, D.R.; Menestrel, S.L.; Flaubert, J.L. The Future of Nursing 2020–2030: Charting a Path to Achieve Health Equity; The National Academies Press: Washington, DC, USA, 2021. [Google Scholar]
- Tarlock, A.D. City versus countryside: Environmental equity in context. Fordham Urban Law J. 1994, 21, 461. [Google Scholar]
- Winter, A.S.; Sampson, R.J. From lead exposure in early childhood to adolescent health: A Chicago birth cohort. Am. J. Public Health 2017, 107, 1496–1501. [Google Scholar] [CrossRef]
- Lyu, T.; Hair, N.; Yell, N.; Li, Z.; Qiao, S.; Liang, C.; Li, X. Temporal geospatial analysis of COVID-19 pre-infection determinants of risk in South Carolina. Int. J. Environ. Res. Public Health 2021, 18, 9673. [Google Scholar] [CrossRef]
- Levin, K.; How Poop Became One of Detroit’s Best Tools to Fight Pandemics. Outlier Media. 2023. Available online: https://outliermedia.org/tracking-disease-detroit-wastewater-testing-sewage-covid/ (accessed on 19 July 2023).
- Pacca, L.; Curzi, D.; Rausser, G.; Olper, A. The role of party affiliation, lobbying, and electoral incentives in decentralized US state support of the environment. J. Assoc. Environ. Resour. Econ. 2021, 8, 617–653. [Google Scholar] [CrossRef]
- Gonçalves, J.; Torres-Franco, A.; Rodriguéz, E.; Diaz, T.; Koritnik, P.; da Silva, G.; Mesquita, J.; Trkov, M.; Paragi, M.; Munoz, R.; et al. Centralized and Decentralized Wastewater-Based Epidemiology to Infer COVID-19 Transmission—A Brief Review. One Health 2022, 15, 100405. [Google Scholar] [CrossRef] [PubMed]


| Variable Name | Short Name | 2020 Description |
|---|---|---|
| STATE | state | State name |
| COUNTY | county | County name |
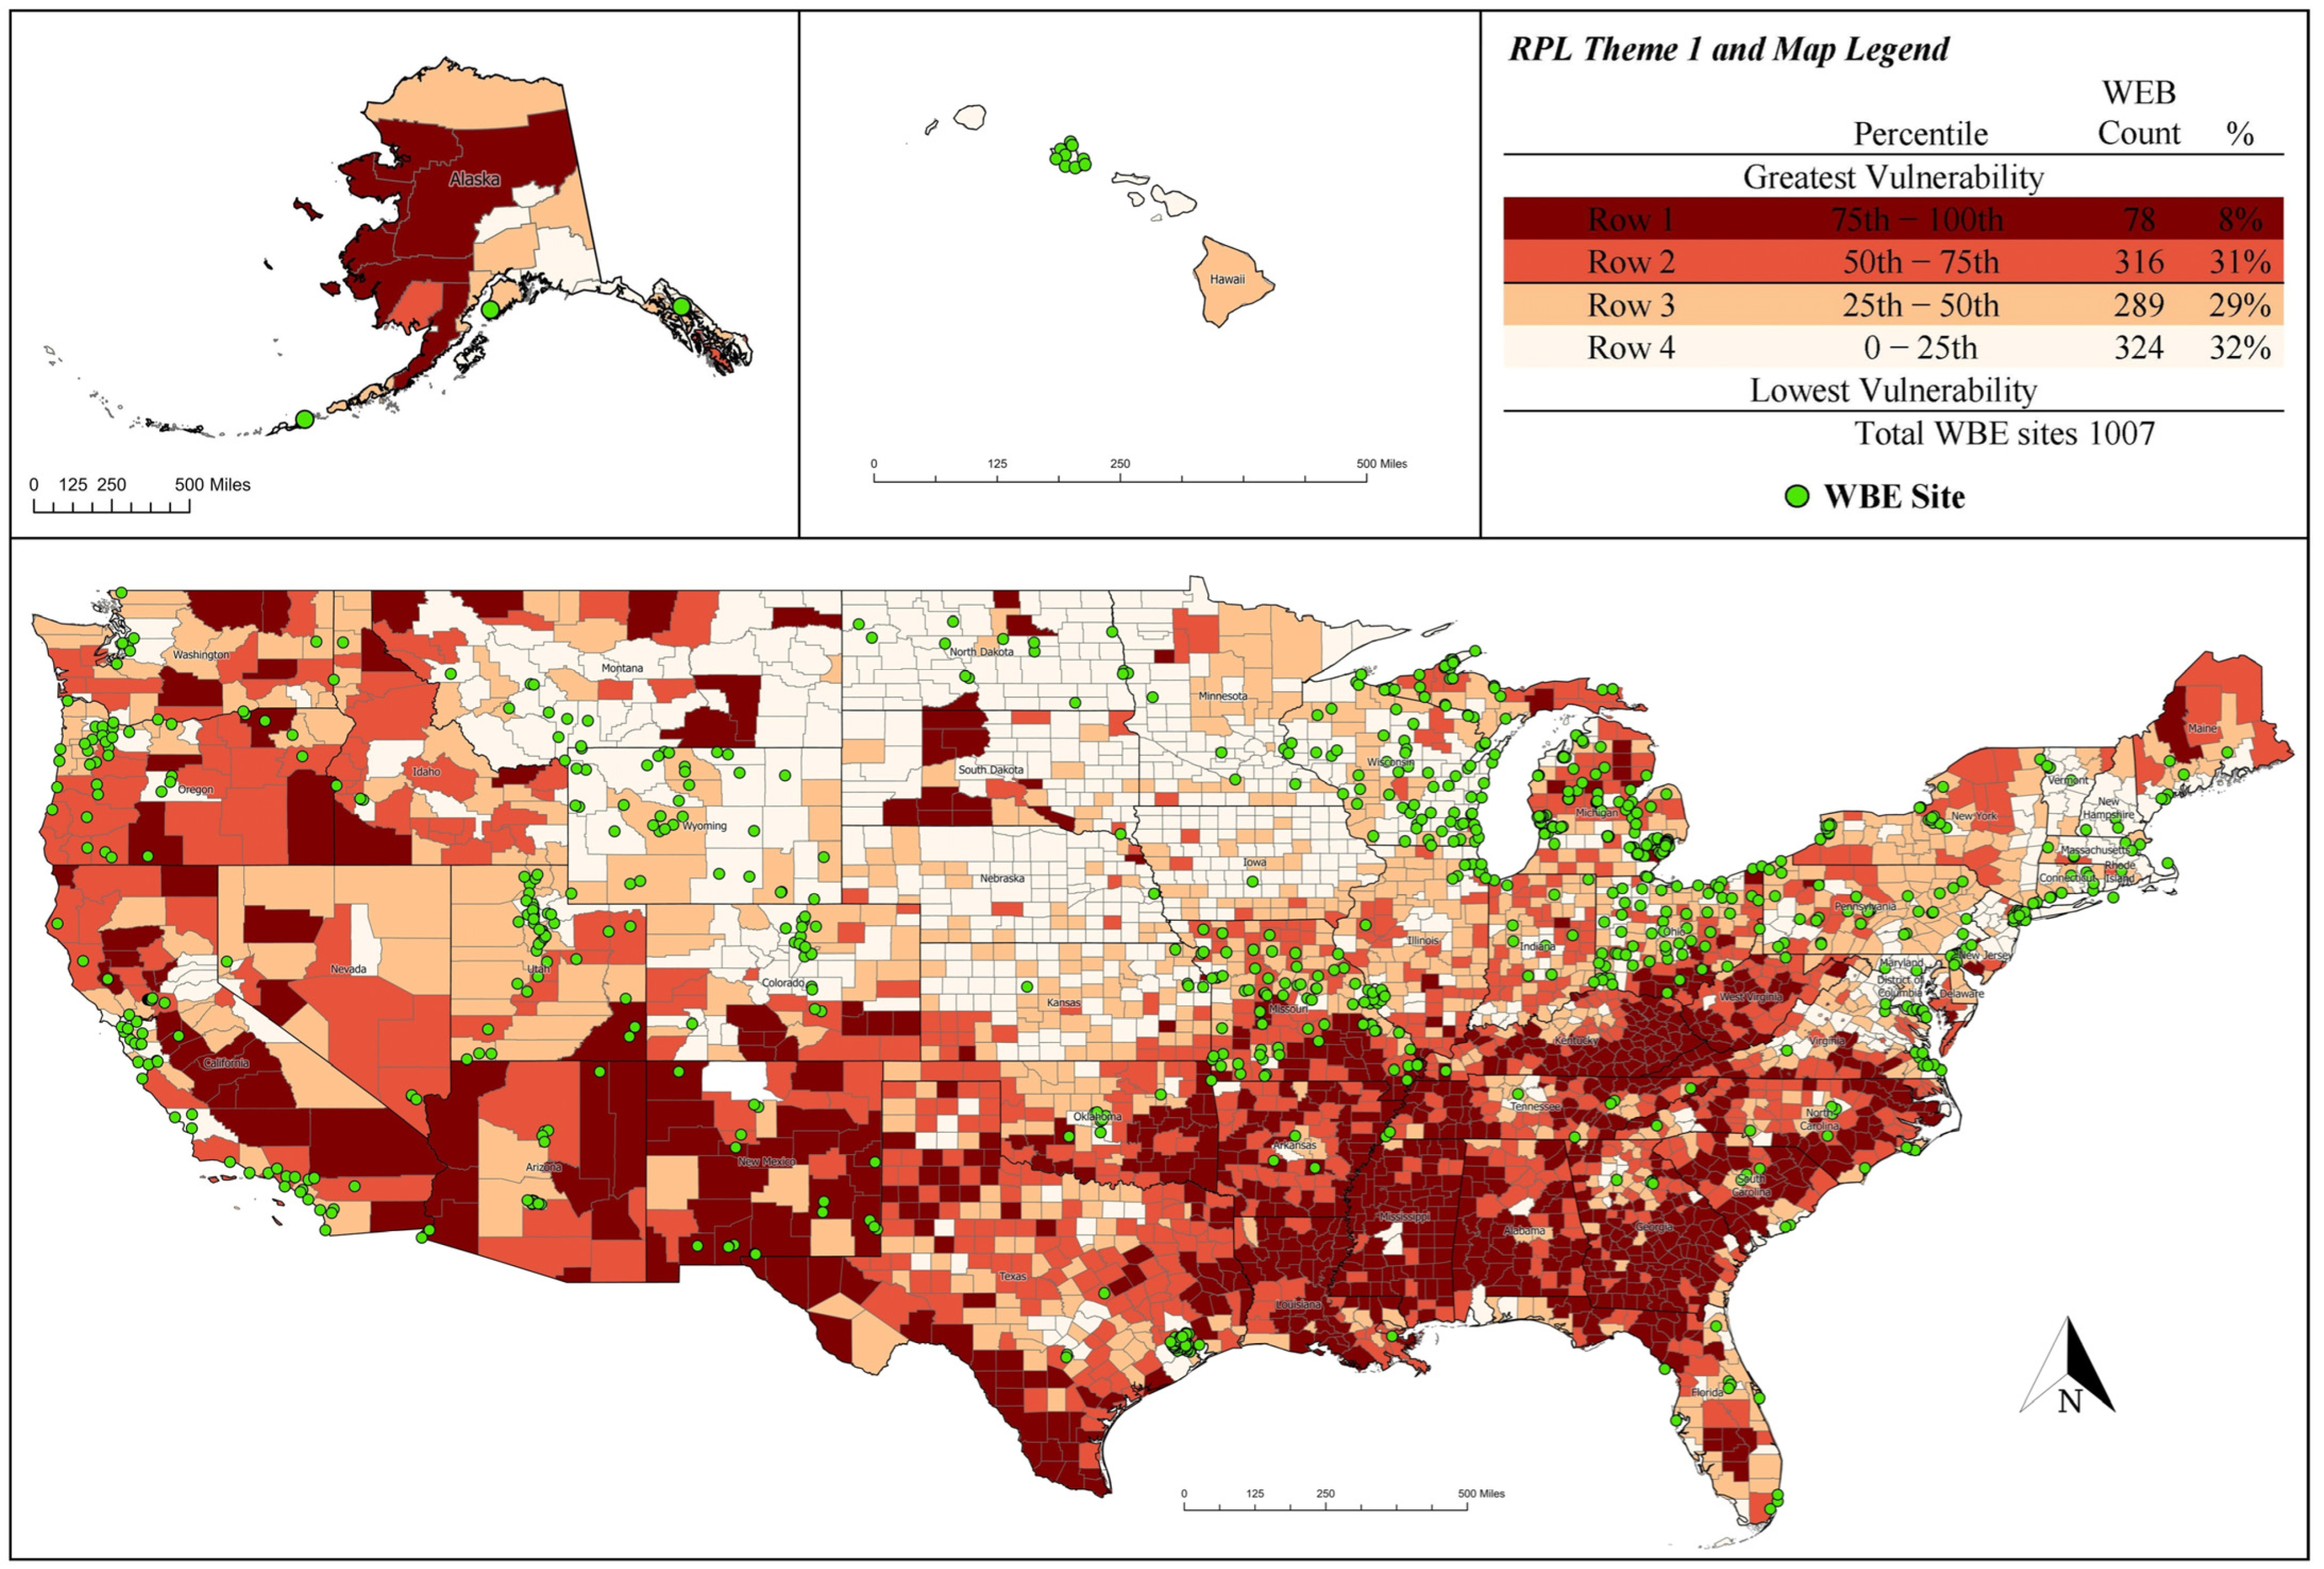
| RPL_THEME1 | RPL | Percentile ranking for Socioeconomic Status theme summary (overall summary ranking variable, state-to-state/county-to-county) a |
| E_TOTPOP | population | Population estimate, 2016–2020 ACS |
| E_POV150 | poverty | Persons below 150% poverty estimate, 2016–2020 ACS |
| E_NOHSDP | diploma | Persons (age 25+) with no high school diploma estimate, 2016–2020 ACS |
| E_LIMENG | English | Persons (age 5+) who speak English “less than well” estimate, 2016–2020 ACS |
| E_MINRTY | minority | Minority (Hispanic or Latino (of any race); Black and African American, Not Hispanic or Latino; American Indian and Alaska Native, Not Hispanic or Latino; Asian, Not Hispanic or Latino; Native Hawaiian and Other Pacific Islander, Not Hispanic or Latino; Two or More Races, Not Hispanic or Latino; Other Races, Not Hispanic or Latino) estimate, 2016–2020 ACS |
| E_MUNIT | density | Housing in structures with 10 or more units estimate, 2016–2020 ACS |
| E_CROWD | crowd | At household level (occupied housing units), more people than rooms estimate, 2016–2020 ACS |
| R | R2 | Adj R2 | ΔR2 | Se | ΔF | df1 | df2 | Sig. FΔ |
|---|---|---|---|---|---|---|---|---|
| 0.553 | 0.306 | 0.304 | 0.306 | 0.857 | 178.628 | 7 | 2837 | 0.000 |
| Predictor | B | SE B | Β | p |
|---|---|---|---|---|
| population | 2.53 × 10⁻⁶ | 0.000 | 0.851 | 0.000 |
| poverty | 1.57 × 10⁻⁵ | 0.000 | 1.160 | 0.000 |
| diploma | −3.44 × 10⁻⁵ | 0.000 | −1.609 | 0.000 |
| English | 1.29 × 10⁻⁵ | 0.000 | 0.402 | 0.000 |
| minority | −2.07 × 10⁻⁶ | 0.000 | −0.442 | 0.000 |
| density | −3.56 × 10⁻⁶ | 0.000 | −0.124 | 0.001 |
| crowd | 2.85 × 10⁻⁵ | 0.000 | 0.248 | 0.004 |
Disclaimer/Publisher’s Note: The statements, opinions and data contained in all publications are solely those of the individual author(s) and contributor(s) and not of MDPI and/or the editor(s). MDPI and/or the editor(s) disclaim responsibility for any injury to people or property resulting from any ideas, methods, instructions or products referred to in the content. |
© 2024 by the authors. Licensee MDPI, Basel, Switzerland. This article is an open access article distributed under the terms and conditions of the Creative Commons Attribution (CC BY) license (https://creativecommons.org/licenses/by/4.0/).
Share and Cite
Mosher, J.R.; Banta, J.E.; Spencer-Hwang, R.; Naughton, C.C.; Kadonsky, K.F.; Hile, T.; Sinclair, R.G. An Environmental Equity Assessment Using a Social Vulnerability Index during the SARS-CoV-2 Pandemic for Siting of Wastewater-Based Epidemiology Locations in the United States. Geographies 2024, 4, 141-151. https://doi.org/10.3390/geographies4010009
Mosher JR, Banta JE, Spencer-Hwang R, Naughton CC, Kadonsky KF, Hile T, Sinclair RG. An Environmental Equity Assessment Using a Social Vulnerability Index during the SARS-CoV-2 Pandemic for Siting of Wastewater-Based Epidemiology Locations in the United States. Geographies. 2024; 4(1):141-151. https://doi.org/10.3390/geographies4010009
Chicago/Turabian StyleMosher, Jessica R., Jim E. Banta, Rhonda Spencer-Hwang, Colleen C. Naughton, Krystin F. Kadonsky, Thomas Hile, and Ryan G. Sinclair. 2024. "An Environmental Equity Assessment Using a Social Vulnerability Index during the SARS-CoV-2 Pandemic for Siting of Wastewater-Based Epidemiology Locations in the United States" Geographies 4, no. 1: 141-151. https://doi.org/10.3390/geographies4010009
APA StyleMosher, J. R., Banta, J. E., Spencer-Hwang, R., Naughton, C. C., Kadonsky, K. F., Hile, T., & Sinclair, R. G. (2024). An Environmental Equity Assessment Using a Social Vulnerability Index during the SARS-CoV-2 Pandemic for Siting of Wastewater-Based Epidemiology Locations in the United States. Geographies, 4(1), 141-151. https://doi.org/10.3390/geographies4010009