Abstract
This study proposes planning for children’s independent mobility through geoinformation technologies by listening to children. This research assumes that children’s values and expectations must be considered in city planning. A bibliographic review identified 15 indicators which make spaces safe and attractive for children to circulate and play. Thematic maps of the indicators were prepared and integrated by a multicriteria analysis by the weights of the evidence according to the hierarchical importance of each variable. The definition of the weights considered the opinions of the children and technicians. The consultation with children was carried out by mapping volunteers (VGI), a consultation on hierarchy, the geodesign of ideas for the area, and an artistic workshop. In the technical study, the query applied the Delphi method. It used the VGI—Volunteered Geographic Information—web-based platform, where children recorded places of topophilia and topophobia, while technicians mapped the presence of 15 indicators. The set of information was made available on a web-based platform called SDI—Spatial Data Infrastructure—in which there are resources for a geodesign workshop where ideas for the area were elaborated through negotiation and cocreation. The product is a transformational design for the area through urban design and the parameterization of its uses.
1. Introduction
Globally, Brazil reports one of the lowest rates of child independent mobility: the freedom of children to interact and explore their residential surroundings without adult supervision. In recent decades, the decrease in the autonomy granted to children to experience their residential surroundings in the context of large and dense central areas have attracted the attention of academics, public managers, and society. Studies report that restricting children’s coming and going near their homes harms their social, physical, and cognitive development. Depriving the child of experiencing public spaces more freely is denying the formation of autonomous subjects [1].
By 2050, 70% of children will live in cities. Children’s participation in decision-making processes that will affect their lives is a right enshrined in the Convention on the Rights of Children, adopted by the UN in 1989. But children are still perceived as the “future generation”. By giving voice and a protagonist role to children, this research is also aligned with the Sustainable Development Goals [2]. This research aims to develop and test methods that facilitate children’s participation in urban planning processes (Art. 5 of the Federal Constitution).
The investigations carried out by this research approach the topic in line with international studies interested in characterizing the problem and presenting research solutions using technology. Studies carried out from the child’s perspective, and applying data and processes based on geoinformation technology, have already been introduced by Mizen et al. [3], whose study aimed to characterize the geographic environment to which children are exposed. Olsen et al. [4] georeferenced information about children’s neighborhoods on their journeys, emphasizing inequalities. Ikeda et al. [5] introduced the potential of data modeling. The understanding of what children’s independent mobility means and its importance were developed by Jelleyman et al. [6].
According to Xavier-da-Silva [7], geospatial research assumes that every phenomenon can be dimensioned and located, and does not occur in isolation. Xavier-da-Silva indicates that the investigation of spatial entities and occurrences it can be understood as creating data about place characteristics (entities) or phenomena (occurrences). As example of occurrences he mentions the distribution of risks to citizen safety, which moves in the territory due to factors such as policing and the attractiveness of action.
Working with the spatial variables in geoinformation technology means assigning georeferenced information to the data and investigating the spatial distribution as a source of answers. The use of technologies can be applied to data collection, registration, and the storage of information: in algorithms for spatial distribution studies and for a combination of variables; in the syntheses of diagnostic and predictive studies; in the support for propositional processes.
The creation of collaborative mapping, the use of VGI (Volunteered Geographic Information) platform, and the sense of crowd mapping are resources of data capture including people. The term was presented by Goodchild [8], who discussed the potential of measuring “citizens as sensors”. The process is performed through web-based tools in which participants actively register their opinions.
The cocreation of ideas is a part of contemporary values. In this stage of the work, the geodesign methodology is intended for the collective construction of alternative future proposals for a place; what is, according to Miller and Steinitz, planning “with” and “for” geography [9,10]. It means recognizing an area’s characteristics, vulnerabilities, and potentialities, and preparing proposals based on shared decisions. It relies on geoinformation technology; but, in the face of restrictions, it is possible to work in an analogical practice, considering adaptability and flexibility.
Young people are part of a generation to whom the primary means of communication is the Internet, and for this reason, they are called the “iGeneration” and are considered “digital natives” [11]. Contact with computer games, e-mail, the Internet, cell phones, and instant messaging has existed since they were born, being part of their lives. The generation chosen for the research comprises children aged 6 to 11, who are the “Alpha” generation, born after 2010. The choice for digital processes, combined, or not, with analogical processes, is readily applicable to children from Generation Z onwards, since they compose the iGeneration. The use of technologies, mainly geospatial technologies, under the supervision of a coordinator, is a qualified and controlled use of the resource in child listening.
The area limited by Contorno Avenue in Belo Horizonte, Minas Gerais, Brazil, was selected as the case study of this research. In line with positivist thinking, this portion of the city is featured by an urban grid. It was planned as a “garden city” with tree-lined avenues. Many changes have occurred since its creation, but the area is still the area with the services and amenities in the city, favoring active child mobility. However, at State School B.B., chosen for the first test, out of a total of 957 students, only 5 declared that they walk to school and took part in the study. The low number may be justified by the possibility that few public-school children live in the central area and walk to school. In addition, the scholar transport offered by the local municipality, according to the head master of the school, is good. This research applied different tools to understand what aspects of the central area are most liked and disliked by the children.
Once the children and one of their parents signed the ethics forms, the data generation stage began. The fieldwork activities involved several methods. The data gathered through different methods integrate and complement each other. The process is based on a framework that involves volunteered mapping (VGI), the characterization of the study area by integrating variables (multicriteria analysis), and building ideas for the transformation of the area through a cocreation process (geodesign).
This research hypothesizes that digital tools can facilitate meaningful exchanges with children. This was verified in data modeling processes used to characterize the study area by listening to citizens about the importance of the variables related to the environmental, place, and mobility contexts, and in the use of the geodesign method. The latter was supported by web-based geospatial technology. These resources support the collective construction of policies and projects to promote children’s active travel.
2. Materials and Methods
The methodological approach used in this research and in the presentation of this paper is sequential and exploratory in nature [12]. The exploratory nature aimed to test the applications of geoinformation technology tools, initially with children, and then with adults with technical knowledge in planning. Exploratory research is used when the goal is to examine a new topic or when the subject of the study is relatively new [13]. The study of active and independent child mobility is not new, but the approach using geospatial technologies is relatively new, especially when used by children. In this sense, both the research and its report were sequenced, explaining how it constructed an understanding about the issue, in an exploratory approach.
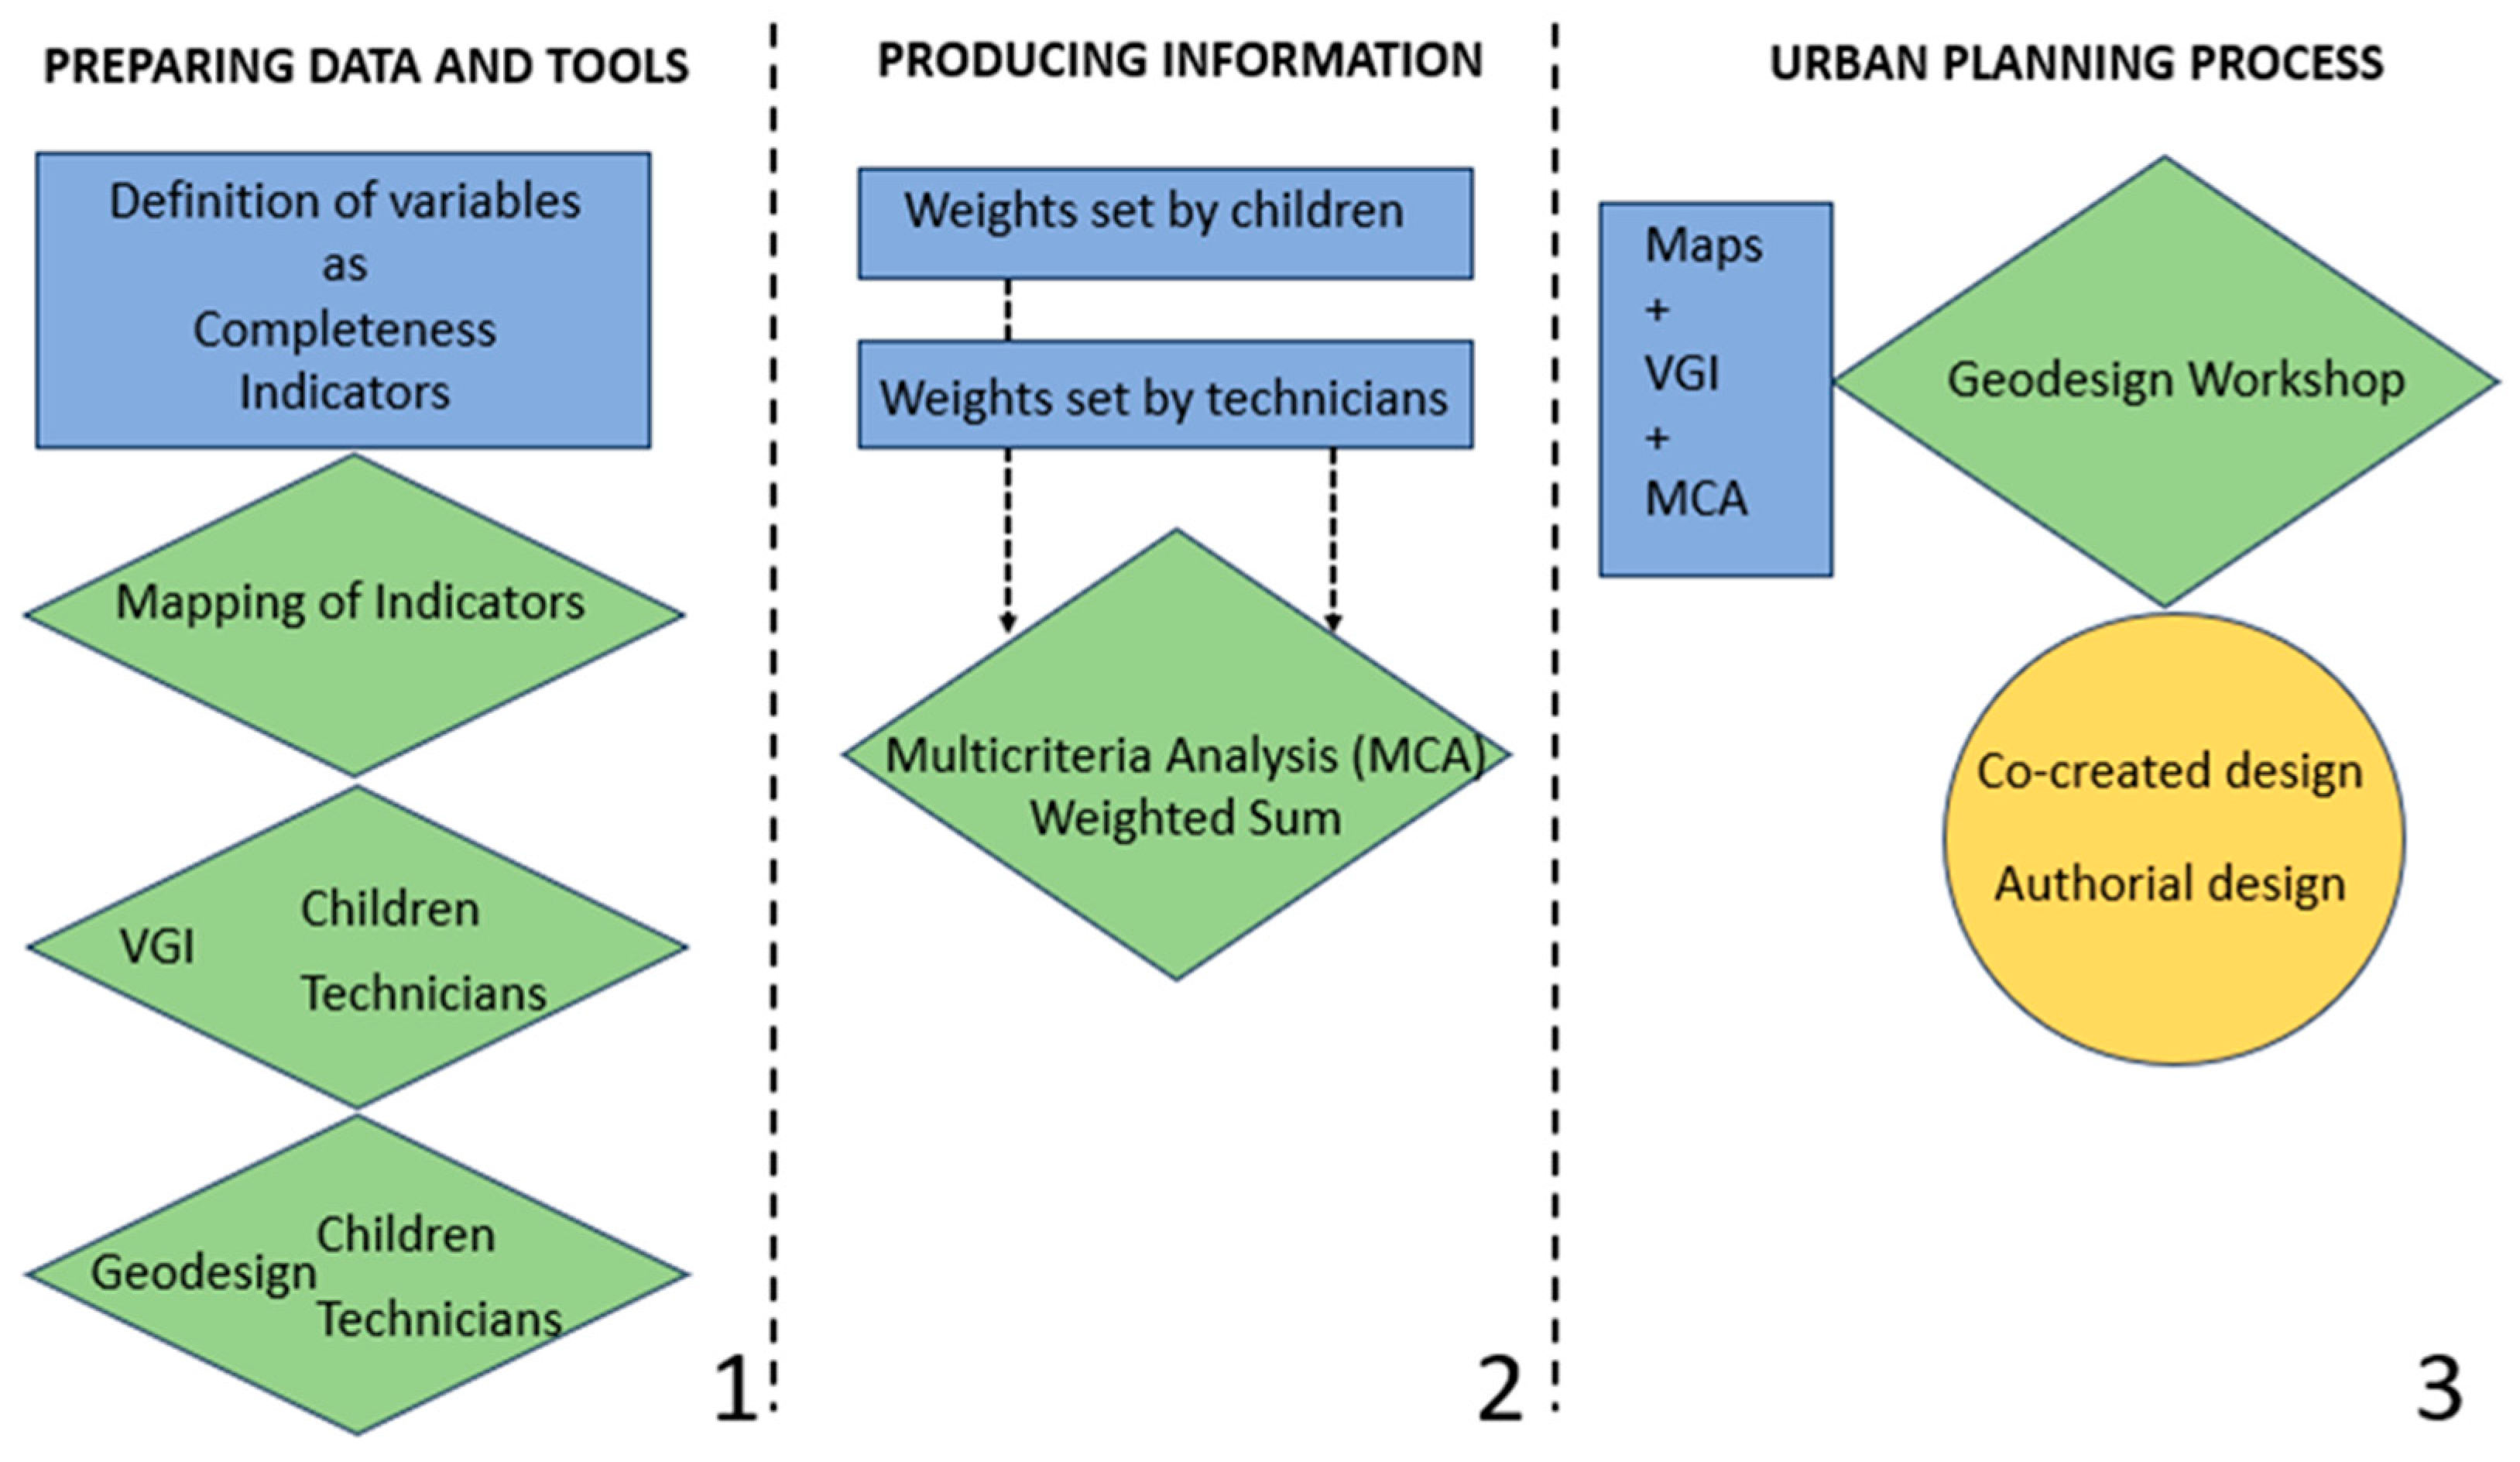
The main contribution of this work is methodological. It presents a script to identify values, map indicators, and develop the urban plan of the study area based on the information generated throughout the process. In this way, a methodological flowchart is presented demonstrating that the process comprises the following steps: (1) the preparation of data and tools, (2) the production of information, and (3) the urban planning process (Figure 1). The methodology is detailed in the “development” topics (Topics 3, 4, and 5).

Figure 1.
Methodological framework.
3. Development—Preparing the Data and Web-Based Platforms
The development of the framework followed analogical and digital stages aiming to understand children’s perception of the central area.
3.1. Definition of the Work Variables
The first stage involved the review of the literature, considering the aspects that favored children’s independent mobility. Next, data on those microscale aspects that facilitate children’s independent mobility were collected at the street level [14,15,16,17,18,19,20,21,22,23,24,25,26,27,28].
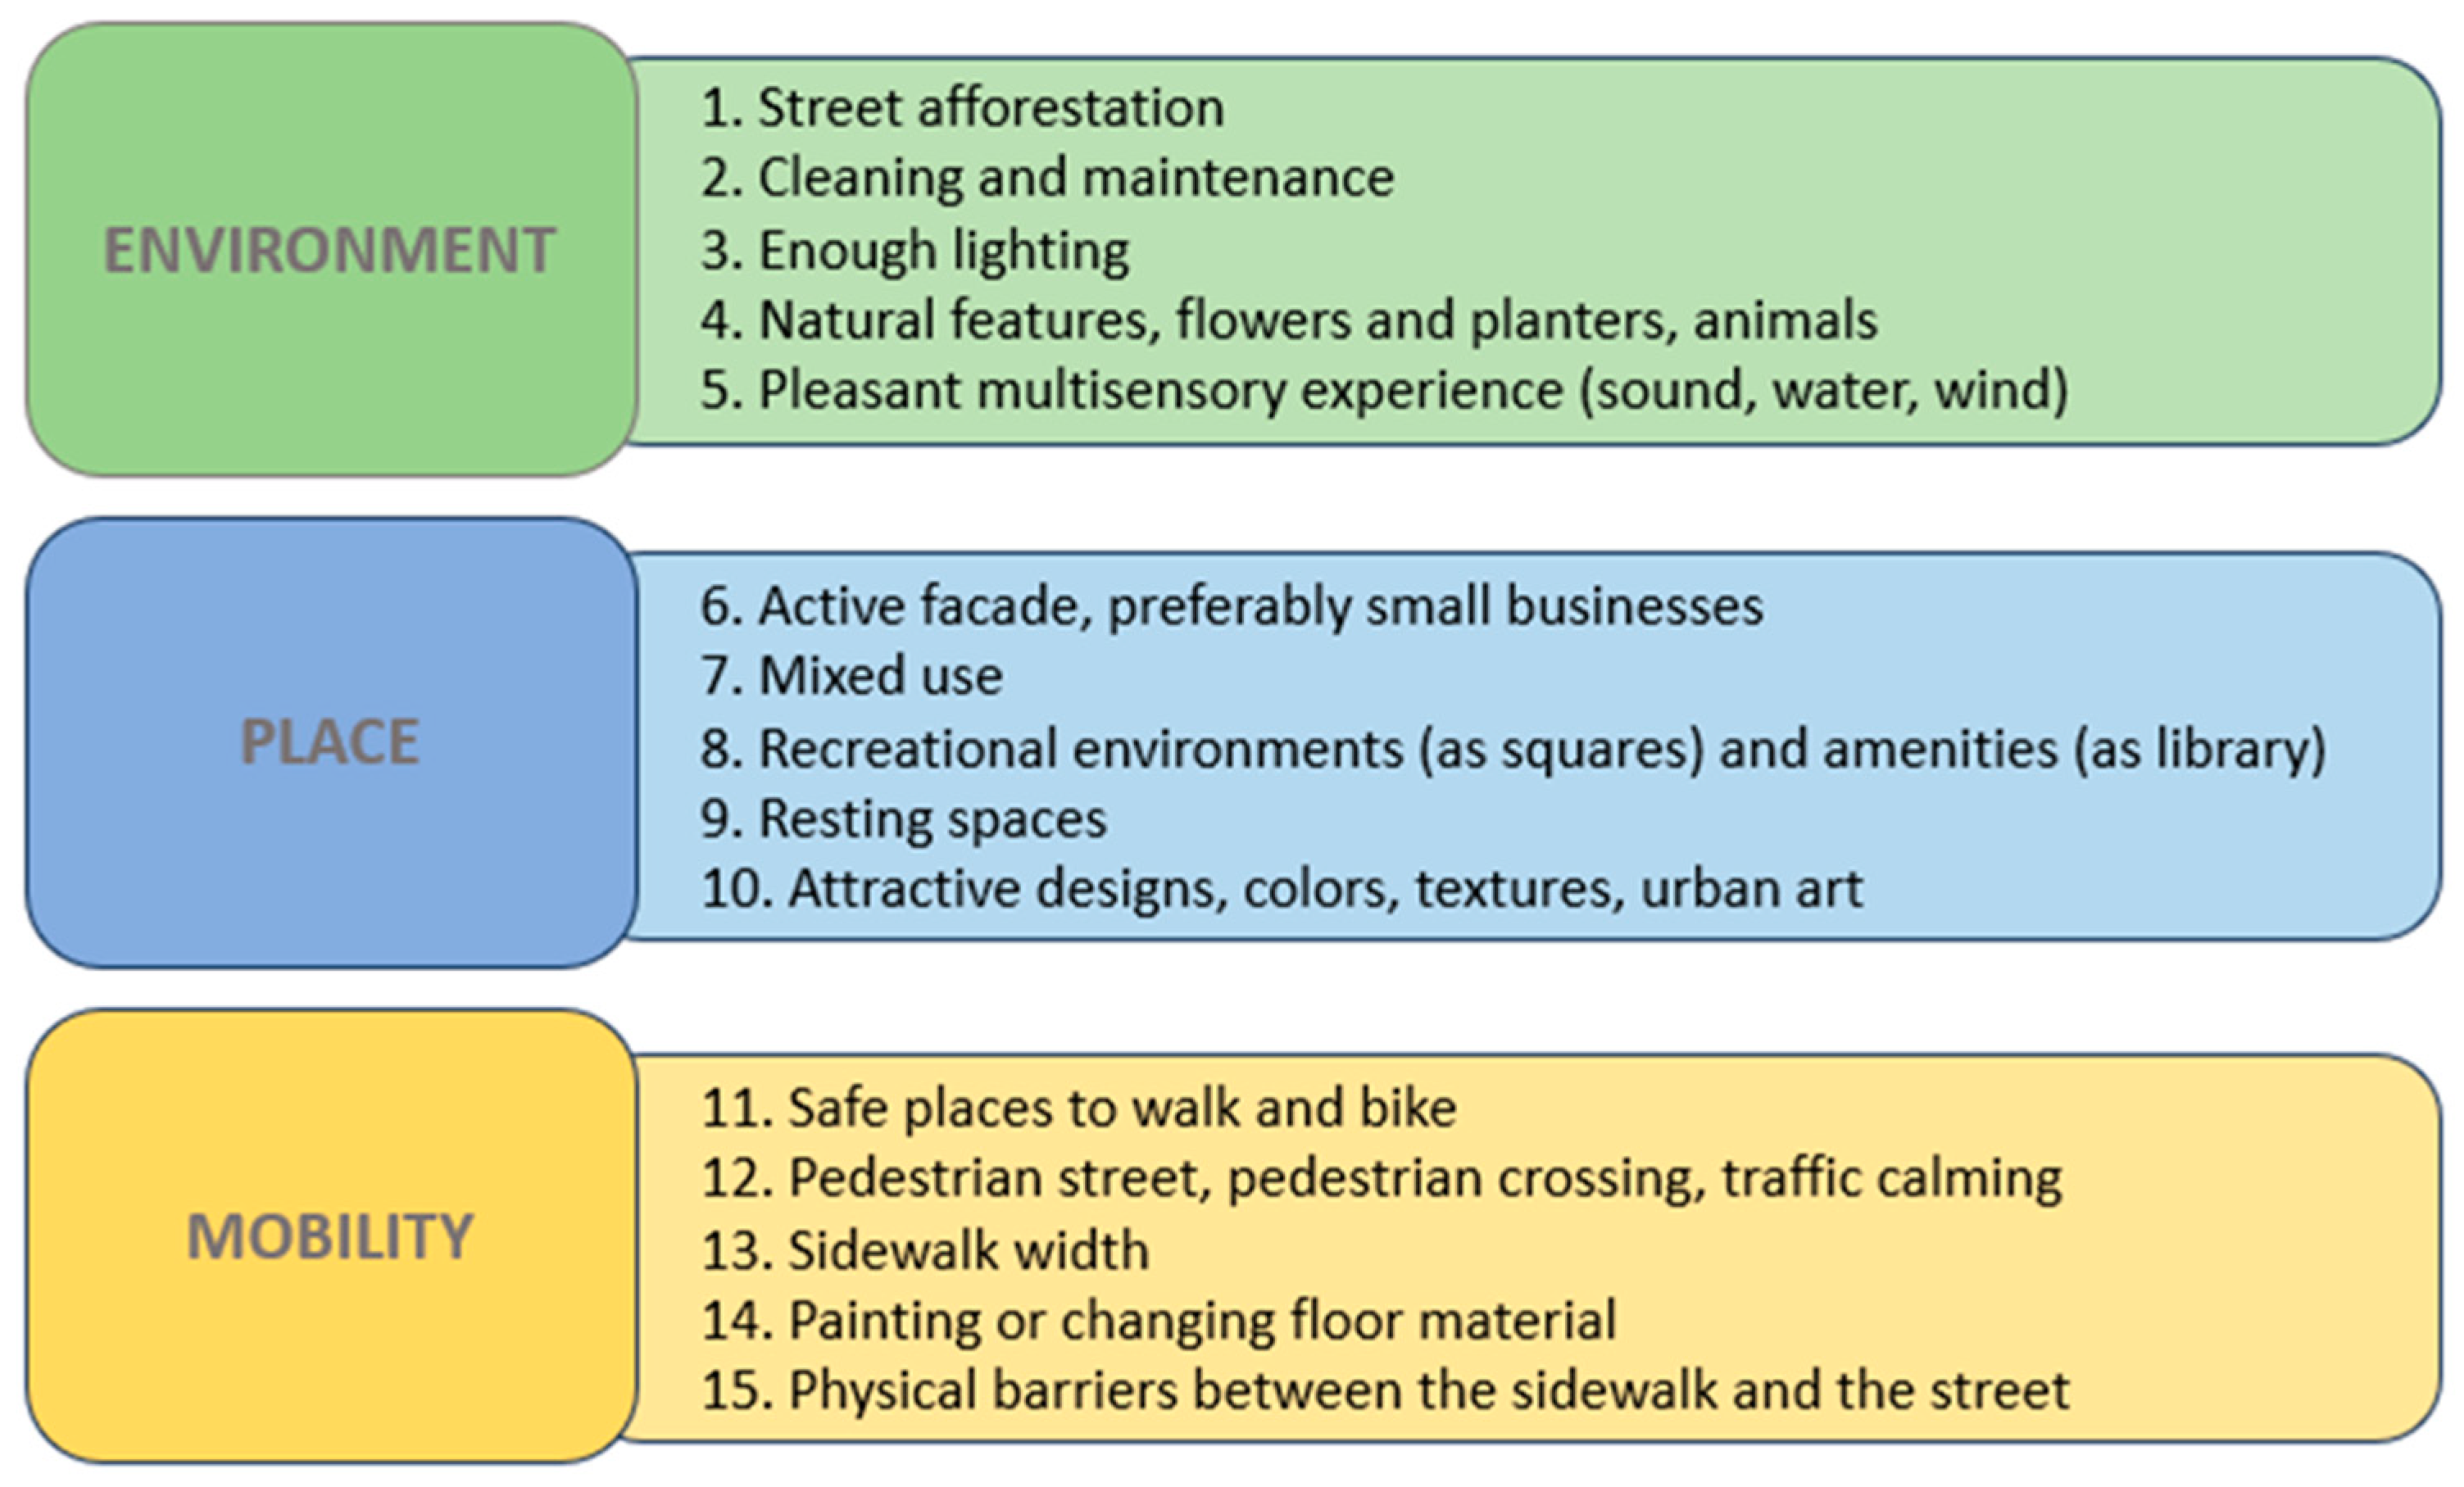
The following data were recorded: (a) the availability or proximity to public open spaces; (b) traffic safety; (c) well-maintained spaces; (d) pedestrian infrastructure; (e) social support and psychosocial factors; (e) ground areas; (f) discovery and joy. The main characteristics were grouped into the following macrocategories: “environmental”, “movement”, and “place”. Together, these categories guarantee the indicators of urban completeness, which make the streets complete in their qualities [29,30,31,32] (Figure 2).

Figure 2.
List of completeness indicators according to children’s independent mobility.
3.2. Preparing the Collection of Thematic Maps for the Multicriteria Analysis by the Weighted Sum
Multicriteria analysis is a spatial analysis model widely used in geoprocessing, as it reproduces the systemic approach for the synthesis and correlation of variables. It starts with the decomposition into variables to be mapped, followed by their recompositing by map algebra, which applies weights and grades according to the degree of importance of each analyzed factor.
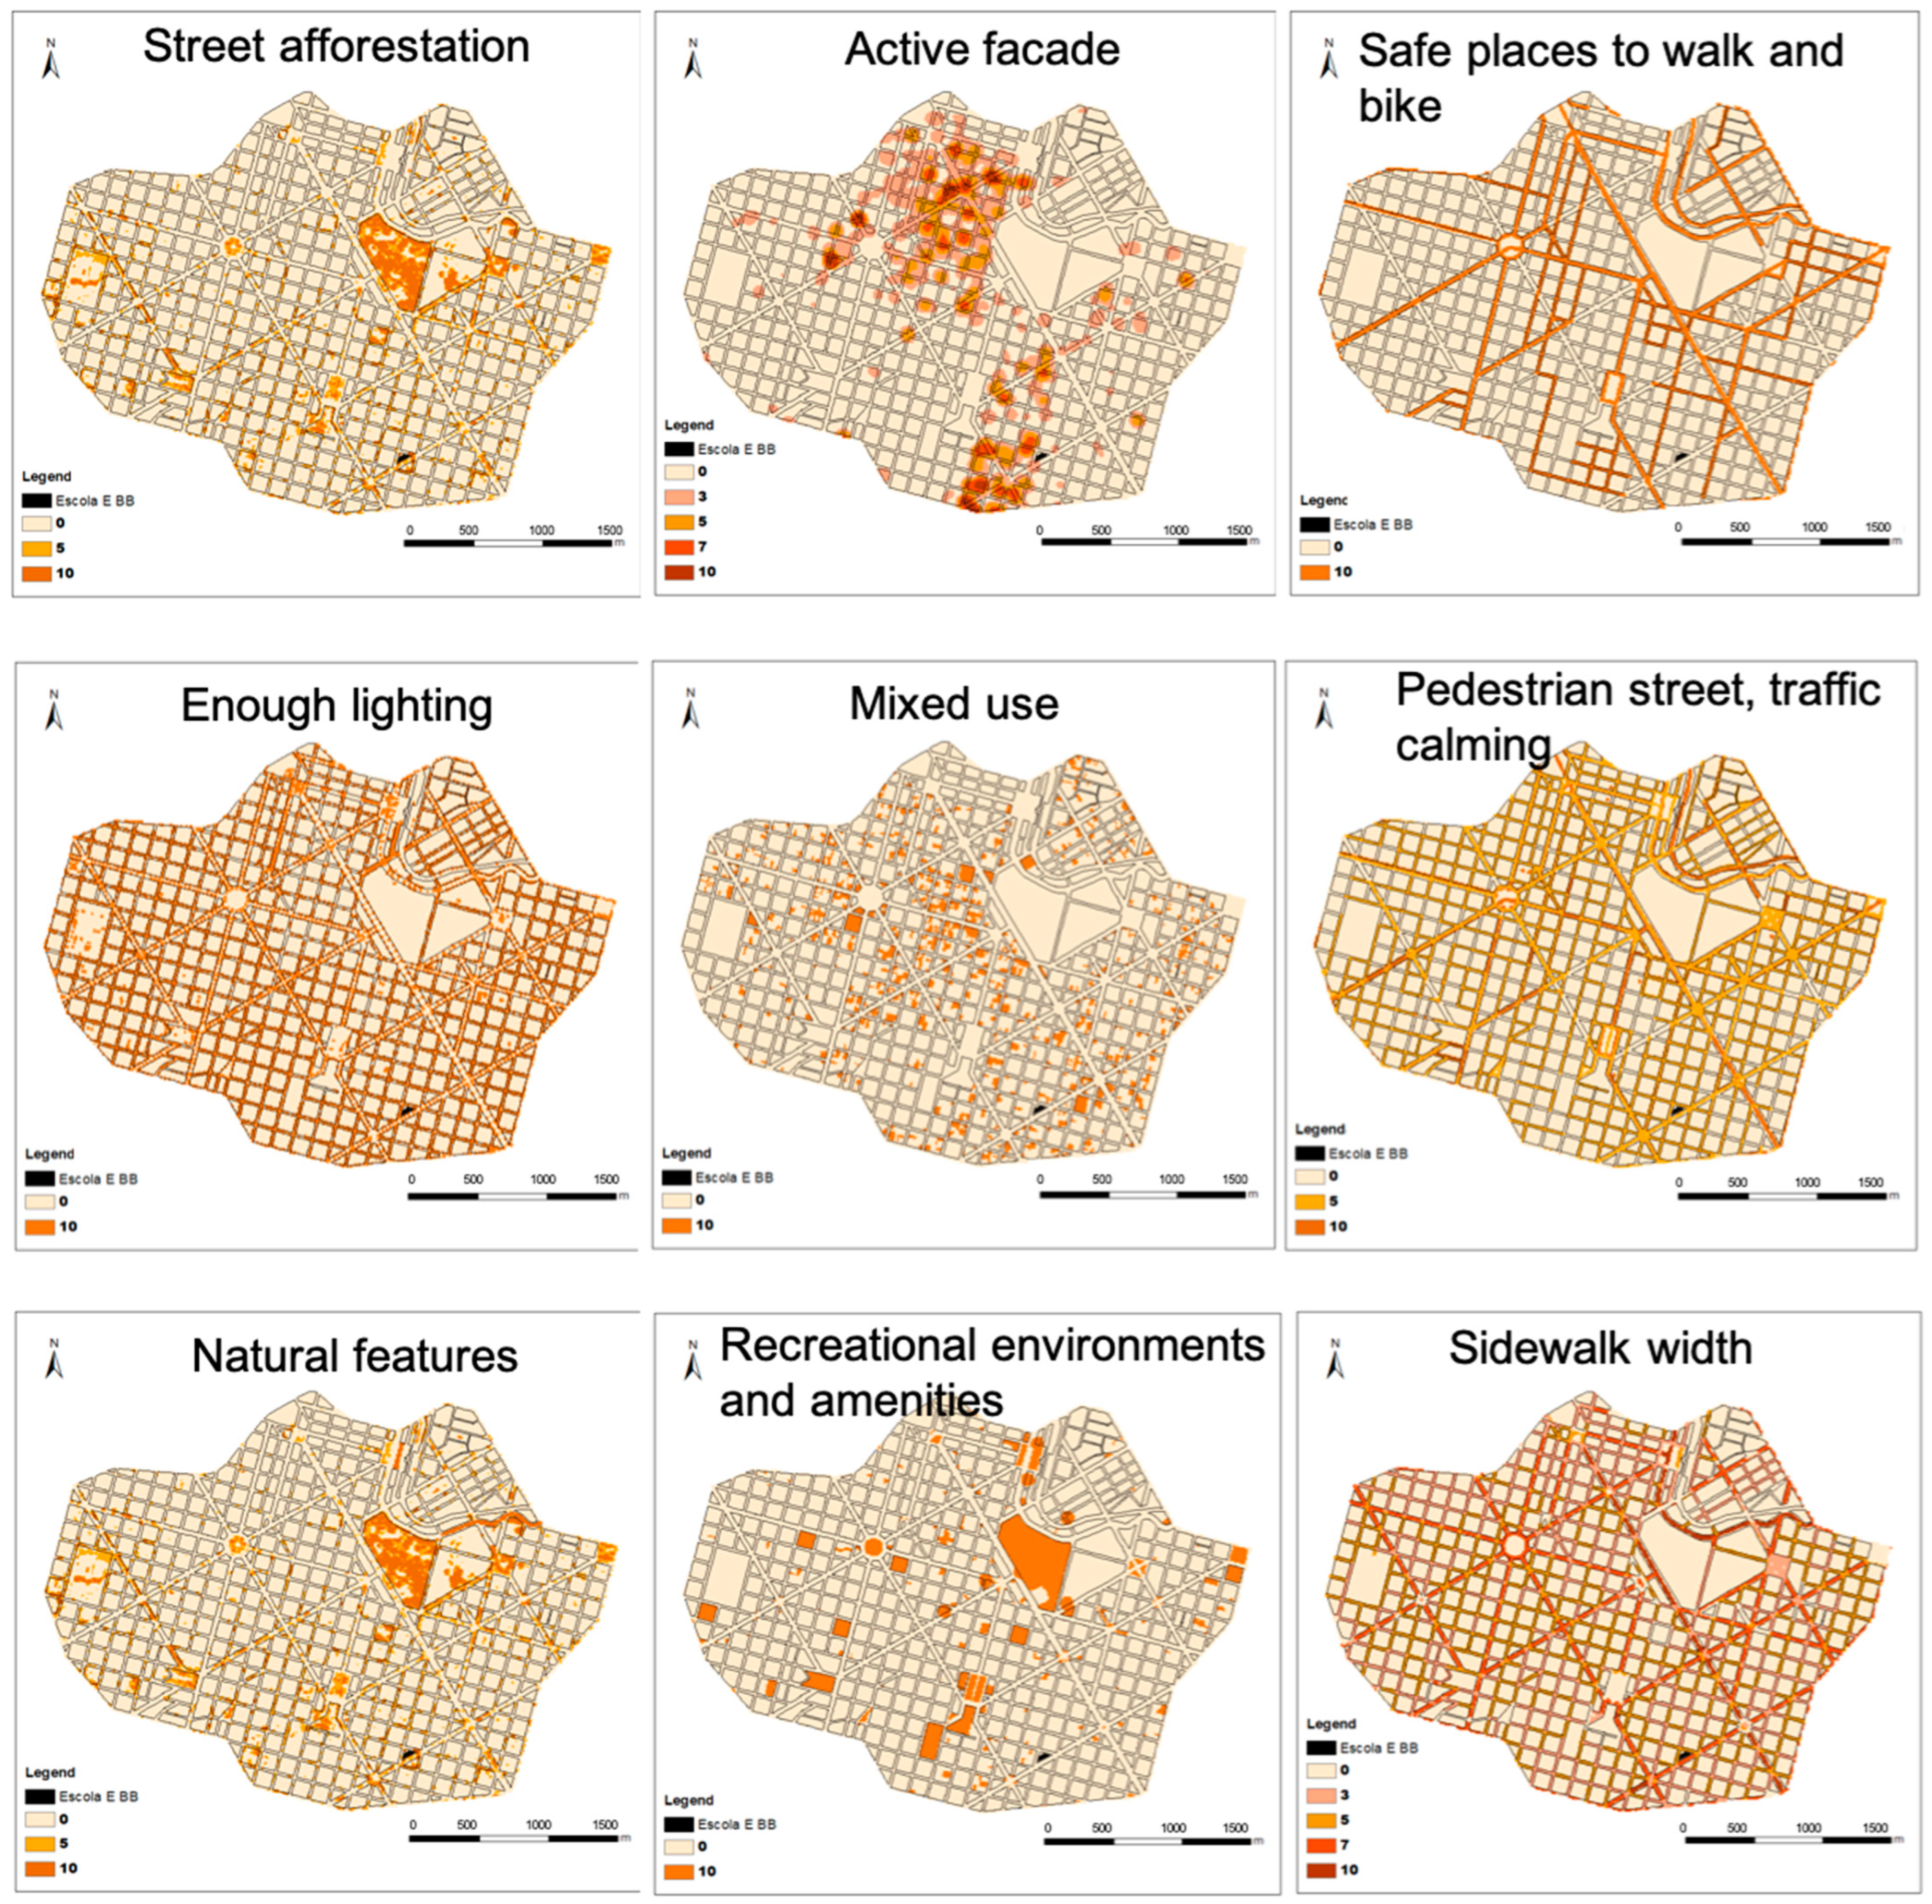
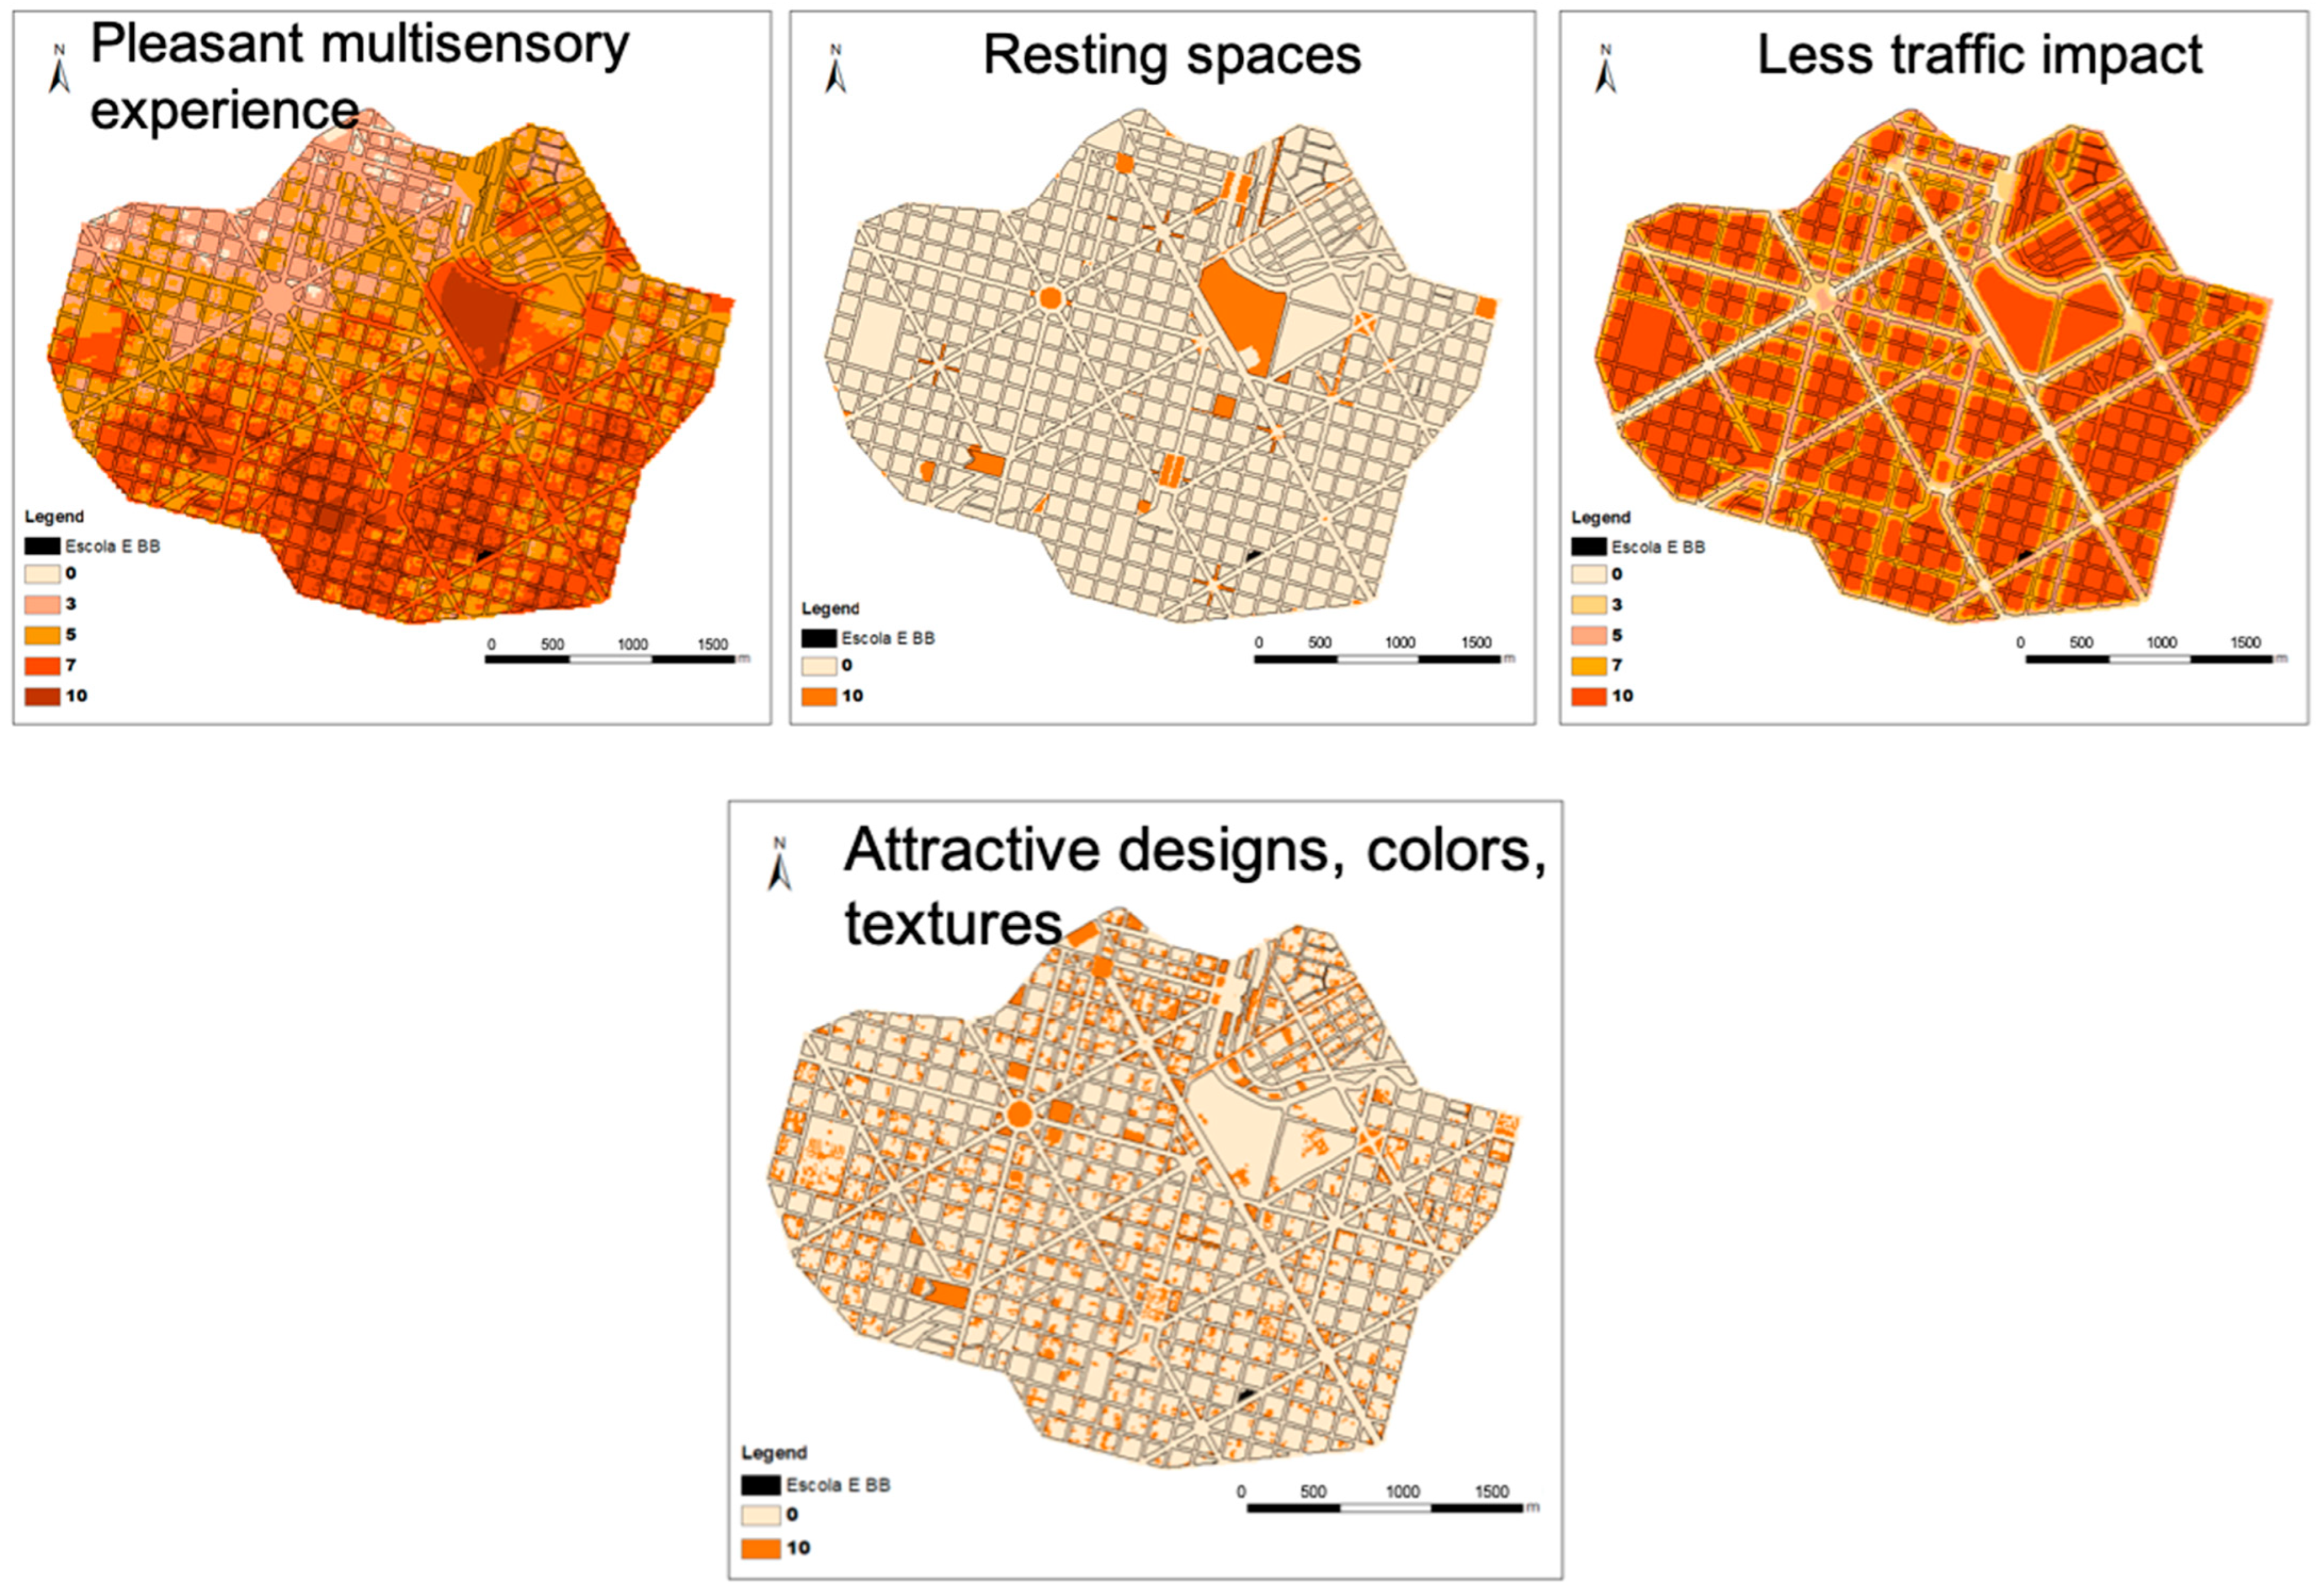
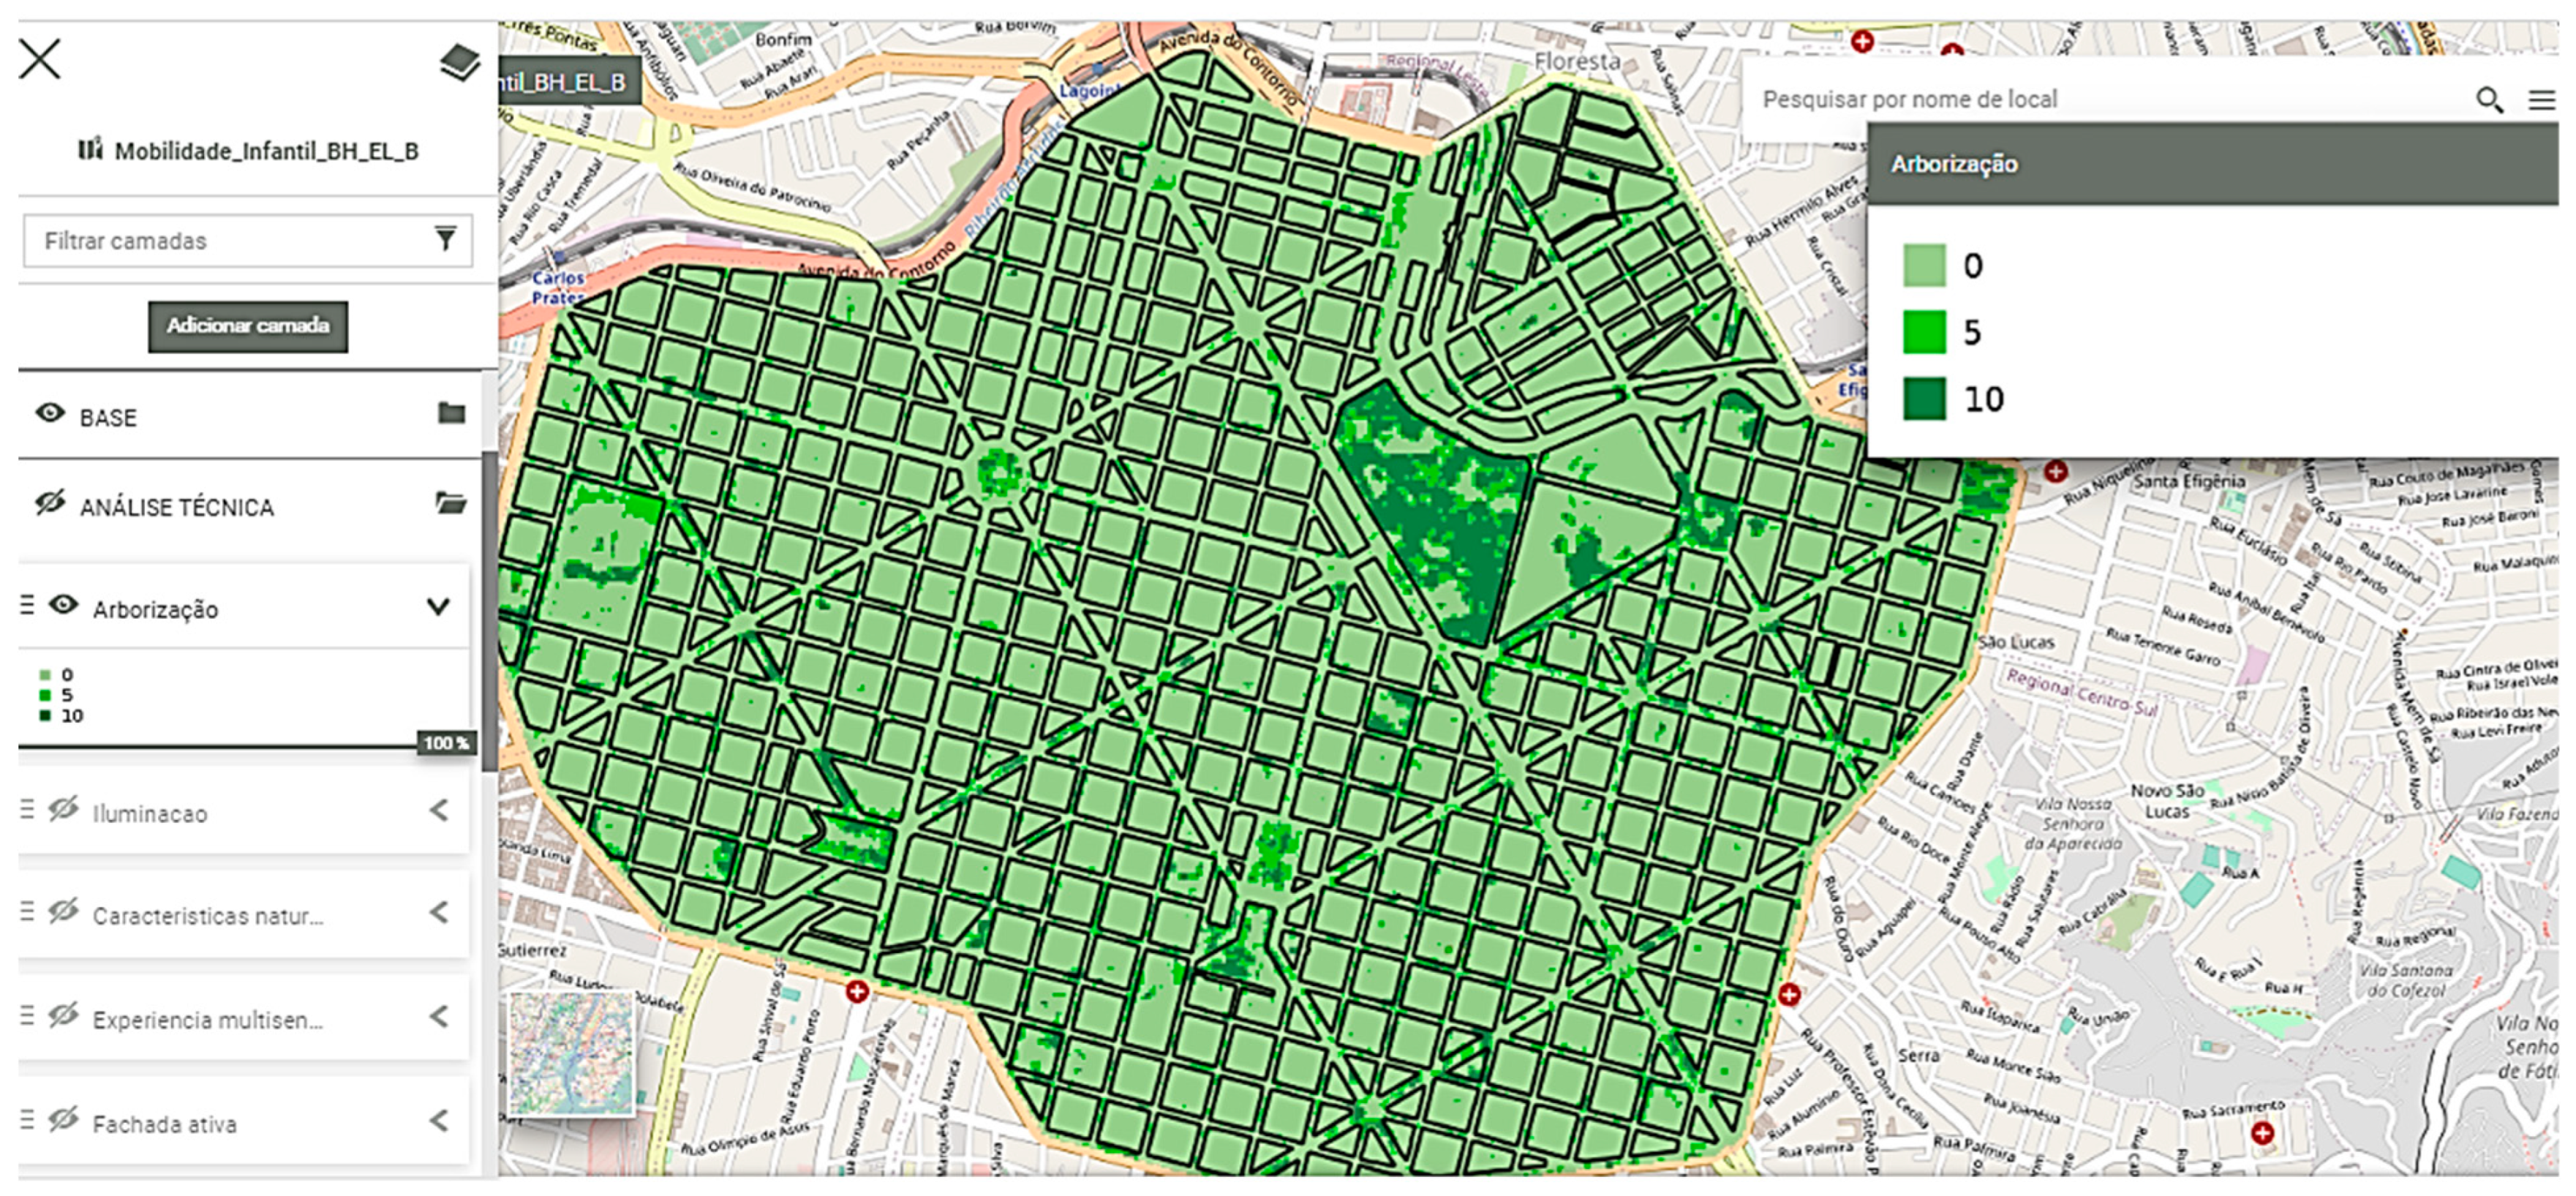
The technical group of undergraduate urban planning students mapped 13 of the 15 indicators using ArcGIS geoprocessing applications (Figure 3). In each map, scores were assigned to the components of the legend, indicating their importance for children’s independent mobility. Later, the maps were used individually as a basis for proposing ideas for the area, and they were also combined by the weighted sum according to their degree of importance in children’s mobility.
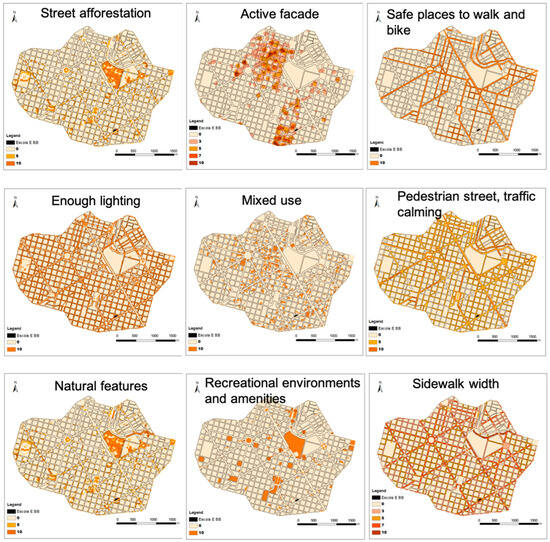
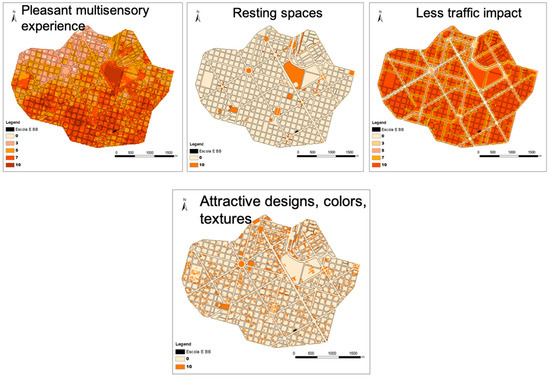
Figure 3.
Thematic maps representing 13 of the 15 indicators.
The challenge was to define the weights of the layers, which were the 15 indicators. In the technical work with the urban planning students, a Delphi query was applied, requesting the importance, on a scale from 0 to 10, for each variable. From the first answer, the average and mode of the values were calculated so that, in a second round of consultation, each technician compared their opinion with the average obtained and could make adjustments. Finally, the average of the last round and the relative importance of each variable were calculated, adding up to 100%.
The Delphi method was proposed in the 1950s by the American military industry Research and Development (RAND) to carry out structured listening and to divide responsibilities by maximizing the consensus of opinions. The name comes from the Oracle of Delphi, as the objective is to issue ideas or suggestions for decision-making. Dalkey and Helmer [33] and Linstone and Turoff [34] explain that the procedure is composed of rounds of opinions, whose results are worked on in the form of obtaining averages and modes, which were presented to the participants who had the chance to make adjustments in their opinions.
In the work performed with the children, their opinions were captured in four moments: (1) when they contributed to the VGI, they registered positions on a map to which they declared “I like” and “I don’t like”, and these elements were associated with the indicators; (2) they provided opinions about the importance of the indicators, according to being “very important”, “of medium importance”, and “not important”; (3) in the geodesign cocreation process, they designed ideas that were associated with the indicators; (4) in the artistic workshop, they created drawings, and the highlighted elements were associated with the indicators. As a result, partial analyses were constructed considering the values applied to each indicator in each step, followed by a final analysis integrating the previous ones.
3.3. Preparing the VGI—Volunteered Mapping
The VGI platform used was ViconSAGA, developed by Professor Tiago Marino from UFRRJ, Brazil. It is intended for the voluntary and active capture of spatial information registered by the user. The project creator is free for the defininition of an initial visualization point and zoom (being able to choose satellite, terrain, or road map views), which is presented in Google Earth for the beginning of the navigation by the users, as well as for the graphic representation for the points and the list of attributes that the participant is supposed to mark when making a contribution.
ViconSAGA is free to access and accepts the import and export of KML (Google Earth), SHP (ArcGIS shapefile), XLS (Microsoft Excel), and CSV (comma-separated values) files for the general analysis of records from a location, which means the broad interoperability of the system [35].
The participant can register a point using a computer, tablet, or cell-phone browser. The cell phone has the advantage of being able to be used in the field, directly capturing the geographic location and allowing the inclusion of photographs taken in loco. On the computer, it is also possible to include photographs in each record, but in the case of the children, as they were working on the school’s computers, the inclusion of photos was not requested. In the example applied to the children, when starting, the screen centers the B.B. State School. Participants scrolled through the following tabs: “1. Locate”, in which they chose a position to insert a record and place the pin; “2. Fill in”, in which they input their age, at which school they study, how they get to school (on foot, bicycle, and so on), and whether the point is a “like” or “dislike” record, and they can also register comments that justify or explain the registration. If they were using it in the field, they could also use the “3. Image” tab and upload a photo or video (Figure 4).
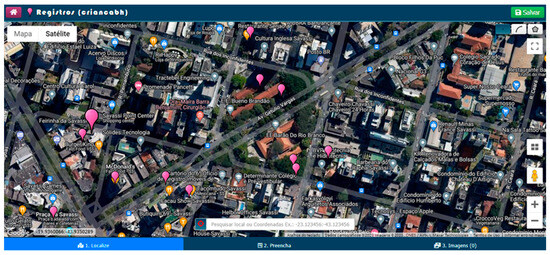
Figure 4.
The screen of the “Children BH” project in the ViconSAGA application.
The registration of “like” and “dislike”, followed by descriptions, aimed to identify the most attractive and least attractive urban features for the children, following Tuan’s principles of topophilia (like) and topophobia (dislike) [36,37]. The principle is also supported by Lynch [38], who wrote that a qualified space that generates connections between citizen and territory generates sensations and security that favor the sociocultural development of the individual, which also lends support to participatory planning.
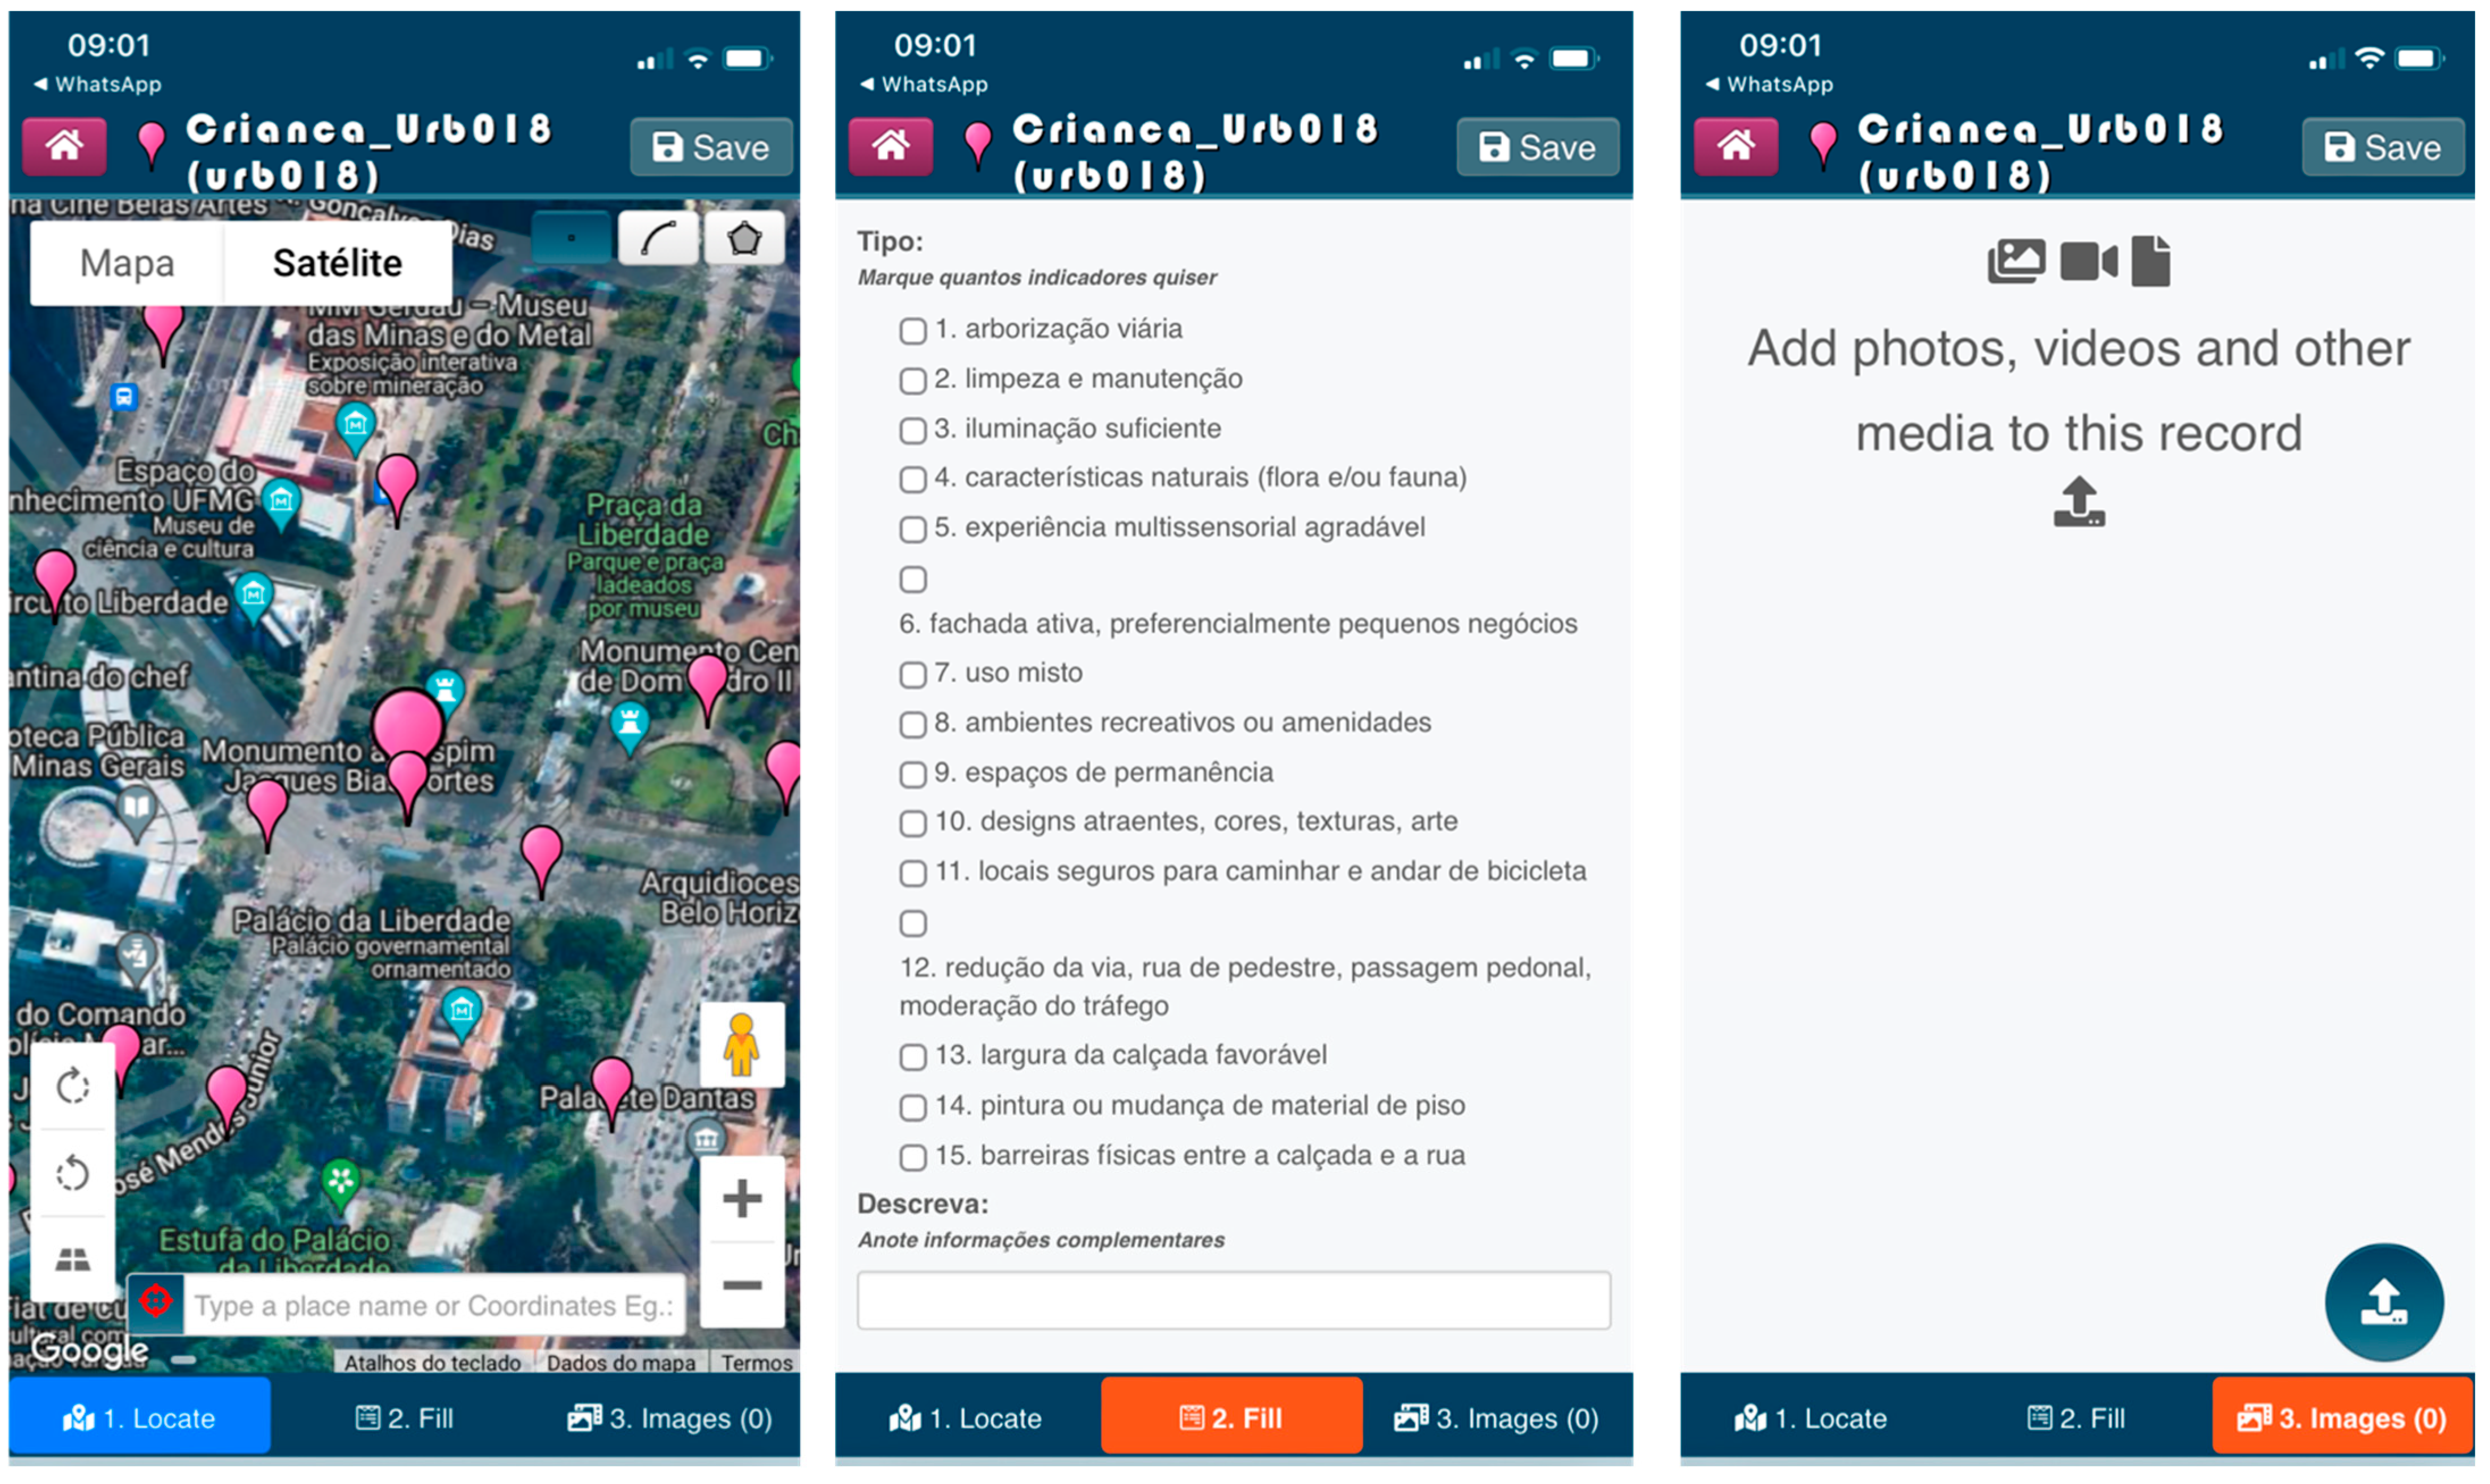
In the preparation of the VGI for the adults, the technical approach, the three tabs of “locate”, “fill in”, and “image”, were also used, with the difference being that their objective was not to issue opinions but to record the presence of one or more of the fifteen completeness indicators. In this sense, they went into the field with their cell phones and registered the presence of facilities in each stretch of urban road or block (Figure 5).

Figure 5.
The screen of the “Children URB018” technical project in the ViconSAGA application. In box 1 the user locates the place to insert the pin, in box 2 the user selects the exiting variables and in box 3 the user inserts pictures or medias.
3.4. Preparing the Geodesign—A Web-Based Platform for Shared Planning
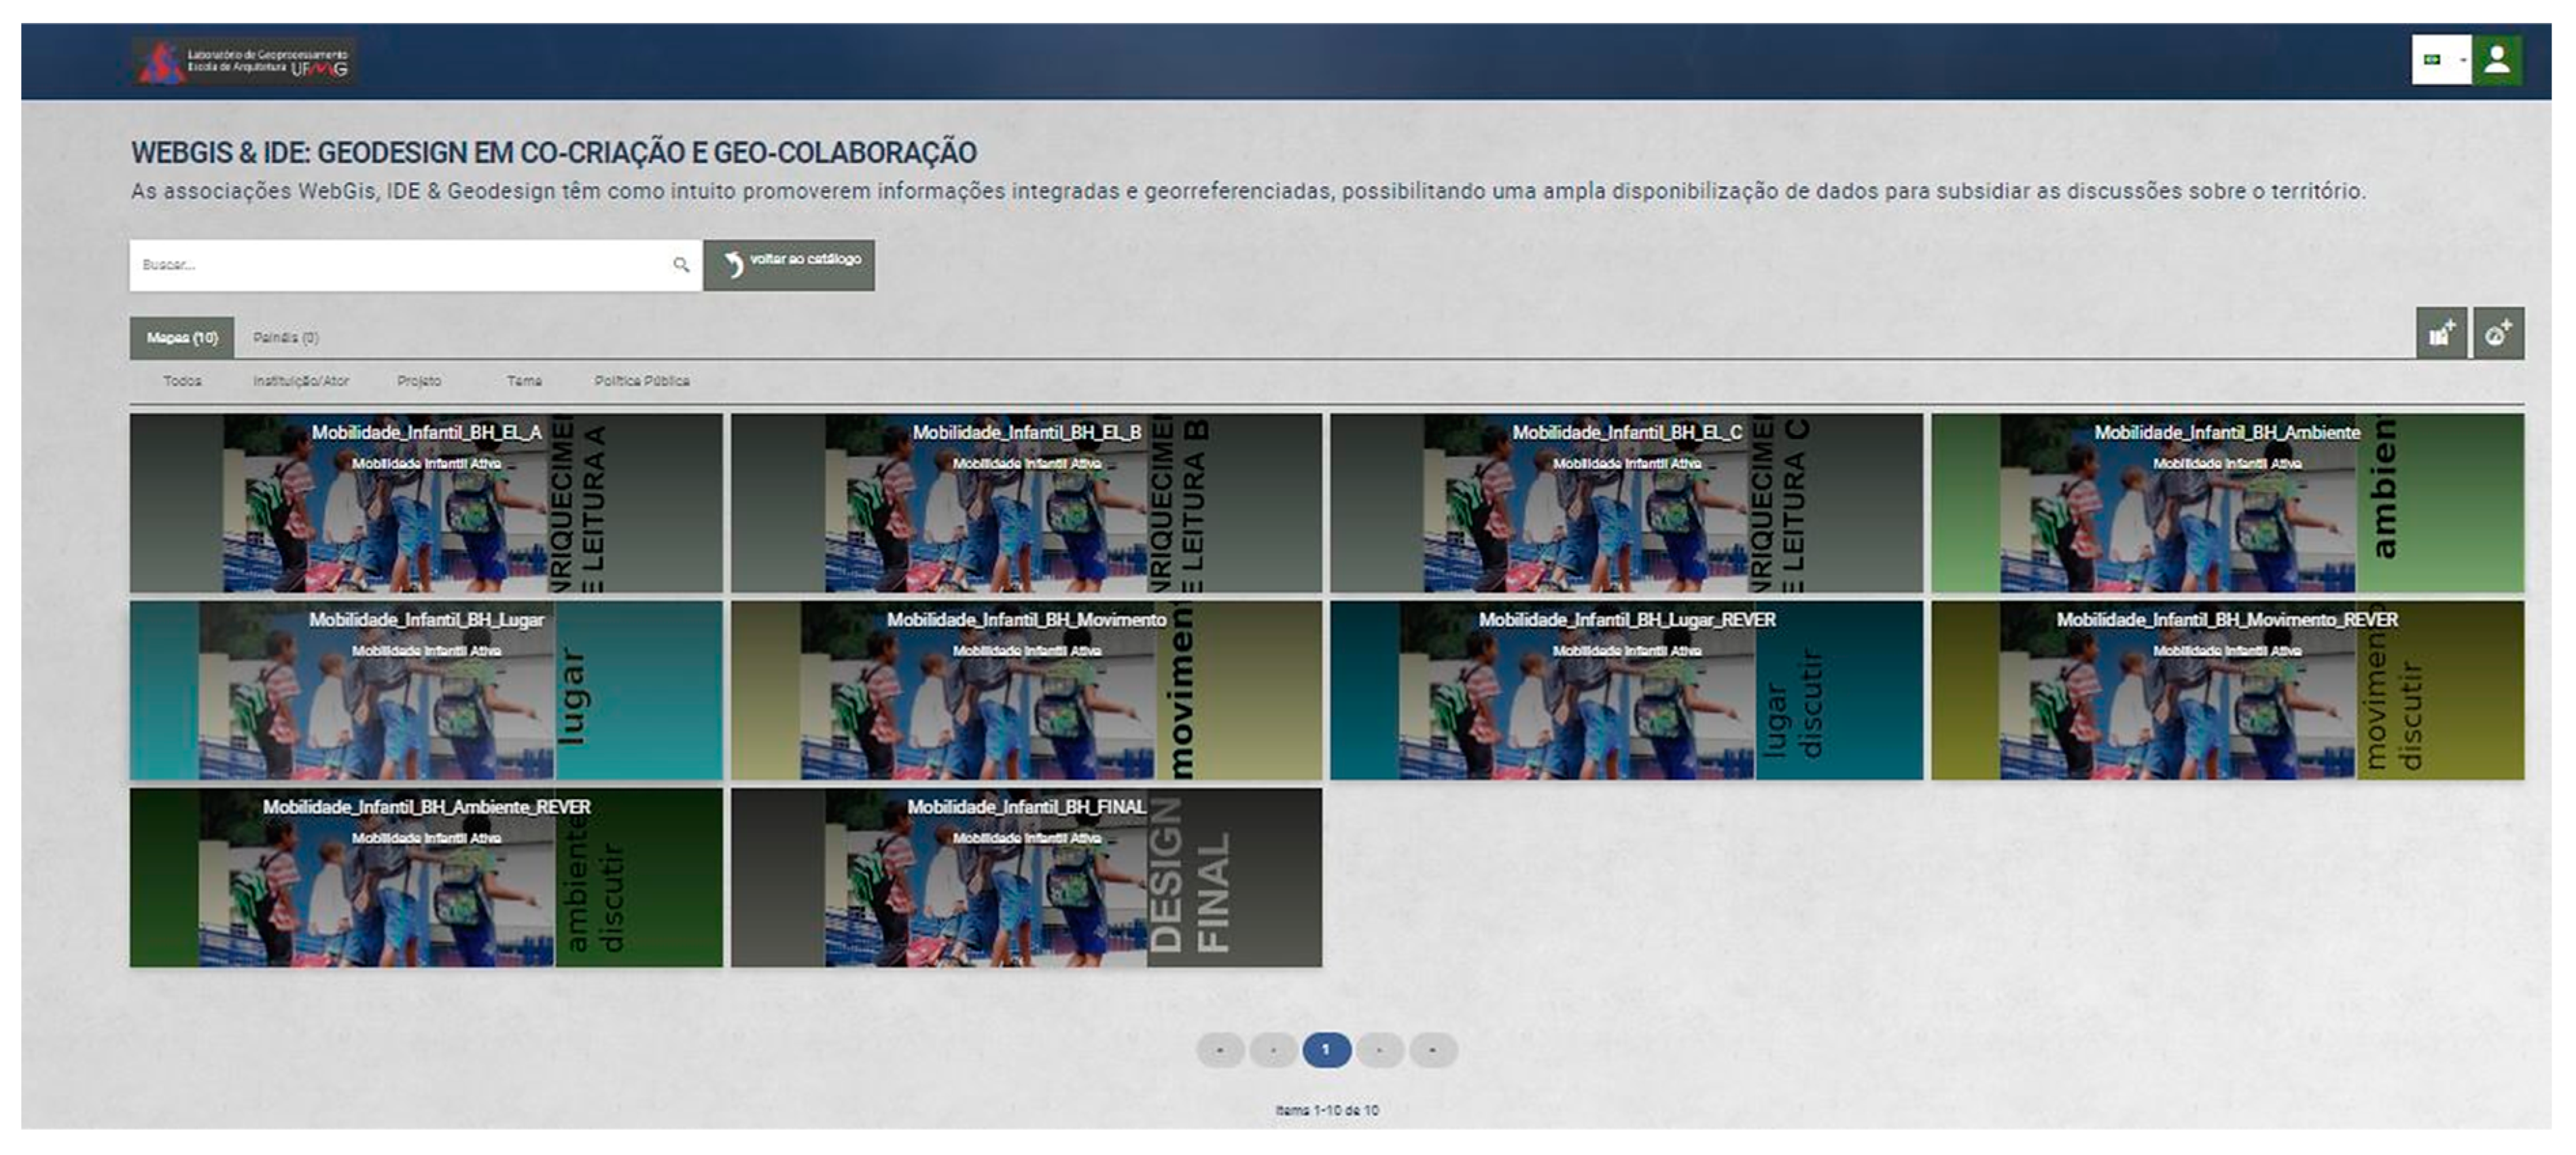
Geodesign is a process that favors the shared construction of ideas for an area through a cocreation, negotiation, and decision process. For this step, the web-based GISColab platform was used, developed by GE21 Geotecnologias and adapted to the geodesign by Moura and Freitas [39]. The platform is structured as a spatial data infrastructure (SDI) in which the collection of preprepared maps is made available to workshop participants to inform themselves about the area’s characteristics, vulnerabilities, and potentialities.
The participants in the workshop were organized into working groups and went through the steps of understanding the area (reading enrichment), building ideas for the site (creative dialogues), evaluating the ideas (comment and suggestion dialogues), checking the fulfillment of the proposed goals (widgets for measuring performance), negotiation, and voting. The result was the design of alternative futures for the area that, in this case, was the aim of favoring the children’s independent mobility.
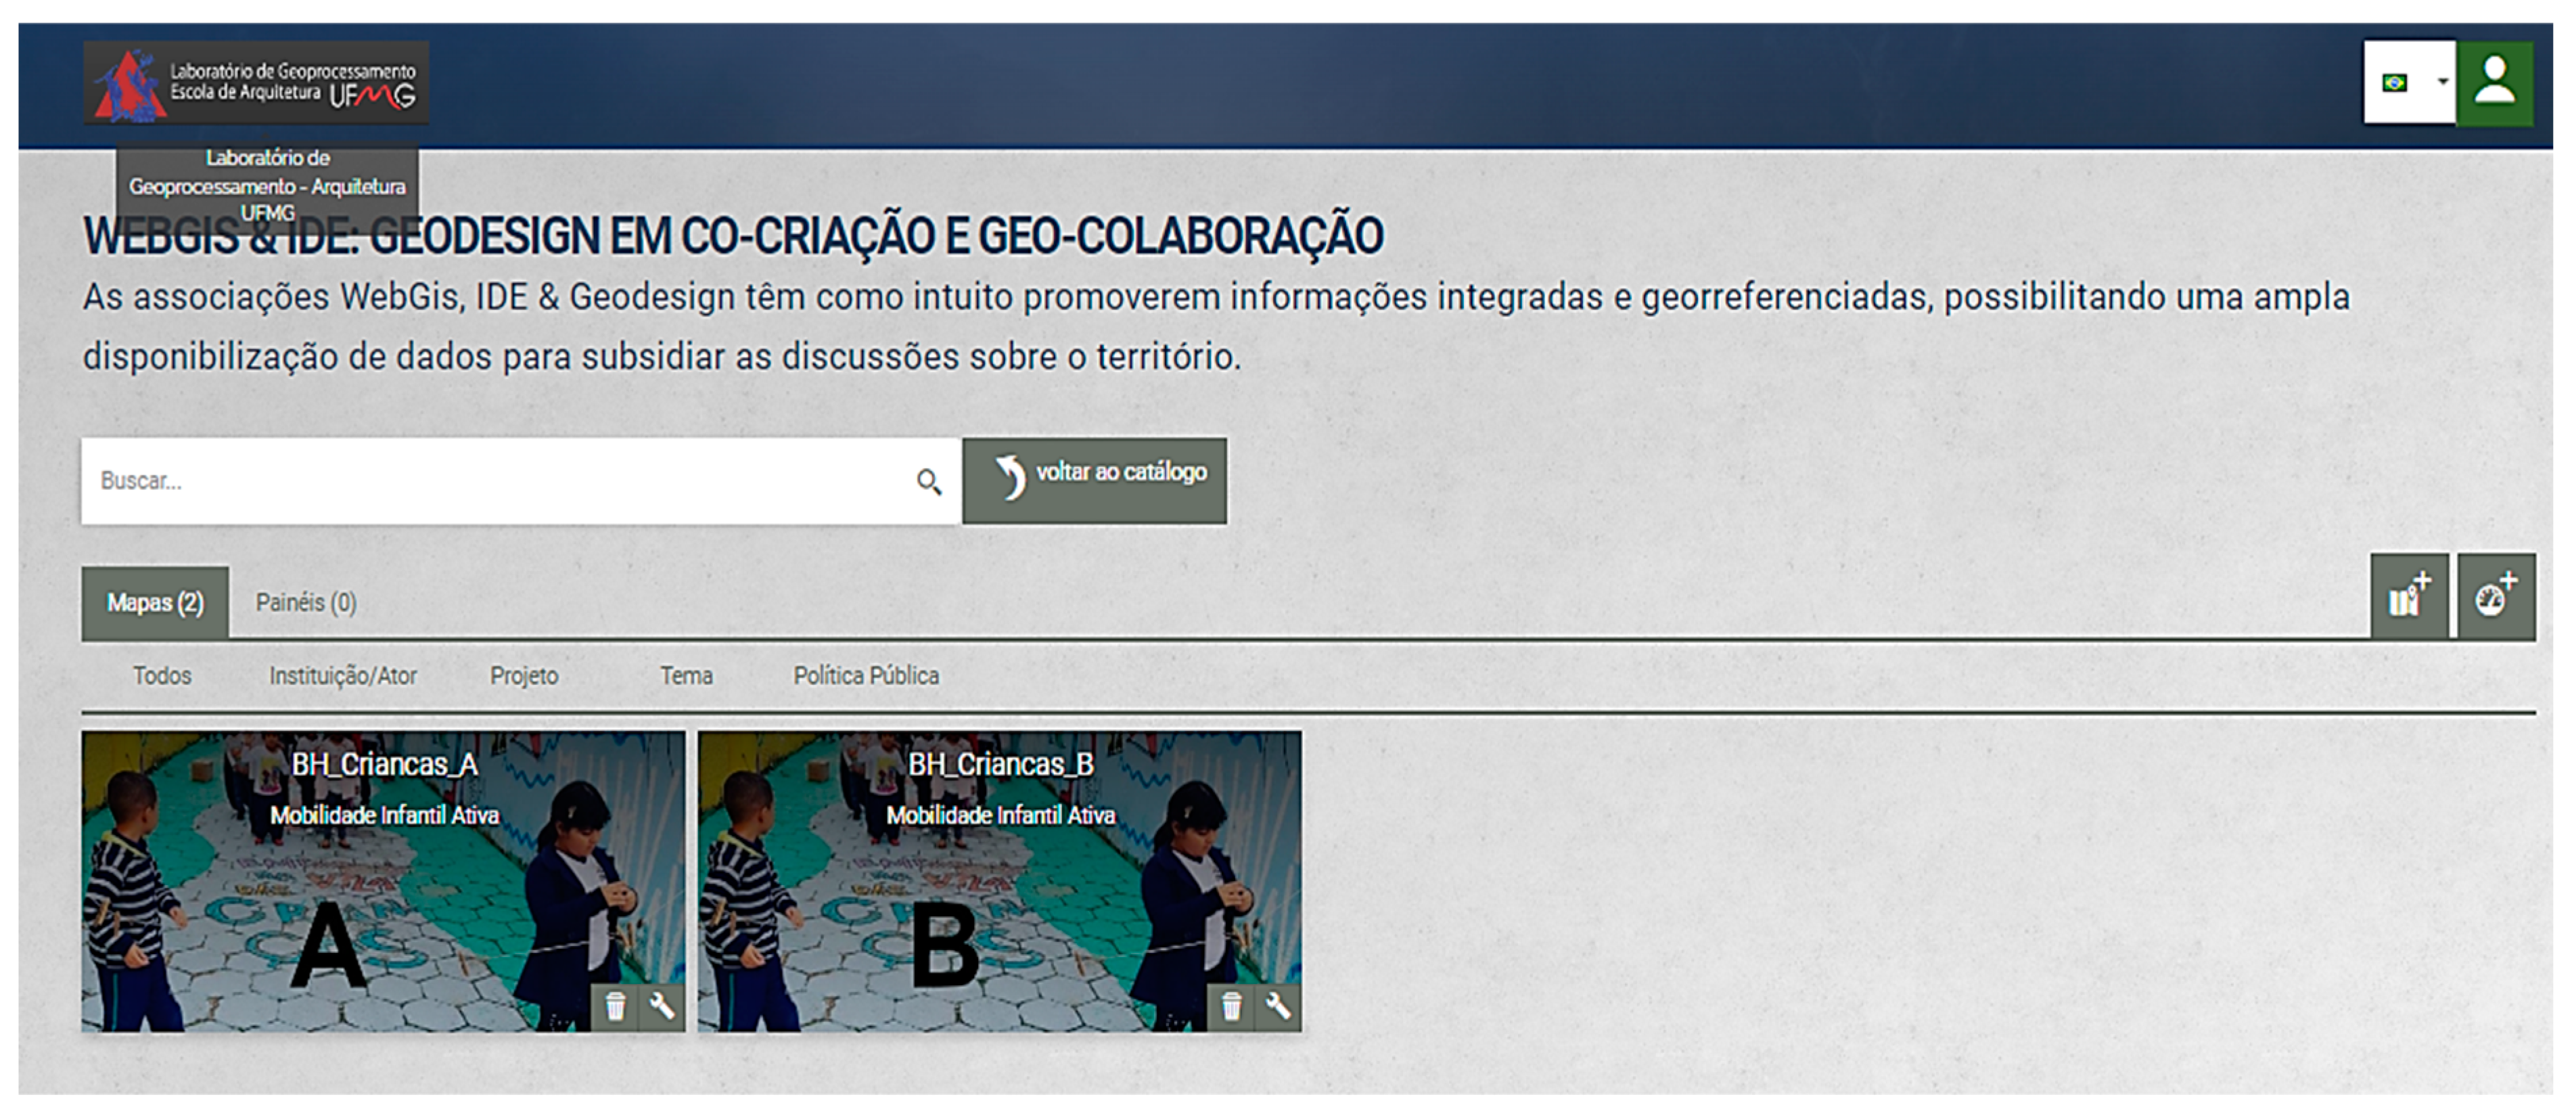
Two projects were created: one to be used with the children and another with the technical group of adults (the undergraduate urban planning students). In the children’s project, they were supposed to be divided into Group A and Group B; each group would create drawings of ideas for the area using polygons, with a title and description, and in a second moment, would comment on the views of the opposite group; finally, they would vote on the ideas (Figure 6).
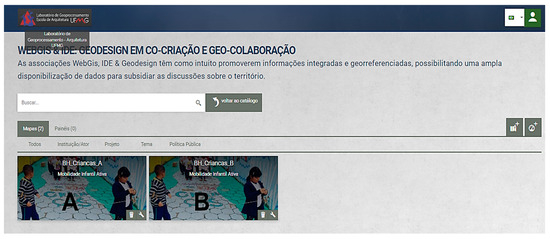
Figure 6.
The screen of the “Children BH” project in the GISColab. Contexts for Group A and Group B.
In the technical group, they were divided into three groups to carry out the reading enrichment stage. Next, they would create ideas for the context’s “environment”, “place”, and “mobility”, associating each idea with one or more of the fifteen completeness indicators. The ideas would go through discussions and comments, the achievement of goals would be verified to meet the 15 indicators, and, finally, they would vote and decide on the final proposal (Figure 7 and Figure 8).
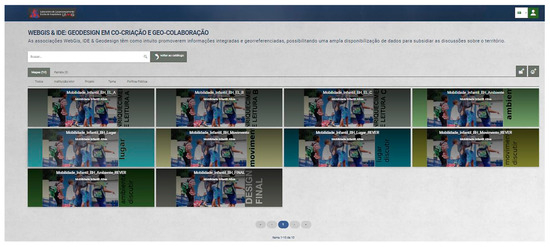
Figure 7.
The screen of the “Children URB018” project in the GISColab.
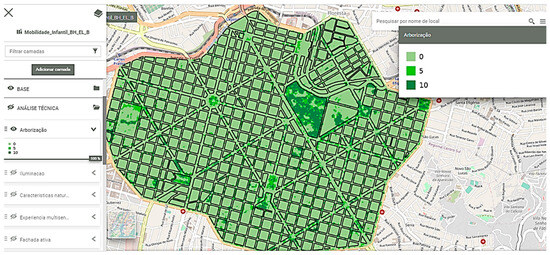
Figure 8.
Access to the map collection in the “Children URB018” project in the GISColab application.
4. Development—The Technical Approach and the Work with the Children
The work began with the initial registration of the opinions by the children on the VGI ViconSAGA platform about the spatial occurrences that brought about feelings of topophilia (I like) and topophobia (I do not like). Through a technical approach, the adults also used the ViconSAGA platform. Still, in another project, with the aim of registering the presence of the 15 completeness indicators, the variables were chosen to characterize the suitable conditions for the children’s independent mobility.
Then, for the integration of the maps by the multicriteria analysis, both the children and adults were consulted about the relative importance of each indicator. The children were consulted in four steps: by analysing the records on the VGI platform; by direct consultation on the hierarchy of variables; by observing the values associated with their ideas in the cocreation by the geodesign; by analyzing the drawings created in an artistic workshop. In the technical approach, the adults were consulted directly using the Delphi method, in which, in the first round, they indicated the importance from 0 to 10 for each variable. The average and mode of the opinions were calculated, which were shown to the participants so that they could decide to make changes, after which the final average was made, resulting in relative percentages in the sum of 100%.
In the geodesign workshop with the children, they presented ideas for transforming the area, which was used to understand the values and expectations they most valued. In the geodesign workshop with the adults, the process was more complex, as the objective was the collective construction of ideas for the area, considering all the material produced and the information obtained from the citizens listening to the children.
Geodesign is a process of cocreating ideas that follows a framework aimed at collectively constructing proposals and negotiating alternative futures for an area. In the case of the children, the purpose was to listen to the most critical indicators to identify the most essential variables for a space to be qualified as attractive for children’s mobility and permanence. In the case of the adults, it had a propositional character on how to transform the area through urban design or the parameterization of actions and the uses of the territory.
4.1. VGI—Volunteered Mapping
The VGI platform was structured in two projects to allow for the voluntary registration of the children in spaces of topophilia and topophobia on their way from home to school. In contrast, for the technical group registration, it was organized to register the presence of one or more indicators of completeness, that are composed by spatial variables about qualities of urban roads in the study area.
4.1.1. The VGI Application with the Children
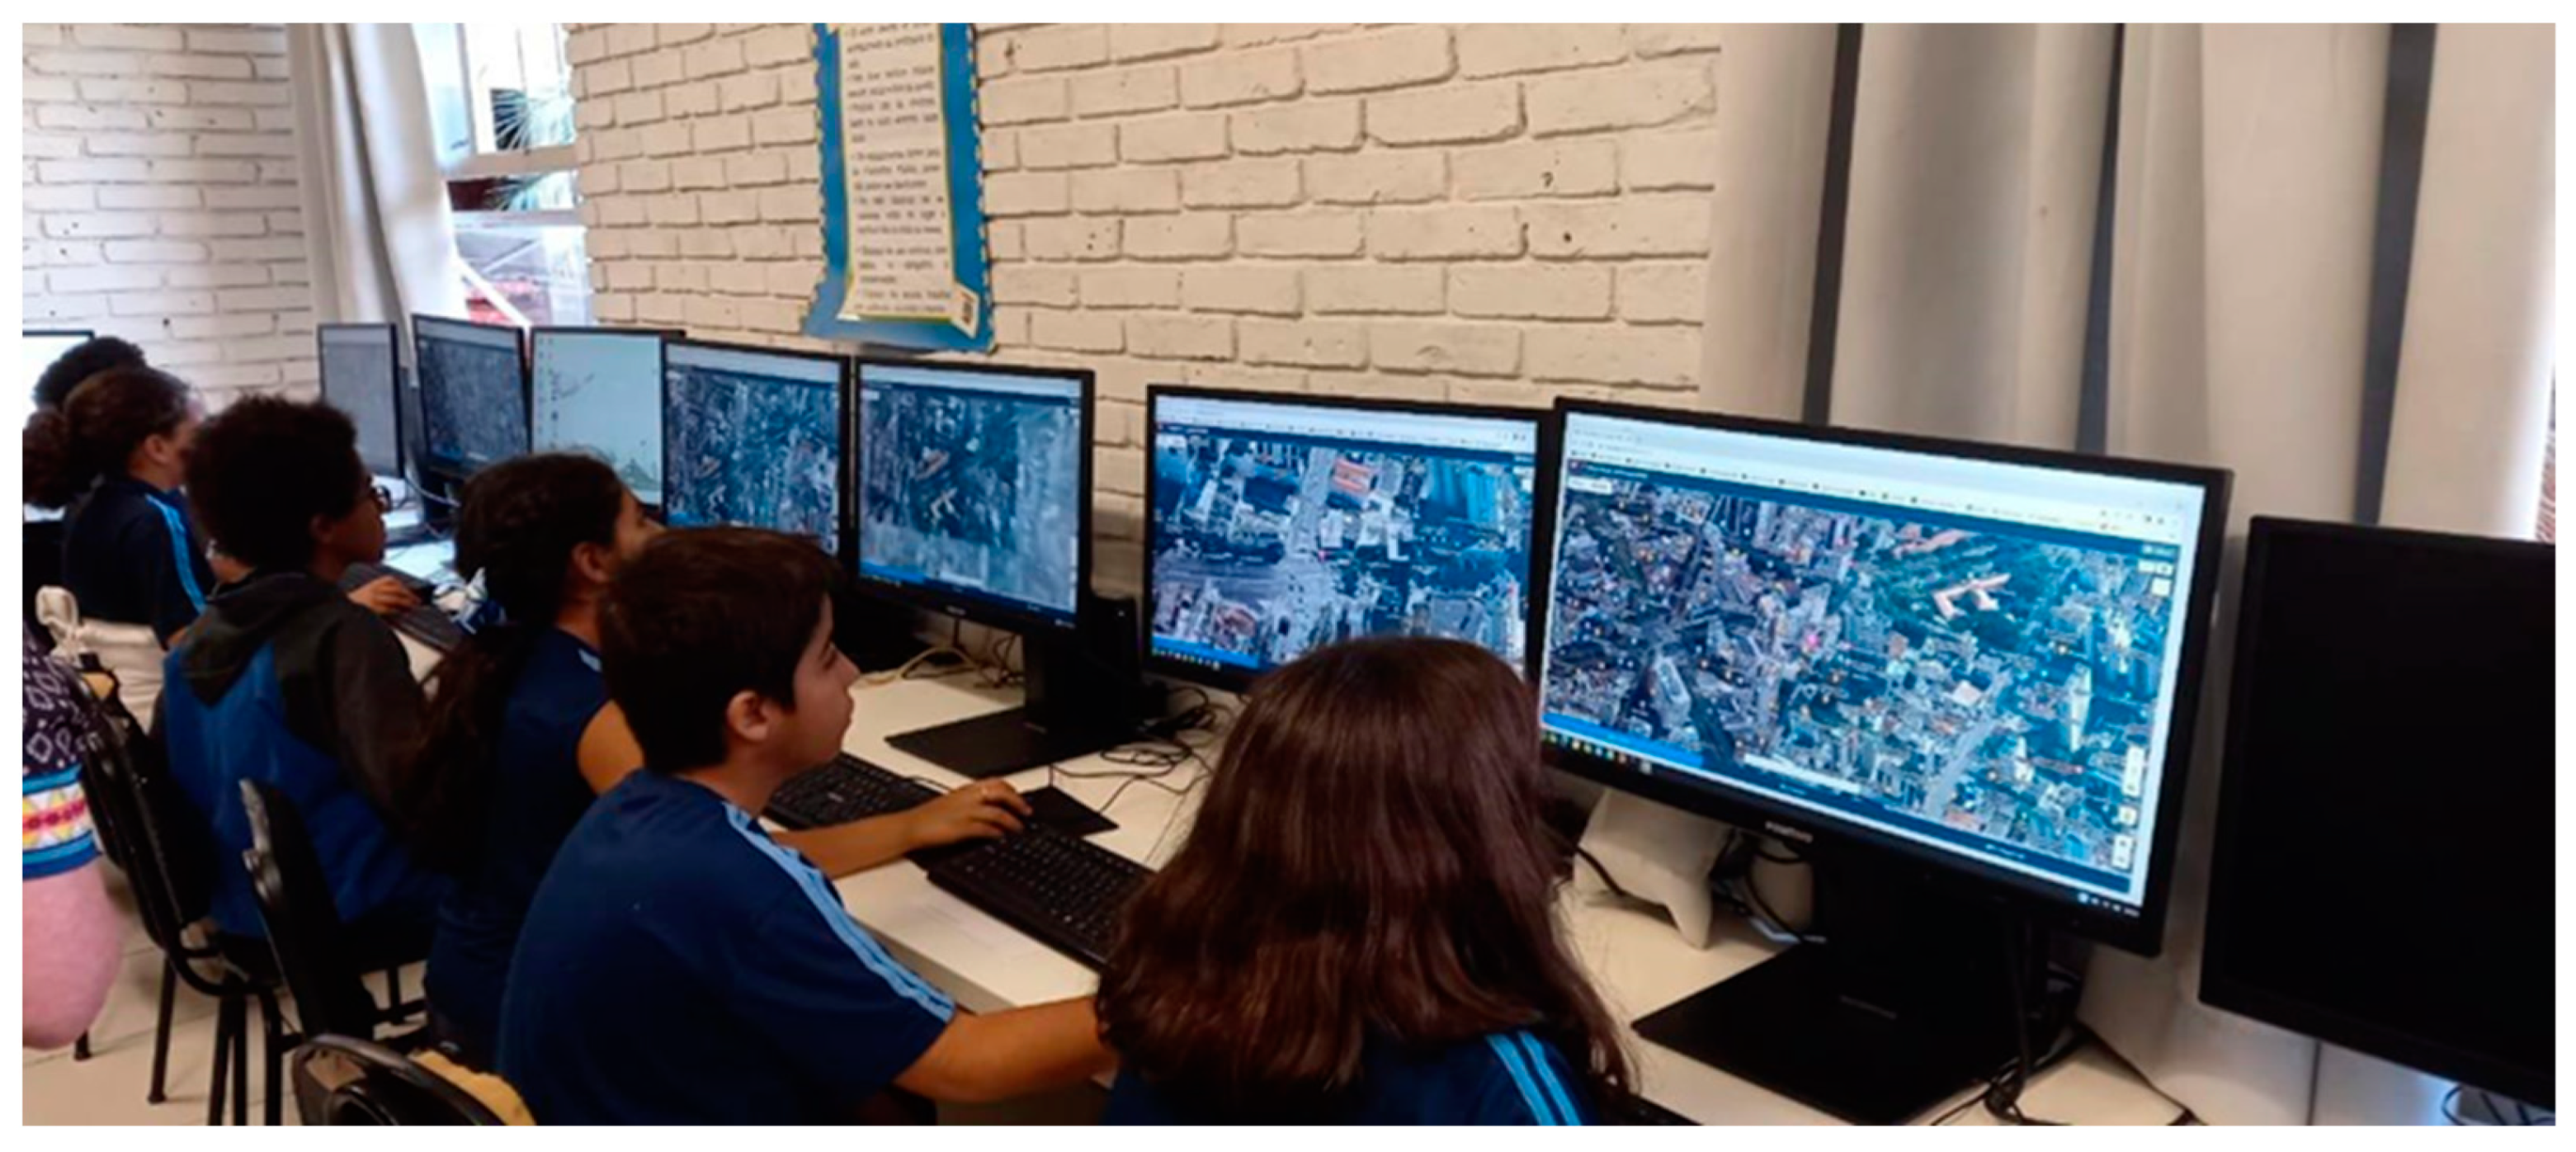
The first meeting with the children was at the B.B. State School’s Computer Laboratory. The project’s objectives were explained, and they were asked to think about their route to walk from home to school, and vice versa. Using ViconSAGA, they were asked to locate the school, which they quickly managed. Then, they were asked to identify elements around the school, which was very easy for them. Once confident using the map, the children were encouraged to determine how to get to school. Finally, they were instructed to register the points and describe the elements they liked along the way, and then what they did not like. The first registers had the support of mediators for the use of the mouse, but the children quickly took over the whole process. All tasks were efficiently completed in less than an hour of activity.
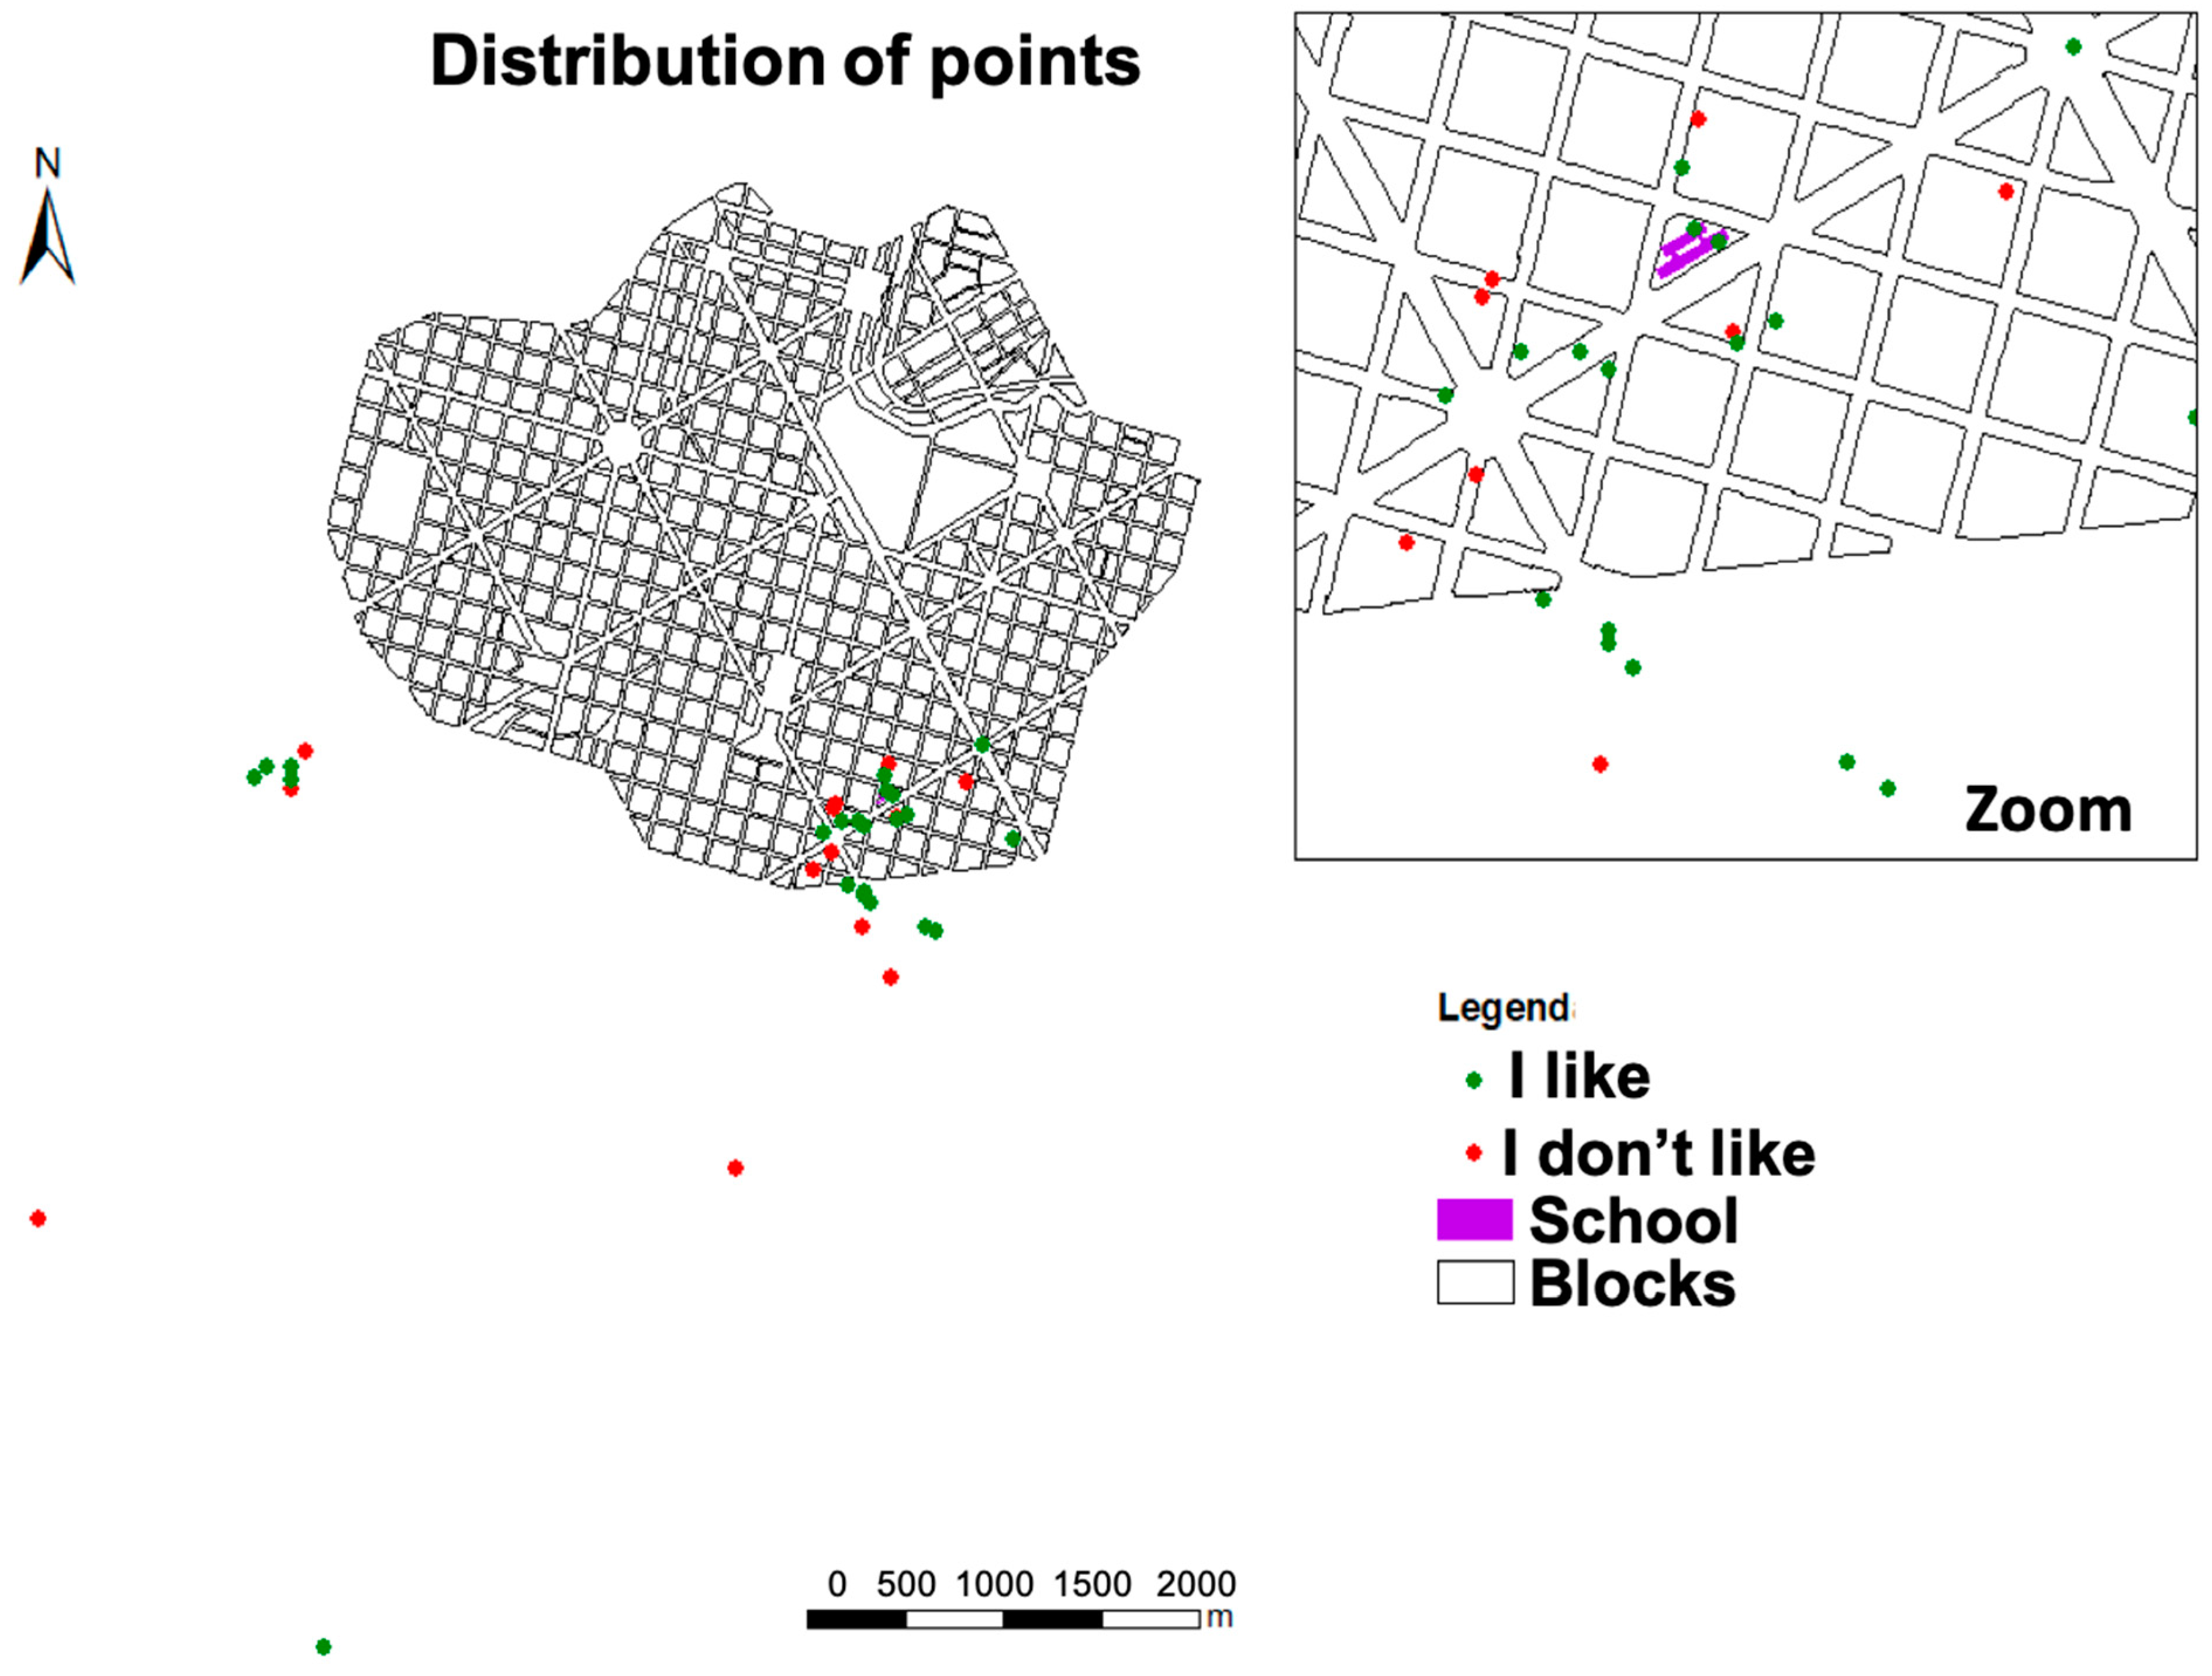
In total, 48 records were made in 30 min by five children, which demonstrates that the task was easy for them (Figure 9). The children were allowed to use the platform at home, on their parents’ cell phones, or on computers if they wanted to include more records. Removing the repetitions, there were 22 records of “I like” and 14 records of “I don’t like”, which is an average of 7 records per child (Figure 10).
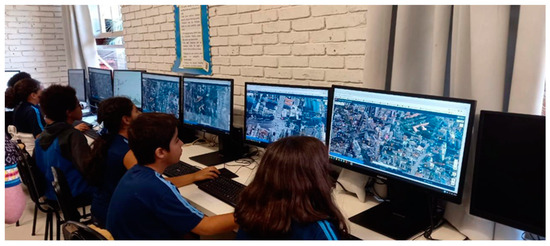
Figure 9.
Participation of the children in the VGI process.
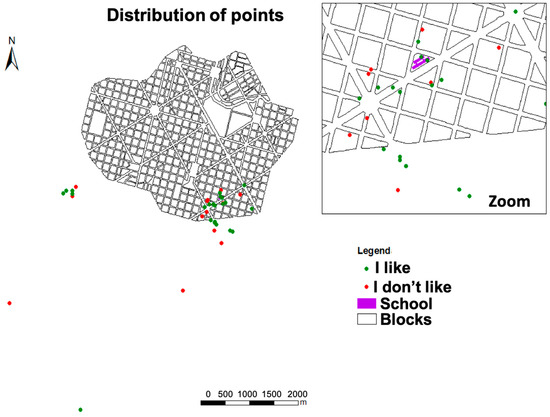
Figure 10.
Opinions registered.
4.1.2. Application of the VGI with the Technical Group
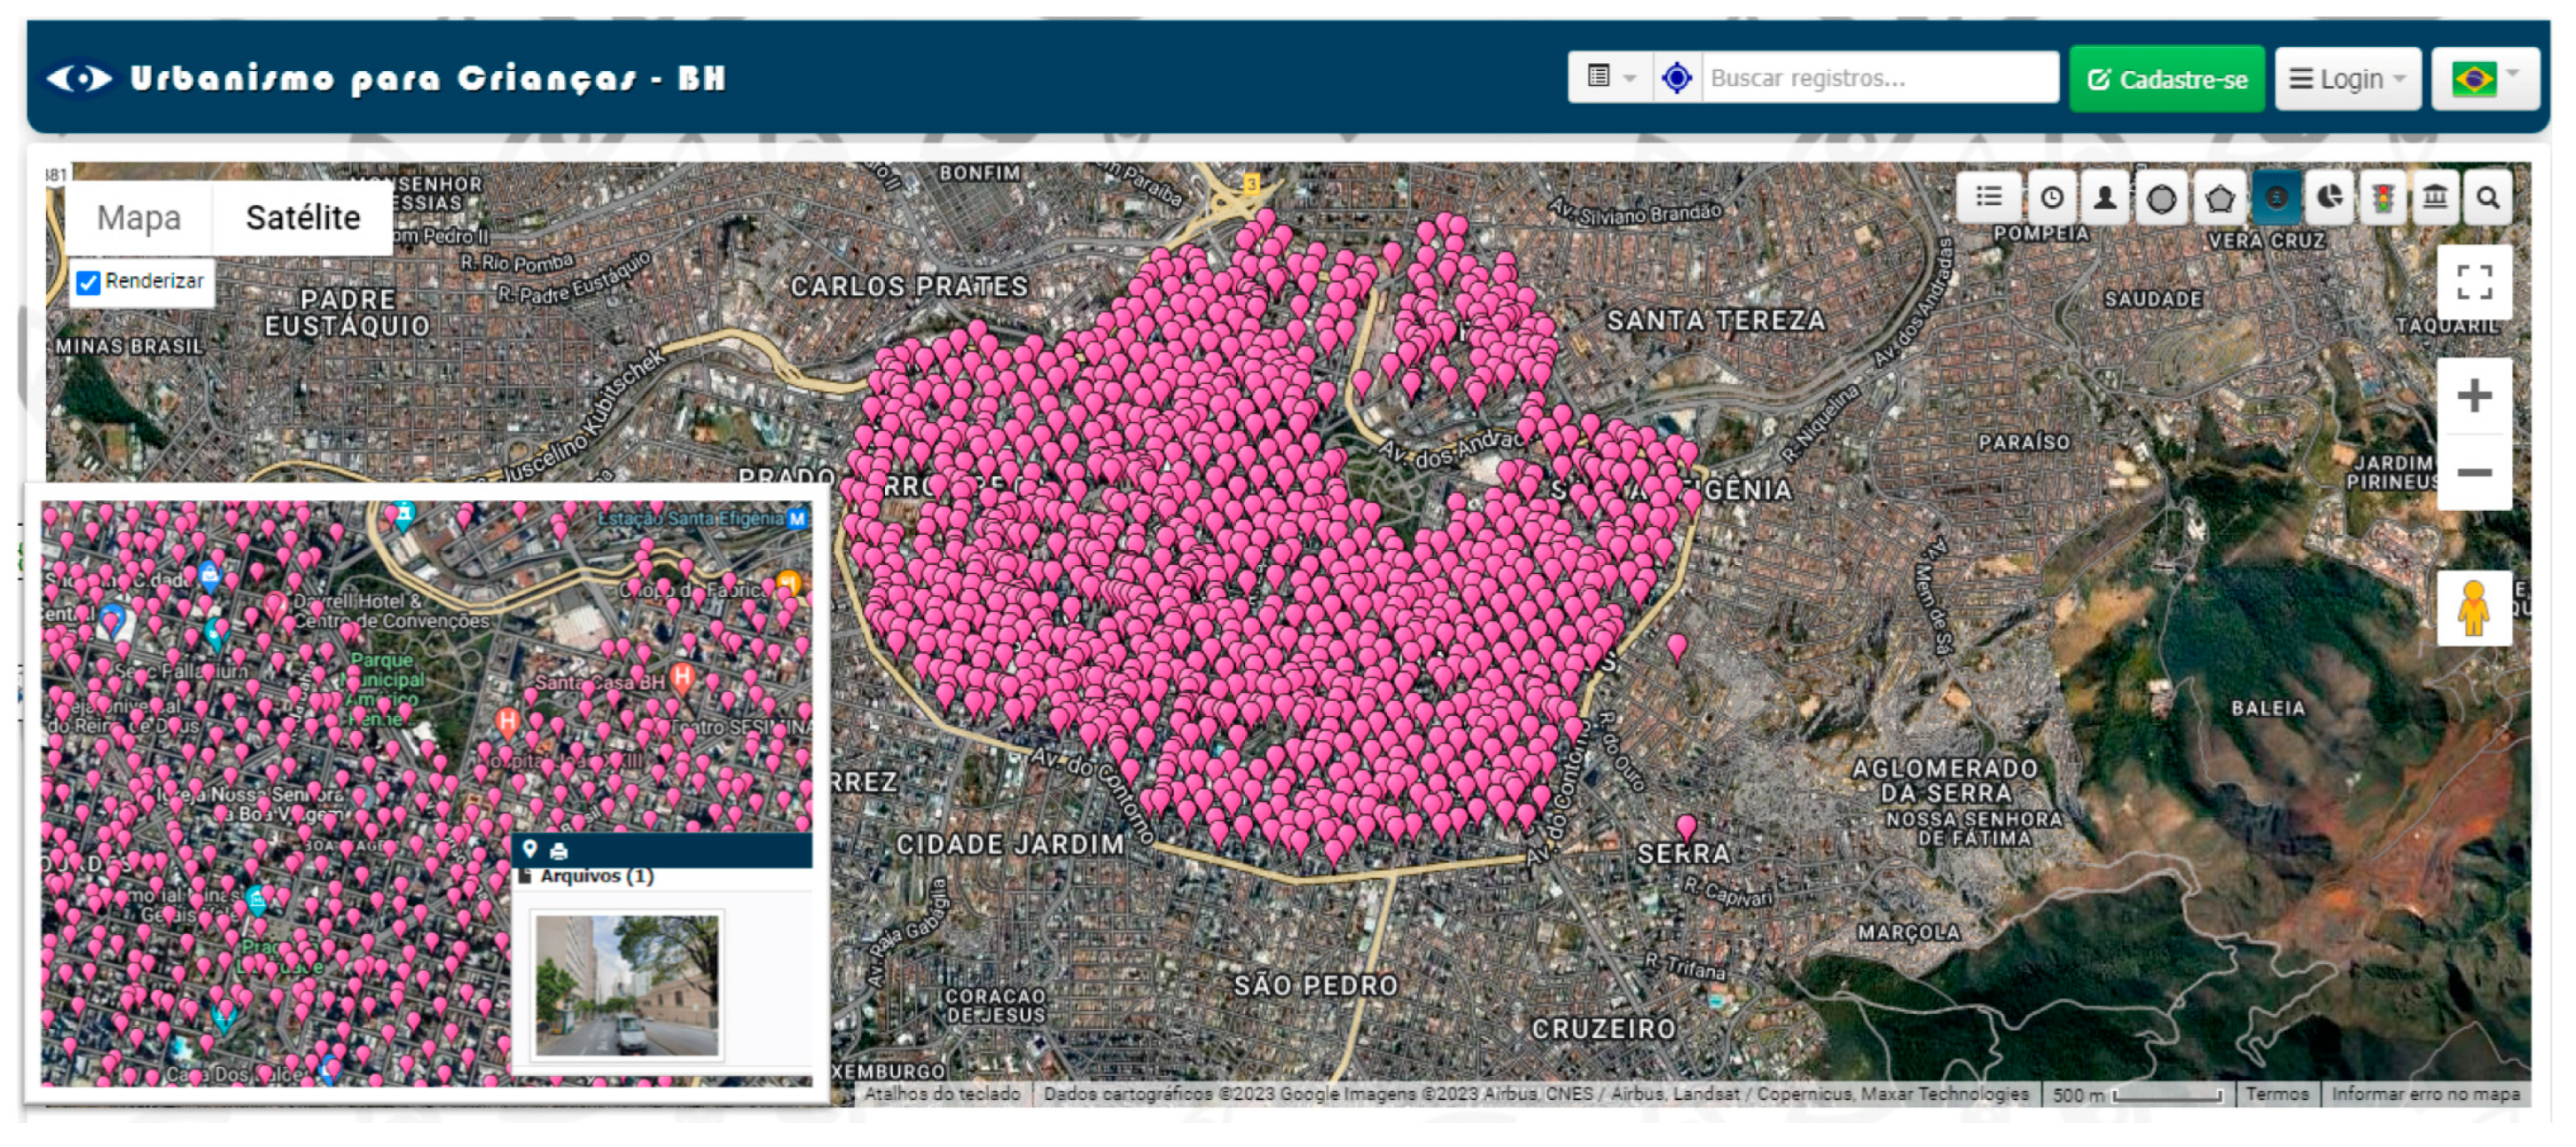
A new project was prepared for the technical group in the ViconSAGA VGI application. The group consisted of 14 undergraduate students from the urban planning course. They investigated the entire study area of 8.6 km2 by fieldwork, using the application on their cell phones and recording the points associated with the 15 indicators. Using the cell phone, each person went through the territory and registered information about the presence of the variables, including capturing images. The result was the registration of 637 points informing on the existence of one or more of the fifteen indicators associated with the photos (Figure 11).
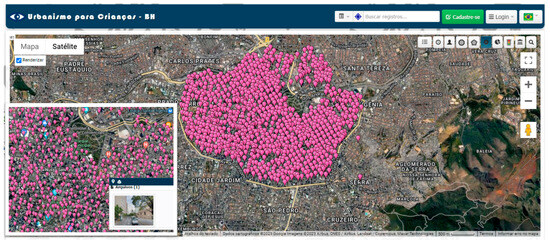
Figure 11.
VGI—field capture; registering of the indicators. General visualization of the screen and detail when consulting an specific pin.
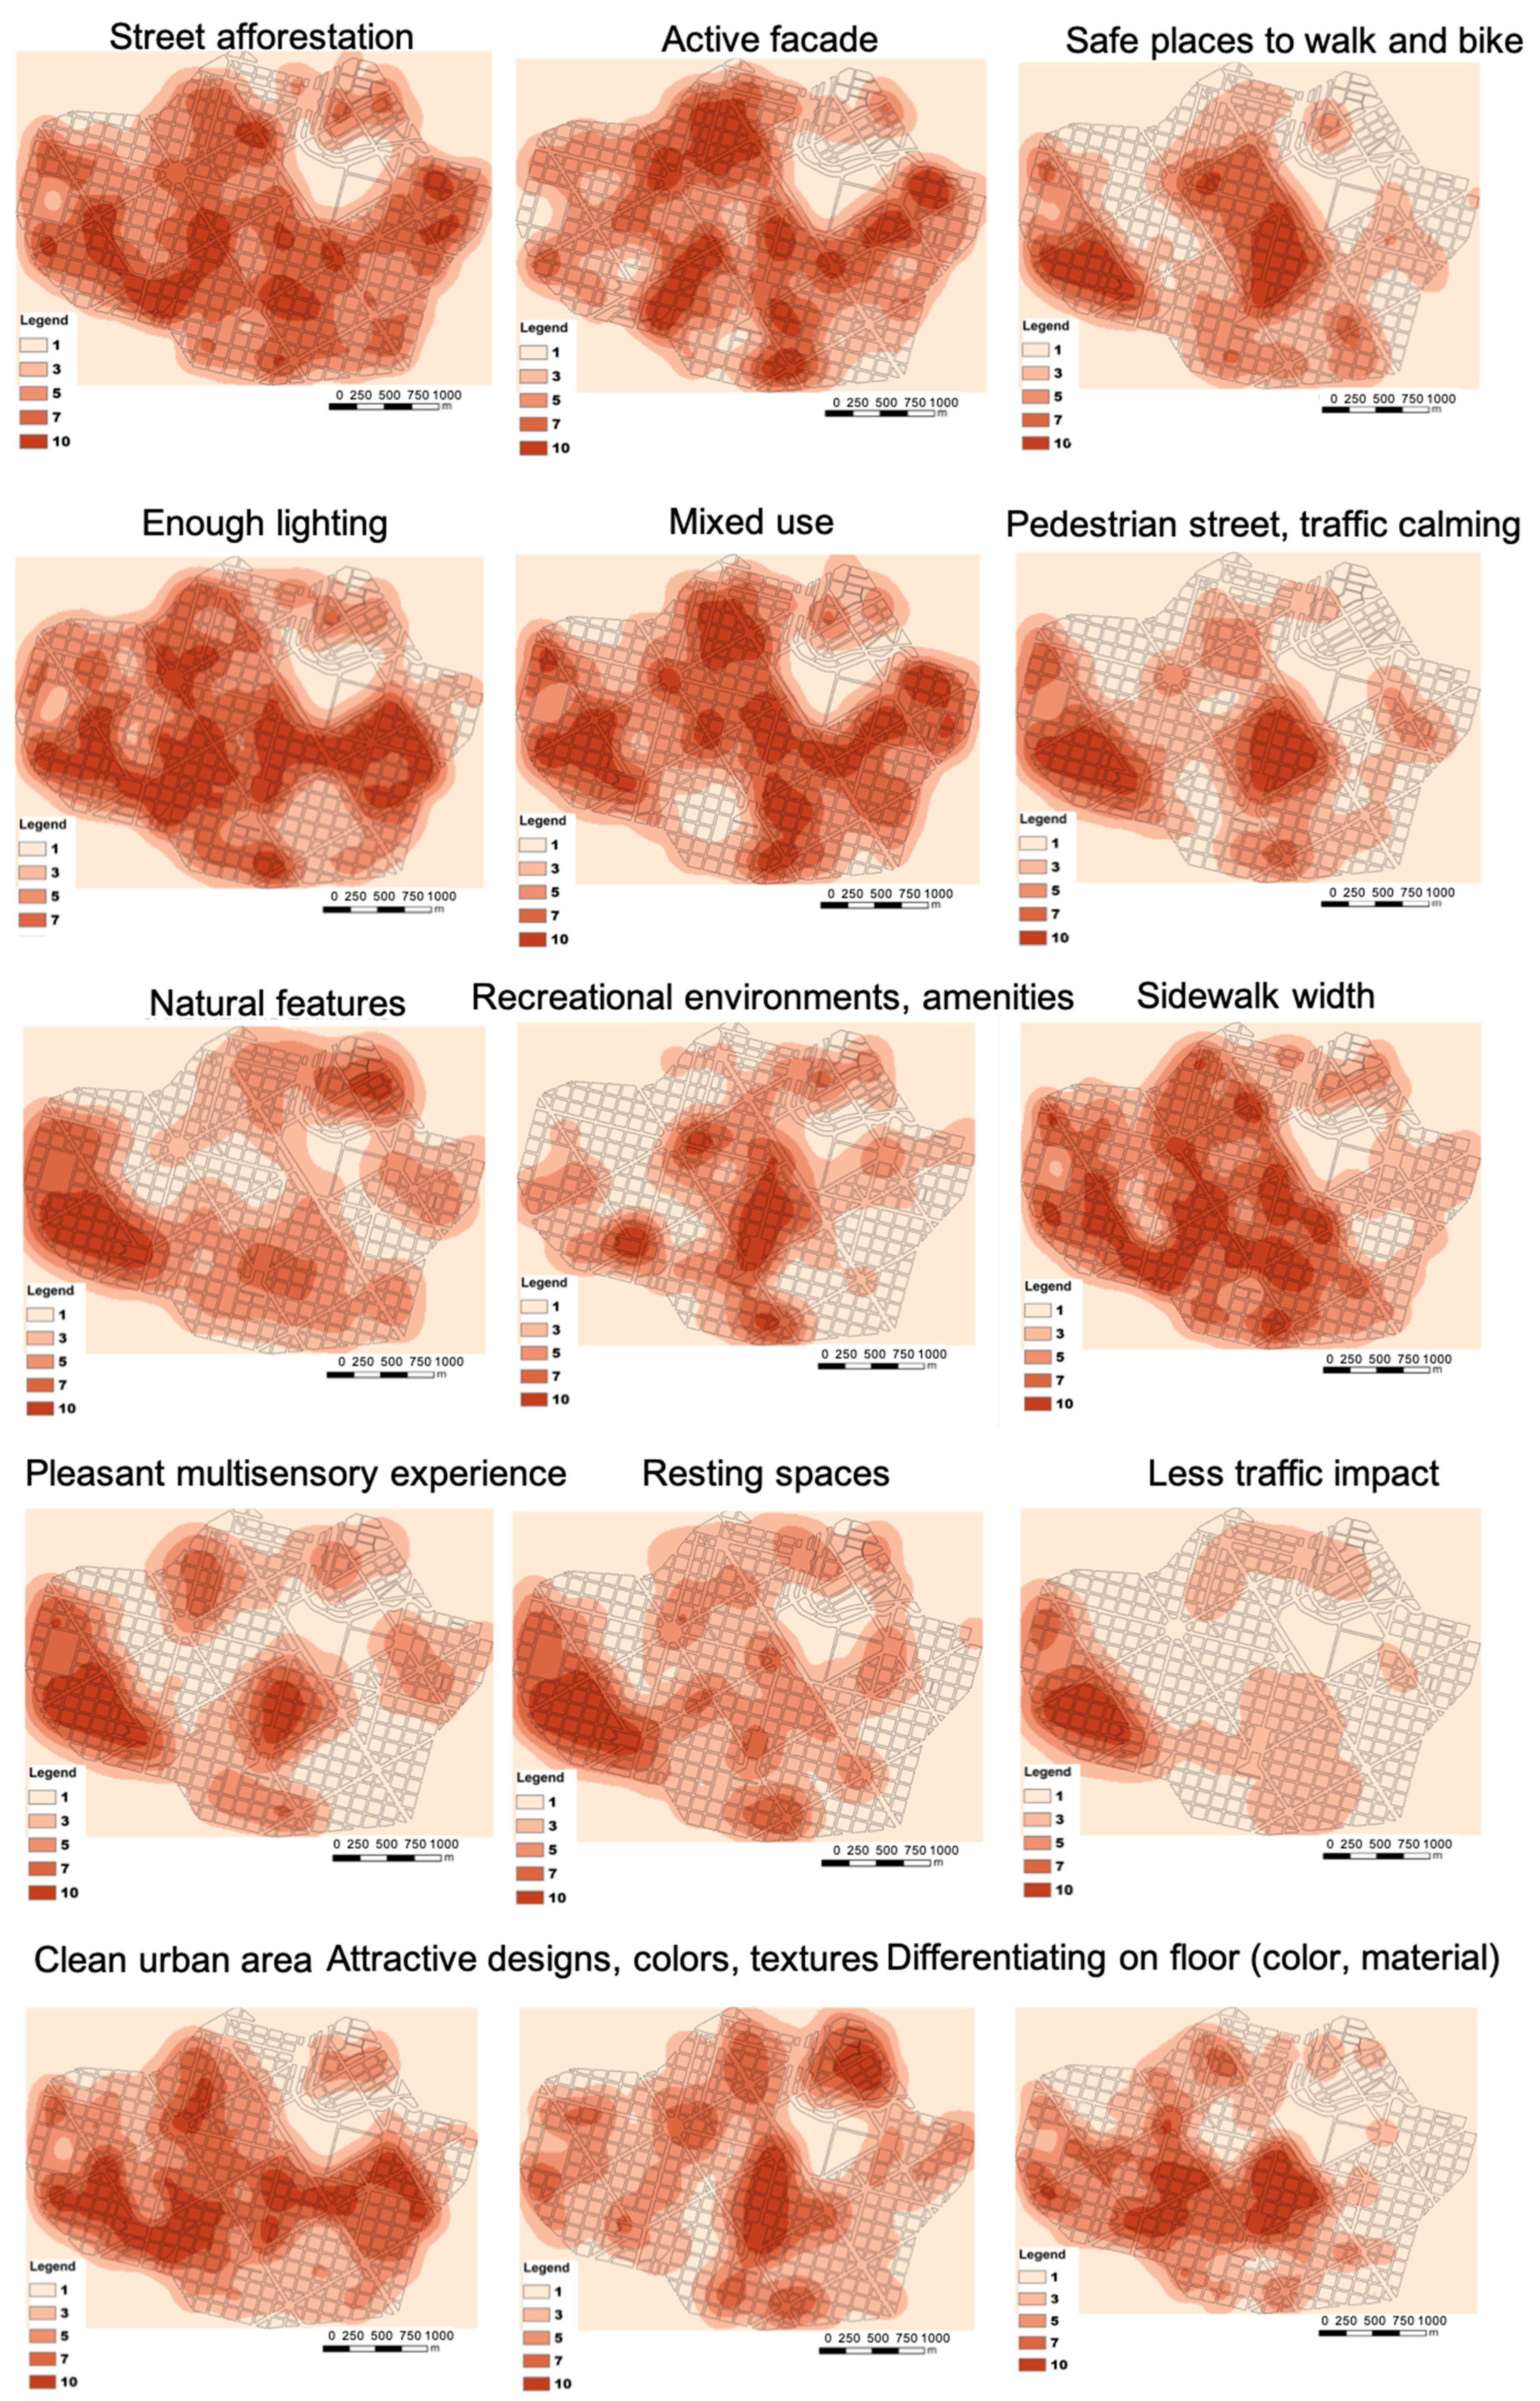
The registering of the data allowed for the organization of the maps of the concentration of occurrences by the indicator, through the Kernel Density feature in the ArcGIS application, to identify the area of the event of each of the 15 analysis variables (Figure 12).
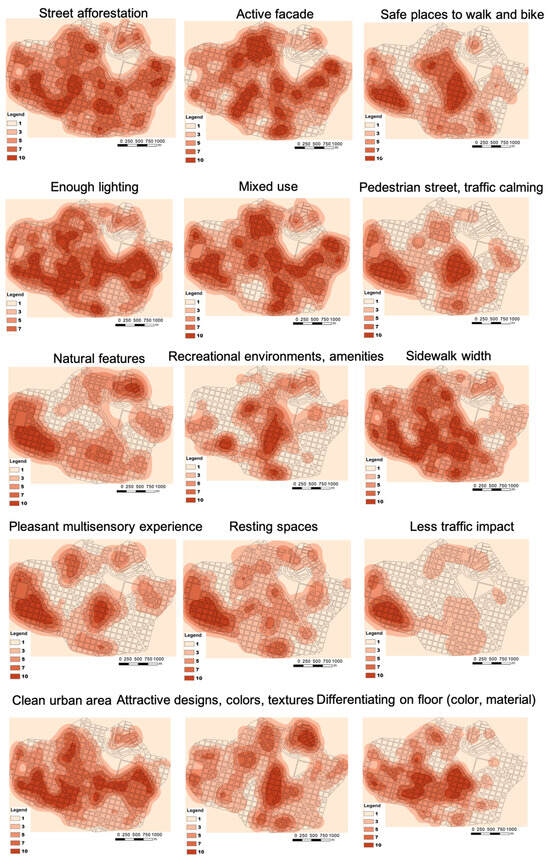
Figure 12.
Kernel density with the concentration of each indicator.
4.2. Consultation on the Hierarchy of Indicators
To integrate the maps by the multicriteria analysis by the weights of evidence, it was necessary to define the weight according to the degree of importance of each variable (the 15 completeness indicators) according to the citizens’ opinions of the children and the vision of the technical group.
4.2.1. Query with the Children
In the second meeting with the children, the list of 15 indicators for measuring the urban street quality, organized by the coordinators, was presented. They had already understood the research objectives based on the previous activities, so they could answer more complex questions. For each topic, we asked the opinion of each child, who should answer whether the item was “very important”, “of medium importance”, or “not important”. The values were noted and the predominance of answers was identified. It was observed that they had no difficulty in answering, and the most important indicators were street afforestation, cleaning and maintenance, a pleasant multisensorial experience, an active façade, recreational environments, safe places to walk, traffic control and pedestrian promotion, and the presence of a physical barrier between the sidewalk and street.
A geodesign activity was planned with the children in which they would use the GISColab platform for the cocreation process and the negotiation of ideas for the area. The platform works as an SDI (spatial data infrastructure) based on the web, in which informative maps can be included and participants can elaborate, discuss, and vote on ideas for the area. In previous experiences, the ability of children to participate in geodesign had already been proven [40,41,42].
The plan was to separate the children into two groups, A and B, where they were expected to draw their ideas, followed by an exchange of contexts so that the children in Group B could vote for the proposals in Group A, and vice versa. However, when starting the task, the school’s computers blocked access to the platform. As one of the principles of geodesign is adaptability, it was decided to use an analogical process. The children, in two groups, verbally communicated their ideas, and changing from A to B, and so on, they voted on the proposals presented by the opposite group (Figure 13).
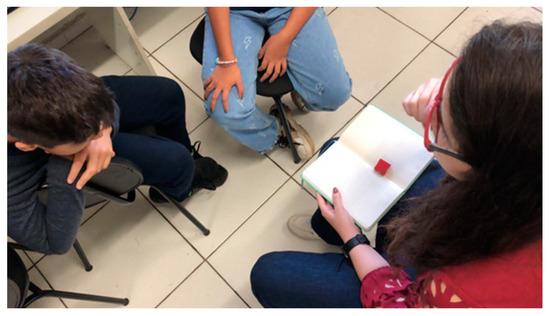
Figure 13.
Cocreation by geodesign in an analogical process.
In a third moment, the children were interviewed through an artistic workshop. During the activity, each child was invited to create a drawing that answered the questions: How would Belo Horizonte be if you were the mayor? If Belo Horizonte was for children, what would it be like? The workshop, lasting approximately 30 min to avoid fatigue, took place in a friendly and relaxed atmosphere in one of the rooms made available by the school.
To instigate the child to speak spontaneously and in more detail about their everyday urban experience, as well as their expectations regarding the city, the coordinator carried out individual unstructured interviews that addressed the content of the drawings and other topics relevant to the research objectives (Figure 14).
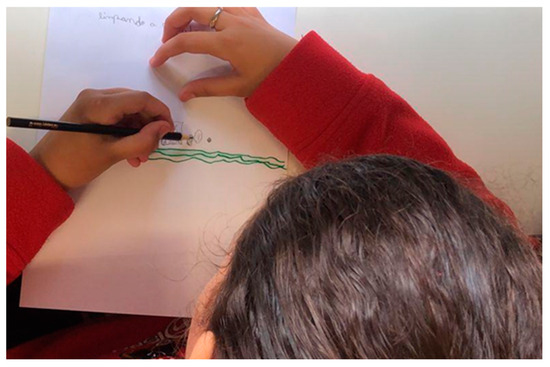
Figure 14.
Artistic workshop with the children.
The drawings produced by the children underwent content analysis, a method used in applied social sciences, which consists of quantifying the occurrence of specific terms, constructions, and references. One of the method’s variants incorporated visual data analysis, such as drawings [43]. The elements that made up the children’s drawings were accounted for in light of the indicators in the literature for promoting safe and pleasant urban experiences.
Finally, to integrate the children’s opinions, tables were built containing the relative value assigned to each indicator at each consultation stage: in the VGI, in the consultation on the hierarchy of indicators, in the geodesign, and in the drawings of the artistic workshop (Figure 15). Multicriteria analyses by the weighted sum were constructed for each stage of the investigation, and a synthesis integration of the partial results was performed.
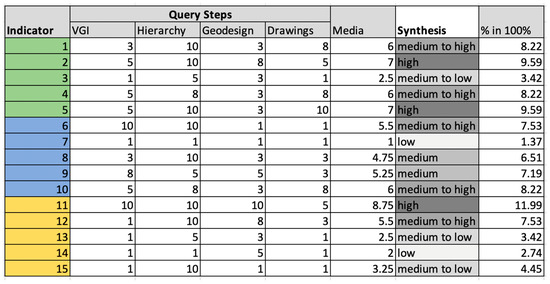
Figure 15.
Relative values assigned to each indicator at each query stage according to the children’s opinions. In green variables about environment, in blue about place and in yellow about mobility.
4.2.2. Query with the Adults—The Technical Approach
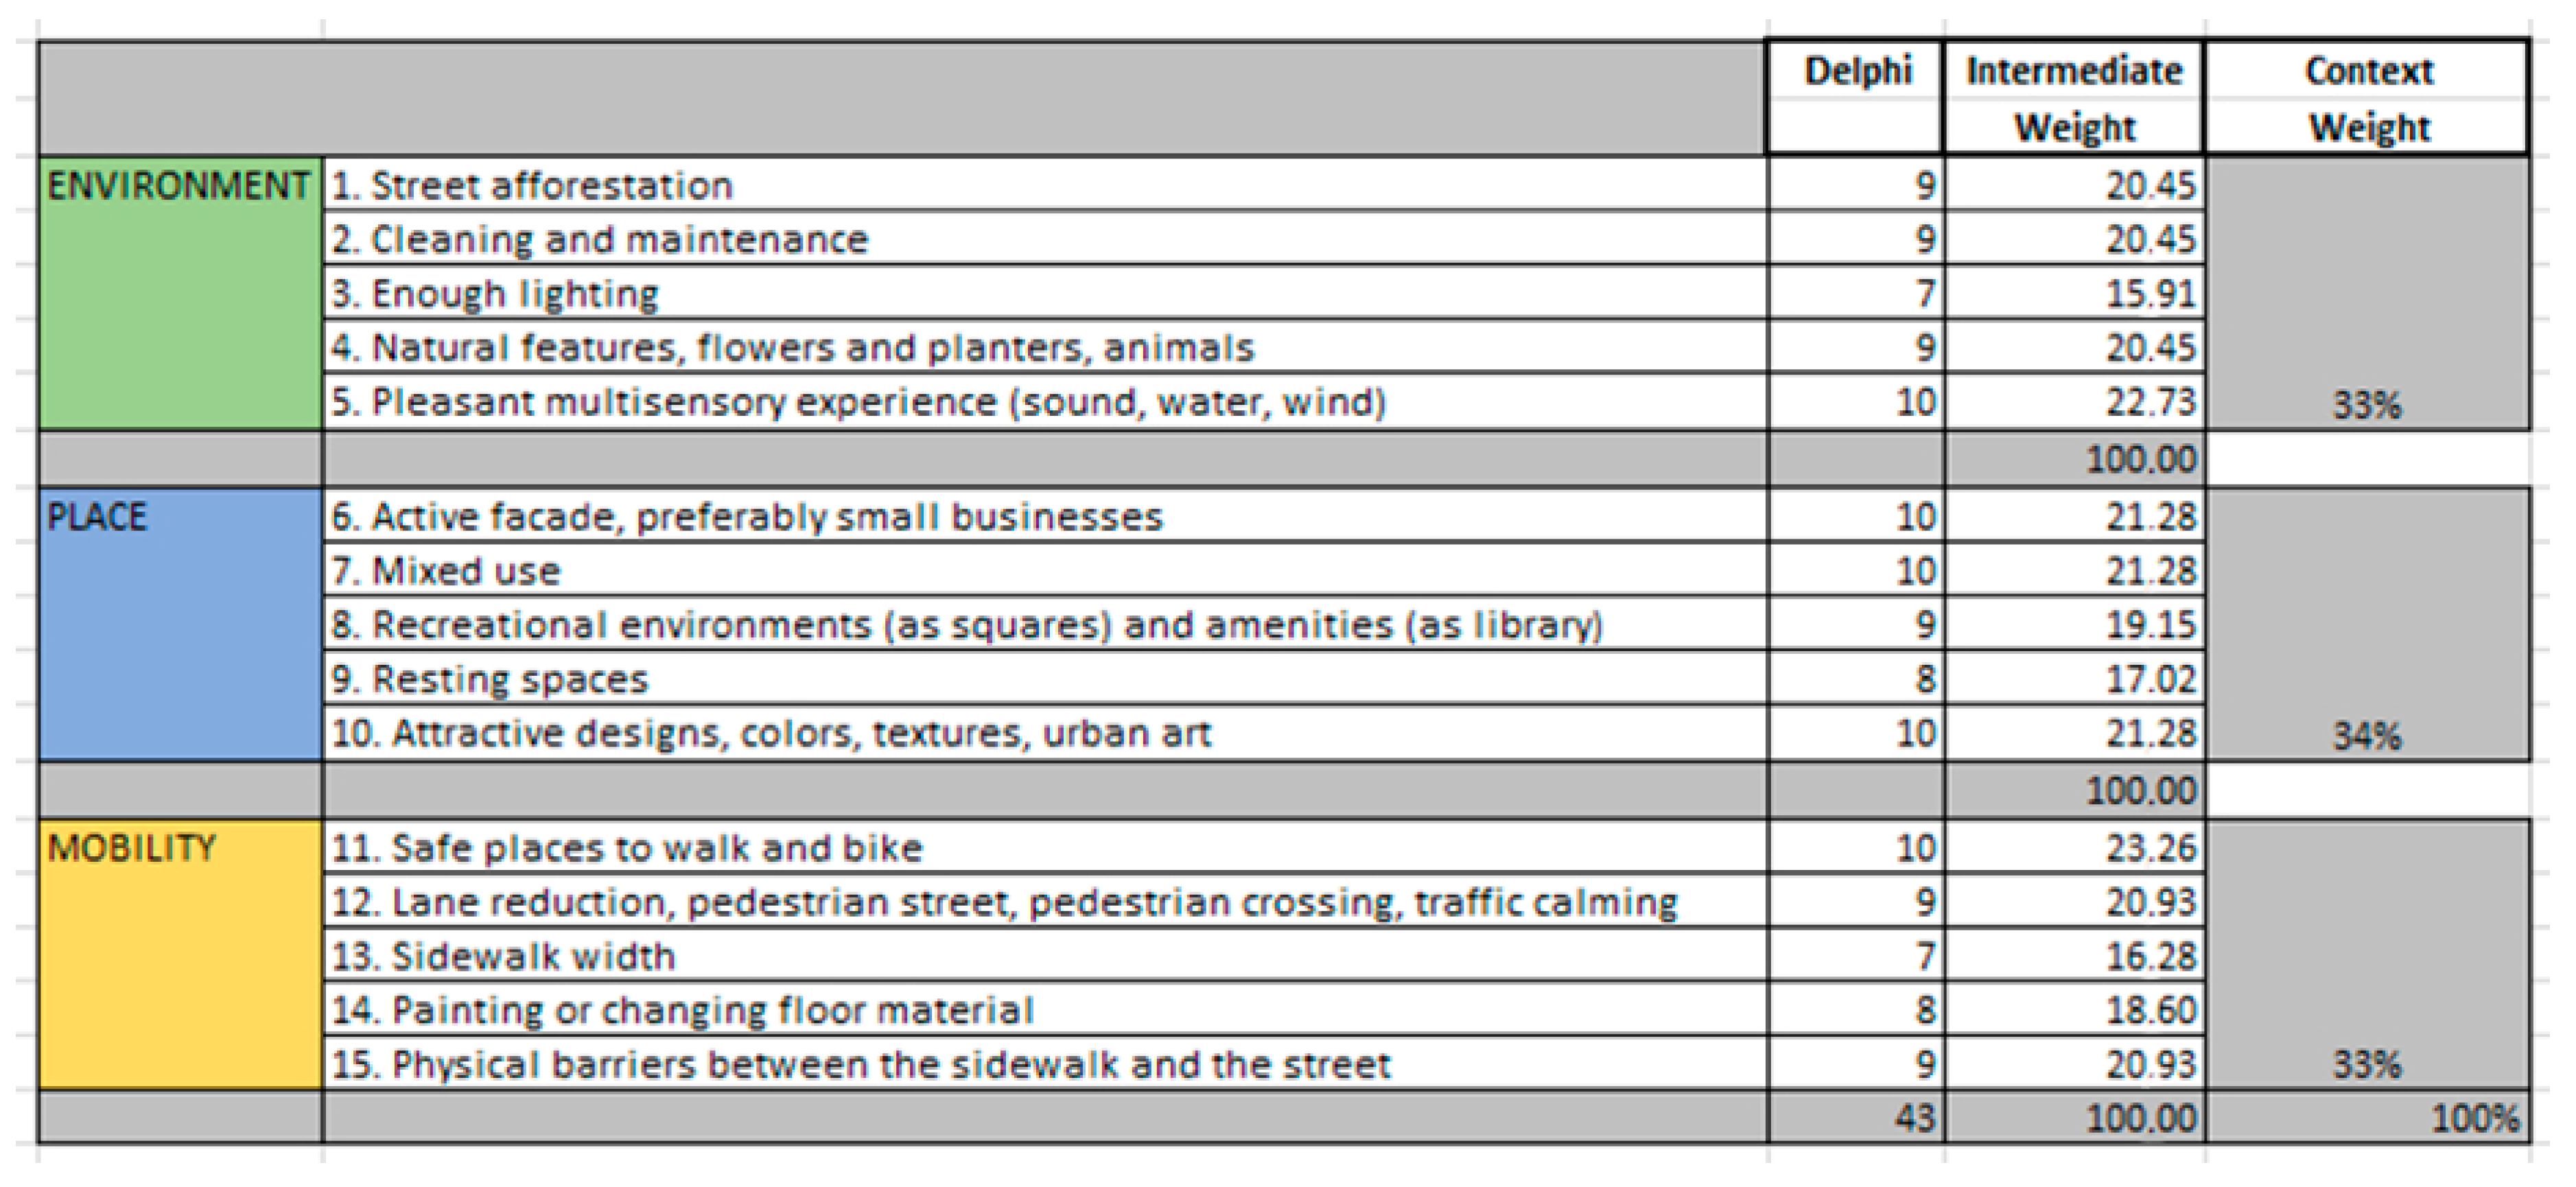
In the technical work, a Delphi query was applied, requesting the importance, on a scale from 0 to 10, for each variable. From the first answer, the average and mode of the values were calculated, so that, in a second round of consultation, each technician compared their opinion with the average values obtained and could adjust. Finally, the average of the last round was calculated, and the relative importance values of each variable were calculated, adding up to 100%. As a result, the weights for the indicators were defined according to the degree of importance for the mobility and permanence of children in urban environments (Figure 16). Multicriteria analyses by the weighted sum were constructed for the research axes of environment, place, and mobility, as well as an integration synthesis of the three approaches.
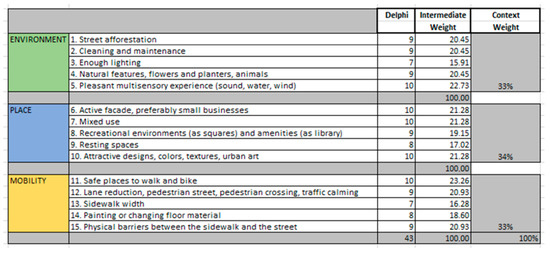
Figure 16.
Relative values associated to each indicator—the technical opinion of the adults.
4.3. Integration by the Multicriteria Analysis
The multicriteria analysis by the weighted sum aims to produce a ranking of the areas that are more suitable to less suitable for a given condition. The ranking determined the areas with the greatest potential for children’s independent mobility in the case study due to the concentration of indicators with suitable conditions that made the site qualified for children.
This was elaborated through map algebra, in which each map presented its legend normalized from 0 to 10 (from the least adequate to the most adequate), and each map was assigned a weight depending on its relative importance in the set (the sum of the map weights must be 100%).
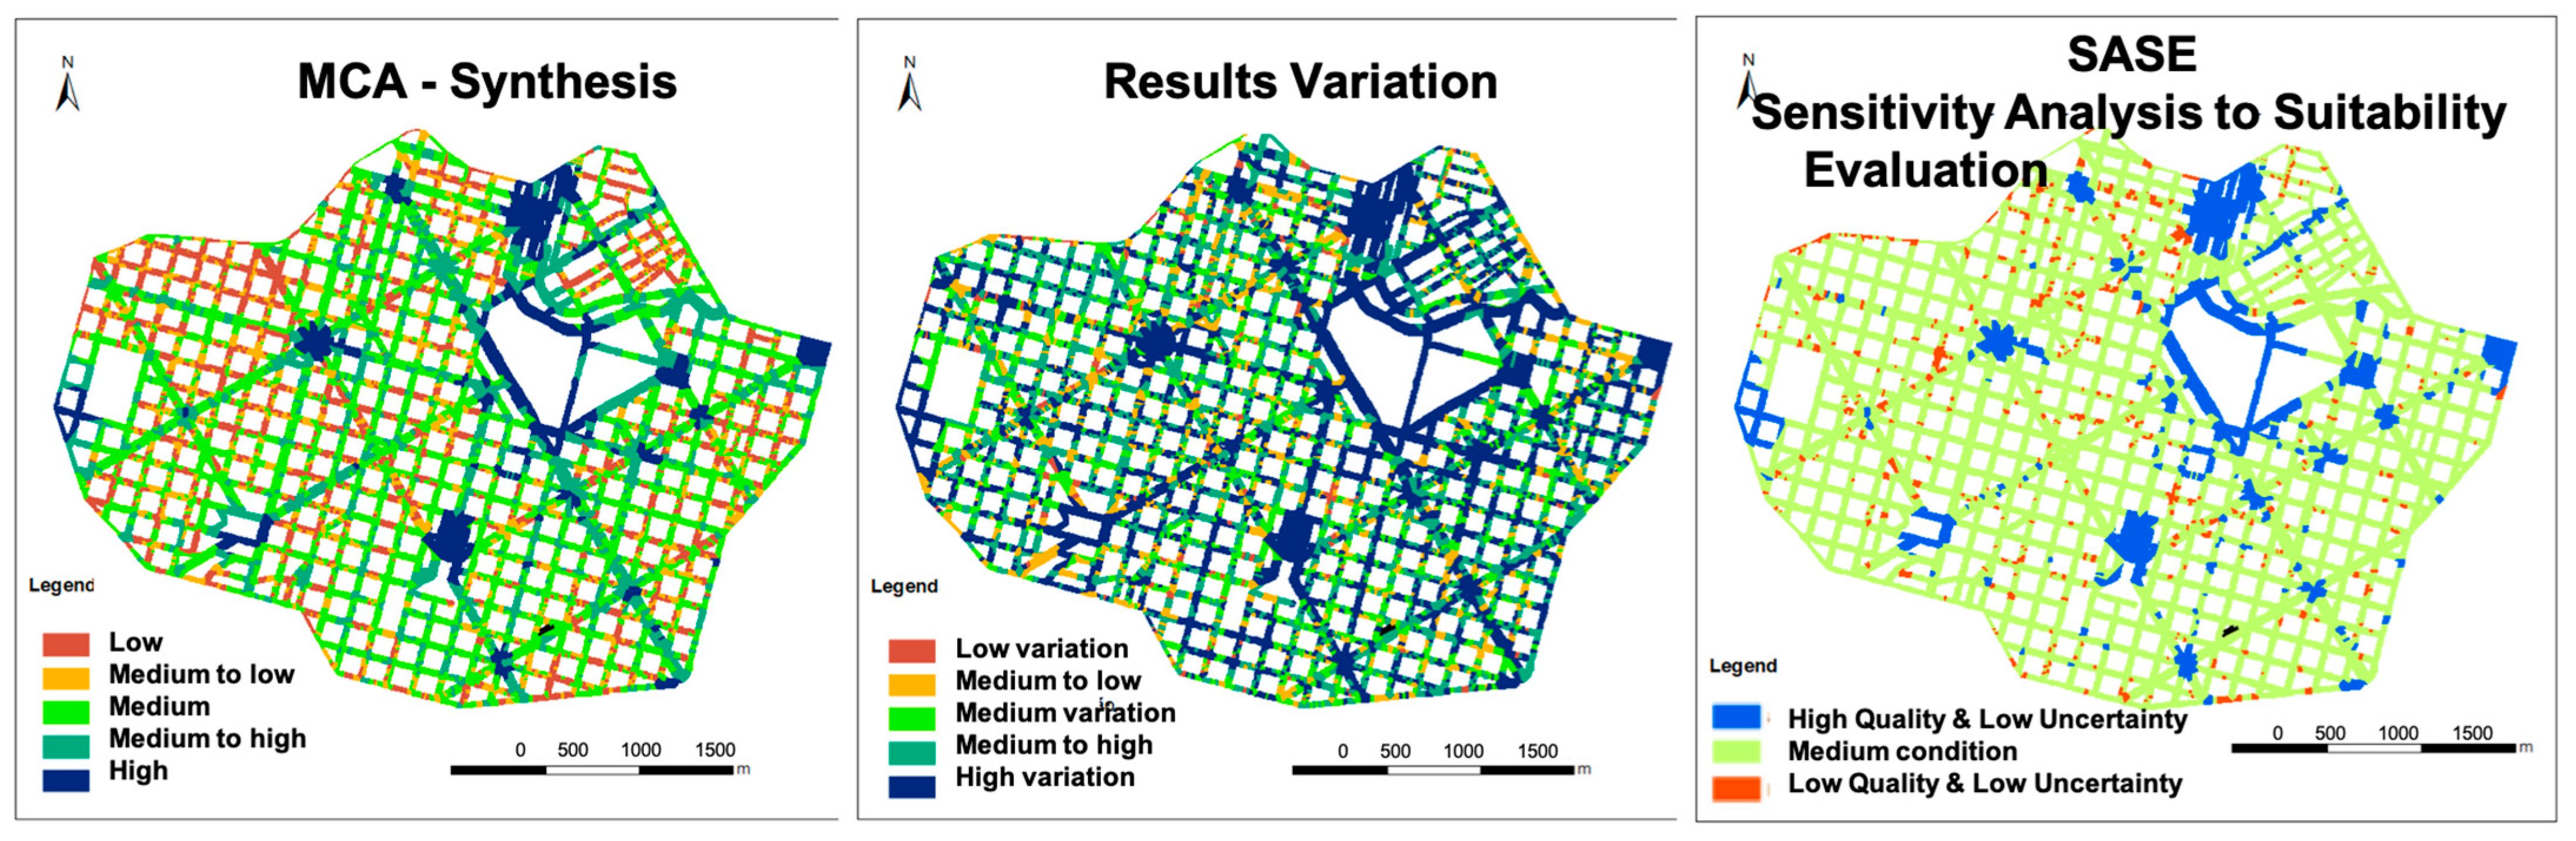
The multicriteria analysis produced maps according to the children’s values through the opinions of the VGI stages, the consultation on the hierarchy of indicators, ideas proposed in the geodesign, and the values observed in the artistic workshop. In addition to the four maps, a fifth final integration map was created (Figure 17 and Figure 18).
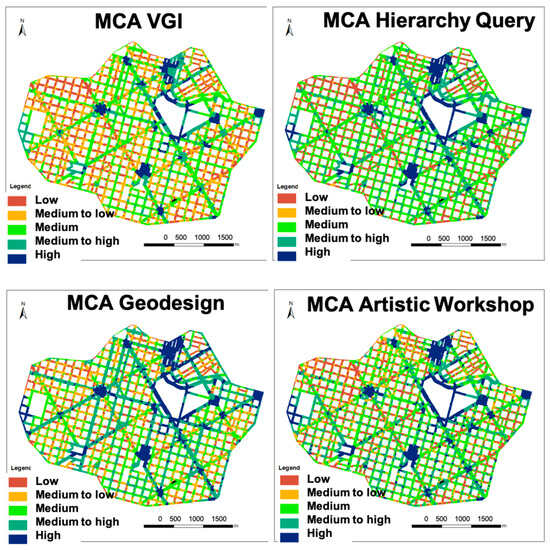
Figure 17.
Multicriteria analysis of each step.

Figure 18.
Multicriteria analysis—synthesis and evaluation of uncertainties.
It was also interesting to evaluate the level of uncertainty contained in the synthesis; for this purpose, the SASE method was used—sensitivity analysis to suitability evaluation [44]. The method aims to identify uncertainties or doubts about the result due to the greater sensitivity resulting from the changes in opinions about the importance of the integrated variables. There were identified areas where there was a very low variation in the results (defined as positive and negative and without large variations between the partial results), areas that were presented as high quality and without uncertainties, as well as medium/low or low quality and with low uncertainty (which are, in fact, positive or negative) (Figure 18).
The multicriteria analysis compositions were also carried out according to the opinion of the adults—the technical group. Initially, the five variables of each axis of the investigation of the indicators were combined, synthesizing the concentration of potentialities according to the environmental, place, and mobility contexts. Finally, the integration by the multicriteria analysis of the three approaches was carried out, placing the same weight of one-third for each (Figure 19).
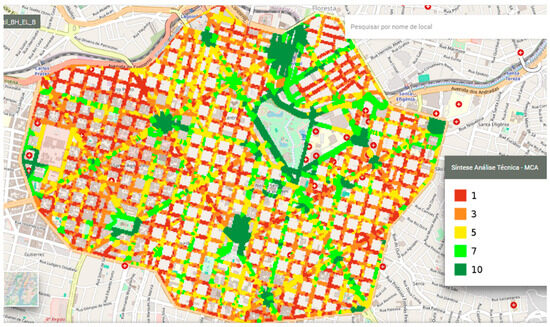
Figure 19.
Multicriteria analysis—Final synthesis.
5. Development—The Geodesign Workshop with the Technical Approach
Since all the data were prepared, composed by those collected in the field camp and the those resulting from the citizens’ listening (VGI), and once the technical maps on the characteristics, vulnerabilities, and potentialities of the study area (MCA) were prepared, all the information was organized in the GISColab geodesign project. The designed maps were structured for consultation in the form of an SDI (spatial data infrastructure), and the technical group was organized to follow the framework (Figure 20).
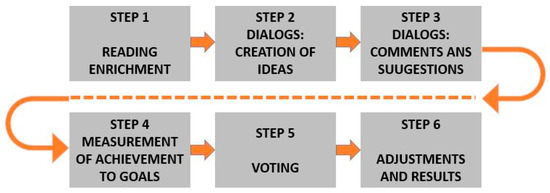
Figure 20.
Geodesign framework.
5.1. Reading Enrichment
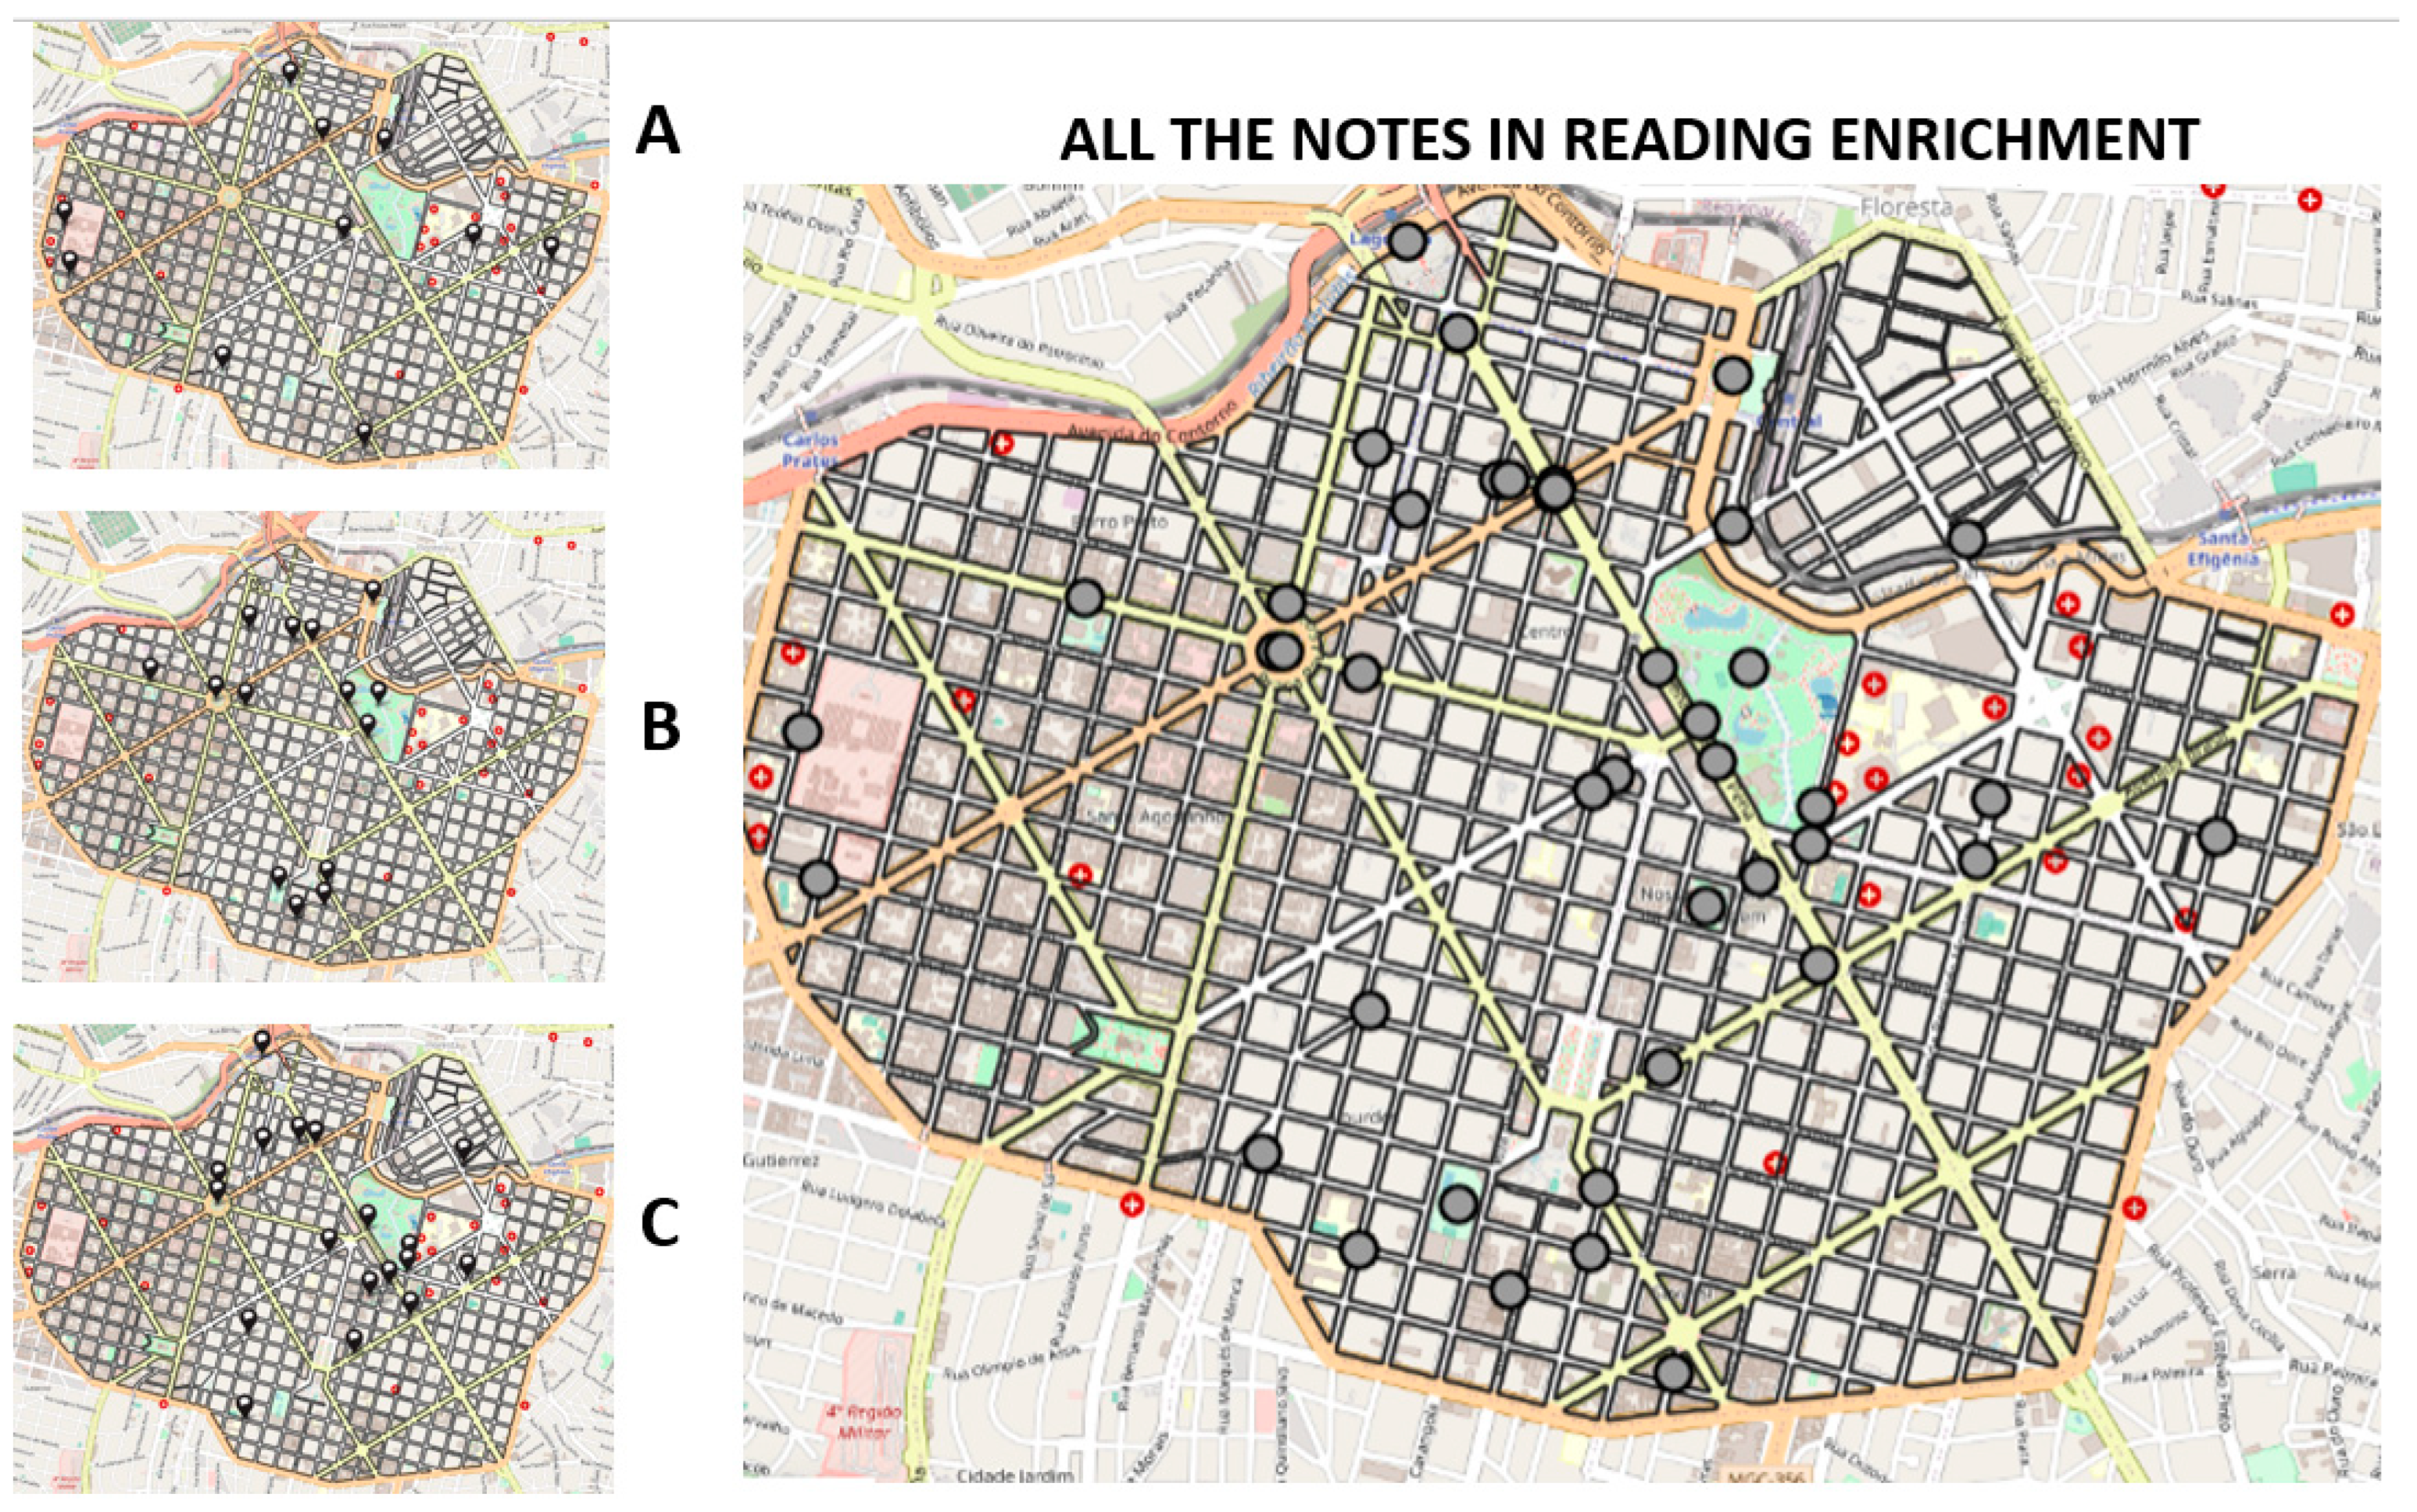
Reading enrichment is the first stage of the workshop, in which participants obtain information about the study area by collecting maps and data. They attended a lecture on the state-of-the-art of children’s independent mobility, its importance, and contemporary challenges. Afterwards, they analyzed the maps, performing overlaps and combinations, and registered points about alerts, complementary information, and the notes they considered necessary for the workshop. They worked separately in three groups, but the notes were later added to all contexts (Figure 21).
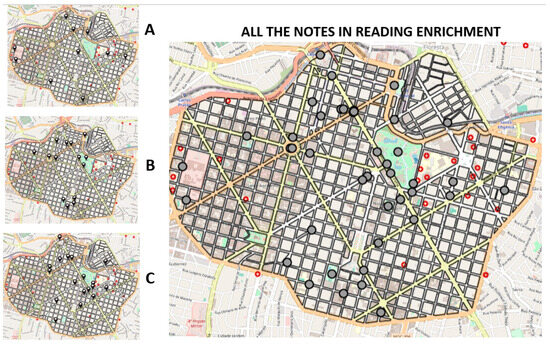
Figure 21.
The reading enrichment step—in groups and all annotations. Pins placed by groups A, B and C, and all the points presented together.
5.2. Brainstorming Dialogues, Feedback, and Goal Checking
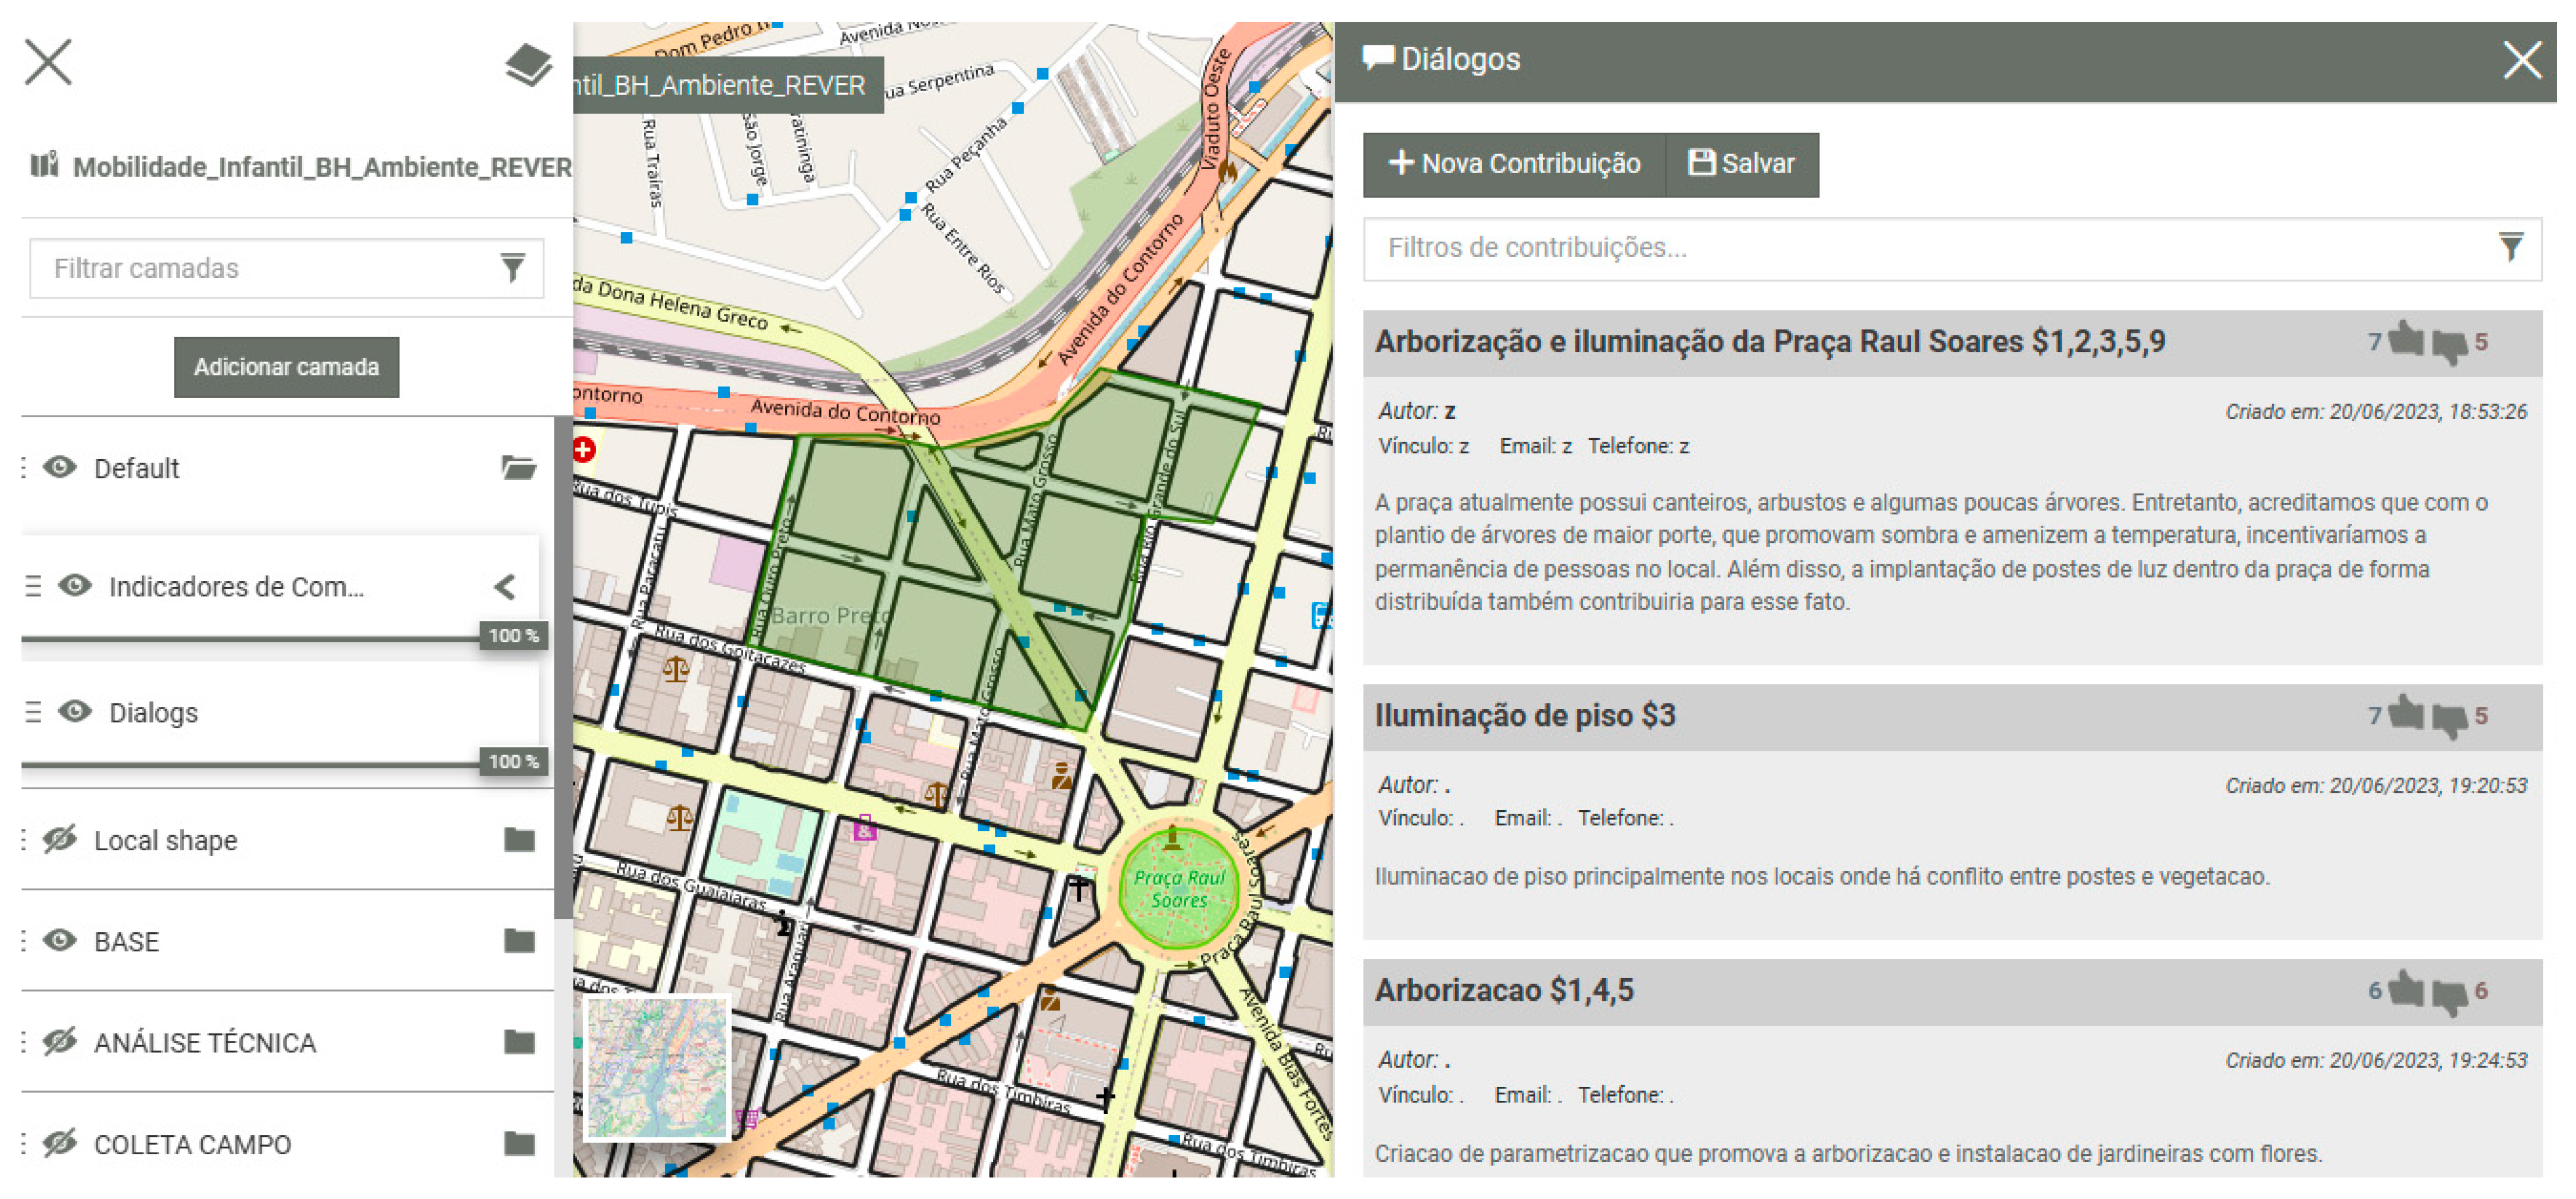
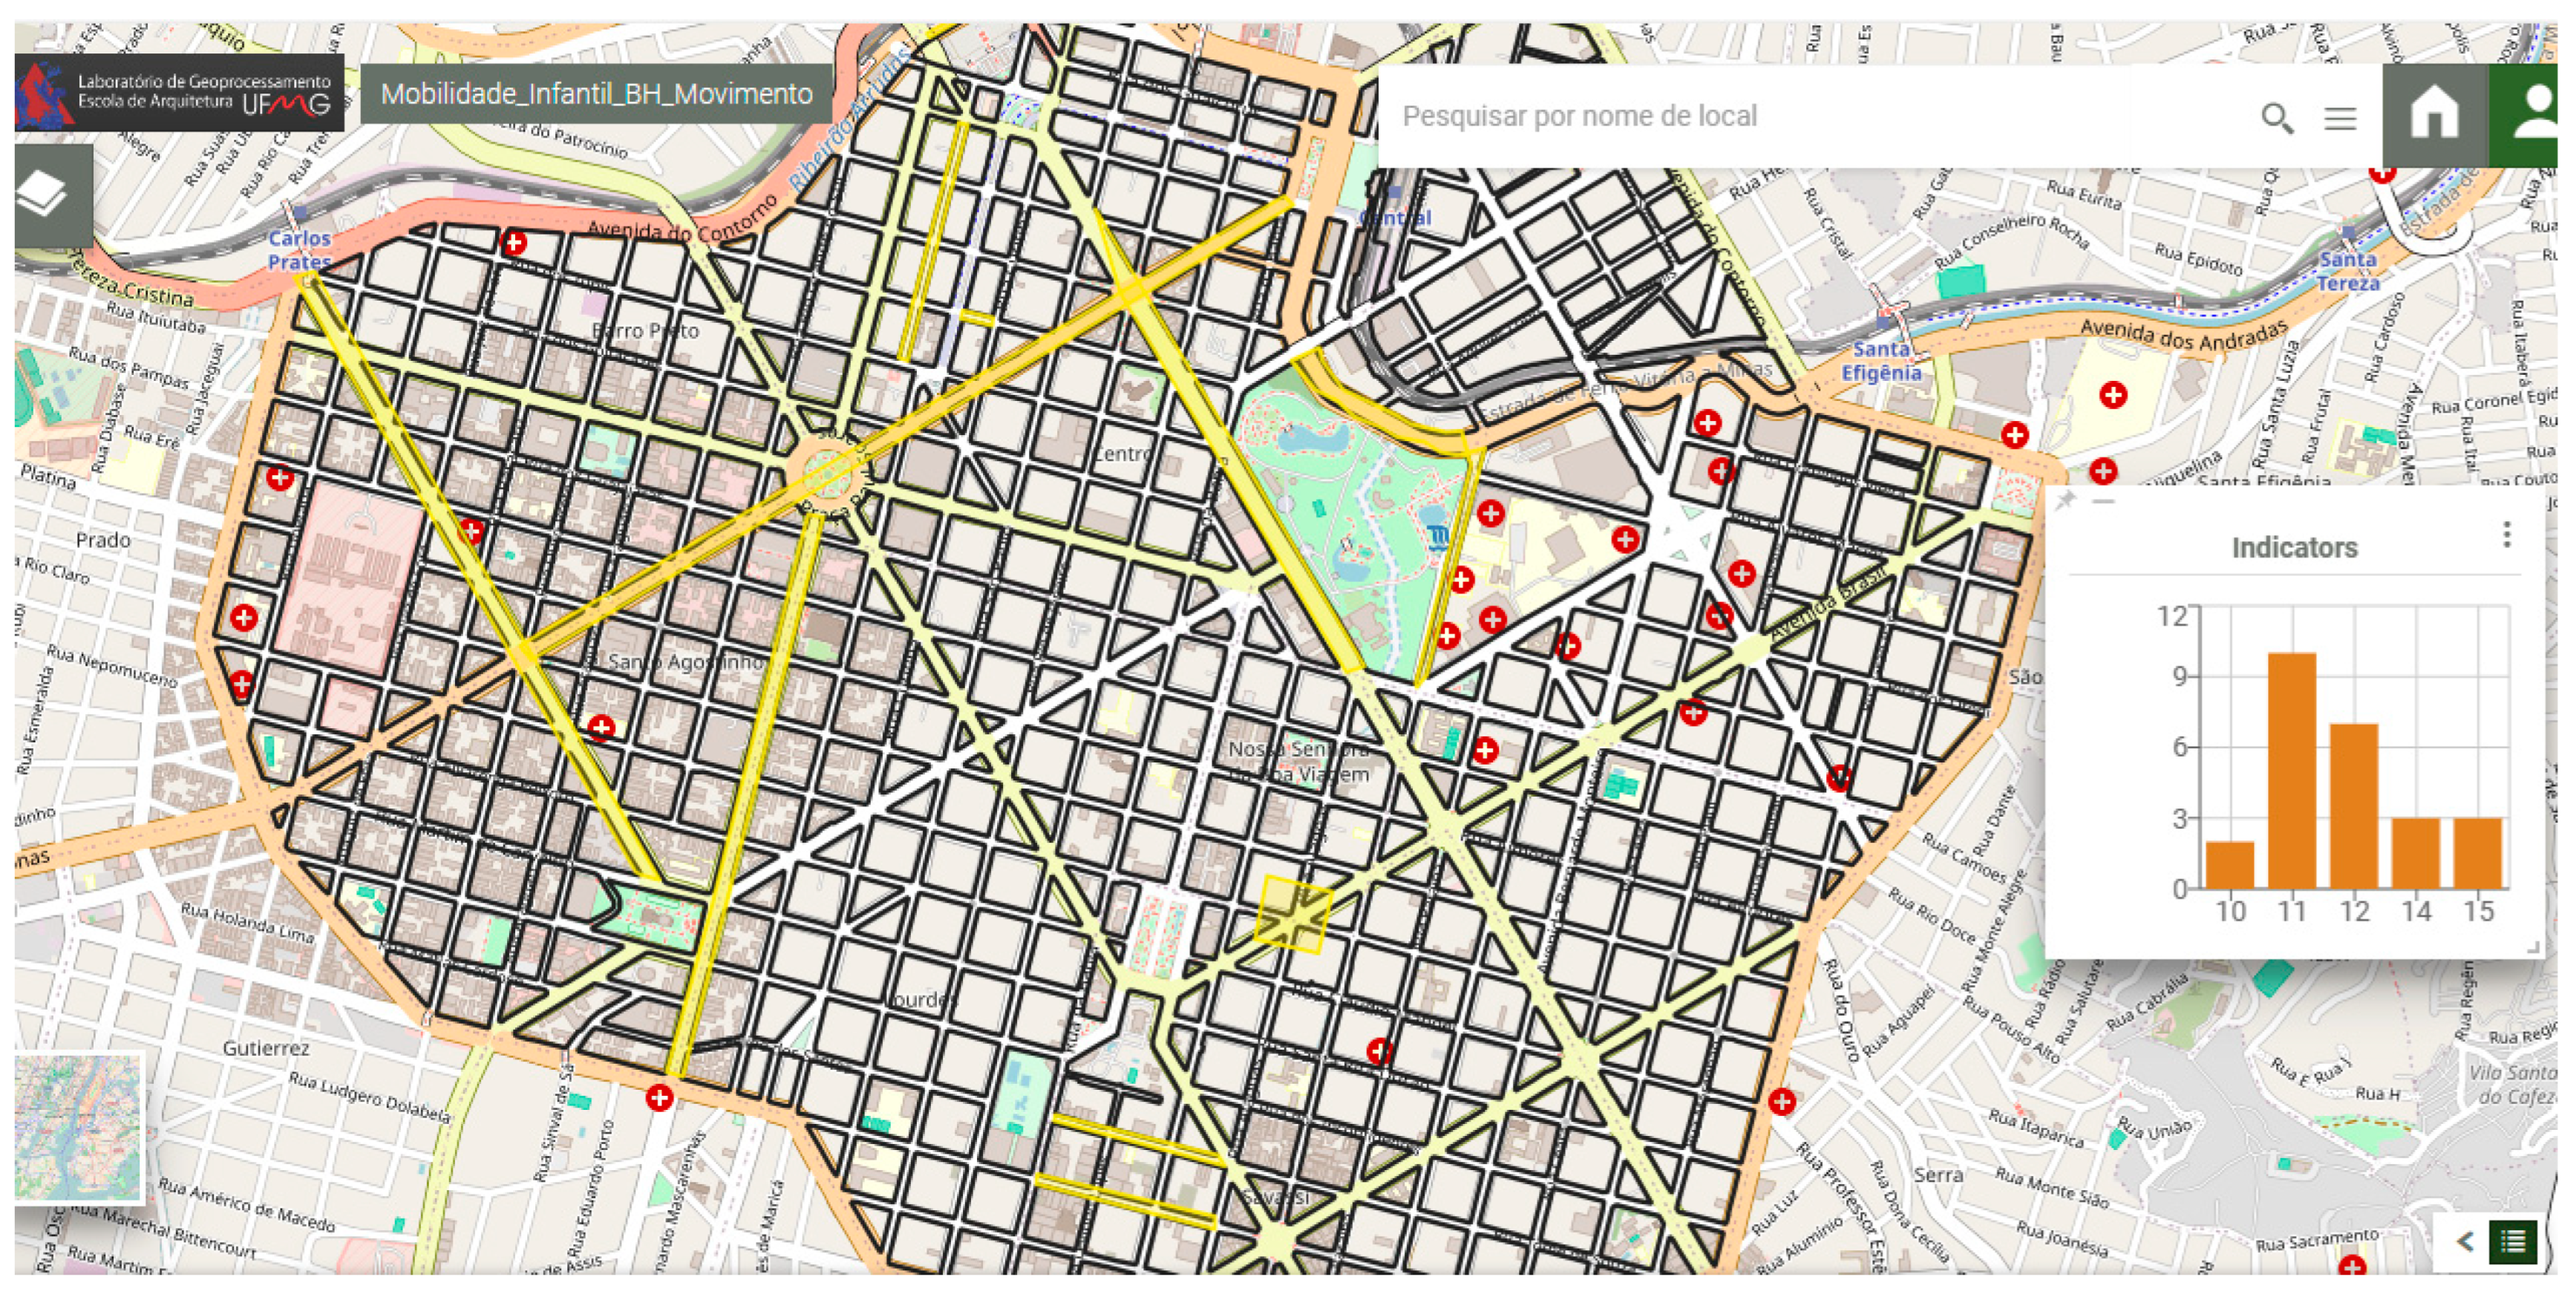
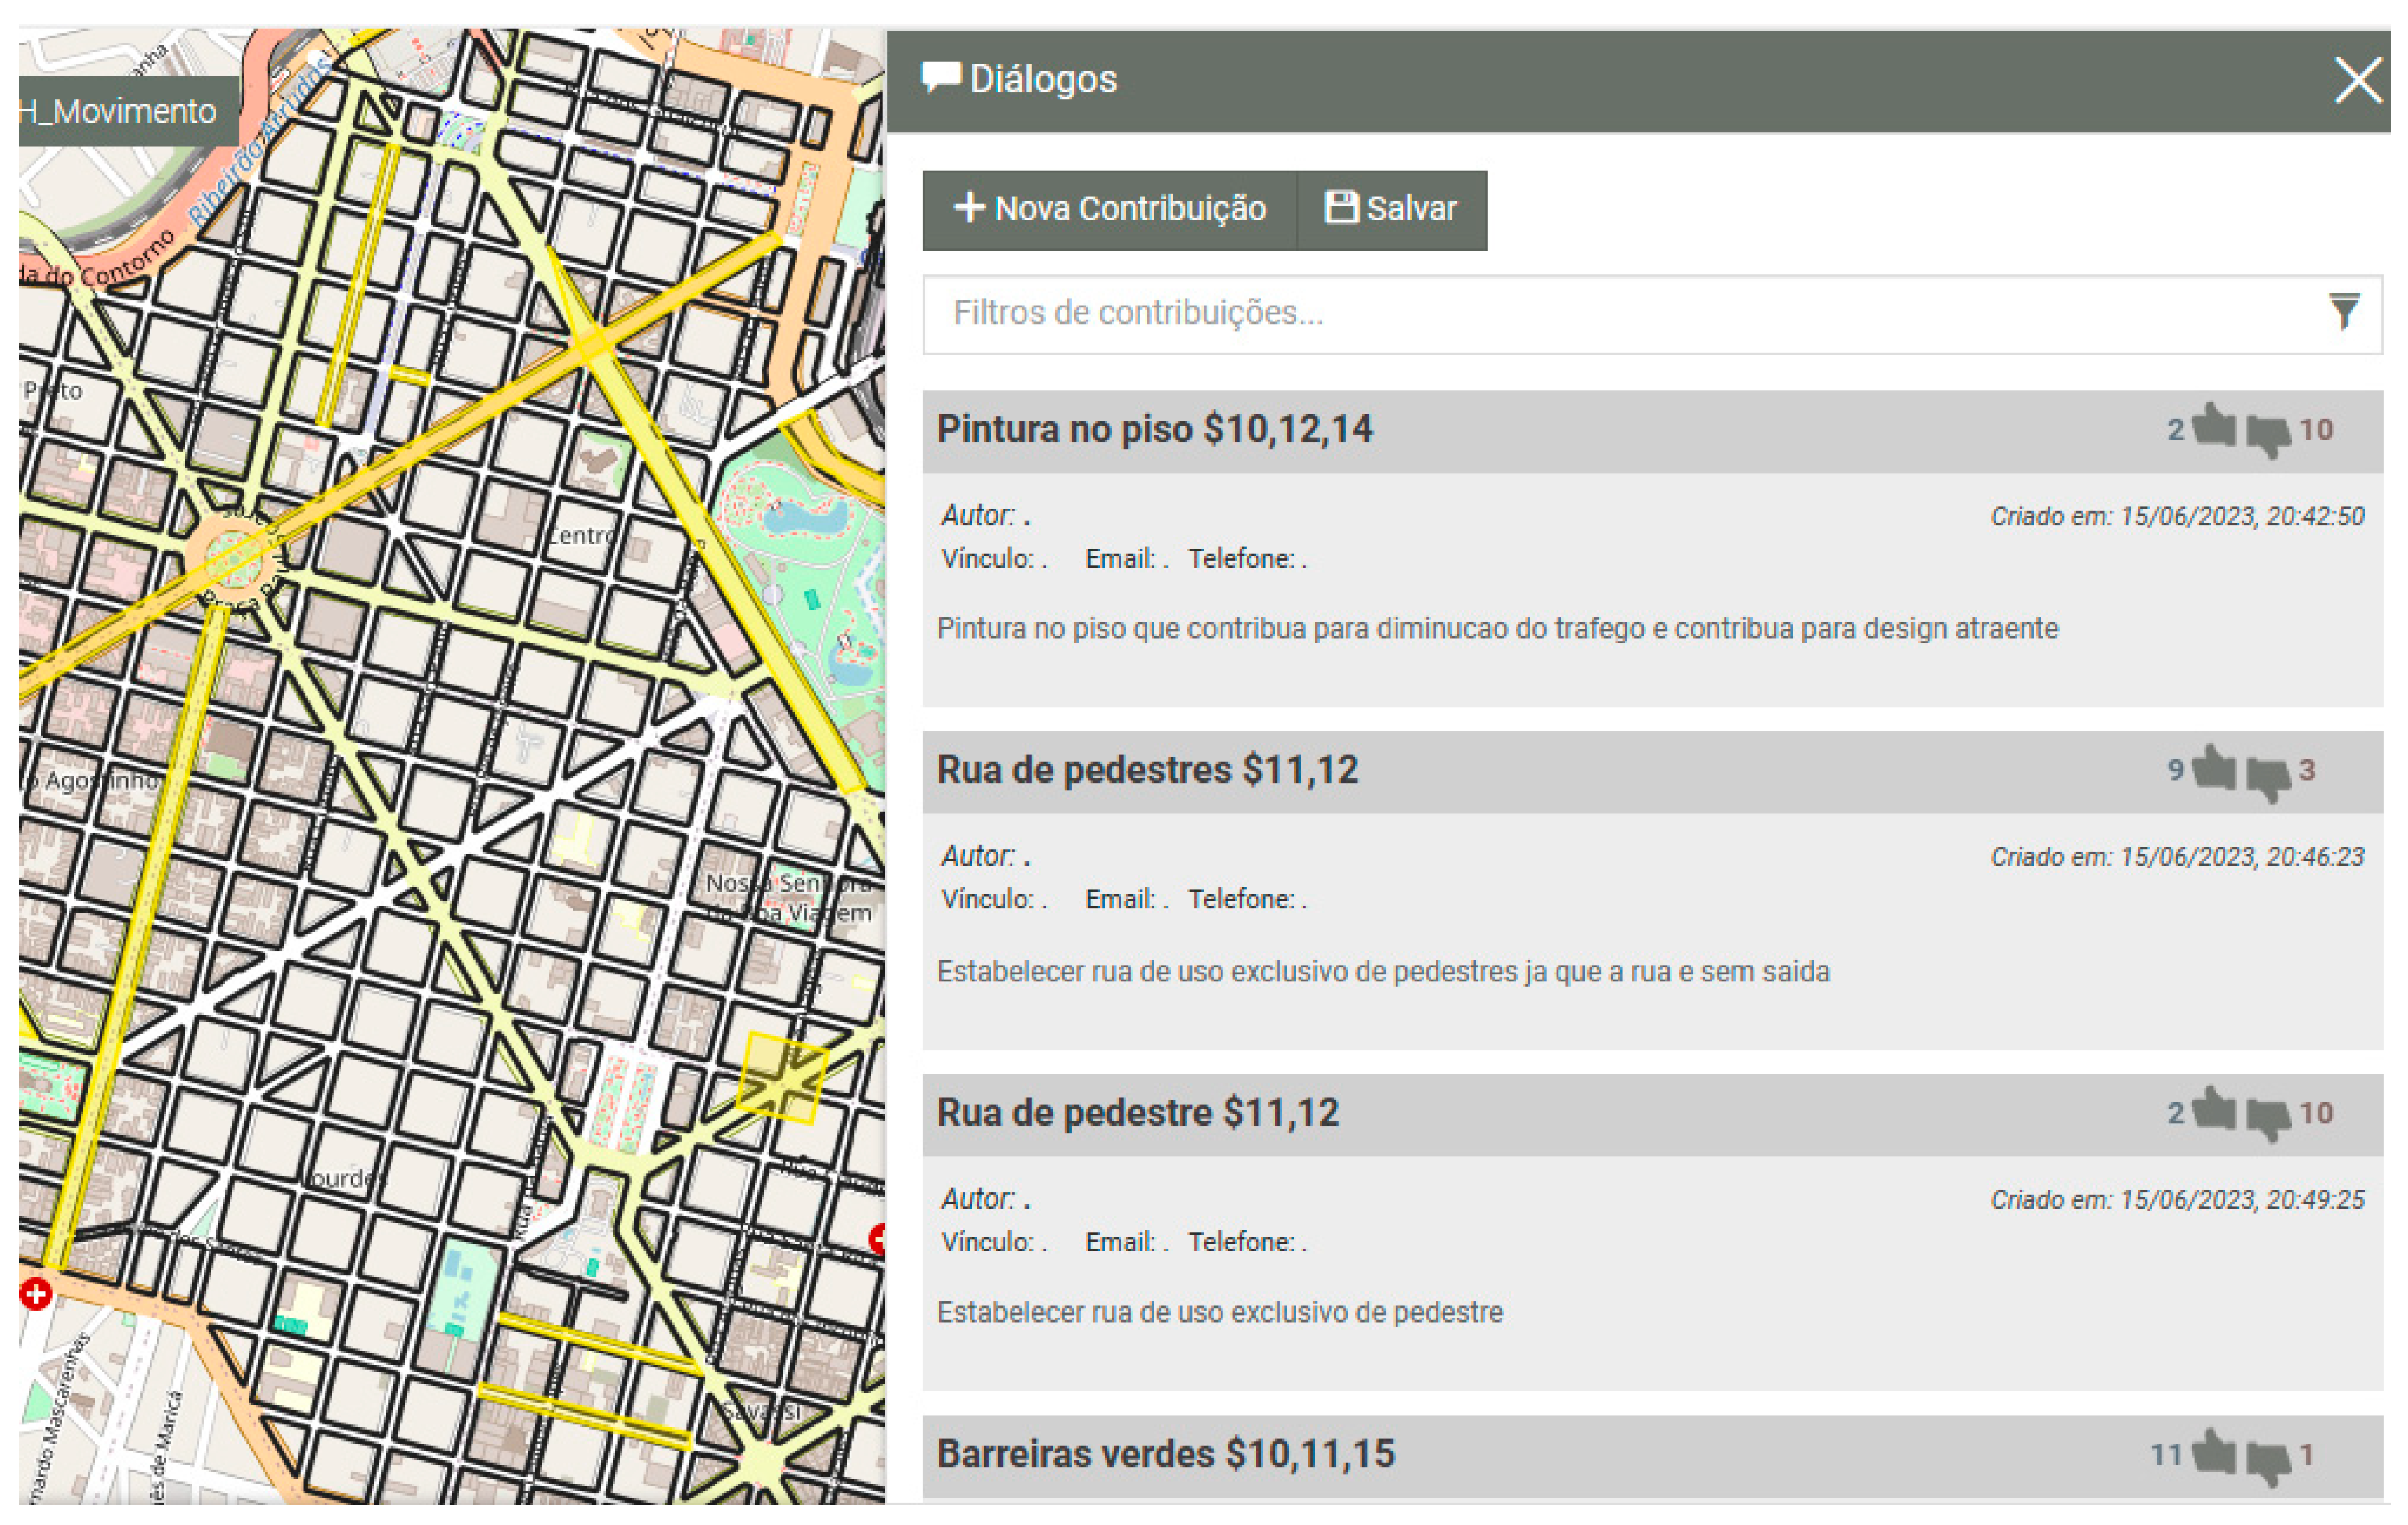
The second step consisted of creating ideas for the area. The participants, still separated into three groups, developed ideas for the contexts of environment, place, and mobility. All groups created ideas for the three research axes in a changing context cycle. The views were recorded as points, lines, or polygons, and contained a title associating to which completeness indicators they could contribute, which also had a description. In the following example, the first idea, “Lighting on Av. Afonso Pena”, contributed to indicators 3, 5, and 11 (sufficient lighting; pleasant multisensory experience; a safe place to walk and cycle) (Figure 22).
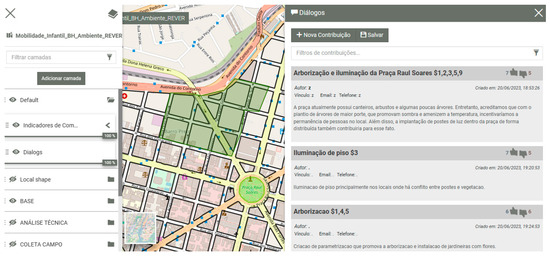
Figure 22.
Dialogues for creating ideas, associated with the indicators, and the list of comments.
In the third step, the participants, once again working in a cycle and going through all the contexts, commented on all the ideas. These comments could be criticisms, suggestions of adjustments, or questions which favored the decision as a support to the voting (Figure 22).
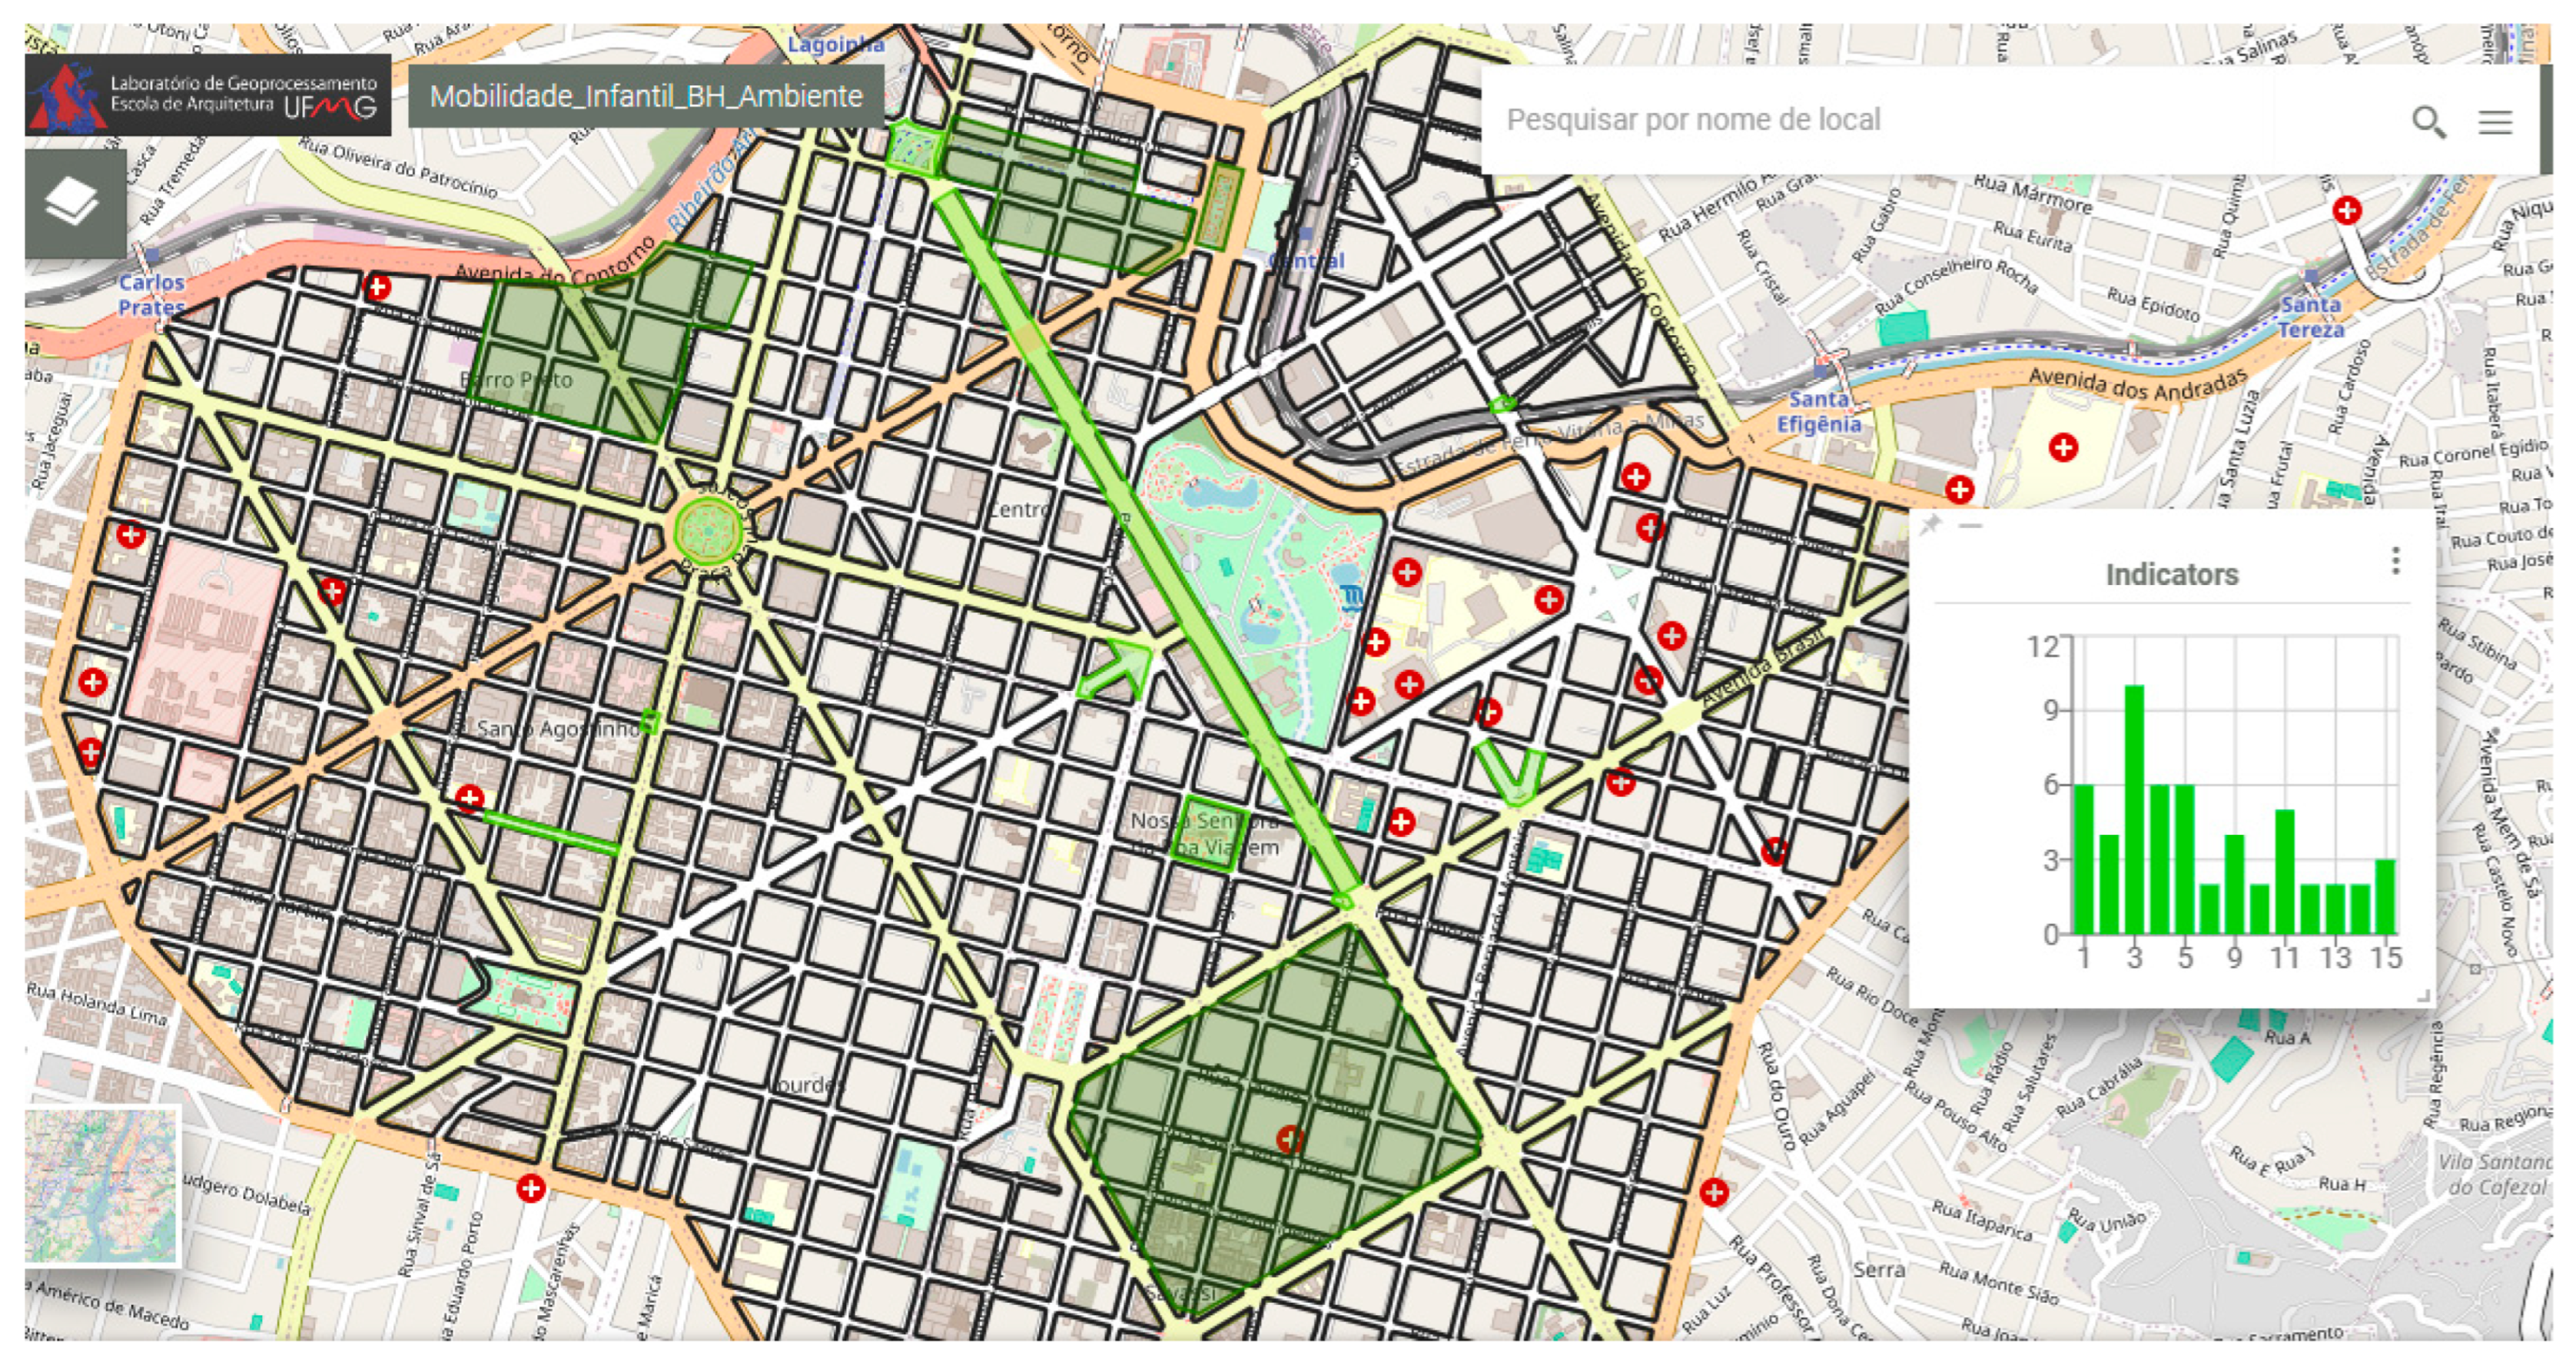
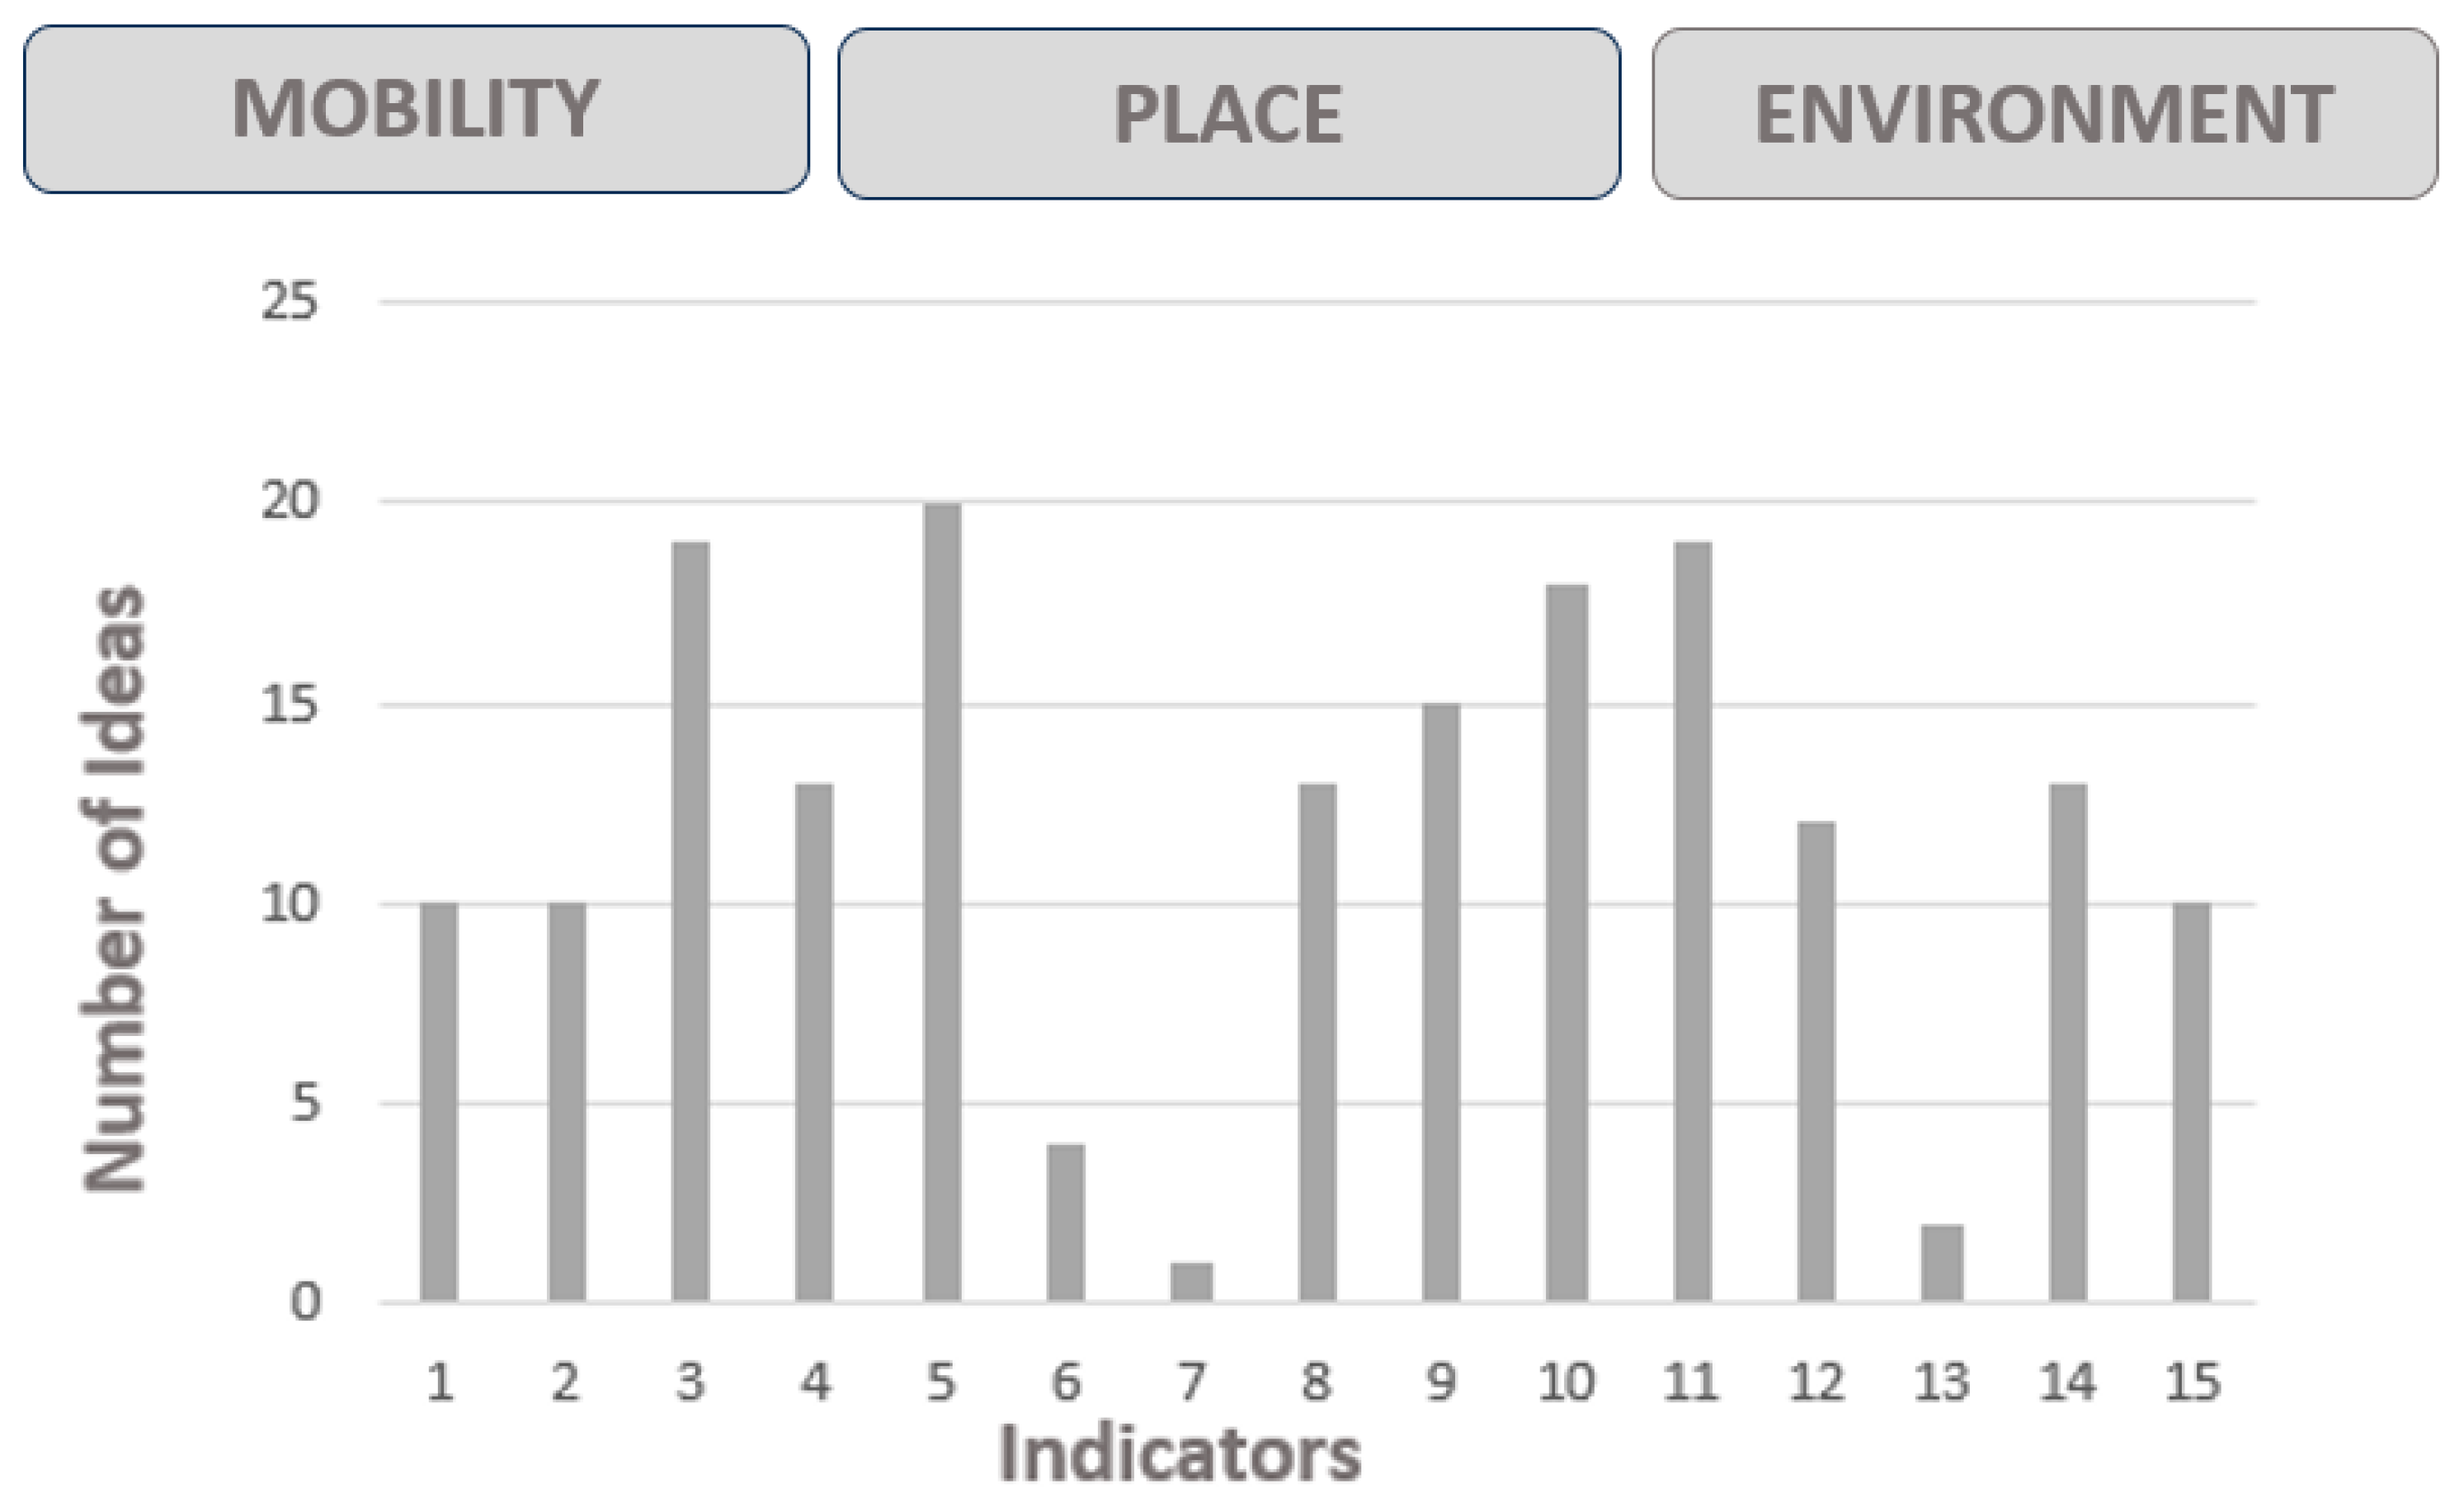
As the ideas were being created, a widget displayed the histogram of the distribution of the number of ideas associated with the completeness indicators. The widget results from the application’s ability to work with the WPS (web processing service) feature, a dynamic mapping layer that updates the results as new records are saved. With this, it is possible to verify the fulfilment of established goals (Figure 23, Figure 24 and Figure 25). Finally, a summary of the sum of the contemplated indicators is presented in a general histogram so that, in the proposal review stage, the participants can try to adjust the lack of the inclusion of some of the expected values, such as, in the example, the fact that they did not pay much attention to indicators 7, 13, and 6 (mixed-use; favorable sidewalk width; active façade, preferably with small businesses) (Figure 26).

Figure 23.
Ideation dialogs, goals check widget—“Environment” context. Histogram using the color green due to environment context.
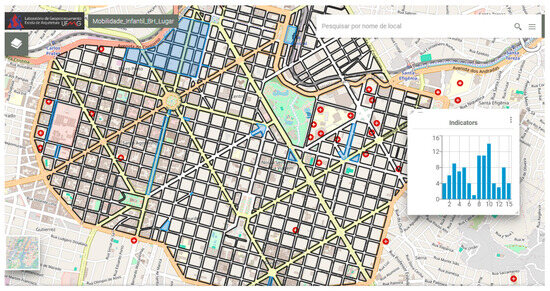
Figure 24.
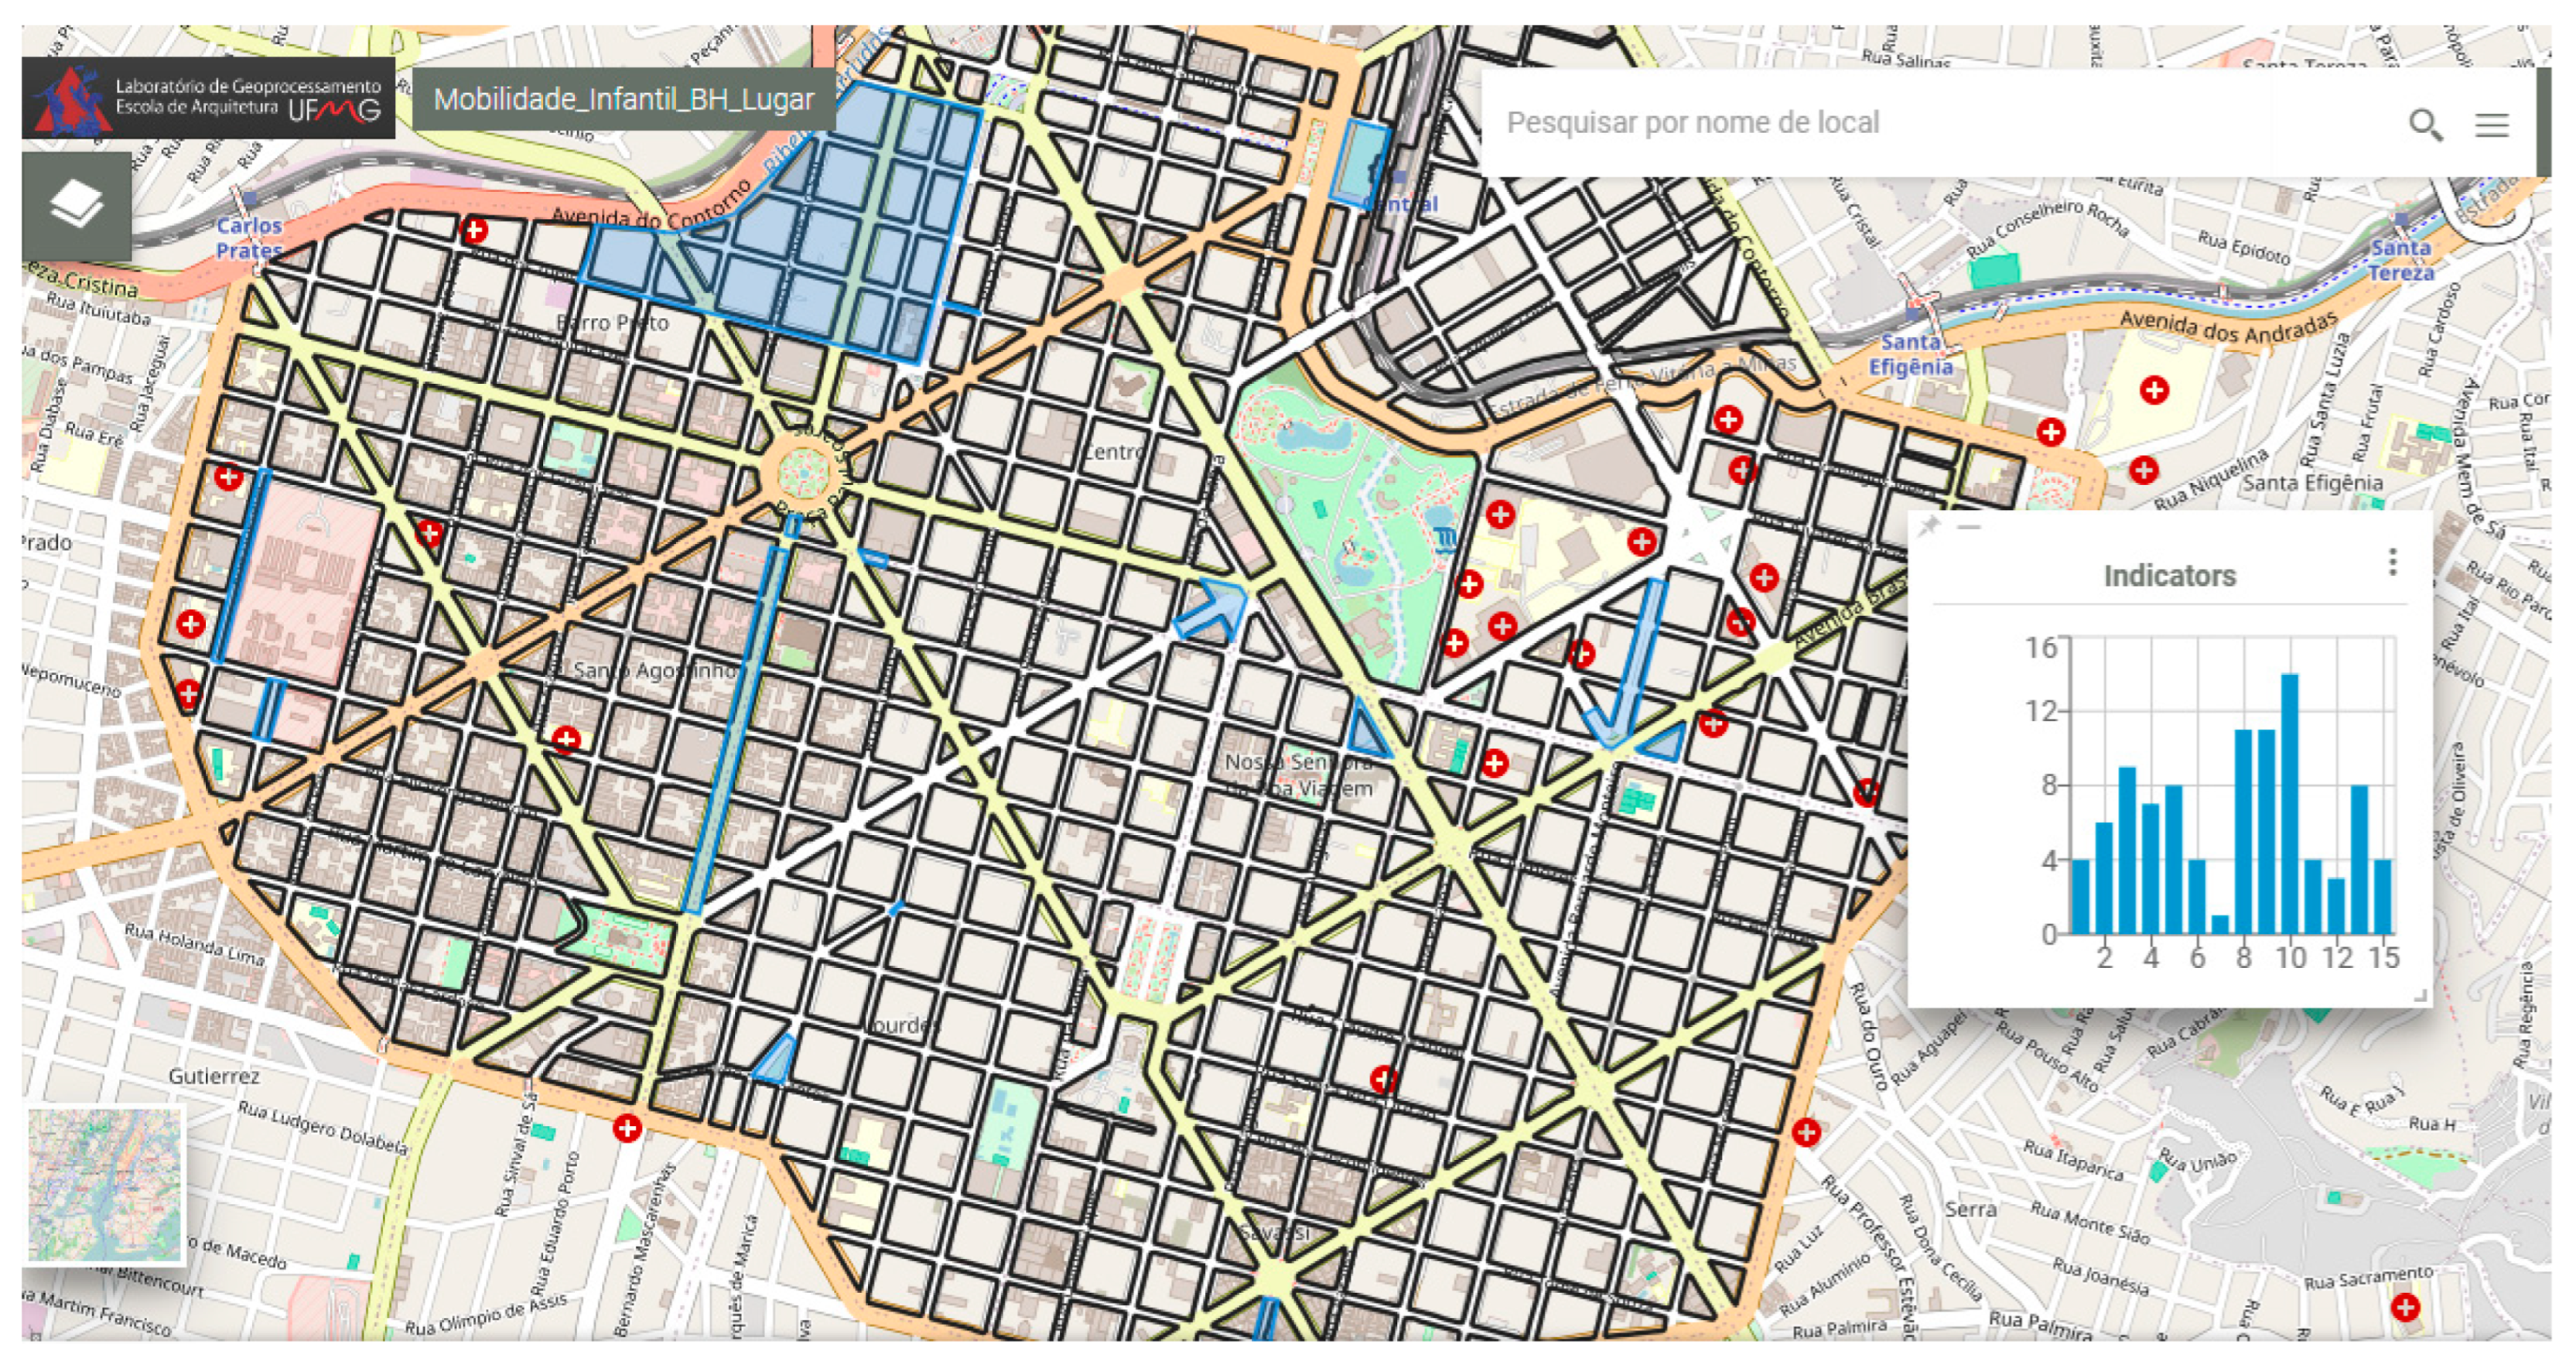
Idea-creation dialogs, goals check widget—“Place” context. Histogram using the color blue due to place context.
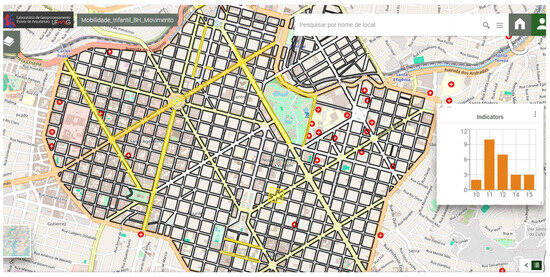
Figure 25.
Idea-creation dialogs, goals check widget—“Mobility” context. Histogram using the color yellow/orange due to mobility context.
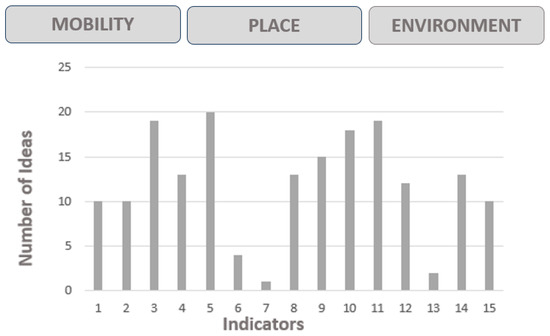
Figure 26.
General distribution histogram of the ideas associated with the completeness indicators.
5.3. Voting, a New Round of Adjustments, and Decision
After preparing the comments for all the proposals and verifying the achievement of the goals, the participants voted for “like” and “dislike”. The work took place in groups, and the discussions and ideas were formed by cocreation, but the vote was individual. The votes of each participant were recorded for each idea and context (Figure 27).
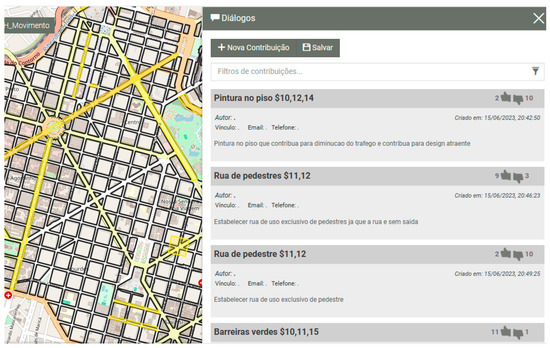
Figure 27.
Voting.
Ideas that had more positive than negative votes were considered accepted, those that had more negative than positive votes were rejected, and those that had votes close to an equilibrium, whose difference between “like” and “dislike” was slight, were separated into a new round of discussion, adjustments, and voting. Finally, after the second vote, the final design was reached through a shared decision process (Figure 28).
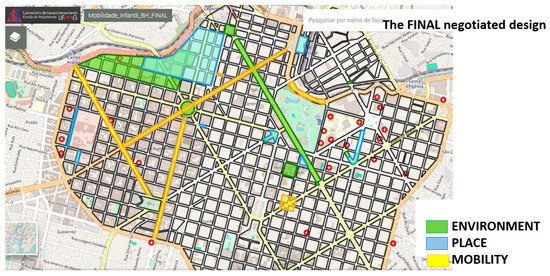
Figure 28.
Final design.
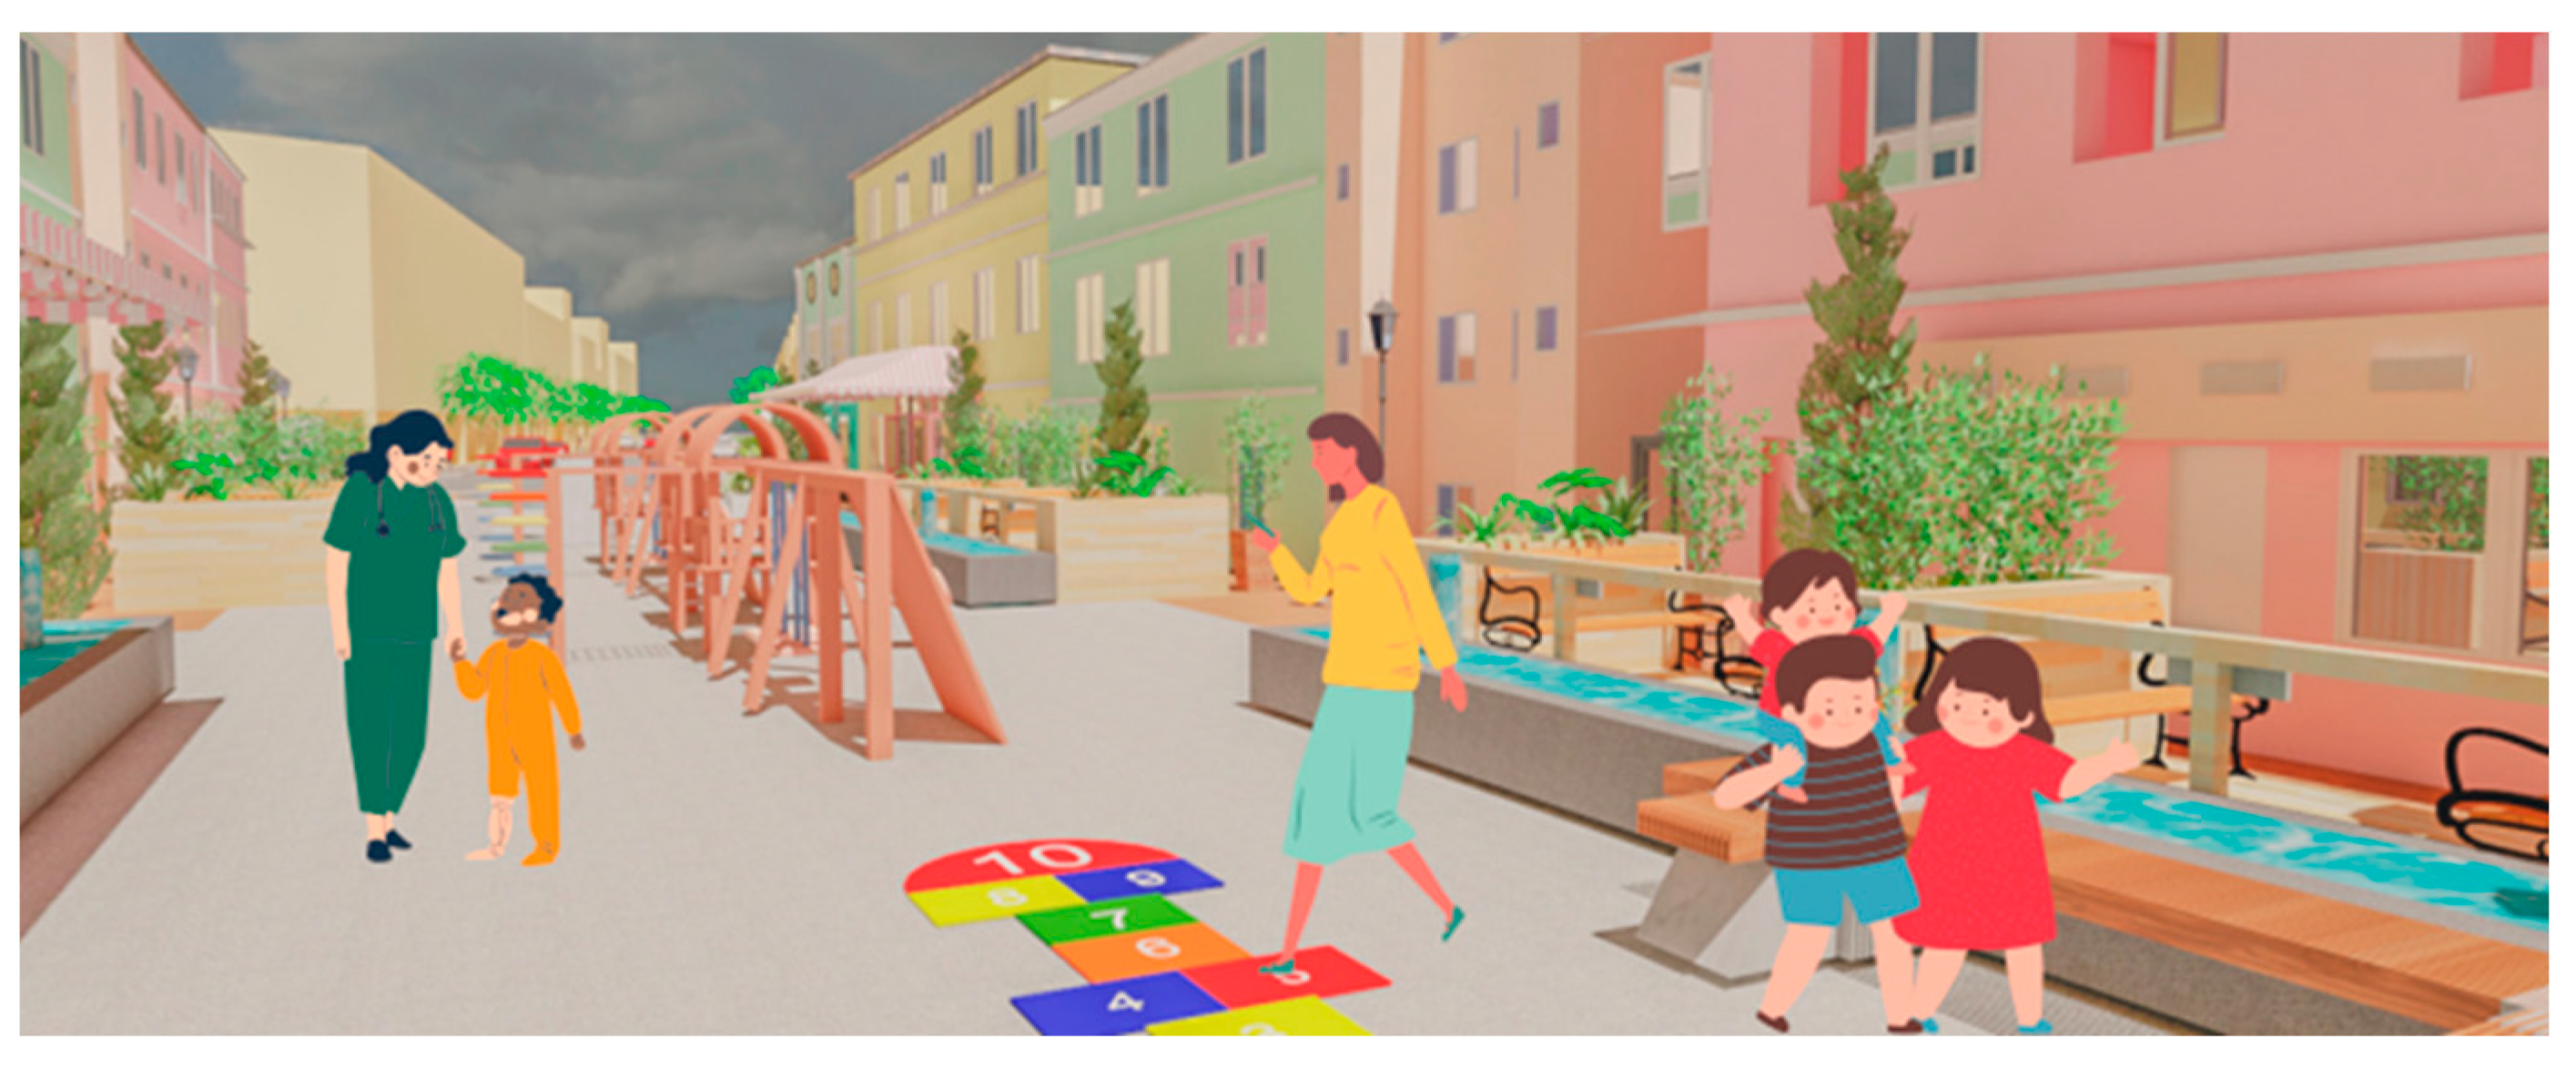
As a result from the Geodesign workshop, it was produced a a final design. The ideas were created and negotiated collectively, a product of a shared process and through citizen listening, could then be developed and detailed through an authorial process. In this way, the decision on the “what”, “where”, and “why” was the result of a shared process and a balance between a technical approach and citizen listening, but the decisions on “how” were an authorial proposal by the technicians (Figure 29, Figure 30 and Figure 31).
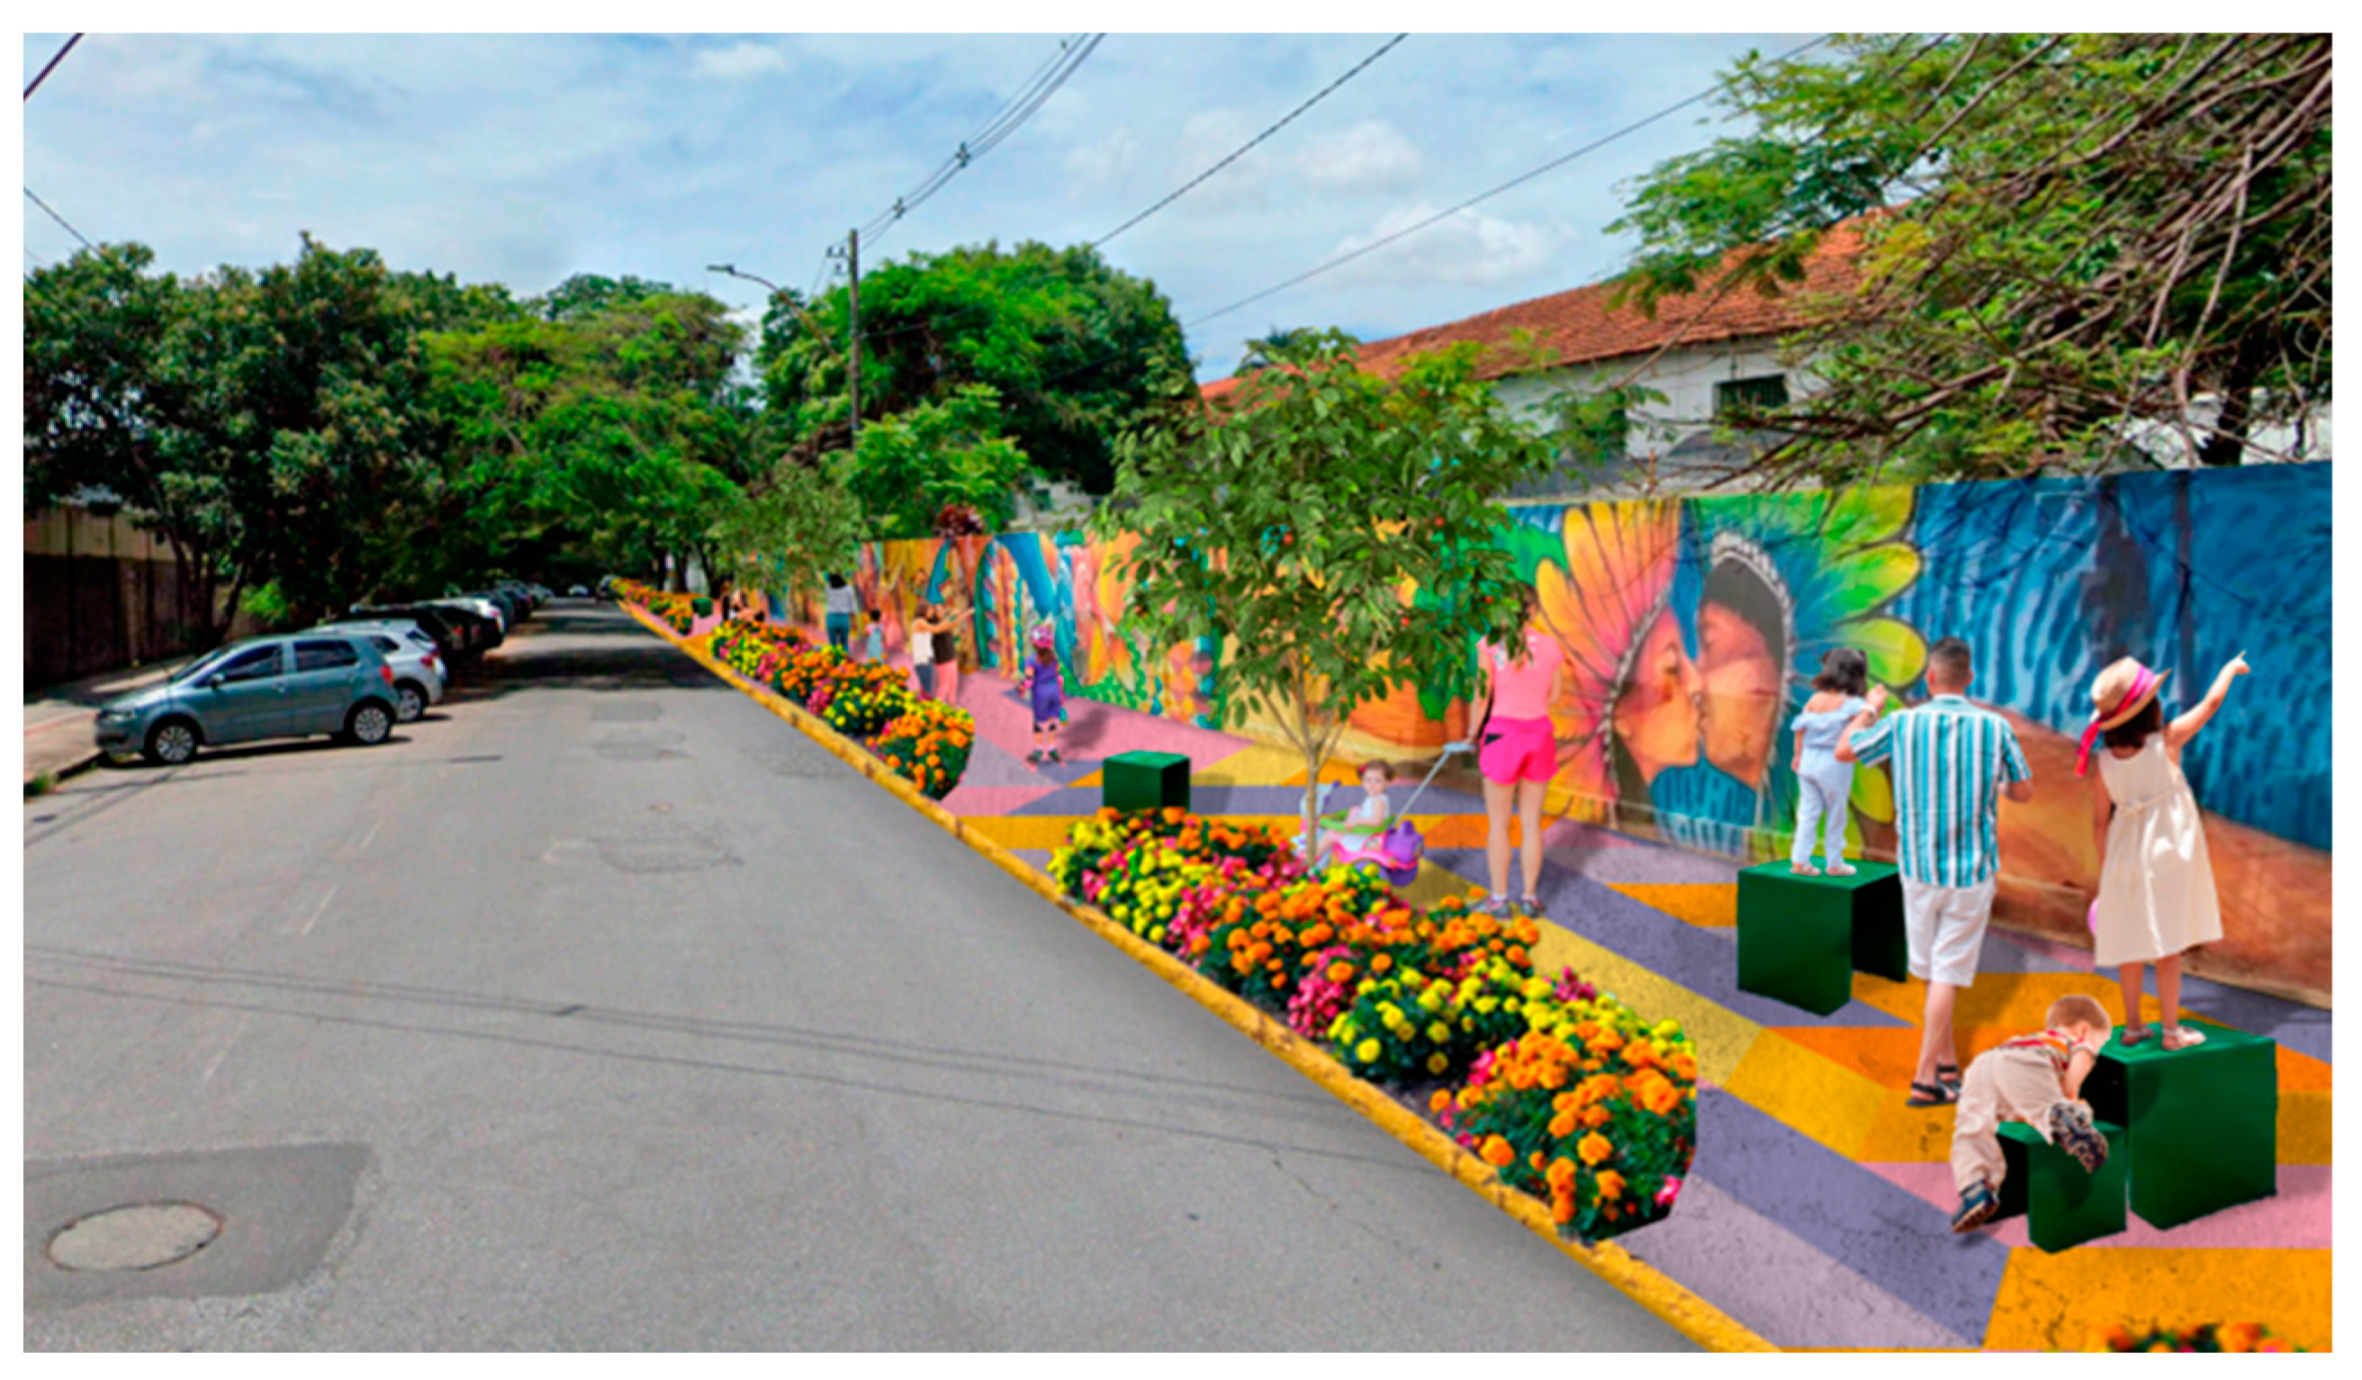
Figure 29.
Example of an authorial urban design—urban road requalification.

Figure 30.
Example of an authorial urban design—urban art.
Figure 31.
Example of an authorial urban parameterization—tree planting on the sidewalks.
6. Final Considerations and Conclusions
As the literature review already indicated, children make up the iGeneration, born in the digital environment and, above all, in the web-based environment. With this, the ease of use and involvement with digital-based activities was proven, as well as the broad interest in participating in the tasks, as Prensky had already predicted [11].
The methodology added a set of digital geotechnology tools, confirming Xavier-da-Silva’s [7] statements about the potential of geoinformation technologies, that every phenomenon can be dimensioned and located, and which does not occur in isolation. Data were prepared with a technical approach that characterized the study area and the theme, selecting the main variables that indicated whether urban areas were suitable for the promotion of children’s active travel in the city.
Notably, the list of variables chosen for the characterization and analysis of the study area, which followed Gehl’s guidelines [31,32], was assertive, resulting in the understanding of the potentialities and vulnerabilities. The variables were used as a reference to guide the discussions and qualify the participation, confirming the indications by Ikeda et al. [17], Danenberg, Doumpa, Karssenberg [18], and other authors who supported the choice [14,15,16,17,18,19,20,21,22,23,24,25,26,27,28].
The digital tools chosen for the application were based on citizen listening, collected according to the opinions of the children and adults. The VGI resources were sufficiently adequate for recording and characterizing the opinions and collecting data in the field, confirming Goodchild’s approach [8].
All technical mappings and those captured by voluntary contribution were organized to form the geodesign platform, in which the participants completed the steps of understanding the study area and collectively building and negotiating proposals to improve the area to adapt it for children’s use. In this sense, the definition of geodesign by Miller [9] and Steinitz [10] was proven when they stated that the principle is planning “with” and “for” geography.
The article reports the experience of associating citizens’ listening through the work with children from a State School located in the central area of Belo Horizonte to the technical approach through the UFMG urban planning students.
The low number of children who walk to school was observed. The indices and results reported the work with only five children, and generalizing statements could not be constructed. It will be essential to expand the sample with other schools and to expand the focus beyond the homeschool route, interviewing children who experience walking in the area to any activity. However, the study resulted in the experimentation of a set of steps evaluated according to logistical difficulty (computer limitations) and the ease of children’s participation in tasks (which was high, and they showed themselves to be children from the iGeneration).
In the production stage of the technical maps by geoprocessing to prepare the multicriteria analysis, only 13 of the 15 indicators chosen by the bibliographic review were mapped due to data availability. Despite having excellent data collection, the local government needed to capture information on local-scale data, which can make a difference when investigating the road quality and children’s independent mobility. In future studies, the list of indicators can be reviewed.
Data were captured by voluntary mapping, by the VGI application, both with children and with a technical approach. When working with the children, the initial expectation was that they could carry out fieldwork with the VGI application on their cell phones. The technical team and their parents could eventually help, while they would register “like” or “don’t like” opinions in loco, resulting in a mapping of topophilia and topophobia [36,37]. However, the authorizations and restrictions to withdraw a child from school were complex, so they worked from their memories of perception and cognition [38,45].
For the technical group, the VGI was used in the field by registering the presence of the 15 completeness indicators. This resulted in concentration maps indicating the vulnerabilities and potentialities in each variable. The task proved to be easy to prepare and recorded a considerable amount of information, demonstrating the tool’s ability even to receive data captured by the population in general, producing an updated cartography, as it is possible to distribute the access link to citizens.
In the multicriteria analysis stage, it was shown that, despite the natural differences of opinion about the hierarchy of the integrated variables, the maps did not vary so much in terms of highlighting the most qualified spaces, which were the ones with the highest concentration of the 15 completeness indicators. The map resulting from the MCA with the children’s opinion was very similar to the map resulting from MCA from the technical approach, with variations only in the intermediate results, with a clear definition of the most suitable and the least-qualified areas for children’s independent mobility in the study area.
The geodesign stage, the process of the cocreation of ideas, was conducted analogically with the children and on the GISColab platform with the technicians. In the future, conducting both experiences on the GISColab web-based platform will be an objective. Despite the limitations in working with the children, they were active and confident in their opinions about ideas for transforming the study area. Using all the data provided by previous steps, the technical group developed a design through cocreation and negotiation, followed by an authorial detailing of the proposals.
The survey results could encourage the re-examination of public policies and guide participatory planning and management processes to children’s independent mobility. Promoting more sustainable urban lifestyles requires considering children as active agents capable of contributing to decision-making processes [46].
Author Contributions
Conceptualization, A.C.M.M.; methodology, A.C.M.M. and A.A.R.; software, A.C.M.M. and A.A.R.; formal analysis, A.C.M.M. and A.A.R.; investigation, A.A.R.; resources, P.B.; data curation, A.C.M.M.; writing—original draft preparation, A.C.M.M.; writing—review and editing, A.C.M.M.; visualization, A.A.R.; supervision, A.C.M.M.; project administration, P.B.; funding acquisition, P.B. All authors have read and agreed to the published version of the manuscript.
Funding
Contribution from the FAPEMIG project—APQ-00779-22, “Dialogical digital tools enhancing the promotion of children’s independent mobility in urban centres: Belo Horizonte”. We thank CNPq for the financial support of the doctoral research (141092/2021-1).
Data Availability Statement
The data presented in this study are available on request from the corresponding author. The data are not publicly available due to restrictions presented by Certificate of Ethical Appreciation number 4189922.6.0000.5149.
Acknowledgments
We thank the Bueno Brandão State School in Belo Horizonte and the URB-018 2023/1 Urbanism students from EA-UFMG for joining. We thank Anna Pires Diniz and Marcela Rodrigues de Almeida Sanches for collaborating on the VGI data capture. The CAAE authorized the research—Presentation Certificate of Ethical Appreciation number 4189922.6.0000.5149.
Conflicts of Interest
The authors declare no conflicts of interest. The funders had no role in the design of the study; in the collection, analyses, or interpretation of data; in the writing of the manuscript; or in the decision to publish the results.
References
- Shaw, B.; Bicket, M.; Elliott, B.; Watson, B.F.; Mocca, E.; Hillman, M. Children’s Independent Mobility: An International Comparison and Recommendations for Action; Policy Studies Institute, University of Westminster: London, UK, 2015; 77p. [Google Scholar]
- Khan, U.R.; Razzak, J.; Wärnberg, M.G. Association of Adolescents’ Independent Mobility with Road Traffic Injuries in Karachi, Pakistan: A Cross-Sectional Study. BMJ Open 2022, 12, e057206. [Google Scholar] [CrossRef] [PubMed]
- Mizen, A.; Fry, R.; Rodgers, S. GIS-modelled built-environment exposures reflecting daily mobility for applications in child health research. Int. J. Health Geogr. 2020, 19, 12. [Google Scholar] [CrossRef]
- Olsen, J.R.; Caryl, F.; Nicholls, N.; Smith, M.; McCrorie, P.; Mitchell, R. Inequalities in neighborhood features within children’s 20-minute neighborhoods and variation in time spent locally, measured using GPS. Wellbeing Space Soc. 2023, 5, 100174. Available online: https://eprints.gla.ac.uk/306011/ (accessed on 1 March 2023). [CrossRef] [PubMed]
- Ikeda, E.; Hinckson, E.; Witten, K.; Smith, M. Assessment of direct and indirect associations between children active school travel and environmental, household and child factors using structural equation modelling. Int. J. Behav. Nutr. Phys. Act. 2019, 16, 32. [Google Scholar] [CrossRef] [PubMed]
- Jelleyman, C.; McPhee, J.; Brussoni, M.; Bundy, A.; Duncan, S. A Cross-Sectional Description of Parental Perceptions and Practices Related to Risky Play and Independent Mobility in Children: The New Zealand State of Play Survey. Int. J. Environ. Res. Public Health 2019, 16, 262. [Google Scholar] [CrossRef] [PubMed]
- Xavier-da-Silva, J. Geoprocessamento para Análise Ambiental, 1st ed.; D5 Produção Gráfica: Rio de Janeiro, Brazil, 2001; 228p. [Google Scholar]
- Goodchild, M. Citizens as sensors: The world of volunteered geography. GeoJournal 2007, 69, 211–221. [Google Scholar] [CrossRef]
- Miller, W.R. Introducing Geodesign: The Concept; Esri Press: Redlands, CA, USA, 2012; 33p. [Google Scholar]
- Steinitz, C. A Framework for Geodesign: Changing Geography by Design; ESRI Press: Redlands, CA, USA, 2012; 224p. [Google Scholar]
- Prensky, M. Digital natives, digital immigrants’ part 1. Horizon 2001, 9, 1–6. [Google Scholar] [CrossRef]
- Creswel, J.W. Qualitative Inquiry and Research Design: Choosing among Five Approaches; SAGE Publication: Thousand Oaks, CA, USA, 2013. [Google Scholar]
- Babbie, E. The Practice of Social Research; SAGE Publication: Thousand Oaks, CA, USA, 2013. [Google Scholar]
- Adhikhari, D.; Henderson, T.; Dolce, M.; Banks, A.; Zaim, H.; Onwuka, A.; Jones, N. An evaluation of PlayStreets in the South Side neighborhood of Columbus, Ohio. Public Health 2021, 141, 97–101. [Google Scholar] [CrossRef]
- Pan, X.; Zhao, L.; Luo, J.; Yinhao, L.; Zhang, L.; Wu, T.; Smith, M.; Dai, S.; Jia, P. Access to Bike Lanes and Childhood Obesity: A Systematic Review and Meta-Analysis. Obes. Rev. 2021, 22, e13042. [Google Scholar] [CrossRef]
- Dixon, B.N.; Ugwoaba, U.A.; Brockmann, A.N.; Ross, K.M. Associations between the Built Environment and Dietary Intake, Physical Activity, and Obesity: A Scoping Review of Reviews. Obes. Rev. 2021, 22, e13171. [Google Scholar] [CrossRef] [PubMed]
- Ikeda, E.; Stewart, T.; Garrett, N.; Egli, V.; Mandic, S.; Hosking, J.; Witten, K.; Hawley, G.; Tautolo, E.S.; Rodda, J.; et al. Built Environment Associates of Active School Travel in New Zealand Children and Youth: A Systematic MetaAnalysis Using Individual Participant Data. J. Transp. Health 2018, 9, 117–131. [Google Scholar] [CrossRef]
- Danenberg, R.; Doumpa, V.; Karssenberg, H. The City at Eye Level for Kids; STIPO: Rotterdam, The Netherland, 2018; 394p. [Google Scholar]
- Smith, M.; Hosking, J.; Woodward, A.; Witten, K.; MacMillan, A.; Field, A.; Baas, P.; Mackie, H. Systematic literature review of built environment effects on physical activity and active transport—An update and new findings on health equity. Int. J. Behav. Nutr. Phys. Act. 2017, 14, 158. [Google Scholar] [CrossRef] [PubMed]
- Ward, J.S.; Duncan, J.S.; Jarden, A.; Stewart, T. The Impact of Children’s Exposure to Greenspace on Physical Activity, Cognitive Development, Emotional Wellbeing, and Ability to Appraise Risk. Health Place 2016, 40, 44–50. [Google Scholar] [CrossRef]
- Lachowycz, K.; Jones, A.P.; Page, A.S.; Wheeler, B.W.; Cooper, A.R. What Can Global Positioning Systems Tell Us about the Contribution of Different Types of Urban Greenspace to Children’s Physical Activity? Health Place 2012, 18, 586–594. [Google Scholar] [CrossRef]
- Zdiara, A. The city as playground, museum, cinema & classroom. In The City at Eye Level for Kids; Danenberg, R., Doumpa, V., Karssenberg, H., Eds.; STIPO: Rotterdam, The Netherland, 2018; pp. 139–141. [Google Scholar]
- Castro, D.M. Corners for kids: Quality spaces small scale. In The City at Eye Level for Kids; Danenberg, R., Doumpa, V., Karssenberg, H., Eds.; STIPO: Rotterdam, The Netherland, 2018; pp. 143–147. [Google Scholar]
- Levner, A. Turning spaces into places. In The City at Eye Level for Kids; Danenberg, R., Doumpa, V., Karssenberg, H., Eds.; STIPO: Rotterdam, The Netherland, 2018; pp. 127–129. [Google Scholar]
- Biddulph, M. Radical streets? The impact of innovative street designs on liveability and activity in residential areas. Urban Des. Int. 2012, 17, 178–205. [Google Scholar] [CrossRef]
- Canciovici, C. The plinth—A portal to play. In The City at Eye Level for Kids; Danenberg, R., Doumpa, V., Karssenberg, H., Eds.; STIPO: Rotterdam, The Netherland, 2018; pp. 148–151. [Google Scholar]
- Igel, U.; Gausche, R.; Krapf, A.; Lück, M.; Kiess, W.; Grande, G. Movement-enhancing footpaths—A natural experiment on street design and physical activity in children in a deprived district of Leipzig, Germany. PreMed. Rep. 2020, 20, 101197. [Google Scholar] [CrossRef] [PubMed]
- Atles, R.K. Playable Street to reclaim independent play for all children. In The City at Eye Level for Kids; Danenberg, R., Doumpa, V., Karssenberg, H., Eds.; STIPO: Rotterdam, The Netherland, 2018; pp. 160–163. [Google Scholar]
- VALENÇA, Gabriel Costa. O conceito de ruas completas e a infraestrutura cicloviária: A experiência de Toronto, Canadá. Rev. Espac. 2018, 39, 26–33. Available online: http://www.revistaespacios.com/a18v39n08/a18v39n08p26.pdf (accessed on 1 April 2022).
- SMART GROWTH AMERICA. What Are Complete Streets. Washington D.C. 2018. Available online: https://smartgrowthamerica.org/program/national-complete-streets-coalition/publications/what-arecomplete-streets/ (accessed on 1 April 2022).
- Gehl, J. Cities for People; Island Press: Washington, DC, USA, 2010; 288p. [Google Scholar]
- Gehl, J. Life between Buildings; Island Press: Washington, DC, USA, 2011; 216p. [Google Scholar]
- Dalkey, N.; Helmer, O. An experimental application of the Delphi method to the use of experts. Manag. Sci. 1963, 9, 458–467. [Google Scholar] [CrossRef]
- Linstone, H.; Turoff, M. The Delphi Method: Techniques and Applications. J. Market. Res. 1975, 18. [Google Scholar] [CrossRef]
- Iescheck, A.L.; Paolazzi, C.; Sluter, C.R.; Camboim, S.P. Metodologia para geração de bases de dados geoespaciais em consonância com a Infraestrutura Nacional de Dados Espaciais (INDE) e com os padrões de interoperabilidade do governo eletrônico (e-PING). Rev. Bras. De Cartogr. 2016, 68, 1425–1439. [Google Scholar] [CrossRef]
- Tuan, Y.F. Topophilia: A Study of Perception, Attitudes and Values of the Environment; Prentice Hall: Upper Saddle River, NJ, USA, 1974; 260p. [Google Scholar]
- Tuan, Y.F. Landscapes of Fear; Blackwell: Oxford, UK, 1979; 262p. [Google Scholar]
- Lynch, K. The Image of the City; Mit Press: Cambridge, MA, USA, 1960; 208p. [Google Scholar]
- Freitas, C.R. Tecnologias de Geoinformação no Planejamento Territorial: Novas Formas de Produção, Compartilhamento e uso de Dados Espaciais. Ph.D. Thesis, Programa de Pós-Graduação em Arquitetura e Urbanismo, EA-UFMG, Belo Horizonte, Brazil, 2020; 262p. Available online: http://hdl.handle.net/1843/40989 (accessed on 22 November 2021).
- Paula, P.L.; Moura, A.C.M. O uso de tecnologias de geoinformação web-based com os i-generation na prática do planejamento urbano compartilhado. In Proceedings of the 8° Congresso Luso-Brasileiro para o Planejamento Urbano, Regional, Integrado e Sustentável, PLURIS, Coimbra, Portugal, 24–26 October 2018. [Google Scholar]
- Monteiro, L.O.; Moura, A.C.M.; Zyngier, C.M.; Sena, I.S.; Paula, P.L. Geodesign Facing the Urgency of Reducing Poverty: The Cases of Belo Horizonte. DisegnareCon 2018, 11, 6.1–6.25. [Google Scholar]
- Loura, R.M.; Borges, M.; Mol, N.; Assis, E.; Moura, A.C.M. O uso do método de Geodesign como ferramenta para sensibilização de crianças sobre resiliência urbana às mudanças climáticas. In Proceedings of the ARQUISUR 2019, Belo Horizonte, Brazil, 2 October 2019. [Google Scholar]
- Sommer, R.; Sommer, B. A Practical Guide to Behavioural Research: Tools and Techniques, 5th ed.; Oxford University Press: New York, NY, USA, 2002; 400p. [Google Scholar]
- Ligmann-Zielinska, A.; Jankowski, P. Spatially-explicit integrated uncertainty and sensitivity analysis of criteria weights in multicriteria land suitability evaluation. Environ. Model. Softw. 2014, 57, 235–247. [Google Scholar] [CrossRef]
- Cullen, G. The Concise Townscape; Routledge: London, UK, 1961; p. 200. [Google Scholar]
- UNICEF. Child Friendly Cities Initiative. 2022. Available online: https://childfriendlycities.org/ (accessed on 28 May 2023).


Disclaimer/Publisher’s Note: The statements, opinions and data contained in all publications are solely those of the individual author(s) and contributor(s) and not of MDPI and/or the editor(s). MDPI and/or the editor(s) disclaim responsibility for any injury to people or property resulting from any ideas, methods, instructions or products referred to in the content. |
© 2024 by the authors. Licensee MDPI, Basel, Switzerland. This article is an open access article distributed under the terms and conditions of the Creative Commons Attribution (CC BY) license (https://creativecommons.org/licenses/by/4.0/).