
Hydromorphic Impact of Matera’s Urban Area


Abstract

1. Introduction
2. Materials and Methods
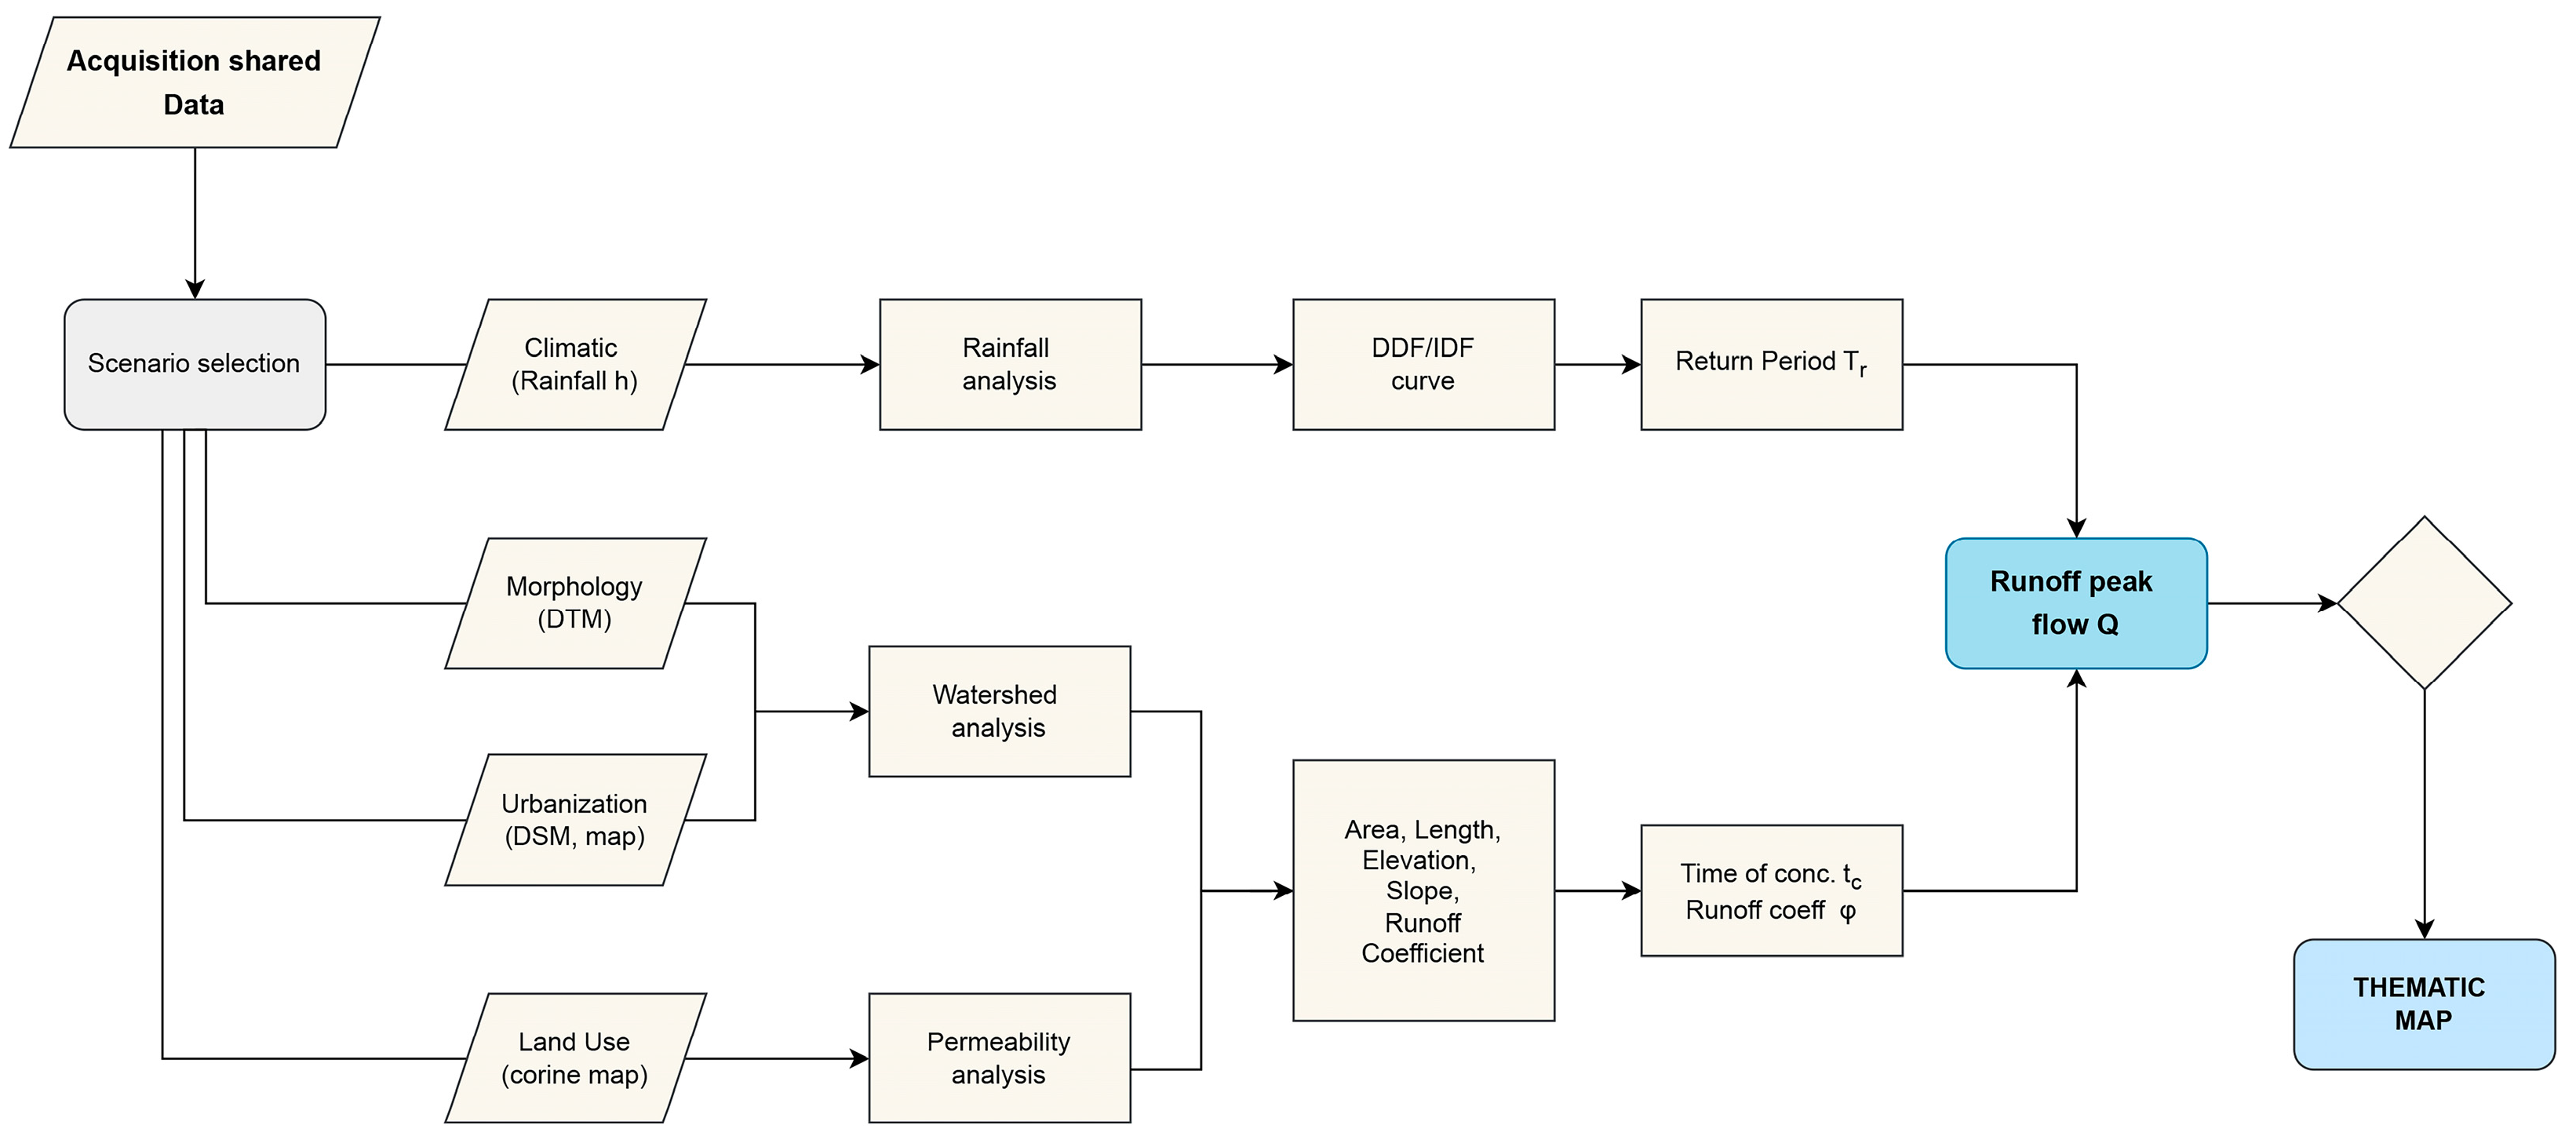
2.1. Methodology
- Morphological analysis of the urban area and urban watershed assessment, both conducted by considering the Digital Terrain Model (DTM) of a zone large enough to include all the peculiarities of the area of interest, characterized by a resolution capable of describing the urban morphology; hereafter, the official DTM (resolution 5 m × 5 m) provided by Regione Basilicata is used. While a higher-resolution DTM could potentially enhance the precision of the physical analysis presented below, it would not substantially alter the overall hydrological response of the catchment.
- Physical analysis of all the watersheds and evaluation by GIS software (Q-GIS 3.4.13) of the descriptive parameters (area, perimeter, length, elevation, slope, land uses) also by considering the pan-European land cover and land use inventory CORINE Land Cover maps.
- Hydrological analysis of the maximum rainfall data to evaluate the Depth–Duration–Frequency (DDF)curve and the Intensity–Duration–Frequency (IDF)curve that predict the rainfall events for different frequencies (return period), and for a given location.
- Hydrological evaluation of the expected runoff at the outlet point of each catchment.
2.1.1. Morphological Analysis
- φi are the runoff coefficient of each homogeneous area;
- Ai are the homogeneous areas;
- Atot is the global area of the watershed.
- tc ( hours) is the time of concentration;
- L (m) is the length of the mainstream path;
- s (dimensionless) is the average slope of terrain conveying the overland flow.
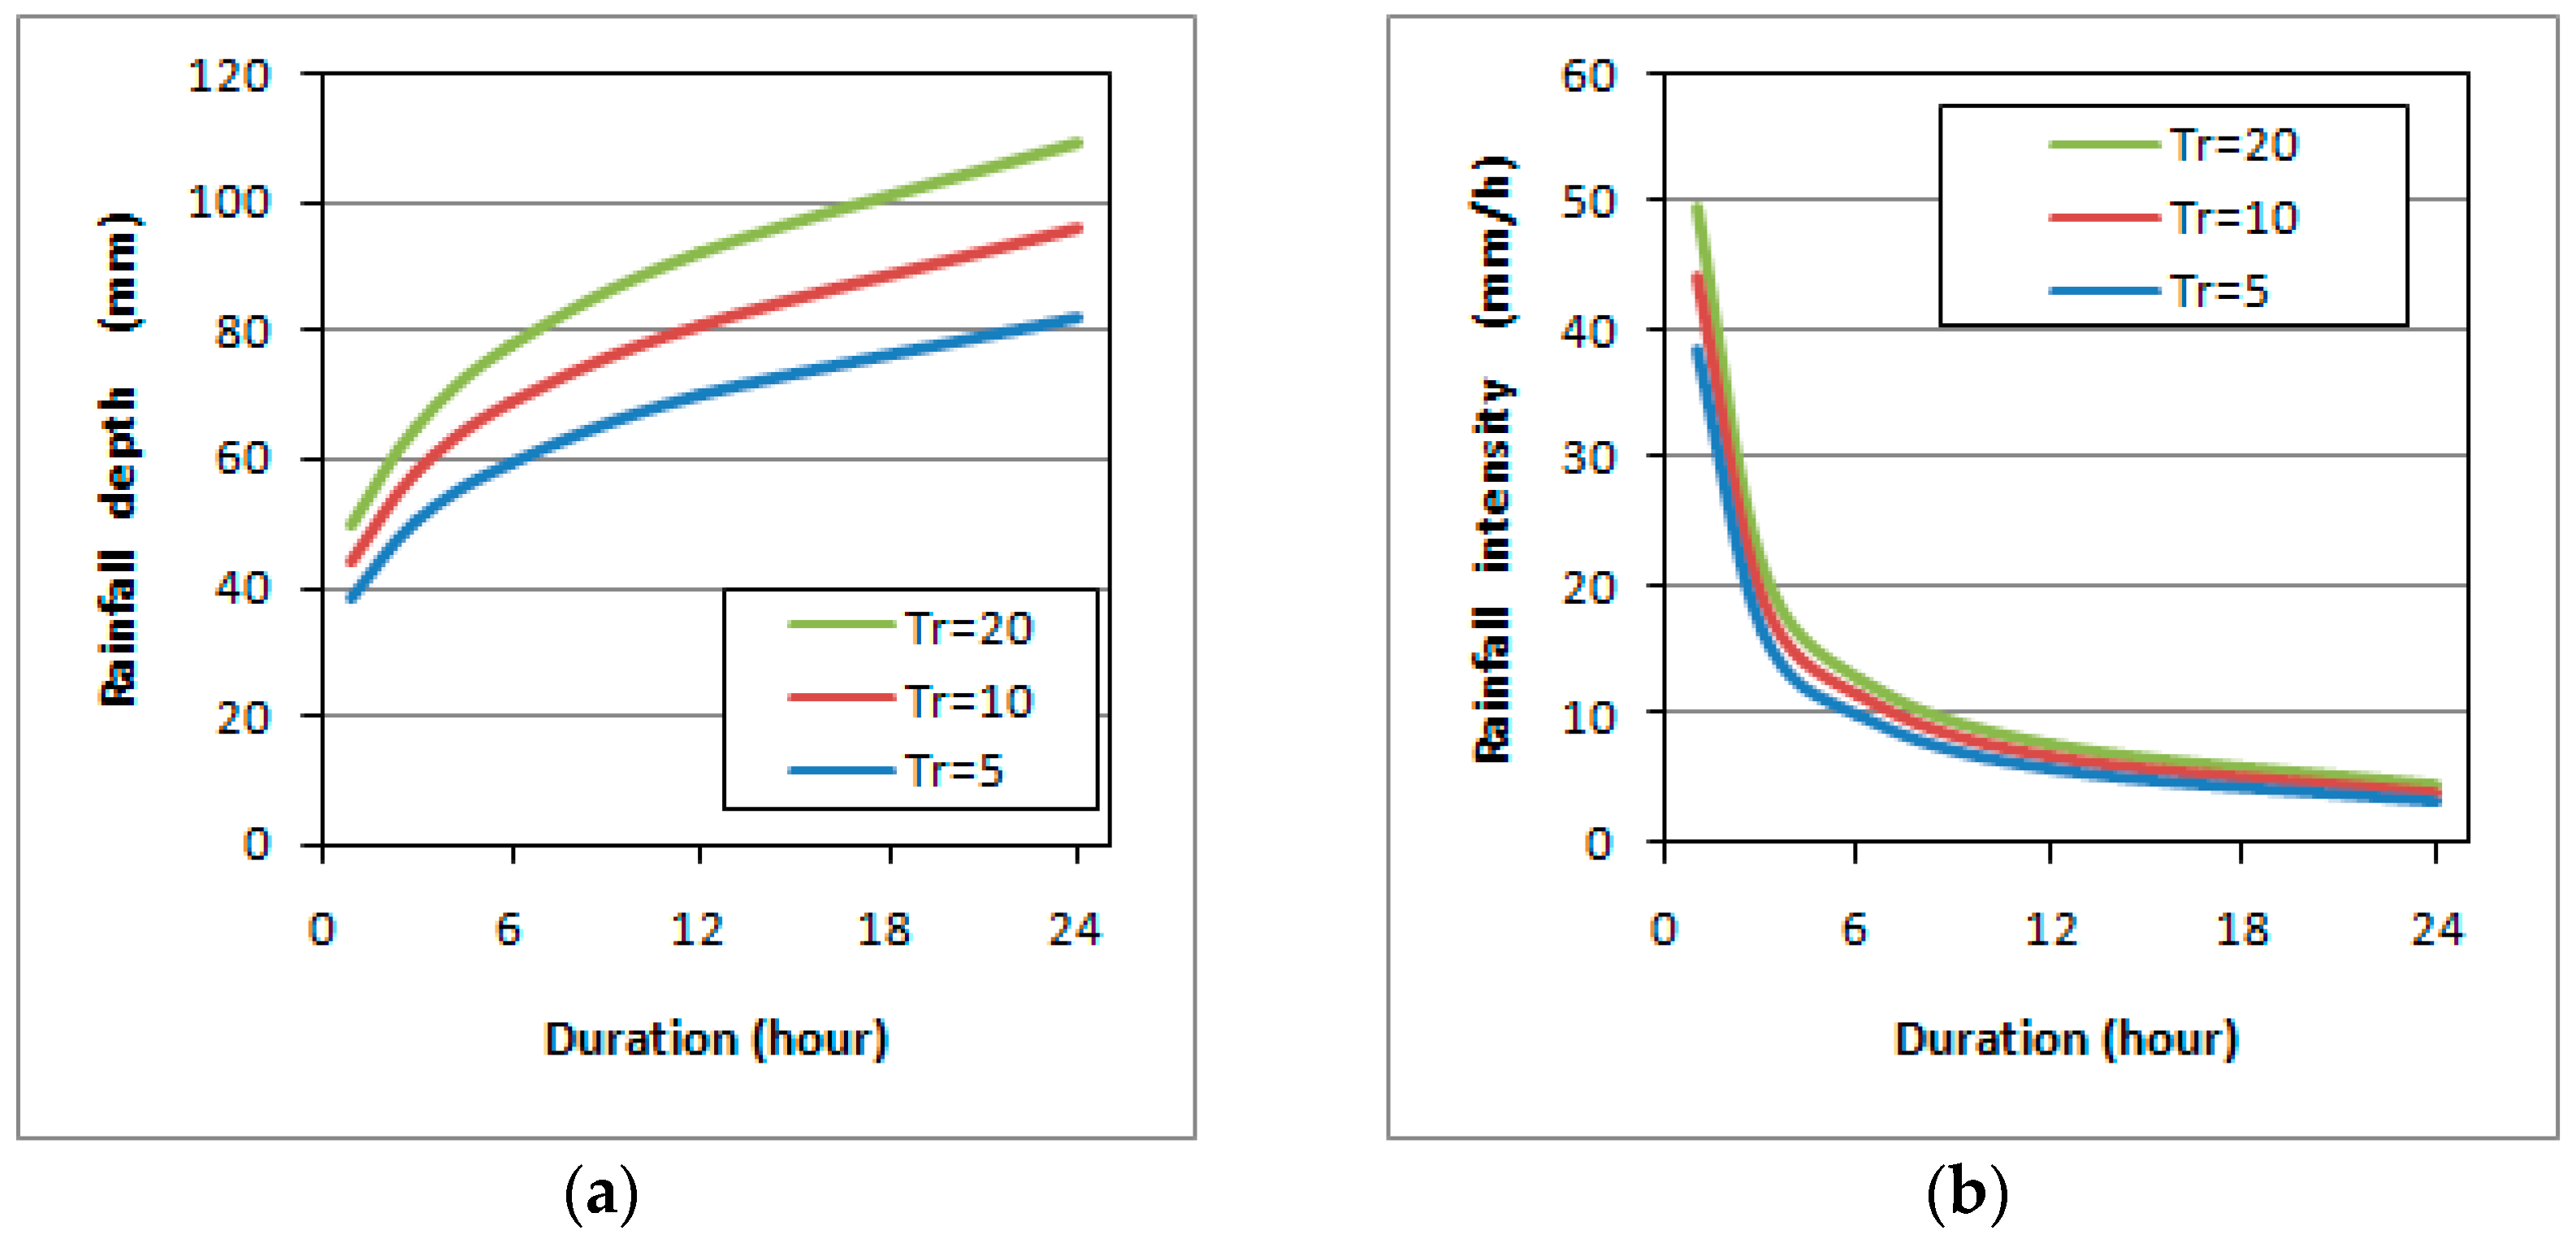
2.1.2. Hydrological Analysis
- The rainfall analysis, which considers the recorded rainfall data and applies the usual statistical methods for rainfall analysis [57] to estimate the DDF curve (Equation (3)) and the IDF curve (Equation (4)) for different return period Trwhere:
- h (mm) is the rainfall depth;
- i (mm/hour) is the rainfall intensity;
- t (hours) is the rainfall duration;
- “a” and “n” are the curve parameters and are related to the return period Tr that characterize the scenario in which the analysis is intended to be carried out.
- The runoff analysis that models the rainfall-runoff process adopting the well-known and widely used Rational Method [56,57] in order to evaluate the peak flow Q (Equation (5)) at the catchment outlet:where Q, at the watershed outlet, is strictly related to the physical condition of the catchment (the runoff coefficient φ), to the climatic scenario (the intensity of precipitation i related to the time of concentration tc), to the shape of the catchment(the surface A), and to the hydrological response of catchment (the time of concentration tc).
3. Results
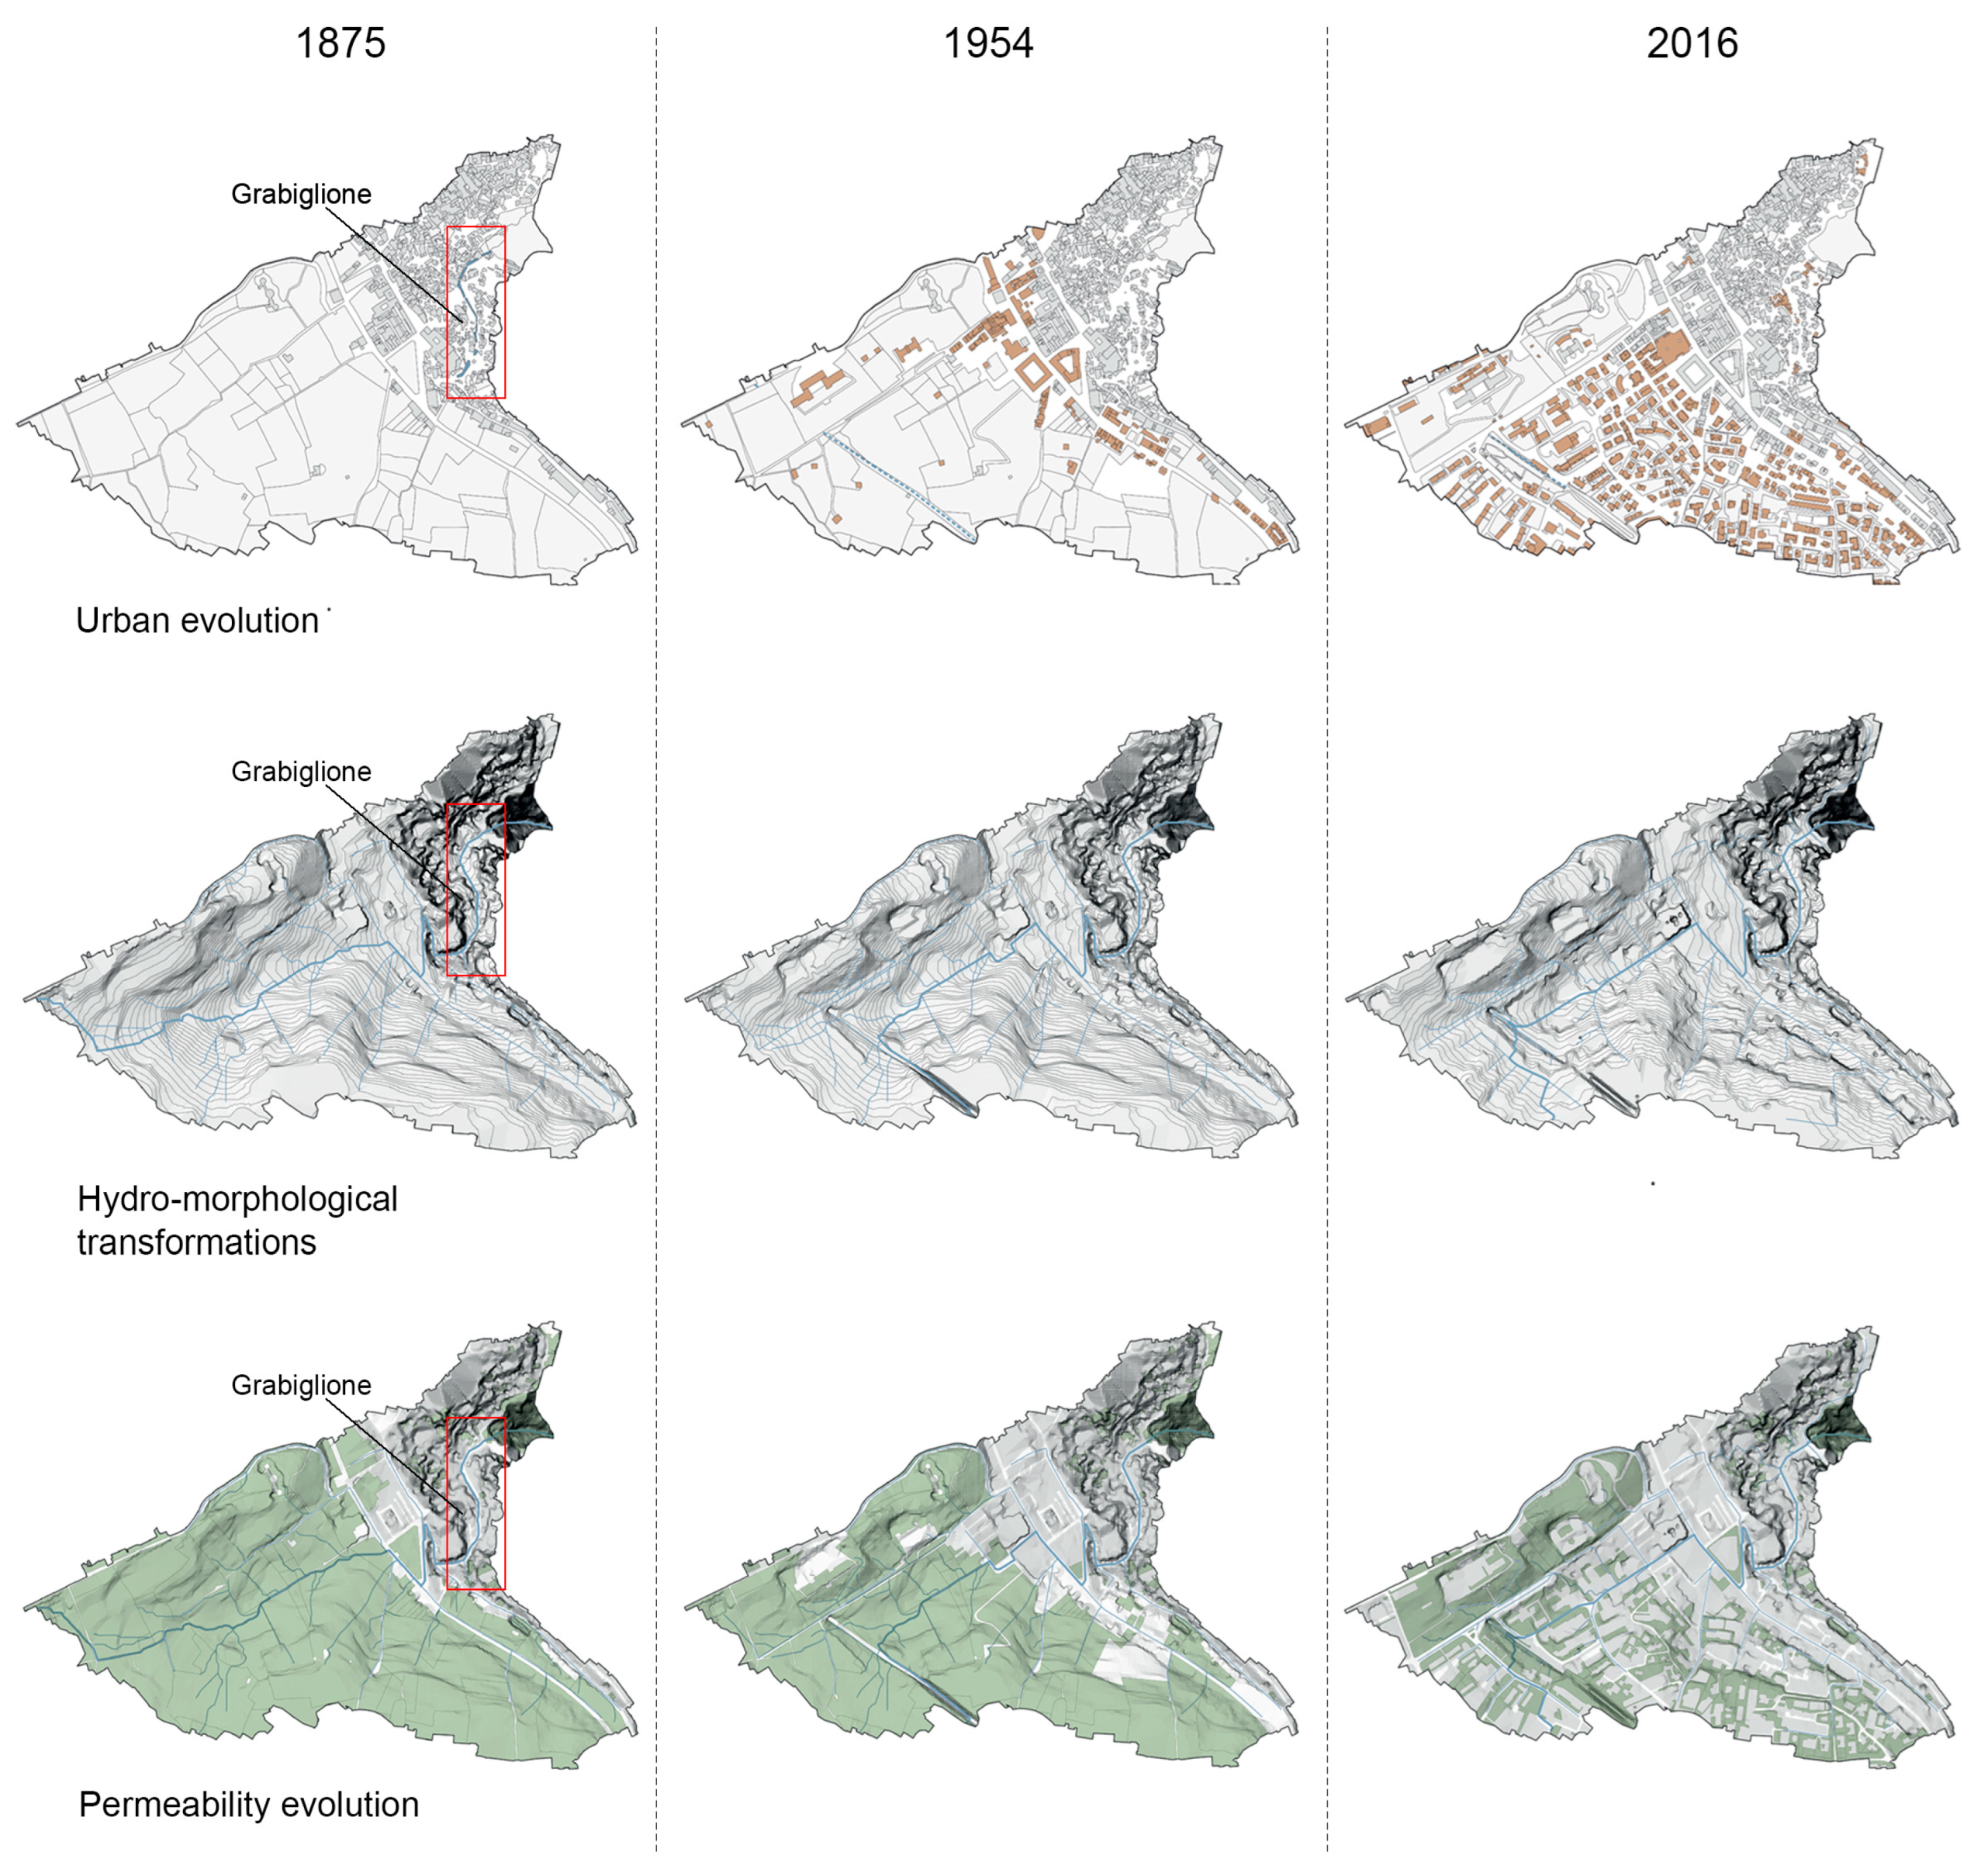
3.1. The Case Study
3.2. Hydromorphic Approach
4. Discussion and Conclusions
Author Contributions
Funding
Data Availability Statement
Conflicts of Interest
References
- Chen, Y.; Zhou, H.; Zhang, H.; Du, G.; Zhou, J. Urban flood risk warning under rapid urbanization. Environ. Res. 2015, 139, 3–10. [Google Scholar] [CrossRef]
- Sun, S.; Zhai, J.; Li, Y.; Huang, D.; Wang, G. Urban waterlogging risk assessment in well-developed region of Eastern China. Phys. Chem. Earth 2020, 115, 102824. [Google Scholar] [CrossRef]
- Walsh, C.J.; Roy, A.H.; Feminella, J.W.; Cottingham, P.D.; Groffman, P.M.; Morgan, R.P. The urban stream syndrome: Current knowledge and the search for a cure. J. N. Am. Benthol. Soc. 2005, 24, 706–723. [Google Scholar] [CrossRef]
- Fox, D.M.; Witz, E.; Blanc, V.; Soulié, C.; Penalver-Navarro, M.; Dervieux, A. A case study of land cover change (1950–2003) and runoff in a Mediterranean catchment. Appl. Geogr. 2012, 32, 810–821. [Google Scholar] [CrossRef]
- Dams, J.; Dujardin, J.; Reggers, R.; Bashir, I.; Canters, F.; Batelaan, O. Mapping impervious surface change from remote sensing for hydrological modeling. J. Hydrol. 2013, 485, 84–95. [Google Scholar] [CrossRef]
- Horton, R.; Ankeney, M.D.; Allmaras, R.R. Effects of compaction on soil hydraulic properties. In Soil Compaction in Crop Production; Soane, B.D., van Ouwerkerk, C., Eds.; Elsevier Science: Amsterdam, The Netherlands, 1994. [Google Scholar]
- Richard, G.; Cousin, I.; Sillon, J.F.; Bruand, A.; Guérif, J. Effect of compaction on the porosity of a silty soil: Influence on unsaturated hydraulic properties. Eur. J. Soil Sci. 2001, 52, 49–58. [Google Scholar] [CrossRef]
- IPCC. Climate Change 2014: Synthesis Report. Contribution of Working Groups I, II and III to the Fifth Assessment Report of the Intergovernmental Panel on Climate Change; Core Writing Team, Pachauri, R.K., Meyer, L.A., Eds.; IPCC: Geneva, Switzerland, 2014. [Google Scholar]
- Aalbers, E.E.; Lenderink, G.; van Meijgaard, E.; van den Hurk, B.J.J.M. Local scale changes in mean and heavy precipitation in Western Europe, climate change or internal variability? Clim. Dynam. 2018, 50, 4745–4766. [Google Scholar] [CrossRef]
- Martel, J.L.; Mailhot, A.; Brissette, F. Global and regional projected changes in 100-year sub-daily, daily and multi-day precipitation extremes estimated from three large ensembles of climate simulation. J. Clim. 2020, 33, 1089–1103. [Google Scholar] [CrossRef]
- Innocenti, S.; Mailhot, A.; Leduc, M.; Cannon, A.J.; Frigon, A. Projected changes in the probability distributions, seasonality, and spatiotemporal scaling of daily and sub daily extreme precipitation simulated bya 50-member ensemble over northeastern North America. J. Geophys. Res. Atmos. 2019, 124, 10427–10449. [Google Scholar] [CrossRef]
- Sillmann, J.; Kharin, V.V.; Zwiers, F.W.; Zhang, X.; Bronaugh, D. Climate extremes indices in the CMIP5 multimodel ensemble: Part2. Future climate projections. J. Geophys. Res. Atmos. 2013, 118, 2473–2493. [Google Scholar] [CrossRef]
- Fischer, E.M.; Knutti, R. Observed heavy precipitation increase confirms theory and early models. Nat. Clim. Change 2016, 6, 986–991. [Google Scholar] [CrossRef]
- Hirsch, R.M.; Walker, J.F.; Day, J.C.; Kallio, R. The influence of man on hydrologic systems. In Surface Water Hydrology (The Geology of America, Vol. 0–1); Wolman, M.G., Riggs, H.C., Eds.; Geological Society of America: Boulder, CO, USA, 1990; p. 329. [Google Scholar]
- Hollis, G.E. The effect of urbanization on floods of different recurrence interval. Water Resour. Res. 2010, 11, 431–435. [Google Scholar] [CrossRef]
- Houston, D.; Werritty, A.; Bassett, D.; Geddes, A.; Hoolachan, A.; McMillan, M. Pluvial (Rain-Related) Flooding in Urban Areas: The Invisible Hazard. Joseph Rown tree Foundation. 2011. Available online: http://www.jrf.org.uk/sites/files/jrf/urban-flood-risk-full.pdf (accessed on 27 September 2023).
- Packman, J.C. The effect of urbanization on flood magnitude and frequency. In Man’s Influence on the Hydrological Cycle in the United Kingdom; Hollis, G.E., Ed.; GeoBooks: Norwich, UK, 1979; pp. 153–172. [Google Scholar]
- European Environment Agency. Flood risk in Europe: TheLong-Term Outlook. 2013. Available online: https://www.eea.europa.eu/highlights/flood-risk-in-europe-2013 (accessed on 27 September 2023).
- Feyen, L.; Dankers, R.; Bodis, K.; Salamon, P.; Barredo, J.I. Fluvial flood risk in Europe in present and future climates. Clim. Change 2012, 112, 47–62. [Google Scholar] [CrossRef]
- Dunne, T.; Leopold, L.B. Water in Environmental Planning; Freeman publications: New York, NY, USA, 1978. [Google Scholar]
- Arnold, C.L.; Gibbons, C.J. Impervious surface coverage: The emergence of a key environmental indicator. J. Am. Plan. Assoc. 1996, 62, 243–258. [Google Scholar] [CrossRef]
- Leopold, L.B. Hydrology for Urban Land Planning—A Guide book on the Hydrologic Effects of Urban Land Use, Geological Survey Circular 554; United States Department of the Interior Publication: Washington, DC, USA, 1968.
- Konrad, C.P. US Geological Survey Fact Sheet 076-03: Effects of Urban Development on Floods. 2013. Available online: http://pubs.usgs.gov/fs/fs07603/ (accessed on 27 September 2023).
- Paul, M.J.; Meyer, J.L. Streams in the urban landscape. Annu. Rev. Ecol. Syst. 2001, 32, 333–365. [Google Scholar] [CrossRef]
- O’Driscoll, M.; Clinton, S.; Jefferson, A.; Manda, A.; McMillan, S. Urbanization Effects on Watershed Hydrology and In-Stream Processes in the Southern United States. Water 2010, 2, 605–648. [Google Scholar] [CrossRef]
- Domenech, L.; Sauri, D. A comparative appraisal of the use of rooftop rainwater in single and multi-family buildings of the Metropolitan Area of Barcelona (Spain): Social experience, drinking watersavings and economic costs. J. Clean. Prod. 2011, 19, 598–608. [Google Scholar] [CrossRef]
- Wong, T.H.F. Water sensitive urban design—The journey thus far. Environ. Des. Guide 2007, 11, 213–222. [Google Scholar] [CrossRef]
- Yigitcanlar, T.; Dizdaroglu, D. Ecological approaches in planning for sustainable cities. A review of the literature. Glob. J. Environ. Sci. Manage. 2015, 1, 159–188. [Google Scholar]
- ARE. Sustainability Assessment: Conceptual Framework and Basic Methodology; Swiss Federal Office for Spatial Development: Berne, Switzerland, 2004.
- Kron, W.; Eichner, J.; Kundzewicz, Z.W. Reduction of flood risk in Europe—Reflections from a reinsurance perspective. J. Hydrol. 2019, 576, 197–209. [Google Scholar] [CrossRef]
- Berndtsson, R.; Becker, P.; Persson, A.; Aspegren, H.; Haghighatafshar, S.; Jonsson, K.; Larsson, R.; Mobini, S.; Mottaghi, M.; Nilsson, J.; et al. Drivers of changing urban flood risk: A framework for action. J. Environ. Manage. 2019, 240, 47–56. [Google Scholar] [CrossRef] [PubMed]
- Bruwier, M.; Maravat, C.; Mustafa, A.; Teller, J.; Pirotton, M.; Erpicum, S.; Archambeau, P.; Dewals, B. Influence of urban forms on surface flow in urban pluvial flooding. J. Hydrol. 2020, 582, 124493. [Google Scholar] [CrossRef]
- Choubin, B.; Moradi, E.; Golshan, M.; Adamowski, J.; Sajedi-Hosseini, F.; Mosavi, A. An ensemble prediction of flood susceptibility using multivariate discriminant analysis, classification and regression trees, and support vector machines. Sci. Total Environ. 2019, 651, 2087–2096. [Google Scholar] [CrossRef] [PubMed]
- Sadler, J.M.; Haselden, N.; Mellon, K.; Hackel, A.; Son, V.; Mayfield, J.; Blasé, A.; Goodall, J.L. Impact of Sea-Level Rise on Roadway Flooding in the Hampton Roads Region, Virginia. J. Infrastruct. Syst. 2017, 23, 05017006. [Google Scholar] [CrossRef]
- Tehrany, M.S.; Pradhan, B.; Jebur, M.N. Spatial prediction of flood susceptible areas using rule based decision tree (DT) and a novel ensemble bivariate and multivariate statistical models in GIS. J. Hydrol. 2013, 504, 69–79. [Google Scholar] [CrossRef]
- Zhao, G.; Pang, B.; Xu, Z.; Yue, J.; Tu, T. Mapping flood susceptibility in mountainous areas on a national scale in China. Sci. Total Environ. 2018, 615, 1133–1142. [Google Scholar] [CrossRef]
- Ahmad, S.S.; Simonovic, S.P. Spatial and temporal analysis of urban flood risk assessment. Urban Water J. 2013, 10, 26–49. [Google Scholar] [CrossRef]
- Son, N.T.; Trang, T.T.N.; Bui, X.T.; ThiDa, C. Remote sensing and GIS for urbanization and flood risk assessment in PhnomPenh, Cambodia. Geocarto Int. 2021, 37, 6625–6642. [Google Scholar]
- Cherqui, F.; Belmeziti, A.; Granger, D.; Sourdril, A.; LeGauffre, P. Assessing urban potential flooding risk and identifying effective risk-reduction measures. Sci. Total Environ. 2015, 514, 418–425. [Google Scholar] [CrossRef]
- Liu, L.; Jensen, M.B.; Zhang, X. Urban Water Management in Beijing and Copenhagen: Sustainability, Climate Resilience, and the Local Water Balance. In Greening China’s Urban Governance; Delman, J., Ren, Y., Luova, O., Burell, M., Almén, O., Eds.; ARI—Springer Asia Series; Springer: Singapore, 2021; Volume 7. [Google Scholar]
- Zhang, Q.; Wu, Z.; Zhang, H.; DallaFontana, G.; Tarolli, P. Identifying dominant factors of waterlogging events in metropolitan coastal cities: The case study of Guangzhou, China. J. Environ. Manage. 2020, 271, 110951. [Google Scholar] [CrossRef]
- Hemmati, M.; Ellingwood, B.R.; Mahmoud, H.N. The Role of Urban Growth in Resilience of Communities Under Flood Risk. Earths. Future 2020, 8, e2019EF001382. [Google Scholar]
- TenVeldhuis, J.A.E.; Clemens, F. Flood risk modelling based on tangible and intangible urban flood damage quantification. Water Sci. Technol. 2010, 62, 189–195. [Google Scholar] [CrossRef]
- Rudari, R.; Gabellani, S.; Delogu, F. A simple model to map areas prone to surface water flooding. Inter. J. Disaster Risk Reduct. 2014, 10, 428–441. [Google Scholar] [CrossRef]
- Segnestam, L. Indicators of Environment and Sustainable Development Theories and Practical Experience; Wold Bank: New York, NY, USA, 2003. [Google Scholar]
- Gabrielsen, P.; Bosch, P. Environmental Indicators: Typology and Use in Reporting; European Environment Agency: Copenhagen, Denmark, 2003.
- Wheater, H.; Gober, P. Water security in the Canadian Prairies: Science and management challenges. Phil.Trans. R. Soc. A. 2013, 371, 20120409. [Google Scholar] [CrossRef]
- OECD. Core Set of Indicators for Environmental Performance Reviews Environment Monographs No. 83; Organisation for Economic Co-operation and Development: Paris, France, 1993. [Google Scholar]
- EEA. Environmental Indicators: Typology and Overview; Copenhagen: European Environment Agency: Copenhagen, Denmark, 1999. [Google Scholar]
- Hoekstra, A.Y. Water supply in the long term: A risk assessment. Phys. Chem. Earth 2000, 25, 221–226. [Google Scholar] [CrossRef]
- Wolman, A. The Metabolism of Cities; Scientific American, 213; Springer Nature: LosAngeles, CA, USA, 1965; pp. 179–190. [Google Scholar]
- Kennedy, C.A.; Cuddihy, J.; Engel Yan, J. The changing metabolism of cities. J. Ind. Ecol. 2007, 11, 43–59. [Google Scholar] [CrossRef]
- Albano, R.; Ermini, R. Hydromorphic analysis of urban areas transformations: The case study of the Matera city. IOP Conf. Ser. Earth Environ. Sci. 2023, 1196, 012026. [Google Scholar]
- Neteler, M.; Bowman, M.H.; Landa, M.; Metz, M. GRASS GIS: A multi-purpose opensource GIS. Environ. Model. Softw. 2012, 31, 124–130. [Google Scholar] [CrossRef]
- Vander Kwast, H.; Menke, K. QGIS for Hydrological Applications—Recipes for Catchment Hydrology and Water Management; Locate Press: Penticton, BC, Canada, 2022. [Google Scholar]
- Artina, S.; Calenda, G.; Calomino, F.; LaLoggia, G.; Modica, C.; Paoletti, A.; Papiri, S.; Rasulo, G.; Veltri, P. Sistemi di Fognatura. Manuale di Progettazione; CSDU—HOEPLI: Milano, Italy, 1997. [Google Scholar]
- Manfreda, S.; Iacobellis, V.; Fiorentino, M. Appunti di Idrologia Superficiale; Aracne Editrice: Roma, Italy, 2010. [Google Scholar]
- Cotecchia, V.; Grassi, D. Stato di Conservazione dei Sassi di Matera (Basilicata) in Rapporto Alle Condizioni Geomorfologiche e Geomeccaniche del Territorio e alle Azioni Antropiche; ArtigraficheFavia: Bari, Italy, 1975. [Google Scholar]
- Ermini, R.; Didio, L.; Pascale, S.; Sdao, F. Infrastrutture idrauliche storiche nella città di Matera. In Atti VI Rassegna Urbanistica Nazionale; INU Edizioni: Roma, Italy, 2010. [Google Scholar]
- Manfreda, S.; Mita, L.; DalSasso, S.F.; Dibernardi, F.R.; Ermini, R.; Mininni, M.V.; Bixio, A.; Conte, A.; Fiorentino, M. La Gestione delle risorse idriche nella Città dei Sassi (Matera). L’Acqua 2016, 3, 39–46. [Google Scholar]
- Huff, F.A.; Changnon, S.A. Climatological assessment of urban effects on precipitation at St Louis. J. Appl. Meteorol. 1972, 11, 823–842. [Google Scholar] [CrossRef]
- Shepherd, J. A review of current investigations of urban-induced rainfall and recommendations for the future. Earth Interact. 2005, 9, 1–27. [Google Scholar] [CrossRef]
- Burian, S.; Shepherd, J. Effect of urbanization on the diurnal rainfall pattern in Houston. Hydrol. Process. 2005, 19, 1089–1103. [Google Scholar] [CrossRef]
- Ashley, W.S.; Bentley, M.L.; Stallins, J.A. Urban induced thunderstorm modification in the Southeast United States. Clim. Change 2012, 113, 481–498. [Google Scholar] [CrossRef]
- Gash, J.H.C.; Rosier, P.T.W.; Ragab, R. A note on estimating urban roof runoff with a forest evaporation model. Hydrol. Process. 2008, 22, 1230–1233. [Google Scholar] [CrossRef]
- Ragab, R.; Rosier, P.; Dixon, A.; Bromley, J.; Cooper, J.D. Experimental study of water fluxes in a residential area: 2. Road infiltration, runoff and evaporation. Hydrol. Process. 2003, 17, 2423–2437. [Google Scholar] [CrossRef]
- Shaw, E.M.; Beven, J.K.; Chappell, N.A.; Lamb, R. Hydrology in Practice, 4th ed.; CRCPress: London, UK, 2010. [Google Scholar]
- Whelans Consultants. Planning and Management Guidelines for Water Sensitive Urban (Residential) Design, Report Prepared for the Department of Planning and Urban Development of Western Australia; Whelans; Mount Hawthorn, Australia: Perth, Australia, 1994; ISBN 0646154680. [Google Scholar]
- Brundtland, G. Report of the World Commission on Environment and Development: Our Common Future; United Nations General Assembly Document A/42/427; United Nations: New York, NY, USA, 1987. [Google Scholar]


| Area Type | φi |
|---|---|
| Concrete or Asphalt pavement | 0.8–0.9 |
| Commercial and Industrial | 0.7–0.9 |
| Gravel Roadways and Shoulders | 0.5–0.7 |
| Residential—Urban | 0.6–0.8 |
| Residential—Suburban | 0.4–0.6 |
| Undeveloped | 0.1–0.3 |
| Berms | 0.1–0.3 |
| Agricultural | 0.1–0.4 |
| Year | Surface | Ai km2 | Ai % | φi | φ | |||
|---|---|---|---|---|---|---|---|---|
| Type | km2 | % | ||||||
| 1875 | urban | imp | 131,850 | 19.98 | 179,256 | 27.16 | 0.8 | 0.36 |
| road | 47,406 | 7.18 | ||||||
| green | per | 480,744 | 72.84 | 480,744 | 72.84 | 0.2 | ||
| 1954 | urban | imp | 196,230 | 29.73 | 272,580 | 41.3 | 0.8 | 0.45 |
| road | 76,350 | 11.57 | ||||||
| green | per | 387,420 | 58.7 | 387,420 | 58.7 | 0.2 | ||
| 2016 | urban | imp | 311,928 | 47.26 | 468,600 | 71 | 0.8 | 063 |
| road | 156,672 | 23.74 | ||||||
| green | per | 191,400 | 19 | 191,400 | 19 | 0.2 | ||
| Year | Duration (Hour) | Year | Duration (Hour) | ||||||||
|---|---|---|---|---|---|---|---|---|---|---|---|
| 1 | 3 | 6 | 12 | 24 | 1 | 3 | 6 | 12 | 24 | ||
| 2022 | 23.8 | 27 | 28.8 | 28.8 | 28.8 | 1969 | 35.6 | 42.8 | 42.8 | 47.4 | 51.6 |
| 2021 | 32 | 32 | 32.2 | 35 | 44.6 | 1968 | 28 | 32.6 | 33.6 | 33.8 | 48.8 |
| 2020 | 18 | 30.6 | 56.2 | 96 | 107.8 | 1967 | 31.8 | 31.8 | 31.8 | 31.8 | 31.8 |
| 2019 | 36.2 | 51.2 | 60.2 | 68.4 | 71.8 | 1966 | 15 | 22.8 | 24.8 | 40.4 | 56.2 |
| 2018 | 33 | 39.2 | 39.2 | 39.2 | 45.6 | 1965 | 42 | 45 | 45 | 45.4 | 55.6 |
| 2015 | 18.4 | 22.8 | 23.6 | 26.4 | 37.2 | 1964 | 20.4 | 23.6 | 26.4 | 45.2 | 48 |
| 2014 | 29.6 | 29.8 | 30.2 | 31.2 | 33.2 | 1963 | 70 | 72.6 | 72.8 | 72.8 | 83.6 |
| 2013 | 29.8 | 44.2 | 70 | 111 | 129.6 | 1962 | 21.6 | 22 | 22 | 31.2 | 37.6 |
| 2012 | 25.6 | 26.2 | 26.6 | 36.6 | 37 | 1961 | 30 | 36.6 | 36.8 | 36.8 | 36.8 |
| 2011 | 23.2 | 34.4 | 35.4 | 35.4 | 35.8 | 1960 | 24 | 34.2 | 38.2 | 47 | 53.6 |
| 2010 | 34 | 48.6 | 59.8 | 63.4 | 63.6 | 1959 | 33 | 77 | 91.6 | 104 | 174 |
| 2009 | 47.6 | 51 | 55.4 | 55.4 | 78 | 1958 | 33.4 | 43 | 46.2 | 67.4 | 76 |
| 2008 | 17.2 | 20.8 | 30.8 | 39.4 | 40.6 | 1957 | 33 | 55 | 90 | 94.8 | 101 |
| 2007 | 23 | 50 | 56.8 | 71.6 | 86.2 | 1956 | 34 | 60 | 67.8 | 67.8 | 67.8 |
| 2006 | 28.2 | 36 | 37 | 37 | 50.2 | 1955 | 21 | 23 | 29.6 | 44.2 | 49.6 |
| 2005 | 18.6 | 23 | 26.4 | 34.8 | 41 | 1954 | 45.8 | 45.8 | 45.8 | 45.8 | 65.2 |
| 2004 | 16.8 | 19.6 | 33.2 | 40.4 | 47 | 1953 | 35.8 | 42.2 | 43 | 43.6 | 47.2 |
| 2003 | 15 | 29 | 35.4 | 47 | 53.6 | 1951 | 34 | 43 | 56 | 67.4 | 72.2 |
| 2002 | 16.4 | 25 | 40 | 48.2 | 50.6 | 1950 | 18 | 28.6 | 29.8 | 29.8 | 32.4 |
| 2001 | 27.8 | 29.8 | 45.6 | 48.2 | 48.6 | 1949 | 20.4 | 36.8 | 60.8 | 70 | 74 |
| 2000 | 16.6 | 18.6 | 22.8 | 32.6 | 51.2 | 1948 | 31 | 39.4 | 45 | 47 | 47.4 |
| 1999 | 33.2 | 34.6 | 34.6 | 34.6 | 37.2 | 1947 | 15.8 | 31 | 39 | 40.6 | 41 |
| 1998 | 20.6 | 31.6 | 27.4 | 27.4 | 41.8 | 1946 | 17.2 | 17.6 | 20.2 | 30.6 | 45 |
| 1997 | 21 | 25.8 | 32.2 | 42 | 48.2 | 1945 | 19.8 | 21 | 21.4 | 22 | 32.6 |
| 1996 | 36.8 | 46.4 | 48.2 | 48.4 | 48.4 | 1944 | 42 | 46.8 | 46.8 | 46.8 | 47 |
| 1995 | 31.8 | 37.2 | 60 | 63.6 | 63.8 | 1943 | 16.6 | 21 | 30 | 38.2 | 39.8 |
| 1994 | 19.2 | 26.8 | 27.8 | 35.4 | 47.4 | 1942 | 14.4 | 23.2 | 36.2 | 52.4 | 61.2 |
| 1993 | 18 | 35 | 36.2 | 36.4 | 37.6 | 1941 | 33 | 41.2 | 45.5 | 62 | 63.2 |
| 1992 | 38.8 | 39.6 | 39.6 | 39.6 | 39.8 | 1940 | 19.8 | 38 | 44 | 48 | 62.8 |
| 1991 | 35.4 | 40.2 | 40.2 | 40.2 | 40.2 | 1939 | 34 | 37.8 | 37.8 | 39.4 | 46.6 |
| 1988 | 20.6 | 29.2 | 39.2 | 42.8 | 51 | 1938 | 17 | 25.5 | 30 | 49.3 | 65 |
| 1971 | 20.4 | 24.2 | 29 | 29.2 | 29.2 | 1937 | 11 | 13.6 | 13.7 | 13.7 | 13.7 |
| 1970 | 36 | 39.6 | 47.4 | 47.6 | 47.8 | ||||||
| Tr | a | n | DDF | IDF |
|---|---|---|---|---|
| 5 | 38.54 | 0.24 | h = 38.54 t0.24 | i = 38.54 t−0.76 |
| 10 | 44.20 | 0.24 | h = 44.20 t0.24 | i = 44.20 t−0.76 |
| 20 | 49.63 | 0.25 | h = 49.63 t0.25 | i = 49.63 t−0.75 |
| Year | Surface Type and % | tc (hours) | i(tc) (mm/h) | Qmax (m3/s) | ||
|---|---|---|---|---|---|---|
| 1875 | Impervious | 27.16 | 0.36 | 0.35 | 85.7 | 5.7 |
| Pervious | 72.84 | |||||
| 1954 | Impervious | 41.3 | 0.45 | 0.35 | 85.7 | 7.0 |
| Pervious | 58.7 | |||||
| 2016 | Impervious | 71 | 0.63 | 0.35 | 85.7 | 9.8 |
| Pervious | 29 | |||||
Disclaimer/Publisher’s Note: The statements, opinions and data contained in all publications are solely those of the individual author(s) and contributor(s) and not of MDPI and/or the editor(s). MDPI and/or the editor(s) disclaim responsibility for any injury to people or property resulting from any ideas, methods, instructions or products referred to in the content. |
© 2024 by the authors. Licensee MDPI, Basel, Switzerland. This article is an open access article distributed under the terms and conditions of the Creative Commons Attribution (CC BY) license (https://creativecommons.org/licenses/by/4.0/).
Share and Cite
Ermini, R.; Fattore, C.; Zoubi, A.A. Hydromorphic Impact of Matera’s Urban Area. Geographies 2024, 4, 152-167. https://doi.org/10.3390/geographies4010010
Ermini R, Fattore C, Zoubi AA. Hydromorphic Impact of Matera’s Urban Area. Geographies. 2024; 4(1):152-167. https://doi.org/10.3390/geographies4010010
Chicago/Turabian StyleErmini, Ruggero, Carmen Fattore, and Amir Aubed Zoubi. 2024. "Hydromorphic Impact of Matera’s Urban Area" Geographies 4, no. 1: 152-167. https://doi.org/10.3390/geographies4010010
APA StyleErmini, R., Fattore, C., & Zoubi, A. A. (2024). Hydromorphic Impact of Matera’s Urban Area. Geographies, 4(1), 152-167. https://doi.org/10.3390/geographies4010010