Abstract
This study compared executive functions, anthropometric profile, and dietary habits in adolescent girls with and without eating disorder (ED) symptoms. The main objective was to determine the relationship between the presence of ED symptoms and the degree of executive function impairment. A case–control design was used with 209 Mexican adolescents who completed ED screening questionnaires. Of the total sample, 54 participants scored above the clinical cutoff, and 39 of them completed both the BANFE-2 assessment and the anthropometric measurements. These 39 adolescents with ED symptoms were matched with an equal number of adolescents without symptoms to form the control group. Additionally, 21 adolescents in the ED symptoms group and 25 in the control group completed the 24 h dietary recall and food frequency questionnaires. The main findings were as follows: the prevalence of ED symptoms was 25.8%. Adolescents with ED symptoms showed higher body mass index, waist circumference, body fat percentage, and neck circumference compared with those without symptoms. They also exhibited poorer inhibitory control, reflected in a greater number of errors, along with non-significant trends toward lower performance on the maze test, Card Sorting, and Card Game. Dietary inadequacy was also more pronounced in the ED symptoms group. Furthermore, the presence of ED symptoms significantly increased the likelihood of severe executive function impairment. In conclusion, adolescents with ED symptoms demonstrated an altered anthropometric profile, dietary deficiencies, and reduced inhibitory control.
1. Introduction
Eating disorders (EDs) are serious alterations in eating that harm physical and psychological health [1]. They include anorexia (AN) and bulimia nervosa (BN), often developing between ages 15 and 20 [2]. Although EDs can affect individuals of any gender, they are most frequently reported in women. The etiology of EDs is heterogeneous and involves biological, psychological, developmental, and sociocultural factors [3]. Social pressure to be thin, body dissatisfaction, restrictive eating practices, and negative affect are among the main predictors of ED symptomatology [3]. Symptoms involve body dissatisfaction and risky eating behaviors (REBs), such as a restrictive diet, fasting, excessive exercise, self-induced vomiting, and the use of laxatives and diuretics [3,4]. If left untreated, these symptoms tend to become more severe and complex over time [5].
The prevalence of EDs in women between 2000 and 2018 was as follows: AN, 1.4% (0.1–3.6%), and BN, 1.9% (0.3–4.6%) [6]. However, the prevalence of REBs is higher than that of AN and BN, with prevalences between 7.9% and 51.7% [7,8].
Regardless of the specific ED diagnosis, patients experience significant dietary changes. Those with AN have low energy intake and insufficient micronutrients, while people with BN consume high energy intake and excess sodium [9]. These types of eating patterns perpetuate the EDs, causing medical complications [10], cognitive impairments, and changes in body composition. Thus, body composition measures are key indicators for screening and monitoring of EDs. Research shows that higher BMI or fat mass increases the likelihood of ED risk, whereas each tenth-point increase in the waist-to-hip ratio reduces this risk by 50%. Overweight status is also more common among girls at risk for an ED [11].
Research indicates that individuals diagnosed with EDs experience impaired executive functions (EFs), including change in sets, control of interference, cognitive flexibility, impulsivity, working memory, planning, emotional regulation, decision-making, and processing speed, compared to those without such diagnoses [12,13,14,15,16].
Findings from studies in which EFs were evaluated in a sample of individuals with REBs [17,18] have indicated that emotional control appears to be a factor that predicts the execution of these REBs. At the same time, the findings confirmed that the greater the level of severity of the REBs is, the greater the effect on the EFs.
Existing research primarily examines EF decline in individuals diagnosed with EDs to inform treatment. Less is known about EF deterioration in those exhibiting ED symptoms. This line of inquiry is crucial, as it can clarify whether the neuropsychological impairments observed in patients with EDs are consequences of the disorder or represent pre-existing vulnerabilities. Since diet quality, anthropometric profiles, and cognitive changes often overlap in REBs and EDs, it is crucial to examine their associations to support the need for a more integrated approach to understand this psychopathology.
This study aims to compare EFs, anthropometric data, and diets in adolescent women with and without ED symptoms. A key goal was to determine the relationship between the presence of ED symptoms and the degree of EF impairment.
2. Materials and Methods
2.1. Participants and Design
The design of this study was case–control, with a sample composed of adolescent women from two public preparatory schools in Ocozocoautla de Espinosa, Chiapas, Mexico.
To form the groups with and without symptomatology, a representative sample size was first calculated based on the total population of both schools, resulting in 200 participants. In total, 233 adolescents agreed to participate and answered three ED screening questionnaires. A total of 24 participants who did not complete 80% of the questions were excluded, leaving a final sample of 209 adolescents.
The inclusion criteria for this study were as follows: (a) being female and (b) exceeding the cut-off point in the ED screening questionnaires. Initially, 54 participants met these criteria, but 15 dropped out after the first stage, leaving 39 adolescents with symptoms. A comparison group of 39 asymptomatic females was then randomly selected, ensuring they did not exceed the cutoff on any ED screening questionnaire (see Figure 1). The characteristics of the sample are shown in Table 1.
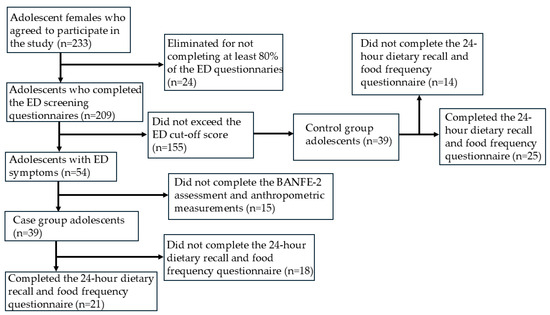
Figure 1.
Flowchart of participant selection and classification.

Table 1.
Characteristics of the study sample.
2.2. Measures
2.2.1. ED Symptoms
The Eating Attitudes Test-40 (EAT-40) is a self-report questionnaire of 40 questions designed in the form of a Likert-type scale with 6 response options. The EAT-40 was adapted and validated for the Mexican population, with an alpha coefficient of 0.93. A score ≥ 28 indicates the presence of AN symptoms [19].
The bulimia test (BULIT) evaluates and detects the presence of BN symptoms; it consists of 36 items with 5 response options. With respect to the validity and reliability of the instrument for use in the Mexican population, nonclinical and clinical [20], the cut-off point was established at ≥85.
The Body Shape Questionnaire (BSQ) assesses the presence of concern and dissatisfaction with one’s body image; it consists of 34 items with 6 response options. The BSQ was validated for use in the Mexican population [21], and the internal consistency for the full scale was 0.92. A score ≥ 110 indicates body dissatisfaction.
2.2.2. Executive Functioning
The Executive Functions and Frontal Lobe Battery (BANFE-2) was designed to evaluate the cognitive processes that depend on the prefrontal cortex [22]. The BANFE-2 has been validated for use in the Mexican population for individuals of ages and levels of education ranging from 6 to 80 years. A registration protocol, application sheets, a card game, cards for card classification, maze sheets, and a stopwatch were used to administer the BANFE-2. In this study, inhibitory control (Stroop test forms A and B), rule-following (maze test), risk–benefit processing (card game task is based on the Iowa Gambling Task), and mental flexibility (card classification is based on the Wisconsin Card Sorting Test) were analyzed.
According to the EF performance in the BANFE-2 test, cut-off points of the normalized total score were established and grouped into four classifications: ≥116 (high normal), 85–115 (normal), 70–84 (slight alteration-moderate), and ≤69 (severe impairment).
2.2.3. Anthropometric Measurements
Body mass index (BMI). This index was recorded using a calibrated scale (Tanita BC-601; Tokyo, Japan) with an accuracy of 100 g. To measure the height in centimeters, a stadiometer (Seca, Hamburg, Germany), with a precision of 1 mm, was used. BMI was calculated by dividing the weight of each student in kilograms by the square of their height in meters (kg/m2). For the BMI classification, the following criteria of the World Health Organization [23] were used: underweight (<−3 SD), normal weight (<−2 to ≤+1 SD), overweight (>+1 SD), and obese (>+2 SD).
Neck circumference (NC): NC was measured with a flexible measuring tape (Bodyfit) with a precision of 1 mm. An NC of ≥33 cm in female adolescents was considered a screening tool for overweight and obesity [24].
Waist circumference (WC): WC was measured with a flexible tape measure (Bodyfit) with an accuracy of 1 mm (Seca GmbH & Co. KG, Hamburg, Germany). A WC ≥ 80 cm in female adolescents was considered to indicate abdominal obesity [25].
Percentages of fat and muscle mass: Bioelectrical impedance analysis was performed with a scale (TANITA Corporation, Tokyo, Japan). A body fat percentage ≥ 30% for female adolescents was considered excess body fat [26].
The 24 h dietary recall and the 7-day food frequency questionnaire (FFQ) were used to assess dietary intake. A trained dietitian administered the 24 h recall using the standardized multiple-pass method. Participants were asked to report their intake from a typical day, defined as a usual weekday without illness, celebrations, or atypical eating patterns. The information was entered into the NutriKcal®VO program to estimate total caloric intake, macronutrient distribution, and food group consumption, allowing for the evaluation of dietary sufficiency and nutritional balance. Additionally, a validated 7-day FFQ for adolescents was administered to complement the assessment of dietary variety, sufficiency, and macronutrient balance. Although FFQ results are not presented in a separate table, they contributed to the classification of dietary sufficiency and macronutrient adequacy.
2.3. Procedure
The research protocol was presented to the school authorities for approval. Following school authority approval, the study’s objectives were explained to participants and teachers, who provided consent and assent, respectively. The study adhered to the Declaration of Helsinki and was approved by the Research Ethics Committee of the Hospital de Especialidades Pediátricas (HEP-CEI-01/20-04-2023) in Tuxtla Gutiérrez, Chiapas.
The first stage of this study involved administering the EAT-40, BULIT, and BSQ in the places designated by each of the two preparatory schools, from 7:00 to 10:30 AM. Responses were then analyzed to identify participants exceeding cutoff scores. The adolescents who made up the group with ED symptoms and the group without symptoms were selected.
In the second stage, anthropometric measurements were taken, with participants instructed to wear light clothing and fast beforehand.
In the third stage, the BANFE-2 test was individually administered in a quiet, well-lit environment by trained examiners. The tests were subsequently carried out in the following order: solving the mazes, card classification task, Stroop effect sheet form A, the card game task, and Stroop effect sheet form B. The average participant test completion time was 20 min.
In the fourth stage, participants completed 24 h dietary recalls and the food frequency questionnaire. Only 25 participants in the group without ED symptoms and 21 in the group with ED symptoms completed this stage. Therefore, the analysis of these data is based on smaller samples compared with the other measures.
2.4. Statistical Analysis
Before conducting the analyses, data normality was assessed using the Kolmogorov–Smirnov test. The variables age, height, weight, and BMI showed a normal distribution (p > 0.05) and homogeneity of variances (p > 0.05) according to Levene’s test. In contrast, the diet variables and BANFE-2 scores did not meet normality assumptions (p < 0.05). Differences in age, height, weight, BMI, WC, NC, and body composition were analyzed using Student’s t-tests or chi-square tests, as appropriate. Non-parametric group comparisons of dietary data and BANFE-2 results were conducted using Mann–Whitney U tests, with effect sizes computed. Associations between ED symptoms and executive function impairment were assessed using odds ratios (OR). Statistical analyses were performed using IBM SPSS version 28, with significance set at p < 0.05.
3. Results
The prevalence of ED symptoms within the 209 adolescents was 25.8%. Anthropometric and neuropsychological data were analyzed for both groups. The group with symptoms of an ED had a higher body weight (59.96 kg vs. 52.00 kg; p = 0.000) and BMI (25.15 kg/m2 vs. 21.59 kg/m2; p = 0.000) compared to the group without symptoms. They also had a significantly larger WC (78.98 cm vs. 72.61 cm; p = 0.000), although obesity prevalence based on WC was not statistically significant (p = 0.052).
Overweight and obesity prevalence by BMI was significantly higher in the group with ED symptoms than in the group without symptoms (53.8% vs. 10.2%; X2 = 20.29; p = 0.000). Neck circumference (NC) was significantly higher in adolescents with ED symptoms compared to those without symptoms (33.93 cm vs. 32.08 cm; p = 0.001). Using the screening cutoff ≥ 33 cm, a greater proportion of adolescents in the ED symptoms group presented high NC (above the cutoff) compared with the group without symptoms (76.92% vs. 30.77%; X2 = 14.90; p < 0.001), with a significant between-group difference in NC measurement.
Adipose tissue percentage was significantly higher in the group with ED symptoms (27.45% vs. 24.11%; p = 0.015), who had a higher prevalence of obesity according to this indicator (28.21% vs. 5.13%; p < 0.001). However, no significant differences in EF impairment levels (mild, moderate, or severe levels) were observed between groups (64.1% vs. 46.1%; X2 = 5.48; p = 0.140) (see Table 1 for additional data).
Table 2 summarizes the EF domains most affected in adolescents with ED symptoms. Mann–Whitney U tests indicated that the group without ED symptoms scored significantly higher than the ED symptoms group for both natural (U = 554, Z = −2.07, p = 0.04) and scrambled (U = 555.5, Z = −2.05, p = 0.04) orbitomedial executive tasks, with medium effect size (r = −0.33 and r = −0.32, respectively) and statistical power (1−β = 0.99 and 1−β = 0.61, respectively).
Table 2.
Comparison of the EF performance in the BANFE-2 test among adolescents with and without ED symptoms.
Adolescents with ED symptoms made significantly more errors in the Stroop A test (U = 958, p = 0.04, medium effect size r = 0.32, statistical power 1−β = 1.00). No other EF domains showed significant group differences. However, statistical trends suggested differing EF performance patterns between the two groups.
Participants with ED symptoms (n = 39) were three times more likely to exhibit severe EF impairment [OR = 3.0, 95% confidence interval (CI) = 1.01–8.88; p = 0.047] compared to those without symptoms, after categorizing impairment as normal, global, mild/moderate, or severe. Global (OR = 2.08, p = 0.11) or mild/moderate (OR = 1.35, p = 0.60) EF impairment was not significantly associated with ED symptoms (see Table 3).
Table 3.
Association between the symptoms of an eating disorder and impaired executive functioning in adolescents.
Dietary intake, assessed by 24 h recall, revealed a significant difference in food sufficiency between adolescents with and without ED symptoms, with statistical power 1−β = 1.00, as well as a trend towards different caloric intakes when analyzed as a continuous variable (Table 4). However, when sufficiency was examined categorically (insufficient/enough/generous), the comparison did not reach statistical significance (Table 5).
Table 4.
Twenty-four-hour dietary recall for adolescents with and without ED symptoms.
Table 5.
Diet quality in adolescents with and without ED symptoms.
While dietary quality and macronutrient balance were not significantly different, it is worth noting that, within the group with ED symptoms, 85.7% had dietary insufficiency, whereas 42.86% had excessive consumption of proteins and lipids (Table 5).
4. Discussion
This study compared EF, anthropometric profile, and diet in adolescent women with/without ED symptoms and examined the link between ED symptoms and EF impairment. The study revealed three key findings. Firstly, the ED symptoms group had significantly different BMI, WC, NC, and body fat percentage compared to the group without ED symptoms. Secondly, regarding dietary insufficiency, adolescents with ED symptoms had insufficient food intake, which could be linked to the deficits observed in their EF. Finally, the ED symptoms group displayed triple the likelihood of severe EF impairment.
In the total sample (N = 209), a 25.8% prevalence of ED symptoms was found, exceeding the 18–22% reported in general Mexican and international populations [8]. This emphasizes the need for targeted eating habit interventions to improve public health locally, nationally, and internationally.
4.1. Alterations in the Anthropometric Profile: BMI, WC, NC, and Percentage of Body Fat
Consistent with prior research, adolescents with ED symptoms in this study had significantly higher BMI than those without [11,27].
To our knowledge, previous studies that have documented a significant association between ED symptoms and an increase in NC in adolescents are lacking in the literature. Although NC is not a diagnostic criterion for overweight/obesity, it is a useful anthropometric indicator associated with increased adiposity and cardio metabolic risk. Therefore, the elevated prevalence of high NC in the ED symptoms group provides further evidence of an altered anthropometric profile in this population and supports the interpretation that adolescents with ED symptoms may present early markers of excess adiposity, which shares risk and maintenance factors with ED, since co-occurring obesity and ED may exacerbate each other’s severity [28].
4.2. Adolescents with Symptoms of EDs Present with Dietary Insufficiency
The results obtained in this study align with existing literature showing that dietary insufficiency frequently manifests in adolescents with ED symptoms, especially restrictive types [29]. This may stem from a desire to lose weight, leading to inappropriate macronutrient and food group restriction. While this study found no significant differences in specific nutrient/food group intake, dietary insufficiency was still significantly higher in adolescents with ED symptoms.
Given the importance of diet quality for adolescent health, this study assessed variety, adequacy, and balance [30]. The findings inform the design of dietary interventions aimed at improving diet quality and reducing the risk of non-communicable diseases, including eating disorders [31].
4.3. Deficit in Inhibitory Control in Adolescent Girls with ED Symptoms
Adolescents with ED symptoms performed worse on the orbitomedial EF test and made more Stroop A errors compared to controls. They also had fewer hits on Stroop A/B and lower card game scores. In contrast, a non-significant trend showed higher scores on the maze test and card classification task within the ED group.
Inhibitory control is key to regulating eating behavior. Deficits in this EF may increase the risk of problematic eating, including obesity or EDs [32]. Research links EDs to poor executive functioning [33,34], which has been associated with greater ED severity [35].
In our study, despite not having a clinical diagnosis of ED, we observed a non-significant trend in which adolescents with ED symptoms tended to make more maintenance errors on the WCST. This pattern might suggest cognitive flexibility deficits, consistent with the literature, suggesting that such alterations manifest even in individuals with symptoms only. However, given the lack of significance, this interpretation should be considered exploratory and interpreted with caution.
Thus, these findings underscore the importance of evaluating executive functioning in adolescents with ED symptoms, since the presence of a deterioration in inhibitory control could contribute to the persistence of REBs and hinder recovery.
4.4. Clinical Implications
Given that adolescents with ED symptoms displayed altered EF, especially inhibitory control, early assessment is crucial for preventative intervention. The link between EF, anthropometric profile, and diet emphasizes the need for multidisciplinary treatment, encompassing nutritional, psychological, and cognitive strategies, in adolescents with ED symptoms [36]. Increased BMI, WC, fat percentage, and NC, together with the identification of REBs, could increase the risk of metabolic and cardiovascular complications in this population [37]. This possibility underscores the importance of incorporating the study of biochemical markers, which allows continuous clinical monitoring during this crucial stage of development [38]. Finally, the alterations in EF detected in adolescents with ED symptoms could be relevant for the prevention and treatment of other associated disorders, such as anxiety, depression, and suicidal ideation, thus broadening the scope of prevention strategies [11].
4.5. Strengths and Limitations
Future research should include sociodemographic factors (parental education/income) to better understand ED symptoms. The study lacked male participants due to low ED prevalence in males; their inclusion is vital for sex comparisons. The absence of a binge-eating disorder (BED) screening tool is a limitation; future studies should examine BED. Expanding BANFE-2 analysis beyond four subdomains is advisable for a fuller EF profile. A major limitation concerns dietary assessment; a single recall does not reflect habitual dietary intake. More studies should incorporate multiple 24 h recalls and FFQ. Correlating ED symptoms with psychiatric, metabolic, anthropometric alterations, and genetic markers (D2/D4 receptor polymorphisms) might yield personalized prevention/treatment strategies. Further research is needed to explore the neurodevelopmental, metabolic, and dietary impact of EDs. Future studies should investigate the mechanisms and interventions for mitigating long-term health consequences.
5. Conclusions
This study showed that adolescents with ED symptoms already show higher rates of overweight/obesity (BMI, WC, NC, fat percentage), impaired executive function (especially inhibitory control), and dietary insufficiency (85%). These results point toward relationships among ED symptoms, obesity, cognitive function, and restrictive eating, highlighting the need for early prevention with a multifactorial approach.
Author Contributions
Conceptualization: R.C.-T., C.A.J.-Z., and D.A.D.-M. Methodology: R.C.-T., C.A.J.-Z., D.A.D.-M., E.F.-G., A.P.-J., J.G.T.-J., A.B.-A. and A.A.-H. Validation: J.C.C.-G. and J.V.E.-J. Formal analysis: R.C.-T., C.A.J.-Z., D.A.D.-M., A.P.-O. and A.A.-H. Investigation: R.C.-T., D.A.D.-M., E.F.-G., A.P.-J., J.G.T.-J. and A.B.-A. Resources: C.A.J.-Z., E.F.-G., A.P.-J., J.C.C.-G. and J.V.E.-J. Data curation: R.C.-T. and D.A.D.-M. Writing—original draft preparation: R.C.-T., D.A.D.-M., A.P.-O. and A.A.-H. Writing—review and editing: A.P.-O. and A.A.-H. Visualization: A.P.-O. and A.A.-H. Supervision: J.C.C.-G. and J.V.E.-J. Project administration: C.A.J.-Z., E.F.-G., A.P.-J., J.G.T.-J., and A.B.-A. All authors have read and agreed to the published version of the manuscript.
Funding
This research received no external funding.
Institutional Review Board Statement
The study was conducted in accordance with the Declaration of Helsinki and approved by the Research Ethics Committee of the Hospital de Especialidades Pediátricas (HEP-CEI-01/20-04-2023) in Tuxtla Gutiérrez, Chiapas on 20 April 2023.
Informed Consent Statement
Informed consent was obtained from all subjects involved in the study.
Data Availability Statement
The datasets generated during and/or analyzed during the current study are available from the corresponding author on reasonable request.
Conflicts of Interest
The authors declare no conflicts of interest.
Abbreviations
The following abbreviations are used in this manuscript:
| EF | Executive functions |
| ED | Eating disorders |
| REBs | Risky eating behaviors |
| BMI | Body mass index |
| NC | Neck circumference |
| WC | Waist circumference |
References
- American Psychiatric Association. Manual Diagnóstico y Estadístico de los Trastornos Mentales: DSM-5-TR; Texto Revisado; American Psychiatric Association: Washington, DC, USA, 2022. [Google Scholar]
- Dinkler, L.; Taylor, M.J.; Råstam, M.; Hadjikhani, N.; Bulik, C.M.; Lichtenstein, P.; Gillberg, C.; Lundström, S. Association of etiological factors across the extreme end and continuous variation in disordered eating in female Swedish twins. Psychol. Med. 2021, 51, 750–760. [Google Scholar] [CrossRef]
- Brytek-Matera, A.; Czepczor, K. Models of eating disorders: A theoretical investigation of abnormal eating patterns and body image disturbance. Arch. Psychiatry Psychoter. 2017, 19, 16–26. [Google Scholar] [CrossRef]
- Stice, E.; Desjardins, C.D.; Rohde, P.; Shaw, H. Sequencing of symptom emergence in anorexia nervosa, bulimia nervosa, binge eating disorder, and purging disorder and relations of prodromal symptoms to future onset of these disorders. J. Abnorm. Psychol. 2021, 130, 377–387. [Google Scholar] [CrossRef]
- Alvarado, N.; Silva, C. Executive functions and symptoms associated with eating disorders. Rev. Latinoam. Psicol. 2014, 46, 189–197. [Google Scholar] [CrossRef]
- Hay, P. Current approach to eating disorders: A clinical update. Intern. Med. J. 2020, 50, 24–29. [Google Scholar] [CrossRef]
- López-Gil, J.F.; García-Hermoso, A.; Smith, L.; Firth, J.; Trott, M.; Mesas, A.E.; Jiménez-López, E.; Gutiérrez-Espinoza, H.; Tárraga-López, P.J.; Victoria-Montesinos, D. Global proportion of disordered eating in children and adolescents: A systematic review and meta-analysis. JAMA Pediatr. 2023, 177, 363–372. [Google Scholar] [CrossRef] [PubMed]
- Ortega-Luyando, M.; Amaya-Hernández, A.; Alvarez-Rayón, G.; Vázquez-Arévalo, R.; Mancilla-Díaz, J.M. Prevalencia de las conductas alimentarias de riesgo. Un análisis de dos décadas. In Investigaciones en Comportamiento Alimentario. Reflexiones, Alcances y Retos; López-Espinoza, A., Martínez, A.G., Aguilera-Cervantes, V.G., Eds.; Porrúa: Mexico City, Mexico, 2018; pp. 129–164. [Google Scholar]
- Jenkins, P.E.; Proctor, K.; Snuggs, S. Dietary intake of adults with eating disorders: A systematic review and meta-analysis. J. Psychiatr. Res. 2024, 175, 393–404. [Google Scholar] [CrossRef] [PubMed]
- Arija-Val, V.; Santi-Cano, M.J.; Novalbos-Ruiz, J.P.; Canals, J.; Rodríguez-Martín, A. Caracterización, epidemiología y tendencias de los trastornos de la conducta alimentaria. Nutr. Hosp. 2022, 39, 8–15. [Google Scholar] [CrossRef] [PubMed]
- Babio, N.; Canals, J.; Pietrobelli, A.; Pérez, S.; Arija, V. A two-phase population study: Relationships between overweight, body composition and risk of eating disorders. Nutr. Hosp. 2009, 24, 485–491. [Google Scholar] [PubMed]
- Diaz-Marsa, M.; Pemau, A.; de la Torre-Luque, A.; Vaz-Leal, F.; Rojo-Moreno, L.; Beato-Fernandez, L.; Graell, M.; Carrasco-Diaz, A.; Carrasco, J.L. Executive dysfunction in eating disorders: Relationship with clinical features. Prog. Neuro-psychopharmacol. Biol. Psychiatry 2023, 120, 110649. [Google Scholar] [CrossRef]
- Kelly, N.R.; Jaramillo, M.; Ramirez, S.; Altman, D.R.; Rubin, S.G.; Yang, S.B.; Courville, A.B.; Shank, L.M.; Byrne, M.E.; Lemay-Russell, S.; et al. Executive functioning and disinhibited eating in children and adolescents. Ped. Obes. 2020, 15, e12614. [Google Scholar] [CrossRef]
- Lozano-Madrid, M.; Clark Bryan, D.; Granero, R.; Sánchez, I.; Riesco, N.; Mallorquí-Bagué, N.; Jiménez-Murcia, S.; Treasure, J.; Fernández-Aranda, F. Impulsivity, Emotional Dysregulation and Executive Function Deficits Could Be Associated with Alcohol and Drug Abuse in Eating Disorders. J. Clin. Med. 2020, 9, 1936. [Google Scholar] [CrossRef]
- Malagoli, C.; Cerro, P.F.; Vecchiato, C.; Usai, M.C. Cognitive and emotional regulation in adolescents and young women with eating disorders. Eat. Weight Disord. 2021, 26, 375–383. [Google Scholar] [CrossRef] [PubMed]
- Nelson, T.D.; James, T.D.; Nelson, J.M.; Johnson, A.B.; Mason, W.A.; Yaroch, A.L.; Espy, K.A. Associations between specific components of executive control and eating behaviors in adolescence: A study using objective and subjective measures. Appetite 2020, 154, 104784. [Google Scholar] [CrossRef] [PubMed]
- Cecilia-Costa, R.; Hansmann, M.; McGill, D.E.; Volkening, L.K.; Laffel, L.M. Association of executive function problems and disordered eating behaviours in teens with type 1 diabetes. Diabet. Med. 2021, 38, e14652. [Google Scholar] [CrossRef]
- Ciszewski, S.; Flood, K.E.; Proctor, C.J.; Best, L.A. Exploring the relationship between disordered eating and executive function in a non-clinical sample. Percept. Mot. Ski. 2020, 127, 1033–1050. [Google Scholar] [CrossRef]
- Alvarez-Rayón, G.; Mancilla-Díaz, J.M.; Vázquez-Arévalo, R.; Unikel-Santoncini, C.; Caballero-Romo, A.; Mercado-Corona, D. Validity of the Eating Attitudes Test: A study of Mexican eating disorders patients. Eat. Weight Disord. 2004, 9, 243–248. [Google Scholar] [CrossRef] [PubMed]
- Alvarez, G.; Mancilla, J.M.; Vázquez, R. Propiedades Psicométricas del Test de Bulimia (BULIT). Psicol. Contemp. 2000, 7, 74–85. [Google Scholar]
- Vázquez, R.; Galán, J.; López, X.; Alvarez, G.L.; Mancilla, J.M.; Caballero, A.; Unikel, C. Validez del Body Shape Questionnaire (BSQ) en mujeres mexicanas. Rev. Mex. Trastor. Aliment. 2011, 2, 42–52. [Google Scholar] [CrossRef]
- Flores-Lázaro, J.; Ostrosky, F.; Lozano, A. Batería Neuropsicológica de Funciones Ejecutivas y Lóbulos Frontales-2. Banfe-2; Editorial El Manual Moderno S.A de C.V: Mexico City, Mexico, 2014. [Google Scholar]
- World Health Organization. Growth Reference Data for 5–19 Years. 2007. Available online: https://www.who.int/tools/growth-reference-data-for-5to19-years (accessed on 4 March 2025).
- Hatipoglu, N.; Mazicioglu, M.M.; Kurtoglu, S.; Kendirci, M. Neck circumference: An additional tool of screening overweight and obesity in childhood. Eur. J. Pediatr. 2010, 169, 733–739. [Google Scholar] [CrossRef]
- Zimmet, P.; Alberti, K.G.; Kaufman, F.; Tajima, N.; Silink, M.; Arslanian, S.; Wong, G.; Bennett, P.; Shaw, J.; Caprio, S.; et al. The metabolic syndrome in children and adolescents—An IDF consensus report. Pediatr. Diabetes 2007, 8, 299–306. [Google Scholar] [CrossRef]
- Castro-Quezada, I.; Flores-Guillén, E.; Núñez-Ortega, P.E.; Irecta-Nájera, C.A.; Sánchez-Chino, X.M.; Mendez-Flores, O.G.; Olivo-Vidal, Z.E.; García-Miranda, R.; Solís-Hernández, R.; Ochoa-Díaz-López, H. Dietary carbohydrates and insulin resistance in adolescents from marginalized areas of Chiapas, México. Nutrients 2019, 11, 3066. [Google Scholar] [CrossRef]
- Rouzitalab, T.; Pourghassem, B.; Amirsasan, R.; Asghari, M.; Farsad, A.; Sanoobar, M. The relationship of disordered eating attitudes with body composition and anthropometric indices in physical education students. Iran. Red Crescent Med. J. 2015, 17, e20727. [Google Scholar] [CrossRef]
- Camacho-Barcia, L.; Giel, K.E.; Jiménez-Murcia, S.; Álvarez Pitti, J.; Micali, N.; Lucas, I.; Miranda-Olivos, R.; Munguia, L.; Tena-Sempere, M.; Zipfel, S.; et al. Eating disorders and obesity: Bridging clinical, neurobiological, and therapeutic perspectives. Trends Mol. Med. 2024, 30, 361–379. [Google Scholar] [CrossRef]
- Dias, R.G.; Rech, R.R.; Halpern, R. Prevalence and associated factors of eating disorder symptoms in adolescents: A cross-sectional school-based study. BMC Psychiatry 2023, 23, 393. [Google Scholar] [CrossRef] [PubMed]
- Segovia-Siapco, G.; Paalani, M.; Oda, K.; Pribis, P.; Sabaté, J. Associations between avocado consumption and diet quality, dietary intake, measures of obesity and body composition in adolescents: The teen food and development study. Nutrients 2021, 13, 4489. [Google Scholar] [CrossRef] [PubMed]
- Ochoa-Avilés, A.; Verstraeten, R.; Huybregts, L.; Andrade, S.; Van Camp, J.; Donoso, S.; Ramírez, P.L.; Lachat, C.; Maes, L.; Kolsteren, P. A school-based intervention improved dietary intake outcomes and reduced waist circumference in adolescents: A cluster randomized controlled trial. Nutr. J. 2017, 16, 79. [Google Scholar] [CrossRef] [PubMed]
- Seidel, M.; King, J.A.; Ehrlich, S. Executive functions and eating behavior: Commentary on Steegers et al. (2021). Int. J. Eat. Disord. 2022, 55, 418–419. [Google Scholar] [CrossRef]
- Hirst, R.B.; Beard, C.L.; Colby, K.A.; Quittner, Z.; Mills, B.M.; Lavender, J.M. Anorexia nervosa and bulimia nervosa: A meta-analysis of executive functioning. Neurosci. Biobehav. Rev. 2017, 83, 678–690. [Google Scholar] [CrossRef]
- Segura-Serralta, M.; Ciscar, S.; Blasco, L.; Oltra-Cucarella, J.; Roncero, M.; Espert, R.; Elvira, V.; Pinedo-Esteban, R.; Perpiñá, C. Contribution of executive functions to eating behaviours in obesity and eating disorders. Behav. Cogn. Psychother. 2020, 48, 725–733. [Google Scholar] [CrossRef]
- Miranda-Olivos, R.; Testa, G.; Lucas, I.; Sánchez, I.; Sánchez-González, J.; Granero, R.; Jiménez-Murcia, S.; Fernández-Aranda, F. Clinical factors predicting impaired executive functions in eating disorders: The role of illness duration. J. Psychiatr. Res. 2021, 144, 87–95. [Google Scholar] [CrossRef] [PubMed]
- Schmidt, U.H.; Claudino, A.; Fernández-Aranda, F.; Giel, K.E.; Griffiths, J.; Hay, P.J.; Kim, Y.R.; Marshall, J.; Micali, N.; Monteleone, A.M.; et al. The current clinical approach to feeding and eating disorders aimed to increase personalization of management. World Psychiatry 2025, 24, 4–31. [Google Scholar] [CrossRef] [PubMed]
- Christian, A.H.; Mochari, H.; Mosca, L.J. Waist circumference, body mass index, and their association with cardiometabolic and global risk. J. CardioMetab. Syndr. 2009, 4, 12–19. [Google Scholar] [CrossRef]
- Himmerich, H.; Treasure, J. Anorexia nerviosa: Diagnostic, therapeutic, and risk biomarkers in clinical practice. Trends Mol. Med. 2024, 30, 350–360. [Google Scholar] [CrossRef] [PubMed]

Disclaimer/Publisher’s Note: The statements, opinions and data contained in all publications are solely those of the individual author(s) and contributor(s) and not of MDPI and/or the editor(s). MDPI and/or the editor(s) disclaim responsibility for any injury to people or property resulting from any ideas, methods, instructions or products referred to in the content. |
© 2025 by the authors. Licensee MDPI, Basel, Switzerland. This article is an open access article distributed under the terms and conditions of the Creative Commons Attribution (CC BY) license (https://creativecommons.org/licenses/by/4.0/).