Abstract
Adolescence is a critical period for growth and development, yet research on dietary quality and its influencing factors among Senegalese adolescent girls is limited. This study aims to assess dietary quality, with a focus on dietary diversity (DD), and identify its determinants in a nationally representative sample of adolescent girls in Senegal. A cross-sectional study was conducted in 2023 among 600 girls aged 10–19 years. Food intake was assessed over a seven-day period to evaluate DD. Household food security and sociodemographic data were gathered through face-to-face interviews. Half the sample had adequate DD. As for consumption, 80% had breakfast daily, while the same proportion consumed one snack per day. Fruits and vegetables, meat/poultry/fish, and dairy were consumed daily by less than 25% of the sample. Sweet foods, sweet beverages, and salty and fried food were consumed by less than 10% every day. Not having been sick in the past two weeks (Odds ratio (OR): 1.53, Confidence Interval (CI): 1.05–2.22), taking breakfast daily (OR: 1.89, CI: 1.23–2.93) and micronutrients (OR: 2.75, CI: 1.54–4.92), listening to the radio at least once a week (OR: 1.66, CI: 1.05–2.63), and living in a household with access to an improved source of water (OR: 4.13, CI: 2.28–7.49) were positively associated with adequate DD. Overall, the diet of adolescent girls is of poor quality. Potential determinants of their dietary quality should be considered in future nutrition programs and policies to ensure their optimal growth and development.
1. Introduction
Globally, there are 1.3 billion adolescents (10–19 years old), equating to 16% of the total population [1]. Adolescence is a transitional period marked by physical, cognitive, and emotional changes, as well as increased openness to new experiences. Adolescence is also a period of transition from dependency on caregivers to more autonomy in food acquisition, preparation, and consumption [2]. This life stage represents a second window of opportunity to invest in optimal growth and nutrition changes that can persist over time, the first period being the 1000 days between a woman’s pregnancy and her child’s second birthday. Yet, up to now, adolescents’ nutritional needs have remained largely unaddressed [3,4]. As a result, adolescent malnutrition, such as thinness and micronutrient deficiencies, is highly prevalent in some countries [5]. Moreover, given their openness to novelty and changes, adolescents represent a vulnerable group to unhealthy commercial marketing, which may lead to the consumption of energy-dense and nutrient-poor diets, hence leading to overnutrition [6]. In fact, among this group, the prevalence of being overweight or obese has risen sharply in recent decades, while undernutrition remains a persistent challenge. UNICEF data indicate that approximately 10% of adolescents worldwide are either underweight or overweight [7]. Such situations may lead to consequences in adulthood such as non-communicable diseases or to jeopardize the life of the next generation [5].
Poor diet is a major and direct cause of malnutrition worldwide [8], especially in low- and middle-income countries (LMICs). Adolescents, especially girls, need an adequate intake of macro- and micronutrients to support their survival, growth, and development. Unfortunately, data on adolescent dietary intake are insufficient, which impedes the implementation of effective policies and programs [2,9]. According to Kupka et al. [9], the availability of nationally representative data is limited, or often nonexistent. As an example of a data gap that creates a non-nationally representative dataset, out-of-school girls are also often omitted from surveys [9,10]. This is cause for concern, as this population represents more than 50% of adolescent girls in some countries, like in Senegal [11].
Yet, the available data show a grim picture of adolescents’ diets in LMICs. Despite the World Health Organization’s (WHO) recommendation to consume a minimum of 400 g of fruit and vegetables daily, only 4 out of 10 adolescent girls living in LMICs eat fruits and vegetables each day [10]. The daily intake of animal source food is also sub-optimal, as it is estimated that only 16% consume dairy, while 46% eat meat, poultry, or fish [10]. Although the WHO recommends limiting the intake of added sugars and saturated and trans fats, in LMICs, approximately 5% of adolescent girls consumed sugar-sweetened beverages, while 20% eat fast food daily [10]. Snacking is also a common practice, as 63% of adolescent girls living in LMICs consume sweet snacks four to six times a week, and 78% of this population consume salty snacks in the same period [10].
Senegal is located on the West African coast and has a total population of about 18 million people mainly living in urban areas (54.9%) [12]. In 2023, the main exports were oil (21% of the total exportations), gold (16.5%), and fish (10.7%) [13]. Adolescents represent 25% of the total Senegalese population. Available data on their nutritional status show that 57% of adolescent girls are anemic [14], while 34.5% and 7.1% are under- and overweight, respectively [15]. Giguère-Johnson et al. [16] reported a high intake of sodium and fats among adolescent girls attending two schools in Dakar (n = 136). More than 80% also had an inadequate intake of fiber, iron, and calcium, while 54% were below the recommendation for vitamin C. Daily amounts of food were mainly issued from grain/root/tuber/plantain groups, and only 5% consumed more than 200 g of fruits per day, while none ate more than 300 g of vegetables. Altogether, the quantities of fast food, sweets, sugar-sweetened drinks, and fried and salty food represent on average 35% of the total daily amount of food consumed. About two thirds had breakfast every day. Similar findings have been reported by Fiorentino et al. [17] among Senegalese children and adolescents 5–17 years old attending schools in the Dakar area (n = 545). Results from a national survey conducted to assess iron-rich food intake and its individual and environmental determinants among adolescent girls aged 10–19 years old (n = 600) have shown that 85% of them had consumed iron-rich food the previous day or night [18]. Yet, based on our knowledge, no national nutrition survey has been conducted to investigate the general dietary intake of adolescent girls in Senegal, especially including out-of-school girls. Hence, using data that have been collected in previous research [18] but not yet analyzed, we aim to investigate dietary quality, with a focus on dietary diversity, and identify its determinants among a nationally representative group of Senegalese adolescent girls. The UNICEF conceptual framework of malnutrition [8] is used to guide our analysis. Specifically, the aim is to assess the impact of health status, underlying determinants (food security, dietary and hygiene practices, and access to health services), and resources on dietary diversity among girls.
2. Materials and Methods
2.1. Study Design and Sample
This research uses a cross-sectional design. In each region of the country, census units were randomly selected based on population proportion. Within each unit, households with at least one adolescent girl (10–19 years old) were identified, and 11 households were randomly chosen.
The calculation of the sample size was based on the expected proportion of adolescent girls aged 10–19 years old who had eaten any iron-rich food the day or night before the study using the following formula [19]: n = z2 × p (1 − p)/m2, with z (confidence interval at 95% = standard value of 1.96), a p (expected prevalence at the national level) of 50% [20], and an m (relative precision) of 0.05. As no information was available on the design effect, we applied the rule of thumb, which is to use 1.5 [21,22]. The total minimum number of adolescent girls required was 576.
2.2. Preparatory Work
Senegalese surveyors were recruited and then trained on the survey tools and methodology. Theoretical training was completed by in-class and field practical exercises to pretest the different tools.
2.3. Theoretical Framework
As per the UNICEF framework [8], dietary intake and health status, which are interlinked, are influenced by underlying determinants, namely food security, care practices, and access to health services. In turn, these are influenced by enabling causes such as resources and norms.
2.4. Data Collection
The data collection was conducted in August and September of 2023. The data on dietary diversity were collected using the food list-based questionnaire of the FAO module [23] commonly used among women 15–49 years old and adapted to the local context beforehand. It was administered through individual face-to-face interviews with adolescent girls. This tool is a simple yes/no response questionnaire of whether or not the adolescent girl has consumed food from different food groups the previous day and night.
In addition, to obtain a more detailed overview of adolescent food consumption tendencies, a food frequency questionnaire was also administered to record data on their food consumption in the past seven days. To do so, the aforementioned FAO food list-based questionnaire was adapted. The following categories of frequencies on food consumption were added to the initial questionnaire: none, once a week, 2–3 times/week, 4–6 times/week, once a day, twice a day, 3 times/day, and 4 times and above/day. Questions were also added to gather information on the following dietary practices: daily breakfast consumption, snacking habits, number of daily meals and their consumption, snacking, and consumption of multivitamins/minerals supplements and foods that were prohibited or not eaten at certain times.
The woman Demographic and Health Survey (DHS) [24] was adapted to gather information on the following characteristics among all participants: age, religion, ethnic group, relationship to the head of household, level of education and literacy, self-perception of health status, presence of illnesses in past two weeks, hand-washing habits at critical times (before preparing a meal, before eating, and after using toilets), and exposure to media.
Data on household food security were collected using the food insecurity experience survey module [25] through a face-to-face interview with the head of the household. Moreover, during the same interview, the household DHS questionnaire [24] was used to collect data on household access to health services, such as the time to reach to the closest health facility, access to improved sources of water, and sanitation. Access to financial and human resources was also assessed by the ownership of assets, housing conditions, household size, gender of the head of the household, age and level of education of the head of the household and of the spouse/adolescent caregiver, and finally, if the household was located in an urban or rural area.
2.5. Data Analysis
2.5.1. Dietary Quality
The minimum dietary diversity score was calculated for each adolescent girl using data on the food consumed the previous day and night as per the FAO methodology [23]. A score of “1” was assigned to a “yes response”, while a score of “0” was given to a “no response” to each food group of the list. The score was developed based on ten food groups, namely (1) grains, white roots and tubers, and plantains, (2) pulses (lentils, peas, and beans), (3) nuts and seeds, (4) dairy, (5) meat, poultry, and fish, (6) eggs, (7) dark green leafy vegetables, (8) other vitamin A-rich fruits and vegetables, (9) other vegetables, and (10) other fruits. Responses were summed up into a score ranging from 0 to 10. The dietary diversity score was dichotomized as adequate (score ≥ 5) or inadequate (<5) as per the FAO guidelines [23], and the proportions of adolescent girls in each category were estimated. In addition, the consumption of unhealthy food groups was also assessed by calculating the proportions of girls who had eaten (1) fried and salty food, (2) sweet food, and (3) sugar-sweetened beverages.
The proportions of girls who had consumed foods from each category were calculated, but more detailed groups and frequencies of consumption were analyzed.
2.5.2. Dietary and Hygiene Practices
Similarly, proportions of adolescent girls who reported snacking at least once between meals and having breakfast, lunch, and dinner every day was considered, and so was the location of the meal (home or out of home).
Handwashing at three critical times was assessed by calculating the proportion of girls who reported practicing the three following behaviors, namely washing their hands before eating a meal, after going to the toilet, and before preparing meals.
2.5.3. Health Status
The proportions of girls who self-perceived their health status as very good or good were combined, as well as those who reported their health status as bad or very bad. A third category consisted of girls who reported their health status as moderate. The percentage of girls who were sick in the past two weeks was also calculated.
2.5.4. Household Food Security, Access to Health Services
A value of “1” was attributed to each of the eight (8) items of the scale for which the response was a “yes”, and “0” was assigned if the answer was a no. A household was classified as being food secure if the sum of all the numerical values was zero, and as food-insecure if the value ranged from 1 to 8 [25]. Access to improved sources of water and sanitation was evaluated using WHO indicators [26], while data on the access to health services were dichotomized according to the reported time to reach the health facility: ≤ 30 (accessible) or >30 min (less accessible) [27].
2.5.5. Access to Resources
A score was developed for each household to assess its wealth, using factor analysis with the principal axis factorization method. Initially, 23 items considered to be household assets were used. However, items with little variation in the distribution of scores were removed, i.e., those for which 85% or more of households had the same response, as these items have limited discriminating power. A total of 17 items were considered in the final score: the material of the floor of the house, household ownership of horses/donkeys, goats, sheep, chickens, farmland, bank account, radio, TV, computer, watch, bicycle, motorcycle, or a cart with an animal, and the household’s access to electricity. In total, these items explained 24.2% of the total variance of the factor and score composition. The Kaiser–Meyer–Olkin test value was 0.826, which is considered very good [28]. The indicators used to evaluate access to human resources were simply household (size, sex, and age of the head of the spouse) and adolescent characteristics such as their age, level of education and literacy, and current school attendance. The location of the household residence (urban/rural) was also considered as a potential characteristic that could influence access to resources.
2.5.6. Statistical Analyses
The data were analyzed with the IBM’s SPSS program (Version 21.0; IBM Corp: Armonk, NY, USA, 2012) [29]. Chi-square and Fisher tests were used to assess differences in the proportions of adolescent girls with/without adequate diversity between categories of potential determinants, as well as between age groups. Determinants for which significant differences at p < 0.10 were observed in bivariate analyses were included in the logistic regression. Besides the adolescent’s age, all other variables were dichotomized for the multi-level logistic regression analysis. As per the UNICEF framework, the health status variable was included in the first model, to which underlying determinants were added. Thirdly, variables on adolescent access to resources were integrated into the model. To conclude on the adjustment of the final model, the following indicators and cut-offs were considered: (a) a p-value > 0.05 for the Hosmer–Lemeshow goodness of fit test, (b) the coherence between the observed and predicted values by examining the classification tables, and (c) no standardized residual values above 2 [30]. The values for each variable added to the model with a p < 0.05 for the Wald test were considered as significant contributors to the final model.
3. Results
A total of 600 adolescent girls participated in the study, out of 627 who were initially contacted. The differences in the adequacy of adolescent girls’ dietary diversity by determinants/characteristics are presented in Table 1 and Table 2.

Table 1.
Proportions (%) of adolescent girls with adequate/inadequate dietary diversity by immediate and underlying determinants (n = 600).
Table 2.
Proportions (%) of adolescent girls with adequate/inadequate dietary diversity by basic determinants and other adolescent characteristics (n = 600).
Overall, 54.8% of adolescent girls had adequate dietary diversity, and a significant difference (p = 0.004) was observed between those aged 10–14 (48.8%) and 15–19 years old (60.6%). Moreover, approximately 80% of the girls consumed breakfast daily and had at least one snack, while two-thirds were having three meals (Table 1).
Significant differences in the proportions of adolescent girls with or without adequate dietary diversity were observed between those who had been ill in the last two weeks (Table 1), as well as between those who lived in a household with access to food, improved water sources, and sanitation (Table 2). Further differences in proportions in dietary diversity adequacy were identified between adolescents who ate breakfast, lunch, and dinner each day, those who consumed at least a snack between meals daily, and among adolescents taking multivitamins/minerals at the time of the survey (Table 1). Finally, differences in proportions were found according to the girls’ age group, the gender of the head of the household, and the education level of her caregiver (Table 2).
The proportions of adolescent girls who had consumed food from the different groups are shown in Figure 1. Most participants had eaten grains, white roots/tubers, or plantains the day or night before the survey. Close to 80% had consumed food from the meat, poultry, and fish groups, while 70% had consumed sweet beverages. Around two-thirds had consumed other vegetables, while half had eaten dairy, dark green leafy vegetables, or vitamin A-rich fruits and vegetables. Less than 20% had eaten nuts and seeds, eggs, or other fruits, while between 35 and 40% had consumed sweet food, fried and salty food, or pulses. Girls aged 15–19 years were more likely to consume meat, fish, poultry, and sweet beverages compared to those aged 10–14 years (p < 0.05).
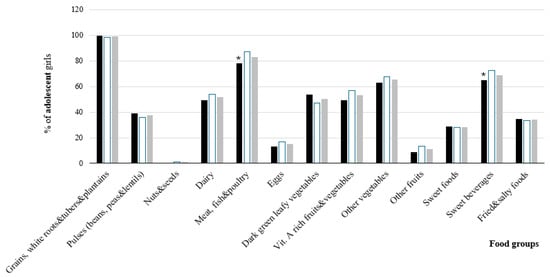
Figure 1.
Proportions (%) of adolescent girls who had consumed food from all the different groups, by age group (n = 600). * Indicates a significant difference between age groups (Chi-square test p value < 0.05).
Results on the frequency of the consumption of different food groups show that foods made from grains were consumed by approximately 50% of girls at least once a day (Table 3). Overall, 35% ate vegetables (either dark green leaves, vitamin A-rich vegetables, roots and tubers, or others) daily, while less than 2% consumed fruits daily. Meat and poultry were also eaten daily by less than 2% of girls, while fish and seafood were consumed by 15% at least once a day. Milk was consumed daily by 17%, and 2% of girls consumed other daily products daily. Nuts and seeds were not consumed at all by 98% of participants. Less than 10% of girls consumed fried and salty foods, sweet beverages, or sweet foods at least once a day.
Table 3.
Proportions (%) of adolescent girls by frequency of consumption of the different food groups (n = 600).
Overall, 219 girls (from a total of 600) reported not consuming certain foods all year, or only during specific times. Out of these foods, 40% were vegetables (e.g., eggplant, cove, carrot, or gombo) and 10% were fruits (e.g., sweet banana, orange, or green mango). Moreover, 16% reported not consuming some foods made from cereals, especially rice and millet porridges, while 6% reported not eating nuts, such as the peanut, either alone or as a peanut sauce.
Results from the multi-level logistic regression show that the health status alone explains less than 1% of the variance associated with the adequacy of dietary diversity (Cox and Snell and Nagelkerke R2 of 0.006 and 0.007, respectively). The addition of the second level of the logistic regression, comprising variables on household food security, access to an improved source of water and sanitation, and adolescent food behaviors, increase the R2 values to 0.101 and 0.135, respectively. In this model, being healthy in the past two weeks, taking multivitamins/minerals, having breakfast daily, and living in a household with access to an improved water source were all associated with the adequacy of dietary diversity. In the third and final level of the logistic regression, adding variables on access to resources increases the Cox and Snell and Nagelkerke R2 values to 0.119 and 0.160, respectively. Being sick in the past two weeks was positively associated with the adequacy of dietary diversity (OR: 1.53; 95% CI: 1.05, 2.22), as well as if the household where the girl was living had access to an improved source of water (OR: 4.13; 95% CI: 2.28, 7.49). Girls who were having breakfast daily (OR: 1.89; 95% CI: 1.23, 2.93) as well as multivitamins/minerals (OR: 2.75; 95% CI: 1.49, 4.92) were more likely to have adequate dietary diversity. Moreover, those who were listening to the radio at least once a week were almost twice more likely (OR: 1.66; CI: 1.05, 2.63) to have adequate dietary diversity (Table 4). The age of the adolescent girl, the sex of the head of the household, and the level of education of the caregiver (having uncompleted primary/completed primary level vs. no formal and higher education) were not significantly associated with the adequacy of dietary diversity among adolescent girls, nor household food security and access to improved sanitation. In the final model, the p-value for the Hosmer–Lemeshow goodness of fit test was 0.664, indicating no significant differences between the expected and observed rates. The values of standardized residuals were all below 1, adding to the previous statement on the good fit between the model and the data. The examination of the classification table shows that 63.8% of participants were correctly classified.
Table 4.
Determinants associated with the adequacy of dietary diversity among adolescent girls (n = 600).
4. Discussion
The aim of this study was to investigate the potential determinants of adequate dietary diversity among Senegalese adolescent girls. Our findings show that approximately half of girls have adequate dietary diversity (i.e., consumed more than five out of the total ten food groups the previous day and night). Micronutrient-rich foods such as fruits and vegetables were eaten by less than 50% of participants daily, while the consumption of meat/poultry/fish and of dairy products was much lower (23%). Less than 10% of girls consumed unhealthy foods such as sweet food, sweet beverages, or fried and salty snacks daily. Grains, white tubers, roots, and plantains were the most commonly consumed foods on a daily basis. Not having been sick in the past two weeks, having breakfast daily, taking multivitamin/minerals, listening to the radio at least once a week, as well as living in a household with access to an improved source of water were positively associated with adequate dietary diversity.
Our results are consistent with those reported by Worku et al. [31] on 284 Ethiopian school adolescent girls in Addis Ababa, in whom the prevalence of adequate dietary diversity was 57%, but appears to be much better in our context (55% of girls with adequate dietary diversity) than among adolescent girls living in a city in Ethiopia (n = 460, 32.8% with adequate dietary diversity), and worse compared to Beninese female schoolchildren and adolescents aged 8–17 years old (74.1%) [32]. Disparities between Senegal and other settings may be attributed to differences in socioeconomic, geographical, and cultural factors. For instance, in Ethiopia and Benin, the study only includes adolescent girls attending schools.
In a systematic review of the literature in a similar context to our study, Keats et al. [10] also reported small proportions of African adolescent girls consuming fruits (33%) and vegetables (5%) as well as meat/poultry/fish (13%) daily. The limited consumption of iron-rich food is striking given the high prevalence of anemia (57%) among Senegalese adolescent girls [14]. Furthermore, as reported by Ndiaye et al. [20] and Giguère-Johnson et al. [16], the quantities of iron-rich food and fruit and vegetables consumed by adolescent girls in Dakar are likely insufficient to meet their micronutrient requirements. These quantities were estimated to be 58 g per day of iron-rich food and 83 g per day of fruits and vegetables. The low consumption of fruits and vegetables is quite concerning, as this is a key component of a healthy diet that contributes to reducing the risk of non-communicable diseases in the general population. Local vegetables and fruits such as eggplant, pineapple, okra, and sweet banana also do not seem to be appreciated by a large proportion of girls, which is regrettable, as they could be sustainable and inexpensive sources of quality food [33]. Access to iron-rich food may also be limited by individual (e.g., girls’ attitude) and environmental factors, such as their high price, which can influence their intention to consume these foods, and their behavior itself [18]. With regard to dairy, the proportion of Senegalese girls who reported a daily consumption was higher (21.6%) than that reported (6%) by Keats et al. [10], based on a review of studies carried out on the African continent. Therefore, as reported by Fiorentino et al. [17] and Giguère-Johnson et al. [16], among adolescent girls attending schools in Dakar, it is not surprising that significant proportions of them have inadequate intakes of micronutrients (e.g., iron, zinc, vitamin C, and calcium) and fiber.
However, among our Senegalese sample, the percentages of girls consuming sweet foods (3.8%), sweet beverages (5.4%), and fried and salty food (8.0%) were lower than Keats et al.’s [10] reported proportions for the Africa region, which were 34%, 7%, and 100%, respectively. This is good news for now, but as for other countries, Senegal is also experiencing a nutrition transition, with an increased availability and affordability of nutrient-poor and energy-dense food [34]. Although similarities between our findings and those of Keats et al. [10] were observed, comparisons between the two studies must be made with caution given that in Keats et al.’s review, the Africa region was mainly represented by research conducted in Nigeria (10 out of a total of 35), Ethiopia (6), South Africa (6), and Mozambique (4), or was carried out mainly in schools (25) and urban areas (16), whereas our study had similar proportions of girls living in rural and urban areas and also included out-of-school girls.
With regard to dietary practices, our results show that a higher proportion of girls (79.5%) ate breakfast every day, compared with the results of Giguère-Johnson et al. (65%) and Keats et al. (52.8%). Yet, the disparities could be attributed to the fact that Giguère-Johnsons et al.’s research [16] reported results from a limited sample size of school girls in the Dakar region, while Keats et al.’s review [10] included five (5) studies conducted in only two countries, Nigeria and Ghana. In our context, two-thirds of girls ate three meals, while 80% had at least one snack daily. Our results are again higher than the proportions reported by Keats et al. [10] (40% of adolescent girls were consuming two meals or less while 26% were snacking daily), which did not report results specific to the African region.
The results of our multi-level logistic regression analysis show the importance of underlying determinants in predicting dietary diversity adequacy. Although not having been sick in the past two weeks was positively associated with adequate dietary diversity compared to not having been sick, this variable explains only a small proportion of the variance associated with dietary diversity. However, as health status and dietary diversity measurements do not cover the same period, it can be assumed that being sick may still have led to changes in the diet in the two weeks prior to the study. As shown in the UNICEF model of the determinants of nutrition security, diseases can lead to a loss of appetite, which may impact diet quality [8].
Dietary practices (having breakfast, multivitamins/minerals) and access to safe water were the most important predictors of, and positively associated with, the adequacy of dietary diversity. Our results show that eating breakfast every day was positively associated with adequate dietary diversity compared to not having a daily breakfast. As highlighted in Kupka et al.’s [9] overview of the available data on children and adolescents, albeit it applying to high-income countries, eating breakfast regularly has been associated with a quality diet [35]. Findings from a study of children and adolescents aged 8 to 17 years in Benin also show a positive relationship between breakfast consumption and adequate dietary diversity [33].
The intake of multivitamins/minerals supplements was positively related to the adequacy of dietary diversity. This is potentially explained by the fact that adolescent girls may enjoy a diet composed of good quality food, but are not always able to access this type of diet, so may decide to supplement their diet with vitamins/minerals to ensure adequate micronutrient intake. On the other hand, listening to the radio was positively associated with the adequacy of dietary diversity, as was living in a household with access to an improved water source (as compared to living in a household without such access). Although not among adolescents, there is some evidence that health and nutritional education via the radio significantly increases health-/nutrition-related knowledge of mothers of young children [36,37]. In line with this assertion, in 2017, results from the evaluation of a program supporting the dissemination of nutrition and hygiene information on six (6) local radios in Senegal reported the acquisition of knowledge within the general population. As for water access, water is a beverage that helps to maintain hydration, but it is also used for food preparation at a household level [38]. The use of unsafe water can lead to illnesses that may impact the health status of adolescent girls by causing a loss of appetite, and consequently, influencing the quality of their diet. Hence, in our sample, access to an improved water source may lead to better health, and thus contribute to adequate dietary diversity.
In our sample, adolescent age and household food security were not associated with the adequacy of dietary diversity. Findings on the relationship between adolescent age, household food security, and the adequacy of dietary diversity are mixed. In Ethiopia, household food security and adolescent girl age were predictors of dietary diversity [39], while another study [31] did not find any association between girls’ age and the dietary diversity score. Although dietary quality was assessed using the new Global Diet Quality Score (GDQS) [40,41], no evidence was found of an association between the quality of the adolescent diet and household food security. It is possible that in our context, even though data collection was conducted during the school holidays, adolescent girls consumed food acquired outside the home, which could have reduced the potential impact of household food security on their diet.
Our study faces a few limitations. Although the dietary diversity score is considered an indicator of the overall quality of the diet, due to its association with micronutrient adequacy [23,42,43], it does not consider the consumption of unhealthy food. In the future, the use of the GDQS could be suitable, because they also take into account unhealthy food groups associated with a high risk of chronic diseases [40]. Furthermore, despite the use of the FAO dietary diversity score among young adolescent girls (10–14 years old), it was originally developed to assess the quality of diet in women of a reproductive age [23]. As reported by Bollen et al. [44], the perception of the current health status provides an acceptable overview of the health status of girls, as self-perception of health has been associated with objective and subjective states of health, though they recognize that the reliability of this measure may not be optimal. Other factors not considered in our study may also have impacted the adequacy of dietary diversity, such as caregiver or paternal occupation [31,41] or social media [33]. More attention should also be paid to adolescent males. It should be highlighted that our results show a picture of dietary diversity at the time of the survey and not all year round, as seasonality may also affect dietary intake. However, our research has several strengths worth highlighting. It is a nationally representative study including participants from both urban and rural areas. It also includes out-of-school adolescent girls. Although the data collection was conducted during the school holidays and the adequacy of dietary diversity is therefore not representative of an entire year, our results highlight the time of year when Senegalese adolescent girls are out of school, which is unique, as other studies [16,17] were conducted during the school year. Finally, a framework was used to guide the data collection and analysis to ensure that the main variables likely to influence adolescent dietary diversity were examined.
5. Conclusions
Our findings provide additional evidence of poor dietary quality among adolescent girls in Africa. Our results show that having been sick in the past two weeks, taking multivitamins/minerals, having breakfast daily, and listening to the radio at least once a week, as well as living in a household with access to an improved water source were associated with the adequacy of adolescent dietary diversity (i.e., consumed more than five out of the total of ten food groups the previous day and night). These factors could be considered in future programs and national plans, such as the Senegal multisectoral strategic plan on nutrition. Greater attention should be given to adolescent nutrition to support optimal growth, development, and long-term health for future generations.
Author Contributions
Conceptualization, M.S., S.B., N.B.L. and A.N.N.; methodology, M.S., S.B., N.B.L., J.B.D. and A.N.N.; software, J.B.D. and S.B.; validation, S.B. and M.S.; formal Analysis, S.B. and J.B.D.; investigation, M.S., N.B.L. and E.H.M.T.; resources, N.B.L., E.H.M.T., A.D.N. and M.S.; data curation, S.B.; writing—original draft preparation, S.B.; writing—review and editing, J.B.D., M.S., A.N.N., N.B.L., A.D.N. and E.H.M.T.; visualization, M.S.; supervision, M.S.; project administration, M.S., N.B.L., A.D.N. and E.H.M.T.; funding acquisition, M.S. All authors have read and agreed to the published version of the manuscript.
Funding
This research was funded by the Conseil National de Développement de la Nutrition/CNDN of Senegal.
Institutional Review Board Statement
This study was conducted in accordance with the Declaration of Helsinki, and approved by the Comité national de la recherché en santé du Sénégal (#0000344/MSAS/CNERS/SP).
Informed Consent Statement
Verbal consent/assent was obtained from all participants. Verbal consent was witnessed and formally recorded. Participation was voluntary and participants could withdraw from the study at any time without negative consequences or prejudice as well as without justifying their decision.
Data Availability Statement
Data available on request due to restrictions (privacy and legal reasons).
Acknowledgments
We would like to thank all adolescent girls for their participation in this study. We are also grateful to the survey team for their significant contribution to data collection. We would like to thank Massogui Cissé for his outstanding support in the finalization of the survey tools and for data clean up.
Conflicts of Interest
The authors declare no conflict of interest.
References
- United Nations Children’s Fund (UNICEF). Adolescents. Available online: https://data.unicef.org/topic/adolescents/overview/ (accessed on 10 October 2024).
- Neufeld, L.M.; Andrade, E.B.; Ballonoff Suleiman, A.; Barker, M.; Beal, T.; Blum, L.S.; Demmler, K.M.; Dogra, S.; Hardy-Johnson, P.; Lahiri, A.; et al. Food choice in transition: Adolescent autonomy, agency, and the food environment. Lancet 2022, 399, 185–197. [Google Scholar] [CrossRef] [PubMed]
- United Nations Children’s Fund (UNICEF). Undernourished and Overlooked: A Global Nutrition Crisis in Adolescent Girls and Women; UNICEF: New York, NY, USA, 2023. [Google Scholar]
- Hargreaves, D.; Mates, E.; Menon, P.; Alderman, H.; Devakumar, D.; Fawzi, W.; Greenfield, G.; Hammoudeh, W.; He, S.; Lahiri, A.; et al. Strategies and interventions for healthy adolescent growth, nutrition, and development. Lancet 2022, 399, 198–210. [Google Scholar] [CrossRef] [PubMed]
- Norris, S.A.; Frongillo, E.A.; Black, M.M.; Dong, Y.; Fall, C.; Lampl, M.; Liese, A.D.; Naguib, M.; Prentice, A.; Rochat, T.; et al. Nutrition in adolescent growth and development. Lancet 2022, 399, 172–184. [Google Scholar] [CrossRef]
- NCD Risk Factor Collaboration. Worldwide trends in body-mass index, underweight, overweight, and obesity from 1975 to 2016, A pooled analysis of 2416 population-based measurement studies in 128·9 million children, adolescents, and adults. Lancet 2017, 390, 2627–2642. [Google Scholar] [CrossRef]
- United Nations Children’s Fund (UNICEF). The State of the World’s Children 2023: For Every Child, Vaccination, UNICEF Innocenti; UNICEF: Florence, France, 2023. [Google Scholar]
- United Nations Children’s Fund (UNICEF). UNICEF Conceptual Framework on the Determinants of Maternal and Child Nutrition: A Framework for the Prevention of Malnutrition in All Its Forms; UNICEF: New York, NY, USA, 2020. [Google Scholar]
- Kupka, R.; Siekmans, K.; Beal, T. The diets of children: Overview of available data for children and adolescents. Glob. Food Secur. 2020, 27, 100442. [Google Scholar] [CrossRef]
- Keats, E.C.; Rappaport, A.I.; Jain, R.; Oh, C.; Shah, S.; Bhutta, Z.A. Diet and eating practices among adolescent girls in Low- and Middle-Income countries: A systematic review. In Strengthening Partnership, Results, and Innovations in Nutrition Globally (SPRING) Project; Spring: Arlington, VA, USA, 2018. [Google Scholar]
- Abuya, B.A.; Muhia, N.; Cissé, R.; Fall, N.A.; Sall, N.O.K.; Konté, A.F.B.; Faye, C.M. The State of Education and Implications of SRHR on the Education of Adolescent Girls in Senegal; APHRC: Dakar, Senegal, 2020. [Google Scholar]
- Agence Nationale de la Statistique et de la Démographie (ANSD). Annuaire Population du Sénégal-Année 2024; ANSD et Ministère de L’économie, du Plan et de la Coopération: Dakar, Senegal, 2025. [Google Scholar]
- Agence Nationale de la Statistique et de la Démographie (ANSD). Note d’analyse du Commerce Extérieur-Édition 2023; ANSD: Dakar, Senegal, 2024. [Google Scholar]
- Agence Nationale de la Statistique et de la Démographie (ANSD) [Sénégal]; ICF. Sénégal. Enquête Démographique et de Santé Continue (EDS-Continue 2017); ANSD and ICF: Dakar, Sénégal; Rockville, MD, USA, 2018. [Google Scholar]
- Agence Nationale de la Statistique et de la Démographie (ANSD) [Sénégal]; ICF International. Enquête Démographique et de Santé à Indicateurs Multiples au Sénégal (EDS-MICS) 2010–2011; ANSD and ICF International: Dakar Sénégal; Calverton, MD, USA, 2012. [Google Scholar]
- Giguère-Johnson, M.; Ward, S.; Ndéné Ndiaye, A.; Galibois, I.; Blaney, S. Dietary intake and food behaviours of Senegalese adolescent girls. BMC Nutr. 2021, 7, 41. [Google Scholar] [CrossRef] [PubMed]
- Fiorentino, M.; Landais, E.; Bastard, G.; Carriquiry, A.; Wieringa, F.T.; Berger, J. Nutrient Intake Is Insufficient among Senegalese Urban School Children and Adolescents: Results from Two 24 h Recalls in State Primary Schools in Dakar. Nutrients 2016, 8, 650. [Google Scholar] [CrossRef]
- Dupuis, J.B.; Ndiaye, A.N.; Lo, N.B.; Thiam, E.H.M.; Sall, M.; Blaney, S. Individual and Environmental Determinants of the Consumption of Iron-Rich Foods among Senegalese Adolescent Girls: A Behavioural Model. Adolescents 2024, 4, 396–409. [Google Scholar] [CrossRef]
- Lwanga, S.K.; Lemeshow, S. Sample Size Determination in Health Studies; World Health Organization: Geneva, Switzerland, 1991. [Google Scholar]
- Ndiaye, A.N.; Galibois, I.; Blaney, S. Iron-rich foods intakes among urban Senegalese adolescent girls. Int. J. Child Health Nutr. 2021, 10, 1–8. [Google Scholar] [CrossRef]
- World Health Organization (WHO). WHO Steps Surveillance. Available online: https://cdn.who.int/media/docs/default-source/ncds/ncd-surveillance/steps/part2-section2.pdf?sfvrsn=9c33a896_2 (accessed on 2 May 2023).
- United Nations Children’s Funds (UNICEF). Multiple Indicator Cluster Survey Manual. Available online: https://mics.unicef.org/sites/mics/files/MICS3_Chapter_4___Designing_and_Selecting_the_Sample_060219.pdf (accessed on 2 May 2023).
- The Food and Agriculture Organization of the United Nations (FAO). Minimum Dietary Diversity for Women: An Updated Guide to Measurement—From Collection to Action; FAO: Rome, Italy, 2021. [Google Scholar] [CrossRef]
- The DHS Program. Questionnaires and Manuals. Available online: https://dhsprogram.com/publications/publication-DHSQ8-DHS-Questionnaires-and-Manuals.cfm (accessed on 20 May 2023).
- The Food and Agriculture Organization of the United Nations (FAO). Methods for Estimating Comparable Rates of Food Insecurity Experienced by Adults Throughout the World; FAO: Rome, Italy, 2016. [Google Scholar]
- World Health Organization (WHO). Improved Sanitation Facilities and Drinking-Water Sources. Available online: https://www.who.int/data/nutrition/nlis/info/improved-sanitation-facilities-and-drinking-water-sources (accessed on 10 September 2023).
- Florio, P.; Freire, S.; Melchiorri, M. Estimating geographic access to healthcare facilities in Sub-Saharan Africa by Degree of Urbanisation. Appl. Geogr. 2023, 160, 103118. [Google Scholar] [CrossRef]
- Durand, C. L’analyse factorielle et l’analyse de fidélité: Notes de cours et Exemples; Université de Montréal: Montréal, QC, Canada, 2003. [Google Scholar]
- IBM Corporation. IBM SPSS Statistics for Windows—Version 21.0; IBM Corp: Armonk, NY, USA, 2012. [Google Scholar]
- Sherbrooke University. Logistic Regression—Interpretation. Available online: https://spss.espaceweb.usherbrooke.ca/interpretation-26/ (accessed on 2 September 2024).
- Worku, L.; Mamo, K.; Bekele, T.; Atlaw, D. Dietary diversity score and associated factors among high school adolescent girls in a selected school of Yeka Sub-city, Addis Ababa. Open Med. 2022, 10, 20503121221094896. [Google Scholar] [CrossRef] [PubMed]
- Sagbo, H.; Kpodji, P. Dietary diversity and associated factors among school-aged children and adolescents in Lokossa district of southern Benin: A cross-sectional study. BMJ Open 2023, 13, e066309. [Google Scholar] [CrossRef] [PubMed]
- Marras, S.; Salmivaara, M.; Bendech, M.A.G.; Seki, R. Urban Food Systems, Food Security and Nutrition in West African: Dakar, Senegal; FAO: Rome, Italy, 2017; Available online: https://www.academia.edu/37801223/Urban_food_systems_food_security_and_nutrition_in_Dakar_Senegal (accessed on 9 September 2024).
- Owolodun, B.; Gmür, D.; Felber, S.; Ollier, C.; Haller, T.; Merten, S. From diversity to uniformity: Comparing nutritional transition of food consumption in four regions in Senegal. Food Cult. Soc. 2024, 28, 503–527. [Google Scholar] [CrossRef]
- de la Hunty, A.; Gibson, S.; Ashwell, M. Does regular breakfast cereal consumption help children and adolescents stay slimmer? A systematic review and meta-analysis. Obes. Facts 2013, 6, 70–85. [Google Scholar] [CrossRef]
- Saaka, M.; Wemah, K.; Kizito, F.; Hoeschle-Zeledon, I. Effect of nutrition behaviour change communication delivered through radio on mothers’ nutritional knowledge, child feeding practices and growth. J. Nutr. Sci. 2021, 10, e44. [Google Scholar] [CrossRef]
- Walters, C.N.; Rakotomanana, H.; Komakech, J.J.; Stoecker, B.J. Maternal determinants of optimal breastfeeding and complementary feeding and their association with child undernutrition in Malawi (2015–2016). BMC Public. Health 2019, 19, 1503. [Google Scholar] [CrossRef]
- Miller, J.D.; Workman, C.L.; Panchang, S.V.; Sneegas, G.; Adams, E.A.; Young, S.L.; Thompson, A.L. Water Security and Nutrition: Current Knowledge and Research Opportunities. Adv. Nutr. 2021, 12, 2525–2539. [Google Scholar] [CrossRef] [PubMed]
- Abebe, T.; Mezgebu, G.S.; Feleke, F.W.; Tamrat, M. Dietary diversity and associated factors among adolescent girls in Nifas Silk Laphto sub city, Addis Ababa, Ethiopia, 2021. BMC Nutr. 2023, 9, 39. [Google Scholar] [CrossRef]
- Bromage, S.; Zhang, Y.; Holmes, M.D.; Sachs, S.E.; Fanzo, J.; Remans, R.; Sachs, J.D.; Batis, C.; Bhupathiraju, S.N.; Fung, T.T.; et al. The Global Diet Quality Score is inversely associated with nutrient inadequacy, low midupper arm circumference, and anemia in rural adults in ten sub-Saharan African countries. J. Nutr. 2021, 151, 119S–129S. [Google Scholar] [CrossRef]
- Madzorera, I.; Bromage, S.; Mwanyika-Sando, M.; Vandormael, A.; Sherfi, H.; Worku, A.; Shinde, S.; Noor, R.A.; Baernighausen, T.; Sharma, D.; et al. Dietary intake and quality for young adolescents in sub-Saharan Africa: Status and influencing factors. Matern. Child. Nutr. 2023, e13463. [Google Scholar] [CrossRef]
- Dalwood, P.; Marshall, S.; Burrows, T.L.; McIntosh, A.; Collins, C.E. Diet quality indices and their associations with health-related outcomes in children and adolescents: An updated systematic review. Nutr. J. 2020, 19, 118. [Google Scholar] [CrossRef] [PubMed]
- Nithya, D.J.; Bhavani, R.V. Dietary diversity and its relationship with nutritional status among adolescents and adults in rural India. J. Biosoc. Sci. 2018, 50, 397–413. [Google Scholar] [CrossRef] [PubMed]
- Bollen, K.A.; Gutin, I.; Halpern, C.T.; Harris, K.M. Subjective health in adolescence: Comparing the reliability of contemporaneous, retrospective and proxy reports of overall health. Soc. Sci. Res. 2021, 96, 102538. [Google Scholar] [CrossRef] [PubMed]
Disclaimer/Publisher’s Note: The statements, opinions and data contained in all publications are solely those of the individual author(s) and contributor(s) and not of MDPI and/or the editor(s). MDPI and/or the editor(s) disclaim responsibility for any injury to people or property resulting from any ideas, methods, instructions or products referred to in the content. |
© 2025 by the authors. Licensee MDPI, Basel, Switzerland. This article is an open access article distributed under the terms and conditions of the Creative Commons Attribution (CC BY) license (https://creativecommons.org/licenses/by/4.0/).