Article

Support Surface Chemistry Evolution During the Preparation of Metal Oxide–Activated Carbon Catalysts by Wet Impregnation: A FT-IR Spectroscopy Analysis

by
Adrián Bogeat-Barroso
1,*,
María Francisca Alexandre-Franco
2,
Carmen Fernández-González
2 and
Vicente Gómez Serrano
2
1
GIR QUESCAT, Departamento de Química Inorgánica, Universidad de Salamanca, Plaza de los Caídos s/n, 37008 Salamanca, Spain
2
Departamento de Química Orgánica e Inorgánica, Facultad de Ciencias, Universidad de Extremadura, Avda. de Elvas s/n, 06006 Badajoz, Spain
*
Author to whom correspondence should be addressed.
Compounds 2025, 5(3), 36; https://doi.org/10.3390/compounds5030036
Submission received: 31 July 2025 / Revised: 10 September 2025 / Accepted: 18 September 2025 / Published: 22 September 2025

Abstract

The present work is aimed at shedding light on the evolution of surface chemistry of a commercial activated carbon (AC) support during the preparation of supported metal oxide (MO) catalysts by the conventional wet impregnation method. Particular attention is paid to the chemical changes of oxygen-containing surface functionalities across three preparation stages of impregnation, oven-drying, and thermal treatment. AC was impregnated with aqueous solutions of several MO precursors (Al(NO3)3, Fe(NO3)3, Zn(NO3)2, SnCl2, and Na2WO4) at 80 °C for 5 h, oven-dried at 120 °C for 24 h, and heat-treated at 200 °C and 850 °C for 2 h under an inert atmosphere. The surface chemistry of the resulting catalyst samples, classified in three series by the thermal treatment, was mainly studied by FT-IR spectroscopy, complemented by elemental analysis and pH of the point of zero charge (pHpzc) measurements. During impregnation, phenolic hydroxyl and carboxylic acid groups were predominantly formed by wet oxidation of chromene, 2-pyrone, and ether-type structures found in the pristine AC. The extent of these oxidations correlated with the oxidising power of the precursor solutions. As expected, thermal treatment at 850 °C brought about markedly stronger chemical changes, with most of the above oxygen functionalities decomposing and forming less acidic structures, such as 4-pyrone groups, metal carboxylates, and C-O-M atomic groupings. All these surface chemical modifications result in a lowering of the strong basicity of the raw carbon support (pHpzc ≈ 10.5), thus leading to pHpzc values for the catalysts widely ranging from 1.6 to 9.7.

Graphical Abstract

1. Introduction

Since the mid-1950s, metal oxides (MOs) have become ubiquitous materials in the field of heterogeneous catalysis, being involved in a variety of chemical processes not only with industrial interest but also concerning environmental protection [1,2,3]. As a rule, this extensive use of MOs mainly arises from their widely varied redox and acid-base properties, which allow them to take part in chemical processes involving the exchange of electrons, protons, and oxide ions. These MO catalysts are employed either as bulk materials or much more frequently as a supported phase. Regarding this latter, activated carbon (AC) has been long selected as MO catalyst support because it gathers a number of highly desirable properties, among which a high specific surface area, tailored porous structure, and very rich surface chemistry should be worth mentioning [4,5,6,7,8,9,10]. These properties make AC an excellent support for dispersing MO phases, thereby enhancing their catalytic performance in a variety of processes, including those related to environmental remediation, energy storage, and chemical synthesis [9,11,12]. In this connection, AC-supported MO catalysts have been employed in a wide range of chemical reactions. For example, Fe2O3 and ZnO have been applied in the degradation of organic compounds; Fe2O3 has also been used in the hydroxylation of benzene, degradation of propane, and acylation of alcohols and amines; WO3 has shown activity in the decomposition of isopropanol, isomerisation of 1-butene, decomposition of both methanol and ethanol, combustion of toluene, and hydrogenation of ethylene; SnO2 has been used for the low-temperature oxidation of CO; and Al2O3 has been extensively applied in hydroprocessing and hydrodesulphurisation processes (see [6] and references therein).
Traditionally, AC has been regarded as an inert support in heterogeneous catalysis, particularly when compared to other conventional oxide supports, like silica, alumina, titania, and ceria [5,9,13]. Nevertheless, this view is overly simplistic, since the surface chemistry of AC may undergo significant transformations during the various stages involved in the catalyst preparation process.
The preparation of AC-supported MO (MO/AC, hereafter) catalysts can be accomplished by a variety of methods and procedures, the most widely used being wet impregnation [5,6,9,14] due to its simplicity, scalability, and cost-effectiveness. In this synthetic approach, the MO precursor is usually a water-soluble metal salt, such as nitrates or chlorides, thus enabling the adsorption of metal ions on the carbon support surface. The impregnated solid is then subjected to drying and calcination under an inert atmosphere, typically nitrogen, to promote the formation of MOs on the AC surface. These preparative heat treatments not only ensure the appropriate formation and dispersion of MOs on the carbon surface, but also trigger chemical transformations in oxygen-containing surface functional groups and structures, which significantly influence the surface chemistry features of the resulting MO/AC materials. To the best of our knowledge, no comprehensive study on these changes has been reported to the date.
The present work is aimed at systematically investigating the surface chemistry evolution of a commercial AC during the different steps of the preparation of a series of MO/AC catalysts by the conventional wet impregnation method. Specifically, the raw AC support was impregnated with precursor aqueous solutions of Al3+, Fe3+, Zn2+, SnCl2, or WO42− under mild heating conditions, followed by thermal treatment at two markedly different temperatures (i.e., 200 °C and 850 °C) under an inert atmosphere. By employing the classic FT-IR spectroscopy technique, we have elucidated and clarified the chemical transformations occurring on the carbon surface, with a focus on those involving oxygen-containing functionalities, as well as their correlation with the acid-base properties of the resulting MO/AC materials. This knowledge is essential for designing supported catalysts with tailored compositions, optimised for catalytic processes operating at relatively high temperatures [13], and for facilitating AC regeneration.

2. Materials and Methods

2.1. Materials and Reagents

As received without any additional physical or chemical treatment, a commercial granular AC supplied by Merck (Cod. 1.02514.1000; Darmstadt, Germany), with an average particle size of approximately 1.5 mm, was employed as support. Al(NO3)3·9H2O, Fe(NO3)3·9H2O, Zn(NO3)2·6H2O, SnCl2·2H2O, and Na2WO4·2H2O (reagent grade, Panreac, Barcelona, Spain) were used as MO precursors in the preparation of the MO/AC samples. The pH values of the precursor aqueous solutions are listed in Table 1. For reference, the pH of deionised water was 5.1, which increased to 6.2 and 7.1 after soaking the raw AC for 5 min and 24 h, respectively.

2.2. Preparation of the MO/AC Samples

The MO/AC samples were prepared by the conventional wet impregnation method, one of the most widely employed procedures for the preparation of supported heterogeneous catalysts [5,9]. Specifically, the process involved two successive steps of soaking at 80 °C for 5 h and oven-drying (J. P. Selecta, Barcelona, Spain) at 120 °C for 24 h, followed by subsequent heat treatment of the dried products at 200 or 850 °C for 2 h under an inert atmosphere, as previously detailed elsewhere [15,16]. Overall, three series of MO/AC samples (S1, S2, and S3) were prepared, with three samples for each MO precursor used in the impregnation process. These samples are labelled as MT, where the letter M stands for the abbreviated symbol of the metal (A, F, Z, S, and W for Al, Fe, Zn, Sn, and W, respectively), and the number T denotes the oven-drying (120 °C) or heat treatment temperature (200 °C and 850 °C). The yield of the preparation process was estimated by the following expression:
Y i e l d = M f M i · 100 %
where Mi is the initial mass of AC or S1 samples and Mf is the final mass of the solid product after either oven-drying or heat treatment in inert atmosphere. Table 1 summarises the codes assigned to the as-prepared MO/AC samples along with their corresponding yield values.
For comparison purposes, three additional “blank” samples were prepared from the raw AC by operating under identical experimental conditions: soaking in deionised water at 80 °C for 5 h followed by oven-drying at 120 °C for 24 h (sample ACB), and subsequent heat treatment at either 200 °C (sample AC200) or 850 °C (sample AC850) for 2 h under inert atmosphere.

2.3. Characterisation of the MO/AC Samples

Elemental analysis (as regards to C, H, N, and S) of the AC and MO/AC samples was carried out in a LECO CHNS-932 analyser (LECO, St. Joseph, MI, USA), whereas the O content was estimated by difference.
The metal content for the MO/AC samples was determined by the X-ray fluorescence (XRF) technique. The analyses were carried out in a M4 Tornado energy dispersive spectrometer (Bruker, Billerica, MA, USA). All the materials were ground before the measurements, which were performed under the following conditions: Mo Kα radiation (λ = 0.7107 Å) source and operating voltage and current of 50 kV and 600 μA, respectively.
The surface chemistry of the samples was characterised by Fourier transform infrared (FT-IR) spectroscopy and determination of the pH of the point of zero charge (pHpzc).
FT-IR spectra of the samples were recorded in the transmission mode on a PerkinElmer Spectrum 100 spectrometer (Waltham, MA, USA), in the wavenumber range from 2000 cm−1 to 400 cm−1. Each spectrum was obtained by averaging four successive scans taken at a resolution of 4 cm−1. Pellets with the same sample/KBr mass ratio and total mass were prepared by following the procedure previously described in detail elsewhere [17]. Therefore, all the FT-IR spectra were acquired on the same scale and are directly comparable. For the sake of clarity, they have been vertically offset in the figures.
The pHpzc values were estimated by applying the method proposed by Newcombe et al. [18,19], using 0.01 mol·L−1 NaCl aqueous solutions of pH ranging from 2 to 12. These pH values were fixed by adding to the aforesaid solution the appropriate volume of either 0.1 mol·L−1 HCl or 0.1 mol·L−1 NaOH aqueous solutions. The pHpzc was determined from the intersection point in the plot of the pH of the initial solution against the pH of the corresponding supernatant.
The X-ray diffraction (XRD) patterns were registered at room temperature in a D8 Advance diffractometer from Bruker (Billerica, MA, USA) using Cu Kα radiation (λ = 0.15406 nm).

3. Results and Discussion

3.1. Preparation of the MO/AC Samples

3.1.1. Yield

For an in-depth and comprehensive discussion on the yield of the preparation process for S1 samples, readers are referred to our previous works [20,21]. Herein, only the most noteworthy aspects are briefly reviewed for the sake of brevity.
As shown in Table 1, these yield values widely range from 102 wt.% for A120 to 149 wt.% for S120. Notably, the yields for F120 and, very especially, S120 are markedly higher as compared to the rest of the impregnated and oven-dried materials. In this regard, a clear correlation can be established between the adsorbed amount of the precursors, which has been roughly estimated from the metal content of the S1 samples (see Table 2), and their corresponding yield values. Probably, the most critical factor influencing yield is the diffusion of precursors in the porosity of the AC support during the soaking step at 80 °C. In fact, diffusion processes ultimately control the access of the different precursor species present in the impregnation aqueous solutions to the available surface area of the AC, as well as their surface dispersion and the degree of loading of AC [9,11,22]. In relative terms, diffusion is primarily dependent on the size of the precursor species in aqueous solution, where it may be found as a hydrated, hydrolysed, or polymerised metal ion. Typically, aquo complexes are larger than hydroxo–aquo complexes, with polymeric or colloidal species exhibiting the largest sizes. As previously discussed elsewhere [20], the chemical species present in the impregnation solution for each metal ion depend on its concentration and pH [23,24] (see data in Table 1). This latter significantly increases upon contact of such solutions with AC, because of the basic character of this carbon support, as revealed by its high pHpzc of 10.5.
Concerning S2 samples, the yield varies between 91 wt.% for Z200 and 96 wt.% for S200 and W200. The mass loss observed due to the heat treatment of S1 samples at 200 °C under an inert atmosphere is chiefly attributed to both dehydration and dehydroxylation processes [25]. Similarly to S1 samples, the yield for S3 samples spans a broader range, from 68 wt.% for S850 to 95 wt.% for W850. Also notice that the yields are relatively low for Z850 (81 wt.%) and F850 (84 wt.%). For these samples heat-treated at a high temperature of 850 °C, previous thermogravimetry coupled with mass spectrometry studies have revealed that dehydroxylation, decarboxylation, decarbonylation, and carbothermal reduction processes occur, with concomitant release of water and carbon oxides as gaseous products [25].

3.1.2. Elemental Analysis

The results of the elemental analysis (C, H, N, S, and O) for AC and MO/AC samples are collected in Table 2. As expected for typical activated carbons, AC and “blank” samples (i.e., ACB, AC200, and AC850) are mainly composed of carbon, with hydrogen, nitrogen, and sulphur present as minor heteroatoms. In the case of S1 samples, compared to AC, the carbon and sulphur contents generally decrease, while the hydrogen, nitrogen, and oxygen contents greatly increase. The contents of the different chemical constituents (wt.%) vary widely, with values ranging from 52.32 (carbon), 1.25 (hydrogen), 0.06 (nitrogen), 0.37 (sulphur), and 46.00 (oxygen) for S120, to 78.32 (carbon), 0.98 (hydrogen), 0.20 (nitrogen), 0.61 (sulphur), and 19.89 (oxygen) for W120. The lower carbon content of the impregnated and oven-dried samples with respect to both AC and ACB can be attributed to the decreased presence of carbonaceous material to the benefice of the incorporated MO precursor. Nevertheless, it is worth noting that the variation in carbon content does not parallel the trends observed for the process yield and the metal content. As an illustrative example, the carbon content of A120 (72.83 wt.%) is markedly lower than expected from its process yield (102 wt.%) and aluminium content (3.94 wt.%). These findings suggest that the chemical composition of the S1 samples is influenced not only by the mass transfer from the bulk of the precursor aqueous solution to the AC surface, but also by the chemical interactions established between this solution and the support’s surface. The increase in hydrogen and oxygen contents observed for ACB and S1 samples, relative to the pristine AC support, is compatible with the formation of carbon–oxygen surface groups. In addition, coordination water and hydroxyl groups belonging to the coordination sphere of the precursors may also contribute to this rise in both hydrogen and oxygen contents [21,26]. Finally, the nitrogen content is markedly higher for A120, F120, and Z120 than for AC, in good agreement with the use of metal nitrate salts as MO precursors in the preparation of these samples.
On the other hand, the increase in hydrogen content observed in most S2 samples as compared to their S1 counterparts, though initially unexpected, likely denotes that they underwent partial rehydration after their preparation and prior to the elemental analyses.
For the S3 samples, when compared to their respective parent S1 materials, the carbon content usually increases, whereas the hydrogen, nitrogen, sulphur, and oxygen contents as a rule decrease slightly. The only exception is sample W850, which displays the opposite trend for carbon and oxygen contents. These results suggest that the preparation of these materials primarily affected the chemical constitution of the S1 samples through dehydroxilation and carbothermal reduction processes, as discussed in detail elsewhere [25]. The overall mass balance favours carbon enrichment to the detriment of both hydrogen and oxygen contents.

3.2. Characterisation of the Surface Chemistry of the MO/AC Samples

3.2.1. FT-IR Spectroscopy

AC and “Blank” Samples
The results of the analysis of the bare AC by the FT-IR spectroscopy technique have been previously reported elsewhere [17] and are summarised here for comparison purposes (see Figure 1). The strong band centred at 1720 cm−1 was ascribed to ν(C=O) vibrations of carboxylic acid groups (-COOH) and 2-pyrone structures, both involved in hydrogen bonding [27,28,29]. The presence of carboxylic acid groups in AC was further evidenced by bands registered at 1279 cm−1 and 901 cm−1. Furthermore, a large number of features, including bands and shoulders at 1657 cm−1, 1636 cm−1, 1249 cm−1, 1024 cm−1, and 740 cm−1, among others, were tentatively assigned to chromene and/or pyrone-type structures (hereafter referred to as CPS). The band observed at 1024 cm−1 was specifically associated with CPS and ether-type structures [27]. Moreover, the relatively weak absorption of infrared radiation at around 1200 cm−1 suggested a low content of phenolic hydroxyl groups (C-OH) in AC.
The FT-IR spectrum of the ACB “blank” sample, when compared with that acquired for the pristine AC, displays two stronger absorption bands centred at 1642 cm−1 and 1192 cm−1. The former, which exhibits a shoulder at around 1700 cm−1, is an overlapping band consistent with the presence in ACB of oxygen-containing surface functional groups, such as intramolecular hydrogen-bonded carboxylic acid groups [30] and/or conjugated carbonyl groups [28]. The latter spectral feature is attributed to the ν(C-O) vibration mode of phenolic hydroxyl groups (C-OH). Furthermore, another relevant feature of the infrared spectrum of ACB is the pronounced absorption decrease observed in the range between ca. 1060 cm−1 and 950 cm−1, which suggests the oxidation of reducing structures present in the AC surface, such as CPS, during the soaking and oven-drying treatments.
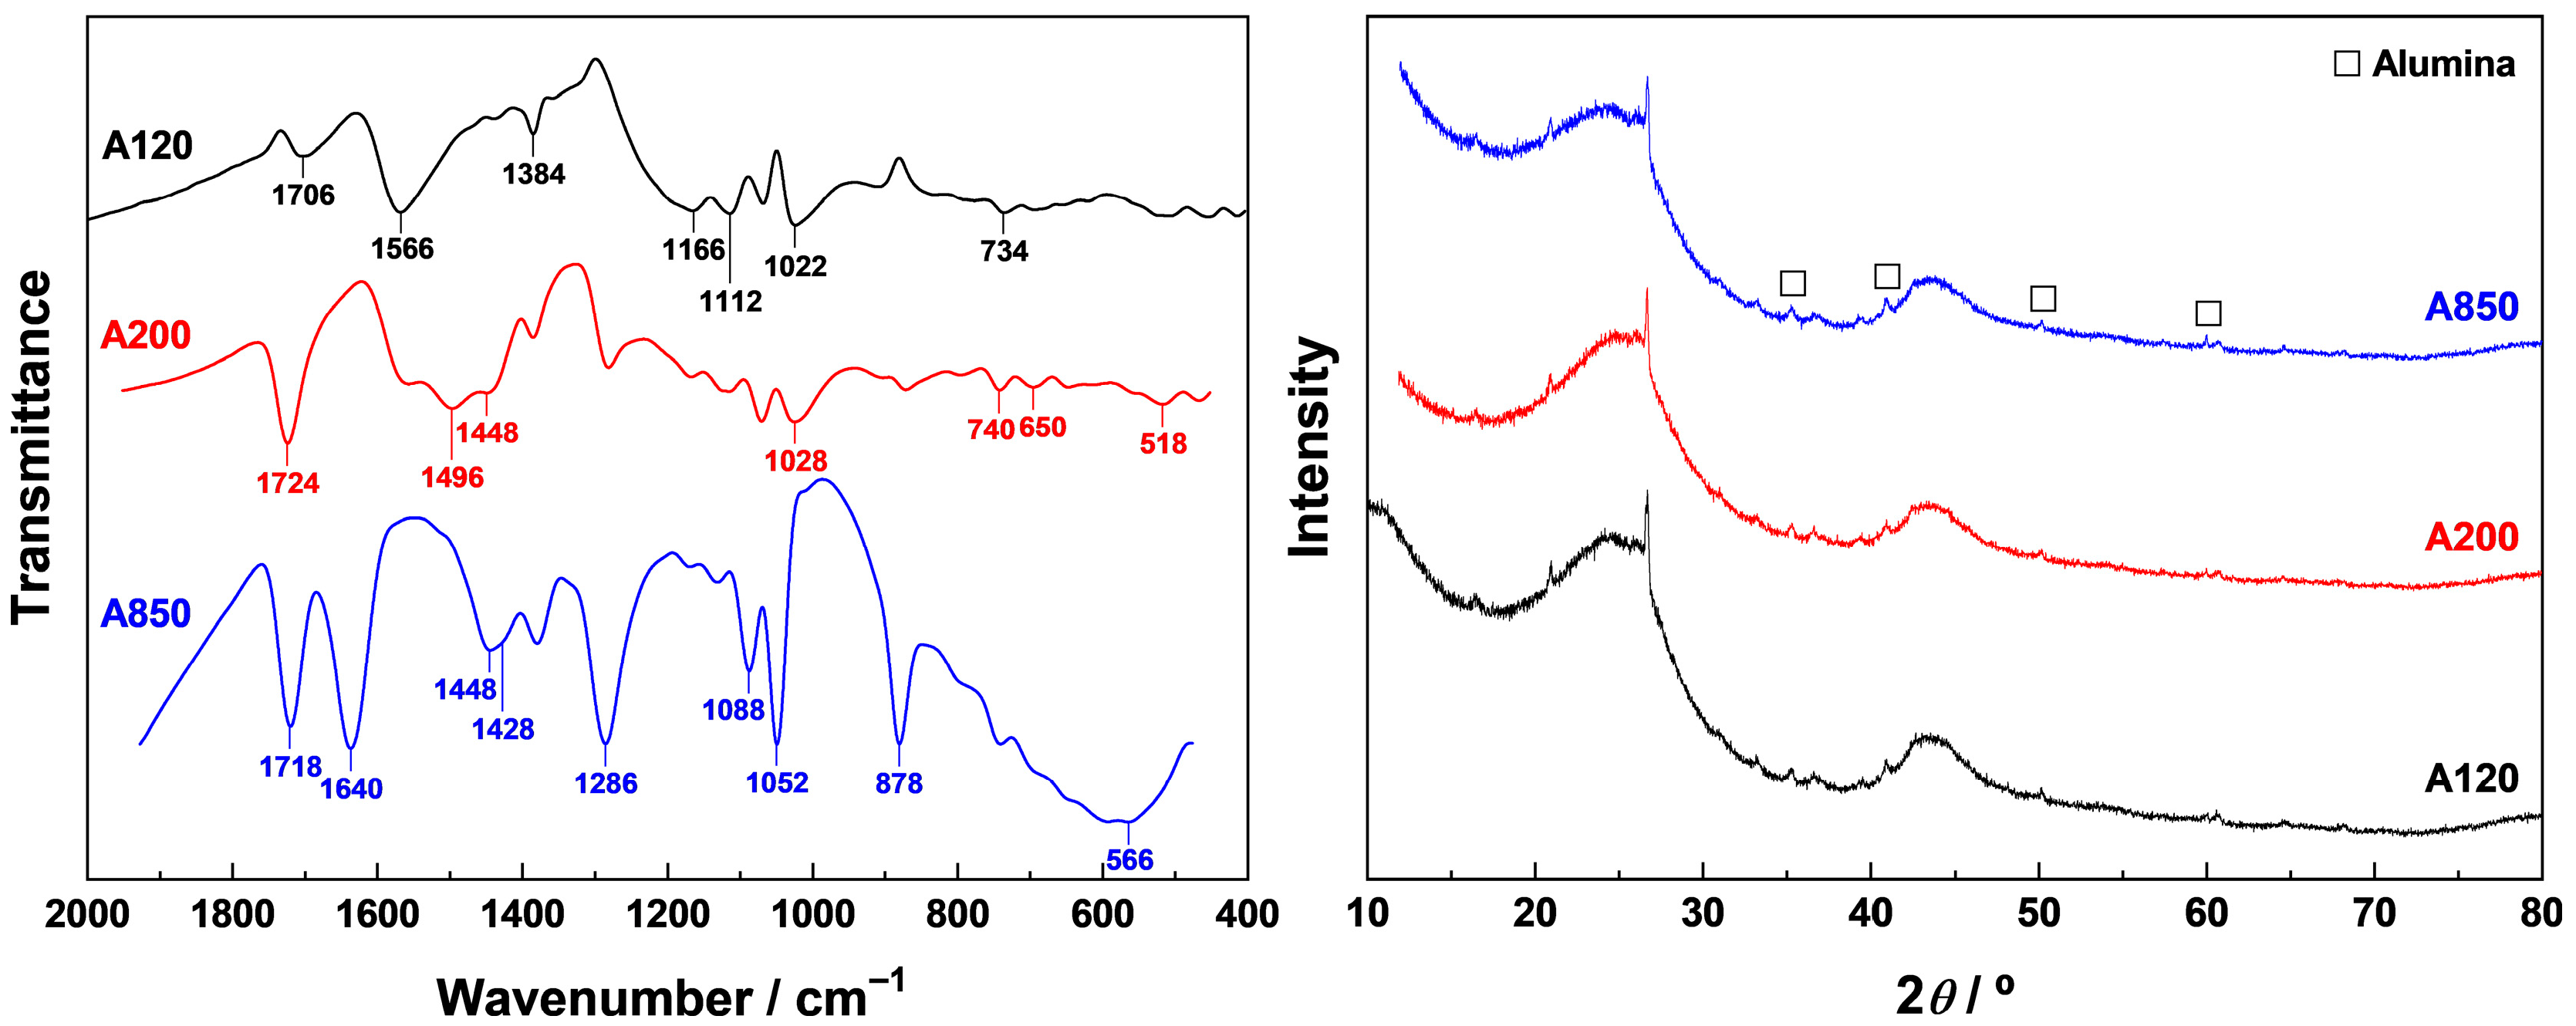
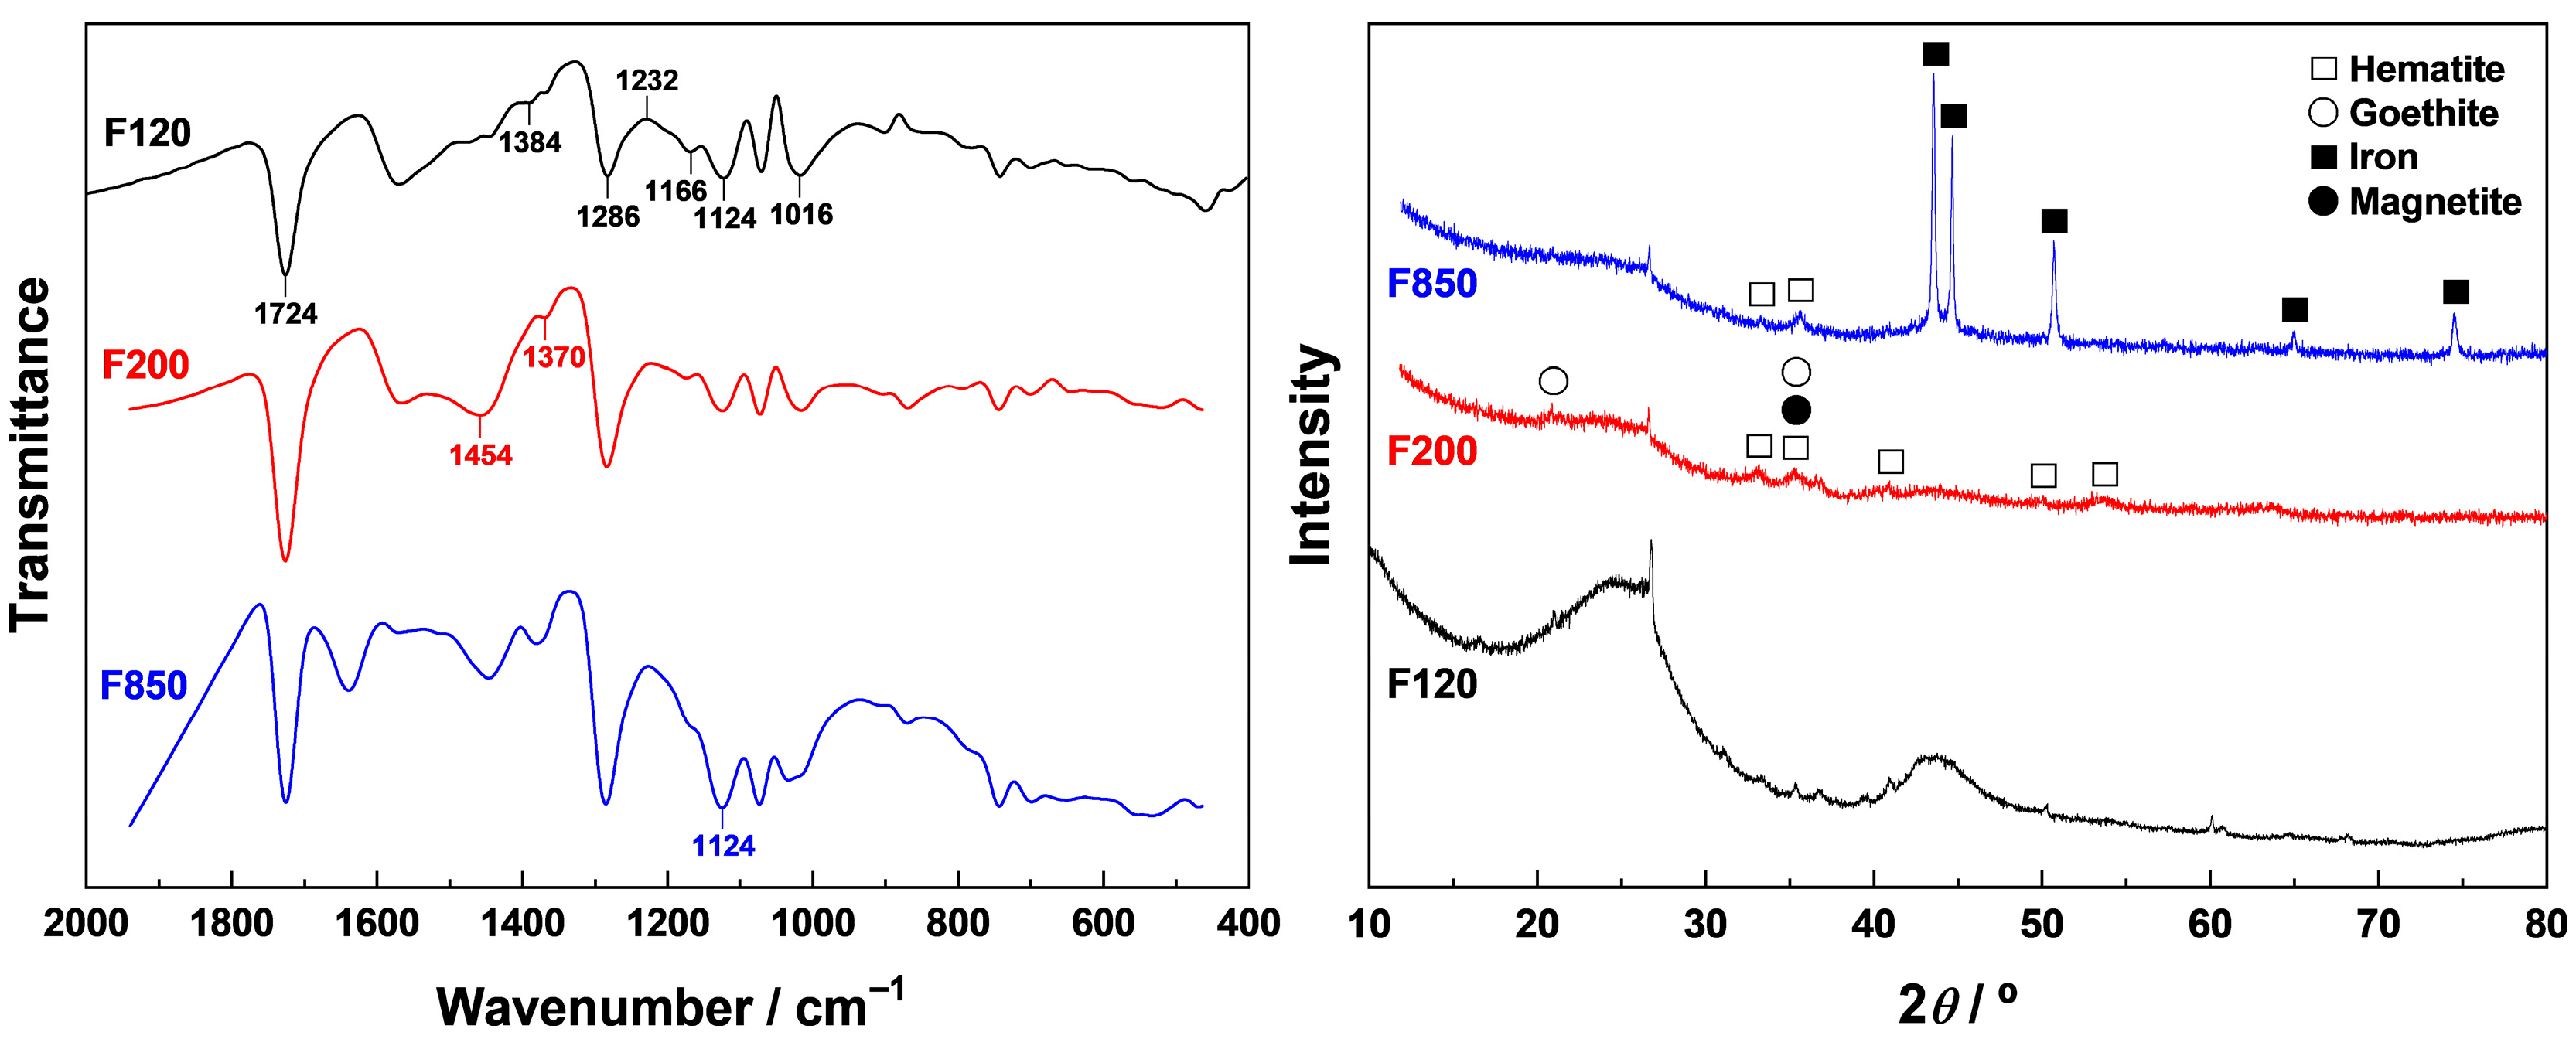
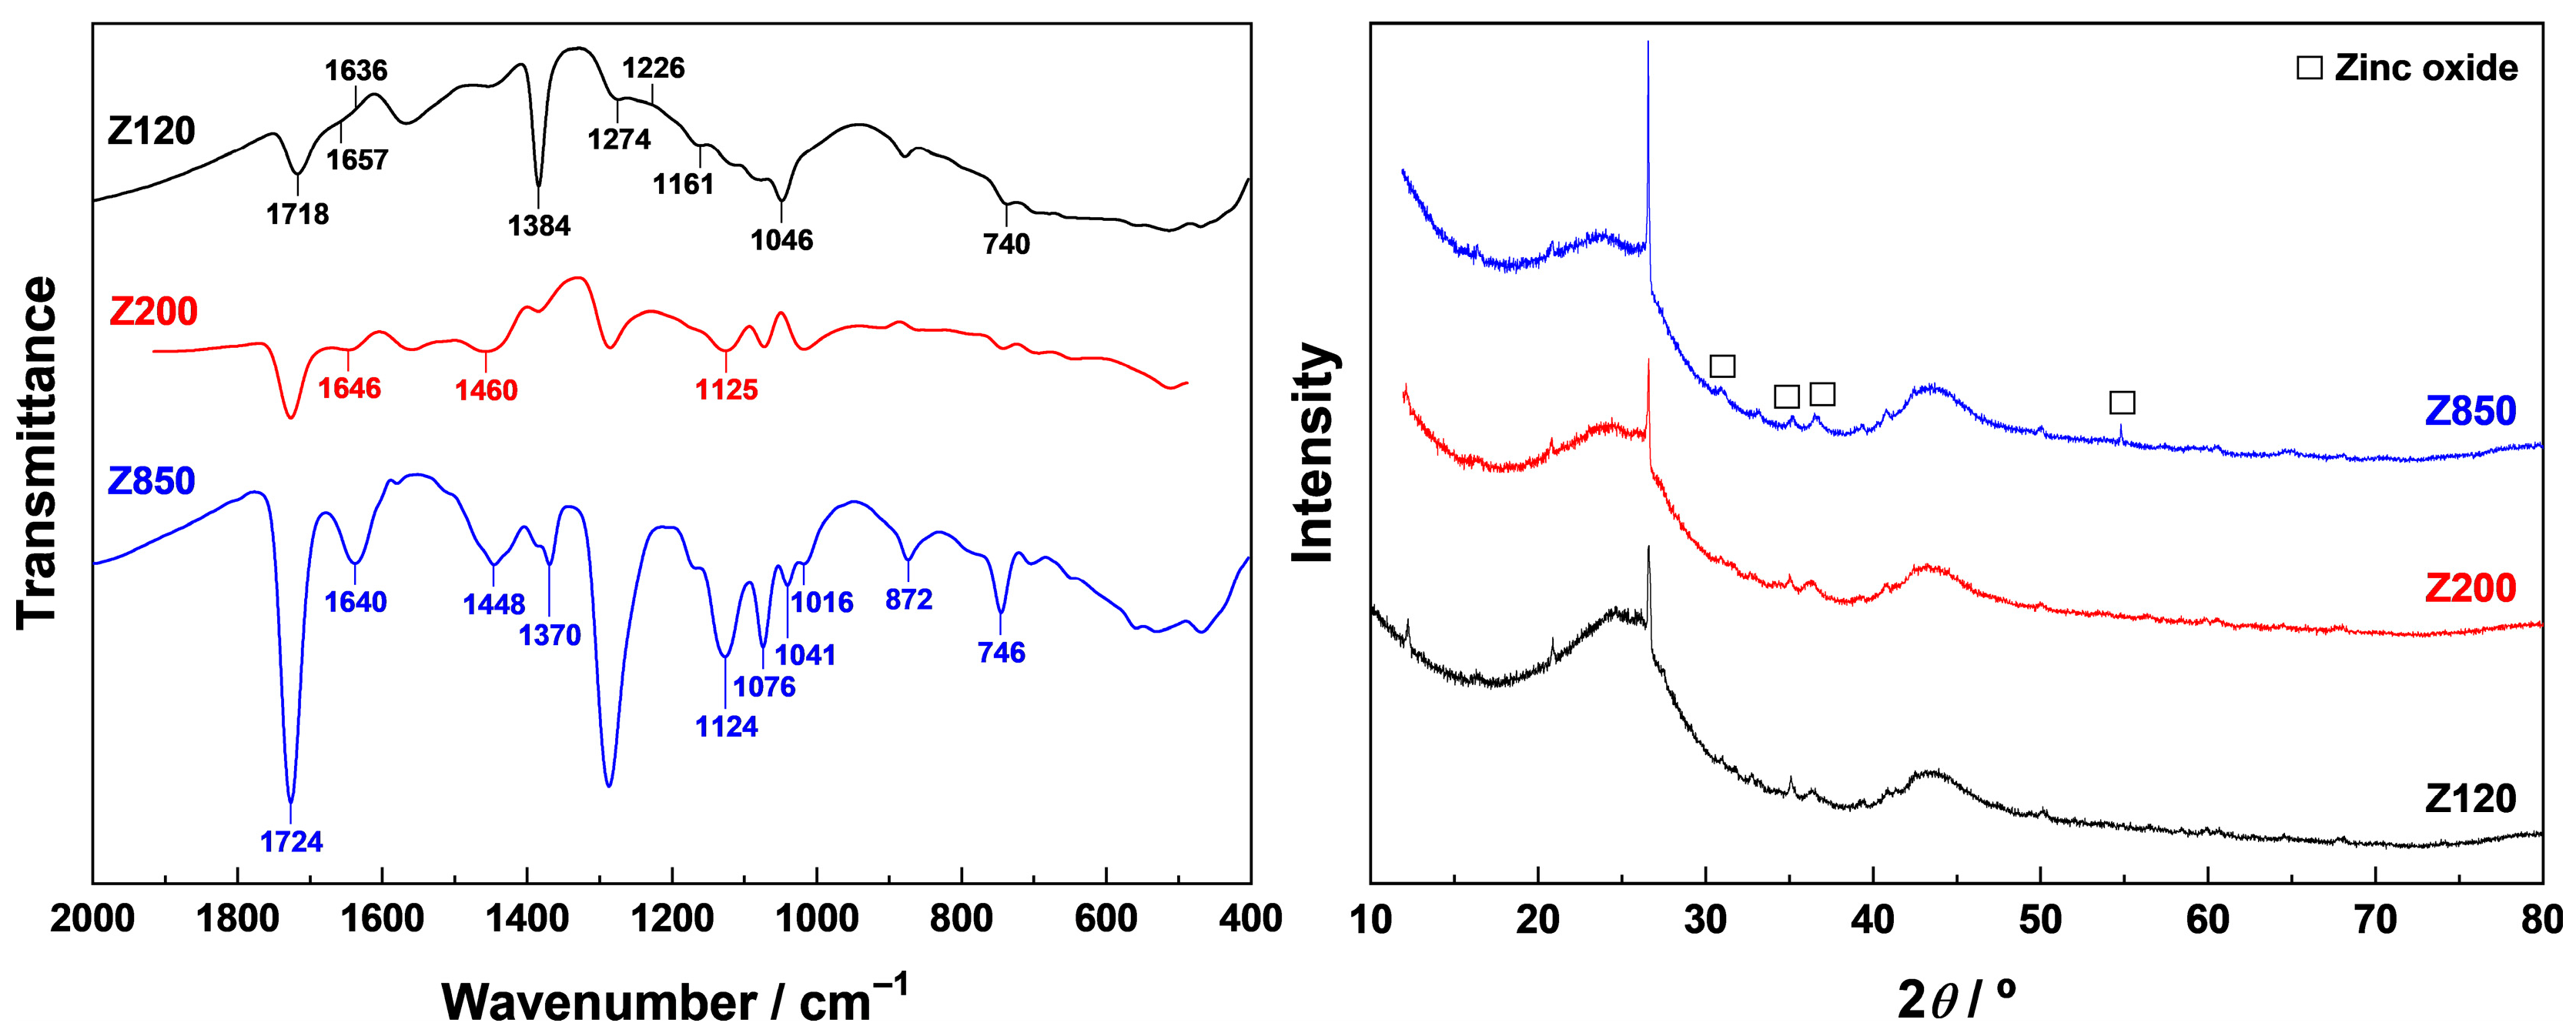
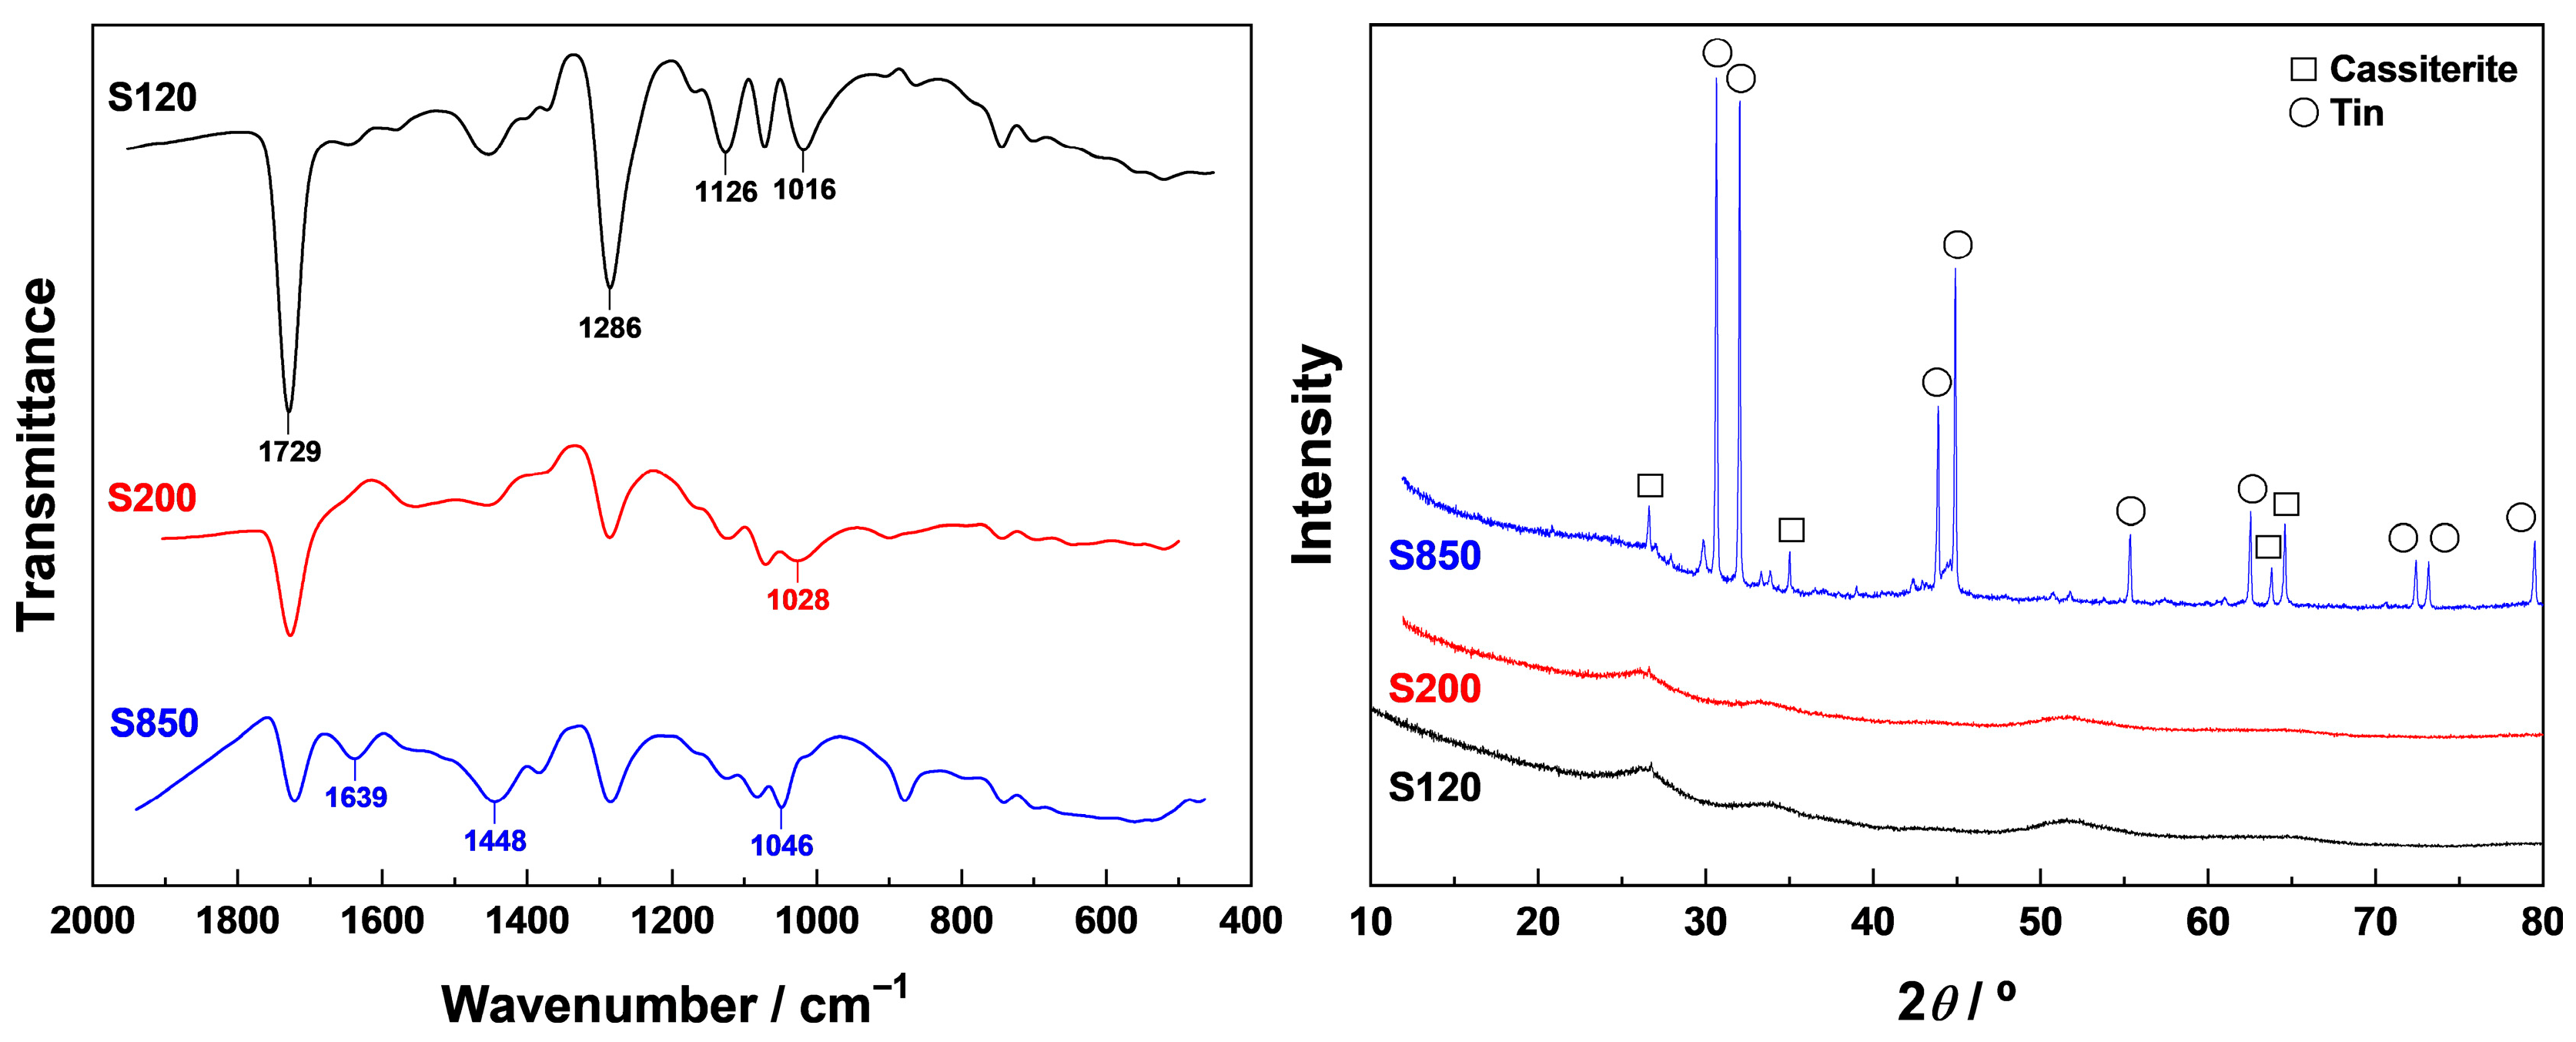
The FT-IR spectra registered for the MO/AC samples are plotted separately for each MT sample series in Figure 2, Figure 3, Figure 4, Figure 5 and Figure 6, thus enabling a detailed comparison of their surface chemical features.
Samples AT
During the preparation of A120 from AC and the Al3+ aqueous solution at an initial pH of 2.91, the loading of Al3+ species on AC’s surface during the soaking step at 80 °C, as well as the water vaporisation during the oven-drying step at 120 °C, were expected to be accompanied by wet and dry oxidation of the carbon support. These oxidation processes likely involved oxidising species such as nitrate ions (NO3) in the impregnation solution and atmospheric oxygen (O2), respectively. Also, the vaporised water could include not only solvent water but also water generated from the condensation of C-OH and Al-OH groups, resulting in the formation of C-O-Al bonds, as suggested by several both experimental and theoretical studies (see [31,32] and references therein).
The FT-IR spectra recorded for the AT samples are plotted in Figure 2. In the case of A120, as compared to the bare AC, the most prominent spectral changes are the shift in the band at 1720 cm−1 to 1706 cm−1, which becomes significantly weaker, the absence of the shoulders at 1657 cm−1, 1636 cm−1, and 1249 cm−1, and a marked intensity decrease in the bands at 1022 cm−1 and 734 cm−1. Conversely, absorption greatly increases in the region between 1300 cm−1 and 1166 cm−1. Accordingly, these results suggest that CPS, which are reducing in character [21], underwent oxidation during the impregnation of AC with the Al3+ solution, leading to a great formation of phenolic hydroxyl groups. The minor band observed at 1706 cm−1 indicates the presence of a small amount of undissociated carboxylic acid groups in the sample. Furthermore, the band position is too low to be attributed to non-hydrogen-bonded carboxylic acid groups [33,34,35]. The weak band centred at 1384 cm−1 is attributable to free nitrate ions, since this chemical species as a coordinate ligand and carbon–nitrogen surface complexes absorb in different regions of the infrared spectrum [27,36]. Similar band assignments have been reported for nitrate ions in both organic and inorganic matter [37,38]. The increase in intensity of the band at 1166 cm−1, which is ascribable to δ(O-H) vibrations, is indicative of the presence of Al-OH groups in the A120 sample. Thus, previous studies on the Raman and IR spectra of boehmite (γ-AlOOH) have associated infrared bands at 1157 cm−1, 1068 cm−1, and 746 cm−1 with δas(O-H), δs(O-H), and γ(O-H) bond vibrations, respectively [39,40,41,42,43,44,45,46]. Absorptions at lower frequencies may arise from O2 chemisorbed on AC’s surface and from ν(C-O) and ν(Al-O) vibrations. For O2, the ν(O-O) vibration band in O2 ions typically appears in the 1180–1060 cm−1 range [47].
The FT-IR spectrum for A200 also displays a strong absorption band peaking at 1724 cm−1, slightly shifted to higher frequencies as compared to AC. However, absorption greatly decreases in the region between 1232 cm−1 and 1166 cm−1, and the bands located at 1112 cm−1 and 1022 cm−1 are notably weaker for both A200 and A120. These spectral changes suggest that carboxylic acid groups were formed by oxidation of C-OH groups and CPS during the heat treatment of A120 at 200 °C. Since this treatment was conducted under a nitrogen atmosphere, it is plausible that the oxidation process was driven by chemical species remaining in A120 after the oven-drying step, such as chemisorbed oxygen. On the other hand, the absorption decrease around 1166 cm−1 is consistent with the dehydroxylation of Al-OH groups. The development of two additional bands at 1496 cm−1 and 1448 cm−1 in the spectrum of A200 suggests the formation of metal carboxylate or complex structures, likely from the interaction of -COOH and -C-OH groups with partially dehydroxylated Al3+ ions. This assumption is further supported by the appearance of a series of bands at 740 cm−1, 650 cm−1, and 518 cm−1, which are attributable to ν(Al-O) vibrations in Al-O bond-containing structures [39,40,41,44,45,46,48]. Of course, in any event the reaction between surface oxygen groups and the supported metal ion should occur in the solid state, instead of in solution as usual in the preparation of metal complexes. The presence of the band at 1384 cm−1 in both the A120 and A200 spectra indicates that nitrate ions remained thermally stable at 200 °C. Finally, from the presence of the band at 1028 cm−1 in the A200 spectrum it becomes clear that oxygen-containing structures other than the CPS of AC absorbed infrared radiation in this spectral region. Probably, they are ether-type structures [17], which should exhibit chemical and thermal stability under the preparation conditions of A120 and A200, respectively.
As major salient changes, the FT-IR spectrum of A850 displays a couple of strong bands at 1718 cm−1 and 1286 cm−1, attributable to carboxylic acid vibrations [49]. In addition, it also appears a very intense band at 1640 cm−1, which is ascribed to the ν(C=O) vibration in 4-pyrone structures bearing carboxyl group-containing substituents. This band assignment is fairly consistent with the infrared spectrum of 4-oxo-4H-pyran-2,5-dicarboxylic acid (isochelidonic acid), which shows characteristic bands at 1713 cm−1, 1662 cm−1, 1605 cm−1, and 1560 cm−1 [50]. These structures likely originated from the oxidation of the carbon support in A120 by Al2O3 at high temperatures. Although α-Al2O3 is a very stable compound from both the thermal and chemical standpoints, an amorphous Al2O3 phase may have transiently formed during the preparation process of A850 from A120 [25]. This amorphous phase, being much more reactive than α-Al2O3, was able to interact chemically with the carbon support. Moreover, since metallic aluminium is a very powerful reducing agent, this transient Al2O3 phase should behave as a mild oxidant even at elevated temperatures. The redox reactions likely resulted in the formation of reducing structures, such as 4-pyrones. This hypothesis is further supported by the appearance of strong absorption bands at 1088 cm−1, 1052 cm−1, 878 cm−1, and 566 cm−1, which are all compatible with the presence of intermediate Al-O-Al atomic groupings in the A850 sample [51,52,53]. Such features denote a slow reduction of Al2O3 by the carbon support (i.e., the so-called carbothermal reduction), leading to the release of CO and eventually to the formation of metallic aluminium [25], which should then melt and vaporise at temperatures above its melting point (660.3 °C [54]). Perhaps, this carbothermal reduction process gave rise to the formation of transient Al atomic groupings and carbon–oxygen surface groups, including 4-pyrone-type structures. As an alternative assignment, the band at 1640 cm−1, together with the band at 1448 cm−1 featuring a shoulder at 1428 cm−1 and the band at 1384 cm−1, may also be associated with metal carboxylates exhibiting bidentate bridging and chelating coordination modes [55,56,57]. Finally, while quinone-type structures also absorb infrared radiation at nearby frequencies to 1640 cm−1 [30], their presence in A850 seems unlikely due to their thermal instability at temperatures far below 850 °C [58].
Samples FT
The FT-IR spectra registered for the FT samples are presented in Figure 3. As compared to the spectrum of the bare AC support, the spectrum of F120 displays two significantly stronger bands centred at 1724 cm−1 and 1286 cm−1. By contrast, absorption decreases in the region between 1232 cm−1 and 1166 cm−1, and the asymmetrically shaped band at 1016 cm−1 becomes notably weaker. From these infrared results it may be concluded that during the impregnation of AC with the Fe3+ aqueous solution, C-OH groups and CPS were oxidised and transformed into carboxylic acid groups. Furthermore, C-OH groups may have also been involved in the formation of C-O-Fe atomic groupings, as evidenced by the changes undergone by the band centred at 1124 cm−1. This band, ascribable to ν(C-O) vibrations in such groups, becomes broader and stronger in the spectrum of F120. Nevertheless, it is worth mentioning that both Fe-OH groups, owing to their δ(O-H) vibration mode, and chemisorbed O2 also absorb in the same spectral region as C-O bonds, as commented above. In addition, the faint shoulder at 1384 cm−1 proves a low content of nitrate ions in F120, which behaved as a strong oxidising agent in the Fe3+ impregnation solution at the initial pH of 1.5 and were then released as reddish-brown NO2 gas during the soaking step at 80 °C.
On the other hand, the spectral changes observed for F200 suggest that the heat treatment of F120 at 200 °C resulted in a greater presence of surface carboxylic acid groups in the sample. Similarly to A200, the formation of metal carboxylate-type structures is clearly evidenced by the appearance of a pair of characteristic bands at 1454 cm−1 and 1370 cm−1 [55,56,57]. In the case of F850, 4-pyrone structures were also generated, although to a lesser extent than in its A850 counterpart. However, unlike for this latter material, the heat treatment of F120 at high temperature appears to favour the formation of C-O-M atomic groupings rather than M-O-M atomic groupings, as inferred from the marked intensity increase observed exclusively for the band at 1124 cm−1 in the spectrum of F850. The formation of these C-O-Fe groups likely involved -COOH groups, as for metal carboxylates with unidentate coordination [55], rather than phenolic C-OH groups, since infrared absorption increased at around 1200 cm−1 for F850. According to the spectral results for A850 and F850, the reactivity of the supported metal oxide at high temperatures is considered as the primary factor controlling the compositional changes in the samples. In this regard, the reactivity should be higher for Fe2O3 than for Al2O3.
Samples ZT
In the spectrum of Z120 shown in Figure 4, several significant changes are evident compared to the spectrum of the pristine AC support. The most prominent modifications include a decrease in the intensity of the band centred at 1718 cm−1, which is slightly shifted to lower frequencies, as well as in the regions spanning from 1657 cm−1 to 1636 cm−1, between 1274 cm−1 and 1226 cm−1, and around 740 cm−1. Conversely, an increase in absorption is observed in the wavenumber range from 1226 cm−1 to 1161 cm−1. These spectral changes are fully consistent with the oxidation of CPS on the AC surface, leading to the formation of C-OH groups in Z120. Phenolic C-OH groups may transform into C-O-Zn groups, as suggested by the development of the strong band at 1046 cm−1. However, in this connection, it should be borne in mind that the degree of hydrolysis for Zn2+ ions is lower than that for both Al3+ and Fe3+ ions [21,23,24,59]. Additionally, the band at 1046 cm−1 can also be attributed to surface O2 species present in Z120. In summary, the infrared results for Z120 reveal that the impregnation of AC with the Zn2+ aqueous solution had a less pronounced impact on the surface chemistry of the carbon support as compared to the effects induced by the Al3+ and Fe3+ impregnation solutions. The much stronger band at 1384 cm−1 for Z120, relative to A120 and particularly F120, suggests a considerably higher nitrate content in Z120 than in the other materials. This observation is well in agreement with the greater nitrogen content determined for this latter material by elemental analysis (0.61 wt.% for Z120 vs. 0.49 wt.% and 0.44 wt.% for A120 and F120, respectively).
The comparison of the FT-IR spectra recorded for the Z120 and Z200 materials indicates that the heat treatment of Z120 at 200 °C under an inert atmosphere resulted in an increased content of carboxylic acid groups in Z200. Since absorption decreases around 1657 cm−1, between 1600 cm−1 and 1500 cm−1, and very especially in the region from 1200 cm−1 to 950 cm−1 (e.g., notice that the band at 1048 cm−1 present in the spectrum of Z120 is absent in that of Z200), it seems that these carboxylic acid groups were formed from the oxidation not only of CPS but also of C-OH groups. Moreover, the slight development of the bands centred at 1646 cm−1, 1460 cm−1, and 1125 cm−1 points to the presence of surface structures other than carboxylic acid groups in Z200. The partial removal of nitrate ions from Z120 during its heat treatment at 200 °C is clearly evidenced by the attenuation of the characteristic sharp and intense band at 1384 cm−1 in the Z200 spectrum, as well as by the lower nitrogen content estimated for this sample in comparison to its Z120 parent (see Table 2).
The FT-IR spectrum of Z850 exhibits a large number of well-developed bands located at 1724 cm−1, 1640 cm−1, 1448 cm−1, 1370 cm−1, 1124 cm−1, 1076 cm−1, 1041 cm−1, 872 cm−1, and 746 cm−1, together with a noticeable decrease in the intensity of the band at 1016 cm−1. According to these spectral modifications, it is concluded that heat treatment of Z120 at 850 °C under an inert atmosphere was highly effective in developing oxygen-containing surface groups and structures. In brief, from the FT-IR spectra of the materials prepared from the parent samples impregnated with metal nitrate precursor aqueous solutions by subsequent heating at 850 °C, it becomes apparent that the surface chemistry of Z850 is more similar to that of F850 than to A850. Furthermore, based on band intensities, the relative content of surface groups and structures or atomic groupings in these materials can be ranked as follows: Z850 > A850 ≈ F850 for carboxylic acid groups; A850 > F850 ≈ Z850 for 4-pyrone structures; and F850 ≈ Z850 > A850 for C-O-M atomic groups.
Samples ST
In the spectrum of S120 plotted in Figure 5, the bands centred at 1729 cm−1, 1286 cm−1, and 1124 cm−1 are significantly more intense, while the band at 1016 cm−1 is weaker, featuring a noticeable absorption decrease on its lower-frequency side. Therefore, as observed for other samples prepared in the present work, the impregnation of AC with a SnCl2 aqueous solution at 80 °C strongly promoted the formation of carboxylic acid groups from CPS. This effect was particularly pronounced for S120 if one allows for its high yield of 149 wt.% and its notably low carbon content (see data in Table 2). A similar trend also applies to both the nitrogen and sulphur contents, whereas the high hydrogen content further corroborates the great presence of carboxylic acid groups in this material. The infrared results for S120 are consistent with the generation of strong oxidising species during the oxidation of SnCl2 by atmospheric oxygen in the aqueous impregnation solution (see [20] and references therein for further details) and with the behaviour of SnO2 as an oxidation catalyst [60,61,62]. Moreover, the increased intensity of the broad band centred at 1124 cm−1 provides evidence for the formation of C-O-Sn atomic groupings. In stark contrast, the ether-type structures, absorbing near 1020 cm−1, appeared to remain largely unaffected by the impregnation of AC with the SnCl2 solution, as suggested by the intensity of this band.
The FT-IR spectra of S200 and S850 reveal a progressive decrease in the content of carboxylic acid groups with increasing heat treatment temperature during their preparation. Correspondingly, the hydrogen and oxygen contents are progressively lower for S200 and S850, as shown in Table 2. The band initially registered at 1016 cm−1 for S120 shifts upward to 1028 cm−1 for S200 and further to 1046 cm−1 for S850. Interestingly, the band at 1046 cm−1 is relatively strong, and the spectrum of S850 also features a well-defined band at around 1639 cm−1. Additionally, a prominent band at 1448 cm−1 is clearly visible in the spectrum of this sample. All these spectral changes are compatible in turn with the presence of C-O-Sn bonds, 4-pyrone structures, and carboxylate-like groups in S850. The heat treatment at 850 °C under a nitrogen atmosphere was accompanied by the carbothermal reduction of SnO2, followed by the subsequent vaporisation of the resulting metallic tin [25] (in this regard, note that the melting point for this metal is as low as 231.9 °C [54]). This process is reflected in the low yield of 68 wt.% obtained for S850. The vaporisation of tin is further supported by the vanishment of those absorption bands associated with the vibration modes of Sn-O-Sn atomic groupings in the FT-IR spectrum of S850 [63].
Samples WT
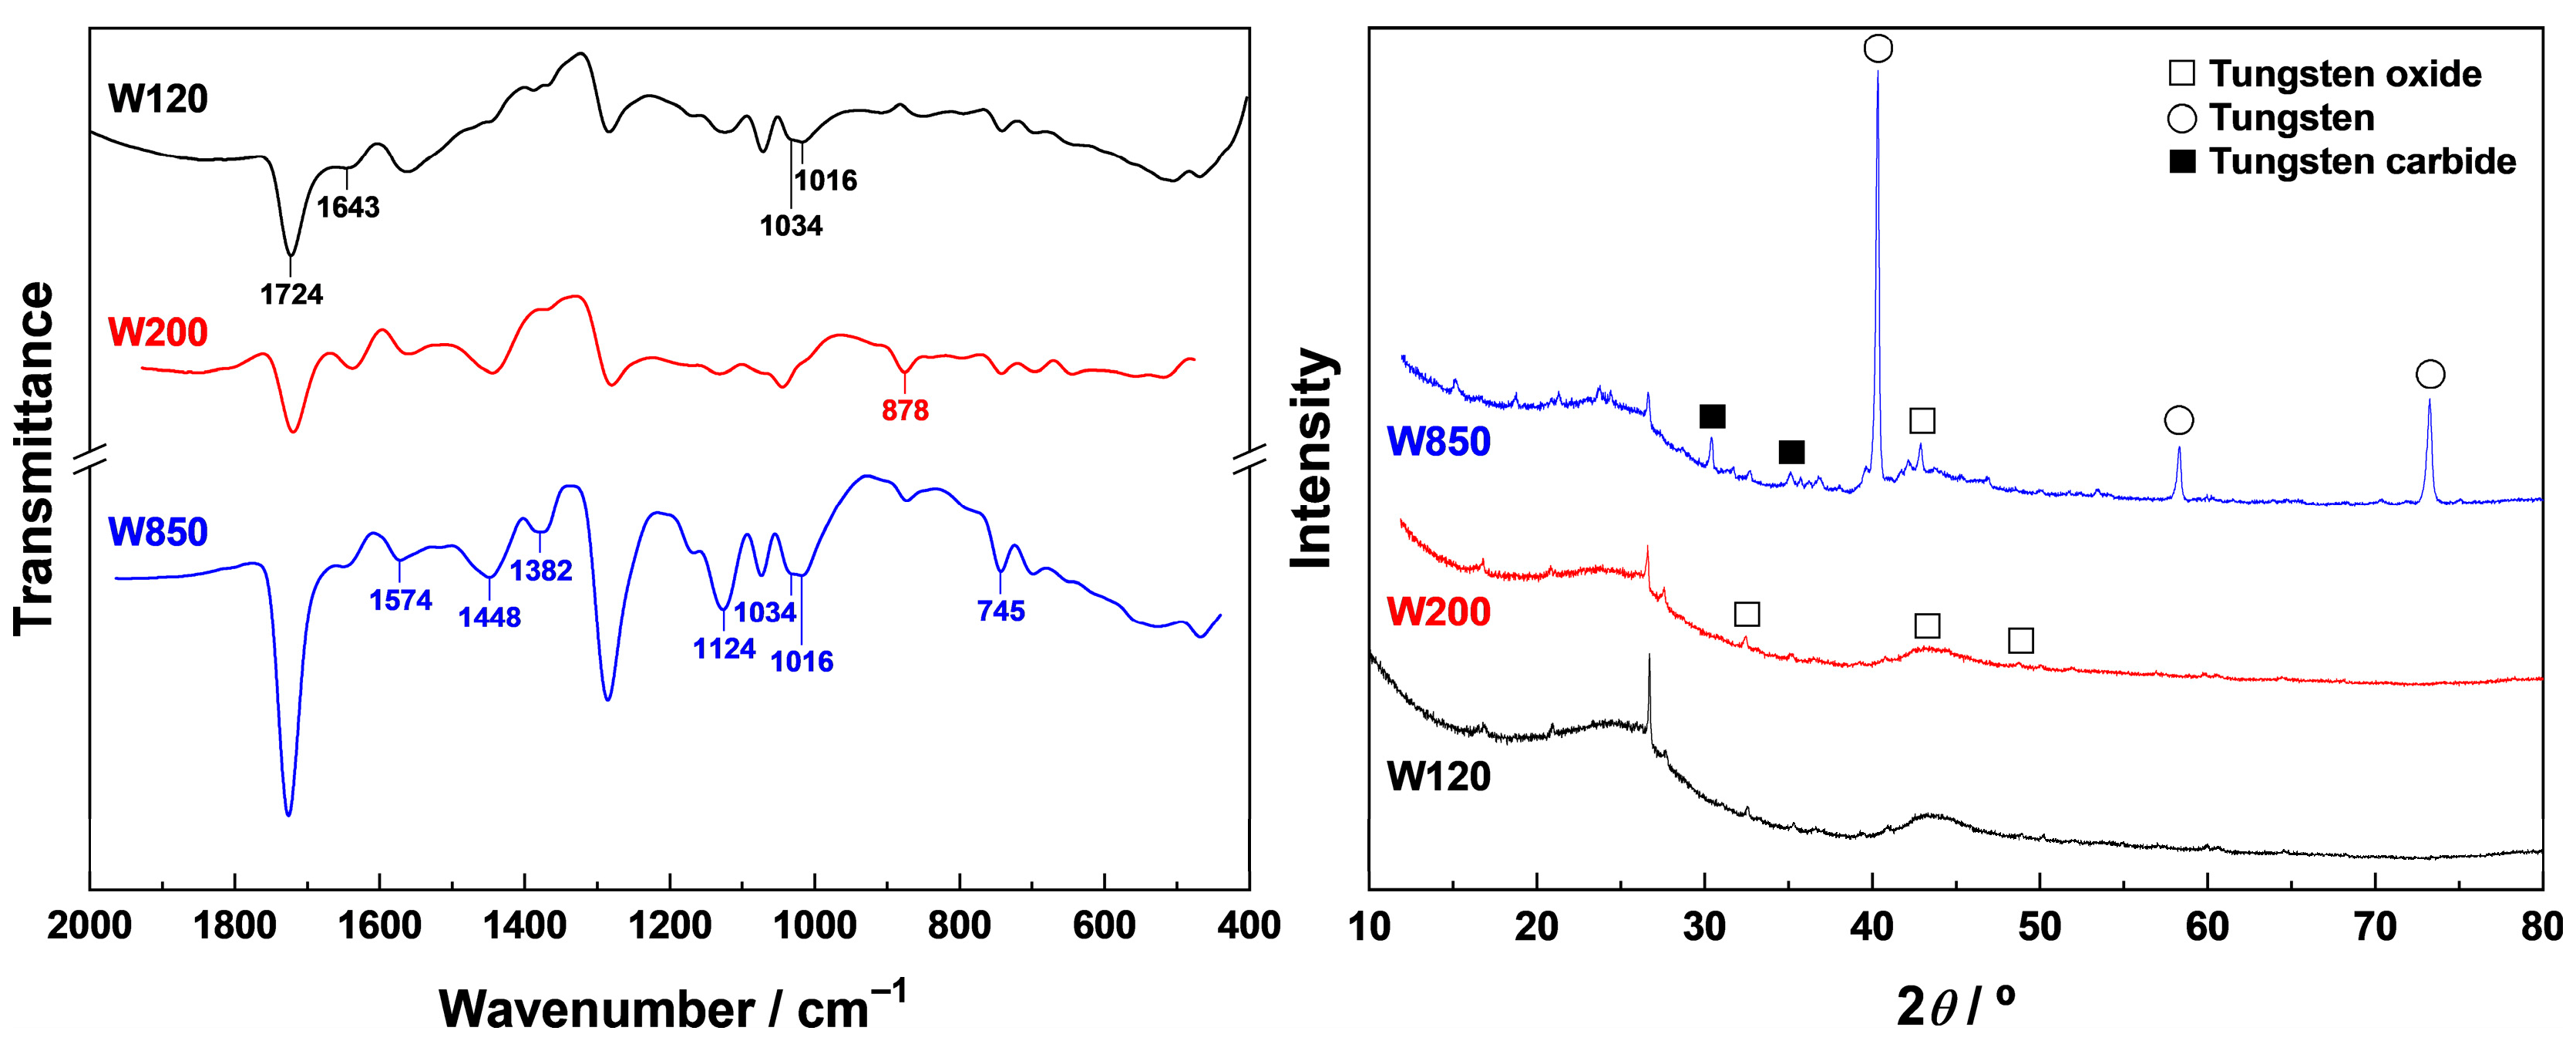
The FT-IR spectrum of W120, shown in Figure 6, exhibits an increased intensity of the band at 1724 cm−1, with a shoulder at 1643 cm−1, and a decreased intensity of the overlapping bands centred at 1034 cm−1 and 1016 cm−1. Notice that the absorption decrease is clearly more pronounced for the former band than for the latter. These spectral features suggest that, during the preparation of W120, not only CPS but also ether-type structures underwent oxidation, resulting in the formation of carboxylic acid groups. This interpretation is further corroborated by the elemental analysis data for AC and W120 (see Table 2), which reveals that the preparation process of W120 was accompanied by a marked decrease in the carbon content and an increase in both the hydrogen and oxygen contents. Also, 4-pyrone-type structures appear to form as a result of the oxidation of AC. As evidenced by relative band intensities, the amount of these oxygen-containing structures increases for W200 but remains largely unchanged for W850. Nevertheless, the content of carboxylic acid groups is markedly higher in W850 as compared to both W120 and W200, the values being roughly similar for this couple of materials. Overall, these infrared results indicate that the supported tungsten oxide phases, primarily consisting of WO3 as previously confirmed by XRD [16] (see Figure 6), behave as effective catalysts [64] of the oxidation processes leading to the formation of the aforementioned structures. The spectrum of W850 also features a strong band centred at 1124 cm−1 and two overlapping bands peaking at 1034 cm−1 and 1016 cm−1, which are ascribable to an enhanced presence of C-O-W and W-O-W atomic groupings in this material [65,66]. Furthermore, it is also worth highlighting that tungsten carbide phases, whose presence in W850 was also identified by XRD in a previous work [16], absorb infrared radiation in the region spanning from ca. 1300 cm−1 to 1040 cm−1 due to their ν(W-C) vibration modes [67,68]. Consequently, the enhanced absorption observed in the wavenumber range between 1400 cm−1 and 1000 cm−1 can be partially attributed to these tungsten carbide phases. Additionally, W850 displays three broad bands centred at 1574 cm−1, 1448 cm−1 and 1382 cm−1 (notice that these features are also registered in the spectrum of both W120 and W200, with the latter appearing as a barely visible shoulder), which are potentially associated with carboxylates [66]. Finally, the weak bands observed at around 878 cm−1 and 745 cm−1 may be assigned to the ν(O-W-O) [69] and ν(W-O-W) [66] vibrations, respectively. As shown in Table 2, the thermal treatment of W120 at 850 °C resulted in a slight decrease in the carbon and hydrogen contents, along with an increase in the oxygen content.

3.2.2. pH of the Point of Zero Charge

The pHpzc for AC is 10.50, consistent with the presence of oxygen-containing surface groups and structures with a well-known basic character, such as CPS [17,70,71]. For the MO/AC samples (see data in Table 3), the pHpzc values are lower than that of AC and are strongly influenced by both the impregnation agent and the preparation method. For series S1, the pHpzc follows the trend S120 < F120 < A120 < Z120 < W120. In the case of series S2, the pHpzc remains essentially unchanged for S200, slightly increases for F200, A200, and Z200, and decreases only for W200. In series S3, the pHpzc values fall within a narrow range, from 8.80 for F850 to 9.80 for Z850, thereby approaching the value for the raw AC support. Although basic surface structures are expected to contribute to the basicity of these samples, the band intensities associated with CPS do not exhibit a direct correlation with pHpzc. Instead, the surface basicity of the MO/AC materials is more likely influenced by the content of carboxylic acid groups and their chemical state, specifically whether they are found in free form or coordinated as metal carboxylates.

4. Conclusions

Activated carbon has been traditionally regarded as an inert support in the preparation of supported metal oxide catalysts. Nevertheless, experimental evidence has suggested that this is a very simplistic approach, as relevant chemical transformations may occur on the carbon surface during the various stages of catalyst preparation. Accordingly, this study aimed at investigating the evolution of surface chemistry in a commercial activated carbon during the preparation of metal oxide–activated carbon catalysts by the conventional wet impregnation method. Special attention was given to the chemical changes involving oxygen-containing functional groups and structures in the carbon surface across the three successive preparation steps of impregnation, oven-drying, and thermal treatment. For such a purpose, three series of samples were prepared by soaking the commercial activated carbon with Al(NO3)3, Fe(NO3)3, Zn(NO3)3, SnCl2 or Na2WO4 precursor aqueous solutions at 80 °C for 5 h followed by oven-drying at 120 °C for 24 h (series 1), and heat treatment of the dried solids at either 200 °C (series 2) or 850 °C (series 3) for 2 h under an inert atmosphere. From their surface chemistry characterisation, primarily conducted by FT-IR spectroscopy and complemented by elemental analysis and pHpzc measurements, the following main conclusions may be drawn:
  • The impregnation of AC and subsequent oven-drying in the preparation of the S1 samples usually result in the formation of phenolic hydroxyl and carboxylic acid groups by oxidation of chromene, pyrone, and ether-type structures initially present in the surface of the raw support. The extent of these oxidations fairly well correlated with the oxidising power of the precursor aqueous solutions, particularly those prepared from metal nitrate and SnCl2 salts.
  • The chemical changes undergone by the AC surface as a result of the heat treatment of the S1 samples at 200 °C or 850 °C under an inert atmosphere are markedly stronger for the higher temperature. In the case of the S3 samples, a drastic restructuring of the carbon surface was observed, leading to the formation of carboxylic acid groups, 4-pyrone groups, coordinated metal carboxylates, and C-O-M atomic groupings. In addition, carbothermal reduction reactions also occurred, further influencing both the surface chemistry and the evolution of the supported metal phases.
  • The chemical transformations observed in the AC support surface because of the preparation of the S1 samples have been essentially attributed to the oxidising action of the different chemical species present in the impregnation solution or generated during the soaking step, as well as to the behaviour of the supported MOs as oxidation catalysts. Upon subsequent heat treatment at 200 °C or 850 °C, the chemical modifications have been associated with the presence of chemisorbed oxygen in the oven-dried samples, together with the carbothermal reduction of MOs and other thermal effects taking place at high temperatures.
  • Although all the employed metal precursors significantly modified the AC surface chemistry, clear differences were observed. Fe(NO3)3 and SnCl2 precursors caused the strongest oxidative effects, Zn(NO3)2 induced comparatively milder modifications, Al(NO3)3 likely favoured the formation of 4-pyrone structures at high temperature, and Na2WO4 promoted both oxidation and carburisation. Overall, these differences highlight the pivotal role of the metal precursor in determining the evolution of the surface chemistry of the carbon support during the preparation of MO/AC catalysts.
  • The pHpzc values as a rule decreased markedly upon impregnation and oven-drying at 120 °C, with the extent depending on the precursor salt, while they underwent a notable increase when heating at 200 °C and especially 850 °C. These trends reflect progressive chemical changes in oxygen-containing surface functionalities, particularly in the chemical state of carboxylic acid groups.
In brief, the chemical transformations involving oxygen functional groups and structures in the AC surface are heavily influenced by both the nature of the MO precursor employed in the impregnation step and the subsequent heat treatment conditions. These findings provide valuable insights into optimising the preparation process of AC-supported MO catalysts for tailored surface properties in specific catalytic applications. Finally, the FT-IR spectroscopy technique has been proved as a powerful tool for unveiling the chemical changes undergone by the AC surface during each preparation step.

Author Contributions

Conceptualization, V.G.S.; methodology, A.B.-B. and V.G.S.; formal analysis, A.B.-B. and M.F.A.-F.; investigation, A.B.-B.; resources, M.F.A.-F. and C.F.-G.; writing—original draft preparation, A.B.-B. and V.G.S.; writing—review and editing, A.B.-B., M.F.A.-F., C.F.-G., and V.G.S.; visualisation, A.B.-B.; supervision, M.F.A.-F., C.F.-G., and V.G.S.; project administration, V.G.S.; funding acquisition, V.G.S. All authors have read and agreed to the published version of the manuscript.

Funding

This research was funded by the Junta de Extremadura and FEDER Program of EU. Adrián Bogeat-Barroso thanks Spanish Ministry of Education, Culture, and Sport for the concession of a FPU grant (AP2010-2574).

Data Availability Statement

The raw data supporting the conclusions of this article will be made available by the authors on request.

Conflicts of Interest

The authors declare no conflicts of interest.

References

  1. Védrine, J.C. Heterogeneous Catalysis on Metal Oxides. Catalysts 2017, 7, 341. [Google Scholar] [CrossRef]
  2. Védrine, J.C. (Ed.) Metal Oxides in Heterogeneous Catalysis; Elsevier: Amsterdam, The Netherlands, 2018; ISBN 978-0-12-811631-9. [Google Scholar]
  3. Védrine, J.C. Importance, Features and Uses of Metal Oxide Catalysts in Heterogeneous Catalysis. Chin. J. Catal. 2019, 40, 1627–1636. [Google Scholar] [CrossRef]
  4. Marsh, H.; Rodríguez-Reinoso, F. Activated Carbon; Elsevier: Amsterdam, The Netherlands, 2006; ISBN 9780080444635. [Google Scholar]
  5. Rodríguez-Reinoso, F.; Sepúlveda-Escribano, A. Carbon as Catalyst Support. In Carbon Materials for Catalysis; Serp, P., Figueiredo, J.L., Eds.; John Wiley & Sons, Ltd.: Hoboken, NJ, USA, 2008; pp. 131–155. ISBN 9780470178850. [Google Scholar]
  6. Barroso-Bogeat, A.; Fernández-González, C.; Alexandre-Franco, M.; Gómez-Serrano, V. Activated Carbon as a Metal Oxide Support: A Review. In Activated Carbon: Classifications, Properties and Applications; Kwiatkowski, J.F., Ed.; Nova Science Publishers: New York, NY, USA, 2012; pp. 297–318. ISBN 9781612096841. [Google Scholar]
  7. Matos, I.; Bernardo, M.; Fonseca, I. Porous Carbon: A Versatile Material for Catalysis. Catal. Today 2017, 285, 194–203. [Google Scholar] [CrossRef]
  8. Bahuguna, A.; Kumar, A.; Krishnan, V. Carbon-Support-Based Heterogeneous Nanocatalysts: Synthesis and Applications in Organic Reactions. Asian J. Org. Chem. 2019, 8, 1263–1305. [Google Scholar] [CrossRef]
  9. Iwanow, M.; Gärtner, T.; Sieber, V.; König, B. Activated Carbon as Catalyst Support: Precursors, Preparation, Modification and Characterization. Beilstein J. Org. Chem. 2020, 16, 1188–1202. [Google Scholar] [CrossRef]
  10. Sharma, G.; Sharma, S.; Kumar, A.; Lai, C.W.; Naushad, M.; Shehnaz; Iqbal, J.; Stadler, F.J. Activated Carbon as Superadsorbent and Sustainable Material for Diverse Applications. Adsorpt. Sci. Technol. 2022, 2022, 4184809. [Google Scholar] [CrossRef]
  11. Auer, E.; Freund, A.; Pietsch, J.; Tacke, T. Carbons as Supports for Industrial Precious Metal Catalysts. Appl. Catal. A Gen. 1998, 173, 259–271. [Google Scholar] [CrossRef]
  12. Yang, Y.; Chiang, K.; Burke, N. Porous Carbon-Supported Catalysts for Energy and Environmental Applications: A Short Review. Catal. Today 2011, 178, 197–205. [Google Scholar] [CrossRef]
  13. Rodríguez-Reinoso, F. The Role of Carbon Materials in Heterogeneous Catalysis. Carbon 1998, 36, 159–175. [Google Scholar] [CrossRef]
  14. Perego, C.; Villa, P. Catalyst Preparation Methods. Catal. Today 1997, 34, 281–305. [Google Scholar] [CrossRef]
  15. Barroso-Bogeat, A.; Alexandre-Franco, M.; Fernández-González, C.; Gómez-Serrano, V. Preparation of Activated Carbon-Metal Oxide Hybrid Catalysts: Textural Characterization. Fuel Process. Technol. 2014, 126, 95–103. [Google Scholar] [CrossRef]
  16. Barroso-Bogeat, A.; Alexandre-Franco, M.; Fernández-González, C.; Gómez-Serrano, V. Preparation and Microstructural Characterization of Activated Carbon-Metal Oxide Hybrid Catalysts: New Insights into Reaction Paths. J. Mater. Sci. Technol. 2015, 31, 806–814. [Google Scholar] [CrossRef]
  17. Barroso-Bogeat, A.; Alexandre-Franco, M.; Fernández-González, C.; Gómez-Serrano, V. FT-IR Analysis of Pyrone and Chromene Structures in Activated Carbon. Energy Fuels 2014, 28, 4096–4103. [Google Scholar] [CrossRef]
  18. Newcombe, G.; Hayes, R.; Drikas, M. Granular Activated Carbon: Importance of Surface Properties in the Adsorption of Naturally Occurring Organics. Colloids Surf. A Physicochem. Eng. Asp. 1993, 78, 65–71. [Google Scholar] [CrossRef]
  19. Lopez-Ramon, M.V.; Stoeckli, F.; Moreno-Castilla, C.; Carrasco-Marin, F. On the Characterization of Acidic and Basic Surface Sites on Carbons by Various Techniques. Carbon 1999, 37, 1215–1221. [Google Scholar] [CrossRef]
  20. Barroso-Bogeat, A.; Alexandre-Franco, M.; Fernández-González, C.; Gómez-Serrano, V. Preparation of Activated Carbon-Metal (Hydr)Oxide Photocatalysts under Different Heating Conditions. Chemical Aspects. Bol. Grupo Esp. Carbón 2016, 42, 22–26. [Google Scholar]
  21. Barroso-Bogeat, A.; Alexandre-Franco, M.; Fernández-González, C.; Gómez-Serrano, V. Activated Carbon Surface Chemistry: Changes upon Impregnation with Al(III), Fe(III) and Zn(II)-Metal Oxide Catalyst Precursors from NO3 Aqueous Solutions. Arab. J. Chem. 2019, 12, 3963–3976. [Google Scholar] [CrossRef]
  22. Gurrath, M.; Kuretzky, T.; Boehm, H.P.; Okhlopkova, L.B.; Lisitsyn, A.S.; Likholobov, V.A. Palladium Catalysts on Activated Carbon Supports. Influence of Reduction Temperature, Origin of the Support and Pretreatments of the Carbon Surface. Carbon 2000, 38, 1241–1255. [Google Scholar] [CrossRef]
  23. Baes, C.F.; Mesmer, R.S. The Hydrolysis of Cations; John Wiley & Sons: New York, NY, USA, 1976. [Google Scholar]
  24. Brown, P.L.; Ekberg, C. Hydrolysis of Metal Ions; Wiley: Hoboken, NJ, USA, 2016; ISBN 9783527330102. [Google Scholar]
  25. Barroso-Bogeat, A.; Alexandre-Franco, M.; Fernández-González, C.; Gómez-Serrano, V. Preparation of Activated Carbon-Metal (Hydr)Oxide Materials by Thermal Methods. Thermogravimetric-Mass Spectrometric (TG-MS) Analysis. J. Anal. Appl. Pyrolysis 2015, 116, 243–252. [Google Scholar] [CrossRef]
  26. Barroso-Bogeat, A.; Alexandre-Franco, M.; Fernández-González, C.; Macías-García, A.; Gómez-Serrano, V. Preparation of Activated Carbon-SnO2, TiO2, and WO3 Catalysts. Study by FT-IR Spectroscopy. Ind. Eng. Chem. Res. 2016, 55, 5200–5206. [Google Scholar] [CrossRef]
  27. Nakanishi, K.; Solomon, P.H. Infrared Absorption Spectroscopy, 2nd ed.; Solomon, P.H., Ed.; Holden-Day: San Francisco, CA, USA, 1977. [Google Scholar]
  28. Coates, J. Interpretation of Infrared Spectra, A Practical Approach. In Encyclopedia of Analytical Chemistry; Meyers, R.A., Ed.; John Wiley & Sons: Chichester, UK, 2000; pp. 10815–10837. [Google Scholar]
  29. González-Domínguez, J.M.; Fernández-González, C.; Alexandre-Franco, M.; Gómez-Serrano, V. Surface Chemistry of Cherry Stone-Derived Activated Carbon Prepared by H3PO4 Activation. Processes 2024, 12, 149. [Google Scholar] [CrossRef]
  30. Pretsch, E.; Bühlmann, P.; Badertscher, M. Structure Determination of Organic Compounds. Tables of Spectral Data; Springer: Berlin/Heidelberg, Germany, 2009. [Google Scholar]
  31. Buckó, Á.; Kutus, B.; Peintler, G.; Kele, Z.; Pálinkó, I.; Sipos, P. Stability and Structural Aspects of Complexes Forming Between Aluminum(III) and D-Heptagluconate in Acidic to Strongly Alkaline Media: An Unexpected Diversity. J. Mol. Liq. 2020, 314, 113645. [Google Scholar] [CrossRef]
  32. Gam, S.; Maghrebi, K.; Alkhaldi, S.; Khemiri, N.; Abderrabba, M.; Messaoudi, S. Exploration of the Mechanism of the Condensation Reaction of Al(OH)4 with a D-Gluconate Using Density Functional Theory. Struct. Chem. 2023, 34, 1759–1773. [Google Scholar] [CrossRef]
  33. Martin, D.S.; Cole, R.J.; Haq, S. Creating a Functionalized Surface: The Adsorption of Terephthalic Acid onto Cu(110). Phys. Rev. B Condens. Matter Mater. Phys. 2002, 66, 155427. [Google Scholar] [CrossRef]
  34. Martin, D.S.; Cole, R.J.; Haq, S. Investigating the Adsorption of Oxalic Acid onto Cu(110) to Create a Chemically Functionalised Surface. Surf. Sci. 2003, 539, 171–181. [Google Scholar] [CrossRef]
  35. van den Brand, J.; Blajiev, O.; Beentjes, P.C.J.; Terryn, H.; de Wit, J.H.W. Interaction of Anhydride and Carboxylic Acid Compounds with Aluminum Oxide Surfaces Studied Using Infrared Reflection Absorption Spectroscopy. Langmuir 2004, 20, 6308–6317. [Google Scholar] [CrossRef] [PubMed]
  36. Curtis, N.F.; Curtis, Y.M. Some Nitrato-Amine Nickel(II) Compounds with Monodentate and Bidentate Nitrate Ions. Inorg. Chem. 1965, 4, 804–809. [Google Scholar] [CrossRef]
  37. Grube, M.; Lin, J.G.; Lee, P.H.; Kokorevicha, S. Evaluation of Sewage Sludge-Based Compost by FT-IR Spectroscopy. Geoderma 2006, 130, 324–333. [Google Scholar] [CrossRef]
  38. Mihaylov, M.Y.; Zdravkova, V.R.; Ivanova, E.Z.; Aleksandrov, H.A.; St. Petkov, P.; Vayssilov, G.N.; Hadjiivanov, K.I. Infrared Spectra of Surface Nitrates: Revision of the Current Opinions Based on the Case Study of Ceria. J. Catal. 2021, 394, 245–258. [Google Scholar] [CrossRef]
  39. Kiss, A.B.; Keresztury, G.; Farkas, L. Raman and i.r. Spectra and Structure of Boehmite (y-AlOOH). Evidence for the Recently Discarded D172h Space Group. Spectrochim. Acta 1980, 36, 653–658. [Google Scholar] [CrossRef]
  40. Music, S.; Dragcevic, O.; Popovic, S. Hydrothermal Crystallization of Boehmite from Freshly Precipitated Aluminium Hydroxide. Mater. Lett. 1999, 40, 269–274. [Google Scholar] [CrossRef]
  41. Ram, S. Infrared Spectral Study of Molecular Vibrations in Amorphous, Nanocrystalline and AlO(OH)·aH2O Bulk Crystals. Infrared Phys. Technol. 2001, 42, 547–560. [Google Scholar] [CrossRef]
  42. Ruan, H.D.; Frost, R.L.; Kloprogge, J.T.; Duong, L. Far-Infrared Spectroscopy of Alumina Phases. Spectrochim. Acta A Mol. Biomol. Spectrosc. 2002, 58, 265–272. [Google Scholar] [CrossRef]
  43. Dickie, S.A.; McQuillan, A.J. In-Situ Infrared Spectroscopic Studies of Adsorption Processes on Boehmite Particle Films: Exchange of Surface Hydroxyl Groups Observed upon Chelation by Acetylacetone. Langmuir 2004, 20, 11630–11636. [Google Scholar] [CrossRef]
  44. Feng, Y.; Lu, W.; Zhang, L.; Bao, X.; Yue, B.; Iv, Y.; Shang, X. One-Step Synthesis of Hierarchical Cantaloupe-like AlOOH Superstructures via a Hydrothermal Route. Cryst. Growth Des. 2008, 8, 1426–1429. [Google Scholar] [CrossRef]
  45. Boumaza, A.; Favaro, L.; Lédion, J.; Sattonnay, G.; Brubach, J.B.; Berthet, P.; Huntz, A.M.; Roy, P.; Tétot, R. Transition Alumina Phases Induced by Heat Treatment of Boehmite: An X-Ray Diffraction and Infrared Spectroscopy Study. J. Solid. State Chem. 2009, 182, 1171–1176. [Google Scholar] [CrossRef]
  46. Rahimi-Tabar, F.; Hosseini-Monfared, H. Low Temperature Synthesis of Nanosized Boehmite Powder from Sodium Aluminate by Template-Free Hydrothermal Method. Next Mater. 2025, 7, 100456. [Google Scholar] [CrossRef]
  47. Davydov, A.A. Infrared Spectroscopy of Adsorbed Species on the Surface of Transition Metal Oxides; John Wiley & Sons: Chichester, UK, 1990. [Google Scholar]
  48. Mukha, S.A.; Antipova, I.A.; Medvedeva, S.A.; Saraev, V.V.; Larina, L.I.; Tsyrenzhapov, A.V.; Sukhov, B.G. Synthesis and Properties of Metal Chelates Based on Natural γ-Pyrone Maltol. Chem. Sustain. Dev. 2007, 15, 448–458. [Google Scholar]
  49. Shevchenko, L.L. Infrared Spectra of Salts and Complexes of Carboxylic Acids and Some of Their Derivatives. Russ. Chem. Rev. 1963, 32, 201–207. [Google Scholar] [CrossRef]
  50. Obydennov, D.L.; Röschenthaler, G.-V.; Sosnovskikh, V.Y. An Improved Synthesis and Some Reactions of Diethyl 4-Oxo-4H-Pyran-2,5-Dicarboxylate. Tetrahedron Lett. 2013, 54, 6545–6548. [Google Scholar] [CrossRef]
  51. Bankauskaite, A.; Baltakys, K. The Hydrothermal Synthesis of Hydrotalcite by Using Different Partially Soluble and Insoluble in Water Mangesium and Aluminium Components. Sci. Sinter. 2011, 43, 261–275. [Google Scholar] [CrossRef]
  52. Nimkar, A.; Ramana, M.M.V.; Betkar, R.; Ranade, P.; Mundhe, B. CsOH/γ-Al2O3: A Heterogeneous Reusable Basic Catalyst for One-Pot Synthesis of 2-Amino-4,6-Diaryl Pyrimidines. New J. Chem. 2016, 40, 2541–2546. [Google Scholar] [CrossRef]
  53. Jafar Tafreshi, M.; Masoomi Khanghah, Z. Infrared Spectroscopy Studies on Sol-Gel Prepared Alumina Powders. Medziagotyra 2015, 21, 28–31. [Google Scholar] [CrossRef]
  54. Lide, D.R. (Ed.) CRC Handbook of Chemistry and Physics; CRC Press: Boca Raton, FL, USA, 2005. [Google Scholar]
  55. Palacios, E.G.; Juárez-López, G.; Monhemius, A.J. Infrared Spectroscopy of Metal Carboxylates: II. Analysis of Fe(III), Ni and Zn Carboxylate Solutions. Hydrometallurgy 2004, 72, 139–148. [Google Scholar] [CrossRef]
  56. Otero, V.; Sanches, D.; Montagner, C.; Vilarigues, M.; Carlyle, L.; Lopes, J.A.; Melo, M.J. Characterisation of Metal Carboxylates by Raman and Infrared Spectroscopy in Works of Art. J. Raman Spectrosc. 2014, 45, 1197–1206. [Google Scholar] [CrossRef]
  57. Justi, M.; de Freitas, M.P.; Silla, J.M.; Nunes, C.A.; Silva, C.A. Molecular Structure Features and Fast Identification of Chemical Properties of Metal Carboxylate Complexes by FTIR and Partial Least Square Regression. J. Mol. Struct. 2021, 1237, 130405. [Google Scholar] [CrossRef]
  58. Sousa, E.T.; da Silva, M.M.; de Andrade, S.J.; Cardoso, M.P.; Silva, L.A.; de Andrade, J.B. Evaluation of Thermal Stability of Quinones by Thermal Analysis Techniques. Thermochim. Acta 2012, 529, 1–5. [Google Scholar] [CrossRef]
  59. Barroso-Bogeat, A.; Alexandre-Franco, M.; Fernández-González, C.; Gómez-Serrano, V. Surface Morphological Characterization of Activated Carbon-Metal (Hydr)Oxide Composites: Some Insights into the Role of the Precursor Chemistry in Aqueous Solution. J. Dispers. Sci. Technol. 2020, 41, 1743–1753. [Google Scholar] [CrossRef]
  60. Gadgil, M.M.; Sasikala, R.; Kulshreshtha, S.K. CO Oxidation over Pd/SnO2 Catalyst. J. Mol. Catal. 1994, 87, 297–310. [Google Scholar] [CrossRef]
  61. Wang, X.; Xie, Y.-C. Total Oxidation of CH4 on Sn-Cr Composite Oxide Catalysts. Appl. Catal. B 2001, 35, 85–94. [Google Scholar] [CrossRef]
  62. Iyuke, S.E.; Ahmadun, F.-R. Adsorption and Solid Catalysed Reaction between Activated Carbon Impregnated with SnO2 and CO at Ordinary Temperature. Appl. Surf. Sci. 2002, 187, 37–44. [Google Scholar] [CrossRef]
  63. Ragupathy, S.; Sathya, T. Synthesis and Characterization of SnO2 Loaded on Groundnut Shell Activated Carbon and Photocatalytic Activity on MB Dye under Sunlight Radiation. J. Mater. Sci. Mater. Electron. 2016, 27, 5770–5778. [Google Scholar] [CrossRef]
  64. Can, F.; Courtois, X.; Duprez, D. Tungsten-based Catalysts for Environmental Applications. Catalysts 2021, 11, 703. [Google Scholar] [CrossRef]
  65. Deepa, M.; Sharma, N.; Varshney, P.; Varma, S.P.; Agnihotry, S.A. FTIR Investigations of Solid Precursor Materials for Sol-Gel Deposition of WO3 Based Electrochromic Films. J. Mater. Sci. 2000, 35, 5313–5318. [Google Scholar] [CrossRef]
  66. Sharma, N.; Deepa, M.; Varshney, P.; Agnihotry, S.A. FTIR Investigations of Tungsten Oxide Electrochromic Films Derived from Organically Modified Peroxotungstic Acid Precursors. Thin Solid Films 2001, 401, 45–51. [Google Scholar] [CrossRef]
  67. Hoffmann, P.; Galindo, H.; Zambrano, G.; Rincón, C.; Prieto, P. FTIR Studies of Tungsten Carbide in Bulk Material and Thin Film Samples. Mater. Charact. 2003, 50, 255–259. [Google Scholar] [CrossRef]
  68. Abbas, R.K.; Musa, K.M. Using Raman Shift and FT-IR Spectra as Quality Indices of Oil Bit PDC Cutters. Petroleum 2019, 5, 329–334. [Google Scholar] [CrossRef]
  69. Daniel, M.F.; Desbat, B.; Lassegues, J.C.; Gerand, B.; Figlarz, M. Infrared and Raman Study of WO3 Tungsten Trioxides and WO3 XH2O Tungsten Trioxide Hydrates. J. Solid. State Chem. 1987, 67, 235–247. [Google Scholar] [CrossRef]
  70. Menéndez, J.Á.; Phillips, J.; Xia, B.; Radovic, L.R. On the Modification and Characterization of Chemical Surface Properties of Activated Carbon: In the Search of Carbons with Stable Basic Properties. Langmuir 1996, 12, 4404–4410. [Google Scholar] [CrossRef]
  71. Fuente, E.; Menéndez, J.A.; Díez, M.A.; Suárez, D.; Montes-Morán, M.A. Infrared Spectroscopy of Carbon Materials: A Quantum Chemical Study of Model Compounds. J. Phys. Chem. B 2003, 107, 6350–6359. [Google Scholar] [CrossRef]
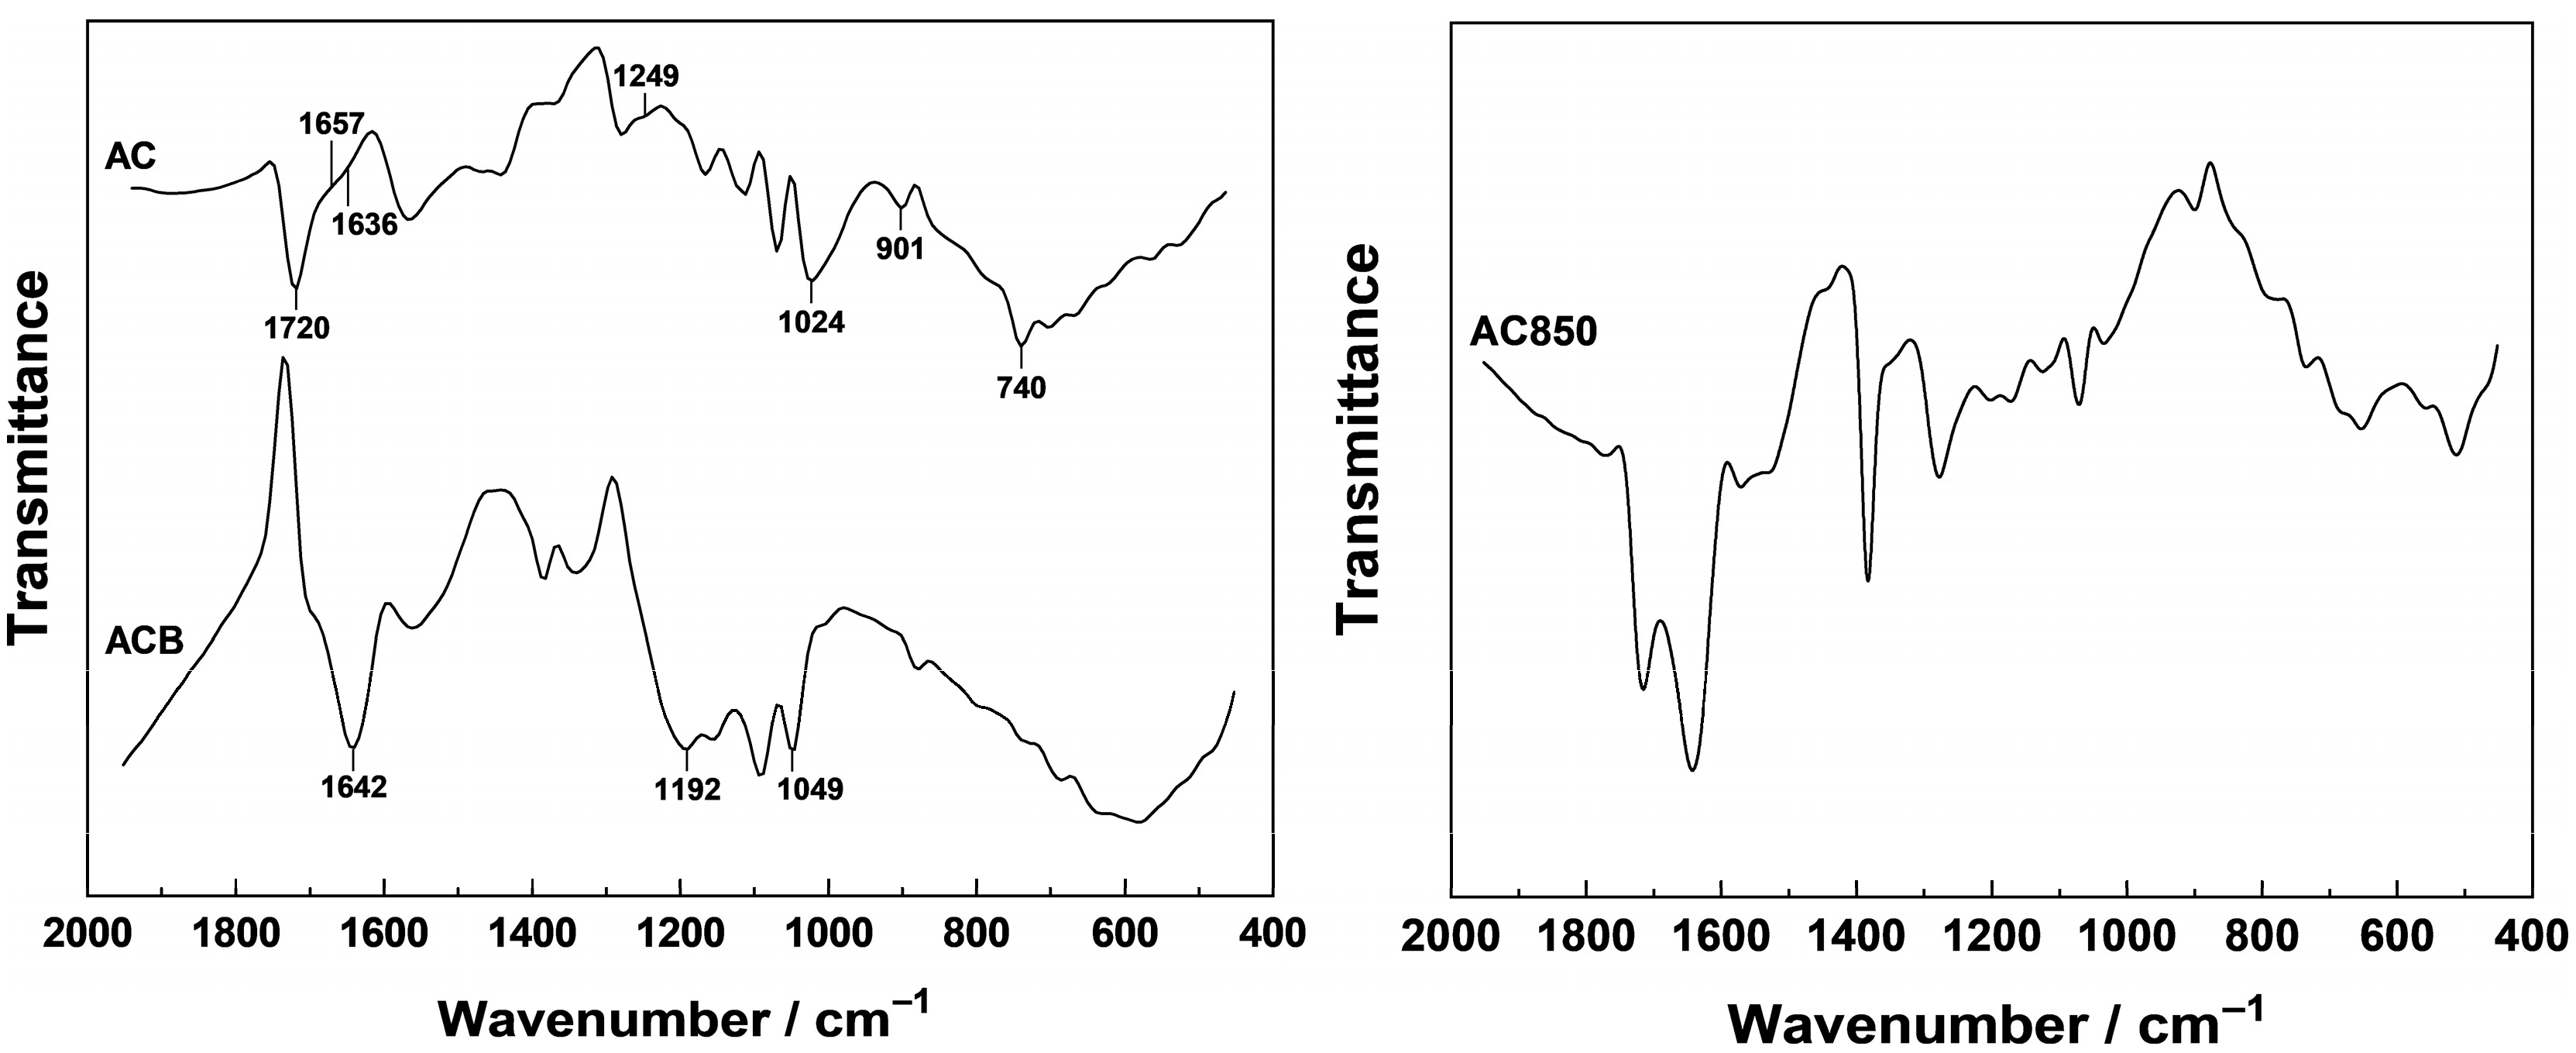
Figure 1. FT-IR spectra for the raw AC support and “blank” samples ACB and AC850.
Compounds 05 00036 g001
Figure 2. FT-IR spectra (left) and XRD patterns (right) for samples AT.
Compounds 05 00036 g002
Figure 3. FT-IR spectra (left) and XRD patterns (right) for samples FT.
Compounds 05 00036 g003
Figure 4. FT-IR spectra (left) and XRD patterns (right) for samples ZT.
Compounds 05 00036 g004
Figure 5. FT-IR spectra (left) and XRD patterns (right) for samples ST.
Compounds 05 00036 g005
Figure 6. FT-IR spectra (left) and XRD patterns (right) for samples WT.
Compounds 05 00036 g006
Table 1. Preparation of the MO/AC samples. Yield and notations.
PrecursorPrecursor/AC
Mass Ratio
pHOven-Drying or Heat Treatment Temperature
120 °C200 °C850 °C
Yield/wt.%CodeYield/wt.%CodeYield/wt.%Code
--5.198ACB97AC20095AC850
Al(NO3)3∙9H2O1/12.9102A12093A20090A850
Fe(NO3)3∙9H2O1/11.5114F12094F20081F850
Zn(NO3)2∙6H2O1/15.2103Z12091Z20084Z850
SnCl2∙2H2O1/11.4149S12096S20068S850
Na2WO4∙2H2O1/19.5106W12096W20095W850
Table 2. Elemental analysis and metal content for AC and MO/AC samples.
SeriesSampleC/wt.%H/wt.%N/wt.%S/wt.%Odiff./wt.%M/wt.% 1
-AC86.500.510.260.6412.09-
S1ACB85.631.690.640.4811.56-
A12072.831.160.490.5624.963.94
F12072.480.850.440.5925.6432.95
Z12077.980.860.610.6019.957.25
S12052.321.250.060.3746.0046.48
W12078.320.980.200.6119.895.17
S2AC20084.680.690.250.6613.72-
A20076.441.190.570.5521.255.05
F20071.081.240.460.5526.6718.70
Z20079.621.090.540.5618.197.73
S20054.441.040.040.4244.0652.13
W20077.661.030.280.5820.454.09
S3AC85084.210.760.260.6714.10-
A85079.291.090.410.5118.704.57
F85080.450.540.420.5718.0221.23
Z85082.920.860.330.6315.260.24
S85072.510.570.250.5226.1529.74
W85076.800.940.140.6021.524.54
1 Metal content (i.e., M = Al, Fe, Zn, Sn, or W) as estimated from XRF analyses.
Table 3. pH of the point of zero charge for AC and MO/AC samples.
SamplepHpzcSamplepHpzcSamplepHpzc
AC10.50
A1205.20A2005.45A8509.20
F1204.00F2004.10F8508.80
Z1206.30Z2006.50Z8509.80
S120<1.60S200<1.60S8509.10
W1207.90W2007.35W8509.70
Disclaimer/Publisher’s Note: The statements, opinions and data contained in all publications are solely those of the individual author(s) and contributor(s) and not of MDPI and/or the editor(s). MDPI and/or the editor(s) disclaim responsibility for any injury to people or property resulting from any ideas, methods, instructions or products referred to in the content.