Article

Tuning Optical and Photoelectrochemical Properties of TiO2/WOx Heterostructures by Reactive Sputtering: Thickness-Dependent Insights

by
Lucas Diniz Araujo
1,
Bianca Sartori
1,
Matheus Damião Machado Torres
1,
David Alexandro Graves
1,
Benedito Donizeti Botan-Neto
2,
Mariane Satomi Weber Murase
1,
Nilton Francelosi Azevedo Neto
1,
Douglas Marcel Gonçalves Leite
1,
Rodrigo Sávio Pessoa
1,
Argemiro Soares da Silva Sobrinho
1 and
André Luis Jesus Pereira
1,*
1
Laboratório de Plasmas e Processos—LPP, Instituto Tecnológico de Aeronáutica—ITA, São José dos Campos 12228-900, SP, Brazil
2
MALTA Consolider Team, Departamento de Física Aplicada—ICMUV, Universitat de València, 46100 Valencia, Spain
*
Author to whom correspondence should be addressed.
Nanomanufacturing 2025, 5(4), 15; https://doi.org/10.3390/nanomanufacturing5040015
Submission received: 29 August 2025 / Revised: 26 September 2025 / Accepted: 9 October 2025 / Published: 15 October 2025

Abstract

Metal-oxide heterostructures represent an effective strategy to overcome the limitations of pristine TiO2, including its ultraviolet-only light absorption and rapid electron–hole recombination, which hinder its performance in solar-driven applications. Among various configurations, coupling TiO2 with tungsten oxide (WOx) forms a favorable type-II band alignment that enhances charge separation. However, a comprehensive understanding of how WOx overlayer thickness affects the optical and photoelectrochemical (PEC) behavior of device-grade thin films remains limited. In this study, bilayer TiO2/WOx heterostructures were fabricated via reactive DC magnetron sputtering, with controlled variation in WOx thickness to systematically investigate its influence on the structural, optical, and PEC properties. Adjusting the WOx deposition time enabled precise tuning of light absorption, interfacial charge transfer, and donor density, resulting in markedly distinct PEC responses. The heterostructure obtained with 30 min of WOx deposition demonstrated a significant enhancement in photocurrent density under AM 1.5G illumination, along with reduced charge-transfer resistance and improved capacitive behavior, indicating efficient charge separation and enhanced charge storage at the electrode–electrolyte interface. These findings underscore the potential of sputtered TiO2/WOx bilayers as advanced photoanodes for solar-driven hydrogen generation and light-assisted energy storage applications.

Graphical Abstract

1. Introduction

Heterostructures have emerged as a powerful architecture for modulating charge–separation pathways, ionic transport, and light–matter interactions beyond the capabilities of individual materials. By selecting components with complementary band structures, lattice parameters, and redox properties, researchers have enabled the development of a wide range of technologies, including solar fuel generation, photocatalytic water purification, selective gas sensing, electrochromic smart windows, and high-performance energy storage systems.
Among these, metal-oxide semiconductors are particularly attractive due to their chemical stability, earth abundance, and tunable electronic structure, making them highly suitable building blocks for heterostructure engineering [1,2]. Within this family, titanium dioxide (TiO2) has gained prominence as a reference material because of its low cost, excellent stability, and well-documented surface chemistry [3]. However, its wide band gap (~3.2 eV) restricts light absorption to the ultraviolet range and promotes rapid electron–hole recombination. Coupling TiO2 with visible-light-active materials such as Fe2O3, ZnO, Cu2O, or BiVO4 addresses these limitations. The formation of type-II or Z-scheme band alignments enhances charge separation, broadens the absorption spectrum, and introduces mid-gap states that accelerate surface redox processes [4,5,6]. As a result, TiO2-based heterostructures often exhibit significant improvements in photocatalytic quantum efficiency, photoelectrochemical (PEC) current density, and gas-sensing performance compared to pristine TiO2 [4,5,6].
Within this context, TiO2/WOx systems have received considerable attention. Tungsten oxides, with band gaps in the range of 2.6 to 2.8 eV, establish a prototypical type-II heterojunction with TiO2, where photogenerated electrons are directed into the WOx layer while holes remain in TiO2. This configuration reduces recombination rates and enhances solar light utilization. Additionally, the multivalent nature of tungsten contributes redox-active sites that improve both photocatalytic activity and capacitive performance. Recent studies have shown that TiO2/WOx photoanodes can achieve up to threefold increases in oxygen evolution photocurrents compared to the individual oxides, and that thin WOx overlayers can enhance the degradation of organic pollutants under visible light by an order of magnitude relative to bare TiO2 [7,8,9].
Spectroscopic and electrochemical analyses further support these findings. Photoluminescence and transient absorption spectroscopy reveal that the type-II interface significantly suppresses radiative recombination and extends carrier lifetimes by more than an order of magnitude compared to the constituent oxides [10,11]. Electrochemical impedance spectroscopy corroborates this behavior, with reductions of 30–60% in the interfacial Nyquist semicircle, positive shifts in flat-band potential, and two- to threefold increases in donor density. These changes lead to faster transfer charge and higher PEC performance. Under simulated sunlight, such enhancements manifest as elevated transient and steady-state photocurrents. For instance, anodically converted Ti-W co-sputtered nanotubes demonstrate up to 40% higher photocurrents than their individual counterparts [12,13]. These improvements have been attributed to the built-in electric field at the heterointerface, the redox versatility of W atoms, and increased electronic conductivity across the interface [12,14,15,16].
TiO2/WOx heterostructures have been synthesized using diverse techniques, including sol–gel [7], hydrothermal methods [17], and physical vapor deposition [18], each providing unique control over morphology and composition. Among these, reactive magnetron sputtering stands out for its precision in film thickness and uniformity, which are crucial for optimizing photocatalytic performance [19]. In particular, TiO2-based heterostructures fabricated by sputtering have shown promising results in non-enzymatic electrochemical sensing and solar fuel applications. These improvements are often associated with enhanced hole diffusion and interfacial charge transfer facilitated by the sputtered TiO2 layer [20,21].
WOx films grown by reactive sputtering exhibit strong dependence on deposition parameters such as sputtering power and oxygen partial pressure, which influence their structural and optical properties [22,23]. Recent investigations have explored different growth configurations of TiO2/WOx junctions using reactive or dual target sputtering, leading to bilayer, nanocolumnar, and “sandwich” structures. These configurations exhibit superior photocurrent generation, faster dye degradation rates, and improved electrochromic properties compared to single-layer systems. While early studies typically examined a single WOx thickness, more recent work has focused on tuning oxygen partial pressure or applying post-deposition annealing to optimize phase composition and interfacial crystallinity [15,24,25,26]. However, the specific role of WOx thickness in determining the performance of sputtered TiO2/WOx heterostructures remains insufficiently explored.
Understanding the contribution of the WOx layer to the interfacial properties and overall performance of these bilayers is essential for advancing their application in PEC systems. To address this, we present a comprehensive study in which TiO2/WOx bilayers were fabricated via DC magnetron sputtering, with WOx deposition times systematically varied from 0 to 30 min. Structural, optical, and electrochemical characterizations were performed to elucidate how increasing WOx thickness influences the flat-band potential, donor density, charge-transfer resistance, and pseudocapacitive behavior. The optimized configuration, obtained with a 30 min WOx overlayer, yielded a threefold enhancement in photocurrent density and showed improved capacitive response. The electrodes showed stable photocurrent response during multiple cycles of measurement. By correlating these results with controllable deposition parameters, this work provides a structure–property relationship that supports the rational design and scalable implementation of TiO2/WOx heterostructures for solar-driven hydrogen production and hybrid energy storage devices.

2. Materials and Methods

TiO2/WOx films were deposited by DC magnetron sputtering from metallic tungsten (W, 99.95%) and titanium (Ti, 99.9%) (Kurt J. Lesker, Jefferson Hills, PA, United States) targets housed in the same chamber. Figure 1 presents a schematic drawing of the deposition chamber configuration used in this work. The films were grown on glass, fluorine-doped tin oxide (FTO), and Si(100) substrates, which were cleaned in an ultrasonic bath using a laboratory detergent (Extran, Merck, Rio de Janeiro, Brazil), rinsed with isopropyl alcohol, and then dried with a stream of compressed air. After evacuating the system to a base pressure of approximately 1 × 10⁻⁵ torr, the working atmosphere was established at 3.0 × 10⁻³ torr by introducing pure argon (99.9999%) and oxygen (99.99%) flows, regulated by a MKS Type 247 mass flow controller (MKS Instruments, Andover, MA, USA).
The tungsten oxide (WOx) layer was first sputtered at 150 W (DC) for 0, 5, 10, 20, or 30 min, after which the W plasma was turned off. Subsequently, a titanium oxide (TiO2) overlayer was deposited for 30 min at 300 W (DC) using separate Ar/O2 flows of 10 sccm and 2 sccm, respectively. The resulting bilayers were annealed in air at 450 °C for 2 h with a heating ramp of 10 °C·min−1 to improve crystallinity. Table 1 lists the key deposition parameters, and each sample is hereafter identified by its WOx deposition time.
Several characterization techniques were employed to analyze the deposited TiO2/WOx films. Ellipsometry (Uvisel Plus, Horiba, Longjumeau, France) was used to estimate the film thickness and obtain optical data, with measurements performed at a 70° incidence angle over a photon energy range of 0.6–3 eV. A field-emission scanning electron microscope (FE-SEM, Mira 3 Tescan, Brno, Czechia) provided information on surface morphology and cross-sectional views. Structural analysis of the films was performed using X-ray diffraction (XRD) with a PANalytical Empyrean diffractometer, employing CuKα radiation (λ = 1.54060 Å) in a θ-2θ configuration. The diffractograms were collected in the angular range of 20° to 55°, with a step size of 0.01°. Vibrational characterization of the samples was performed using Raman spectroscopy (Horiba, Evolution, Longjumeau, France), with a spectral resolution better than 1 cm−1. Excitation was achieved using a 532 nm laser operating at a power of 38 mW. Raman spectra were acquired in the spectral range of 100–1000 cm−1.
Electrochemical characterization was carried out using a conventional three-electrode configuration in order to investigate the properties of the TiO2/WOx heterostructures. The synthesized materials deposited onto FTO substrates were used as working electrodes. A platinum rod and a Ag/AgCl reference electrode (3 mol·L−1 KCl) were employed as the counter and reference electrodes, respectively. Measurements were conducted in an aqueous 0.5 mol·L−1 Na2SO4 solution at room temperature.
Cyclic voltammetry (CV), Mott-Schottky (MS) analysis, and electrochemical impedance spectroscopy (EIS) techniques were employed to evaluate the electrochemical properties of the samples. All experiments were performed using a PGSTAT302N Autolab potentiostat/galvanostat (Metrohm Autolab, Utrecht, The Netherlands) equipped with a Frequency Response Analyzer (FRA) module.
CV analyses were conducted under both dark and illuminated conditions (solar simulator, AM 1.5G, 100 mW·cm−2), using a potential window from 0.0 V to +1.0 V vs. Ag/AgCl and a scan rate of 10 mV·s−1. MS curves were recorded in the dark at a fixed frequency of 1 kHz, with a potential range from −0.5 V to +1.5 V, in order to determine the flat-band potential and estimate the majority apparent donor density. EIS spectra were acquired under both dark and illuminated conditions, within a frequency range of 100 kHz to 0.1 Hz, using an AC perturbation of 10 mV (rms), aiming to assess interfacial charge transfer resistance and recombination processes.
Chronoamperometry tests were performed at a fixed potential of 0.61 V vs. Ag/AgCl under AM 1.5G illumination for 1 h and 2 h, enabling stability assessment through the monitoring of photocurrent transients and subsequent EIS analysis before and after polarization.
Capacitive contributions were quantified by determining the double-layer capacitance ( C d l ) from CV curves in the non-faradaic region (±50 mV around OCP), at scan rates of 10, 25, and 50 mV·s−1. The electrochemically active surface area (ECSA) was calculated from Cdl values assuming specific capacitances of 25, 40, and 45 µF·cm−2. The roughness factor (Rf) was estimated by normalizing ECSA to the geometric electrode area.
Furthermore, capacitive versus faradaic contributions were distinguished using Dunn’s method by decomposing the current response according to i V = k 1 v + k 2 v 1 / 2 . This approach allowed separation of pseudocapacitive and diffusion-controlled faradaic processes, as well as estimation of the faradaic fraction (fF) under dark and illuminated conditions.

3. Results and Discussion

3.1. Optical Modeling and Thickness Evolution by Ellipsometry

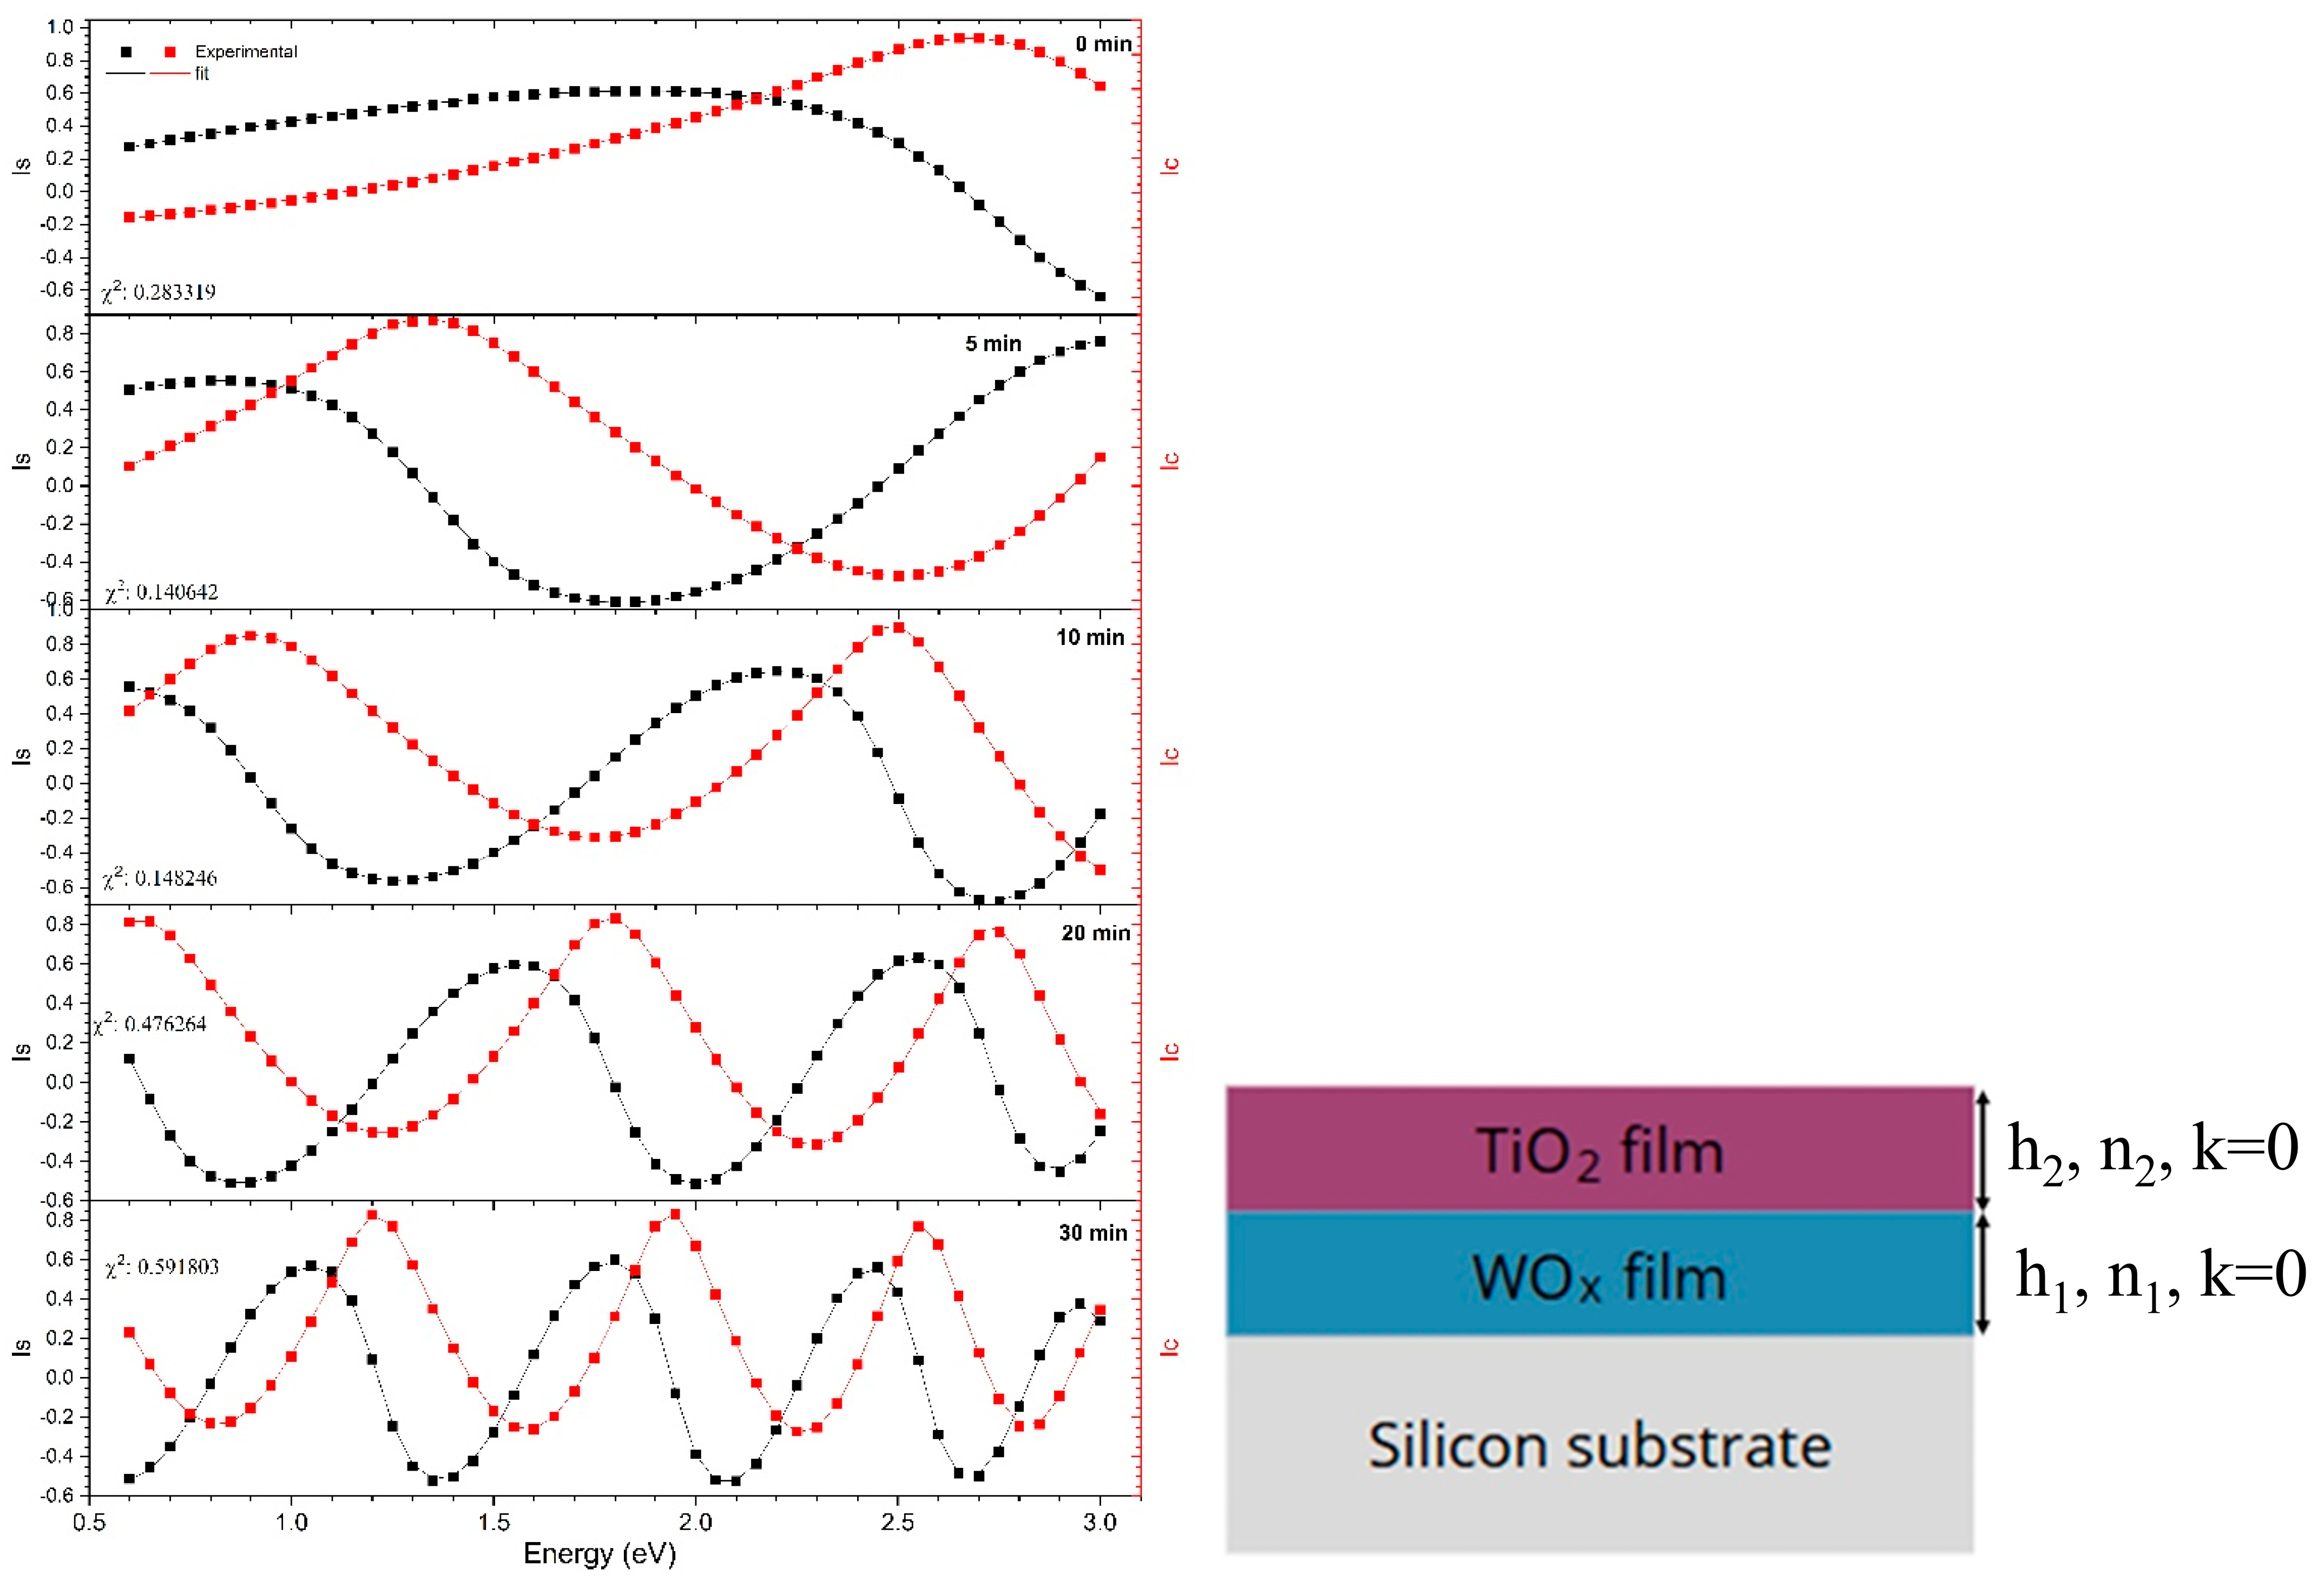
Figure 2 presents the results of the spectroscopic ellipsometry measurements for the TiO2/WOx heterostructures. The plots show the dispersion curves of Is = sin2ΨsinΔ and Ic = sin2ΨcosΔ, where Ψ and Δ are the conventional ellipsometric angles [27]. Data analysis was performed using the DeltaPsi2 software (version 2.6) package (Horiba), applying the layered optical model shown in the inset of Figure 2. For both oxides, the optical response was best reproduced using the Forouhi–Bloomer Amorphous dispersion relation [28,29]. Since the fitting was restricted to the spectral window where the films are non-absorbing, the extinction coefficient k was constrained to zero, and only the real refractive index n and layer thicknesses were refined. The crystalline Si substrate was fixed by importing its complex refractive index from an independent reference scan, so that only the film thicknesses and oscillator parameters were optimized during nonlinear least-squares fitting. This approach consistently yielded low χ2 values across all samples, confirming that the chosen model provides an adequate description of the optical behavior of TiO2 and WOx in their as-deposited state.
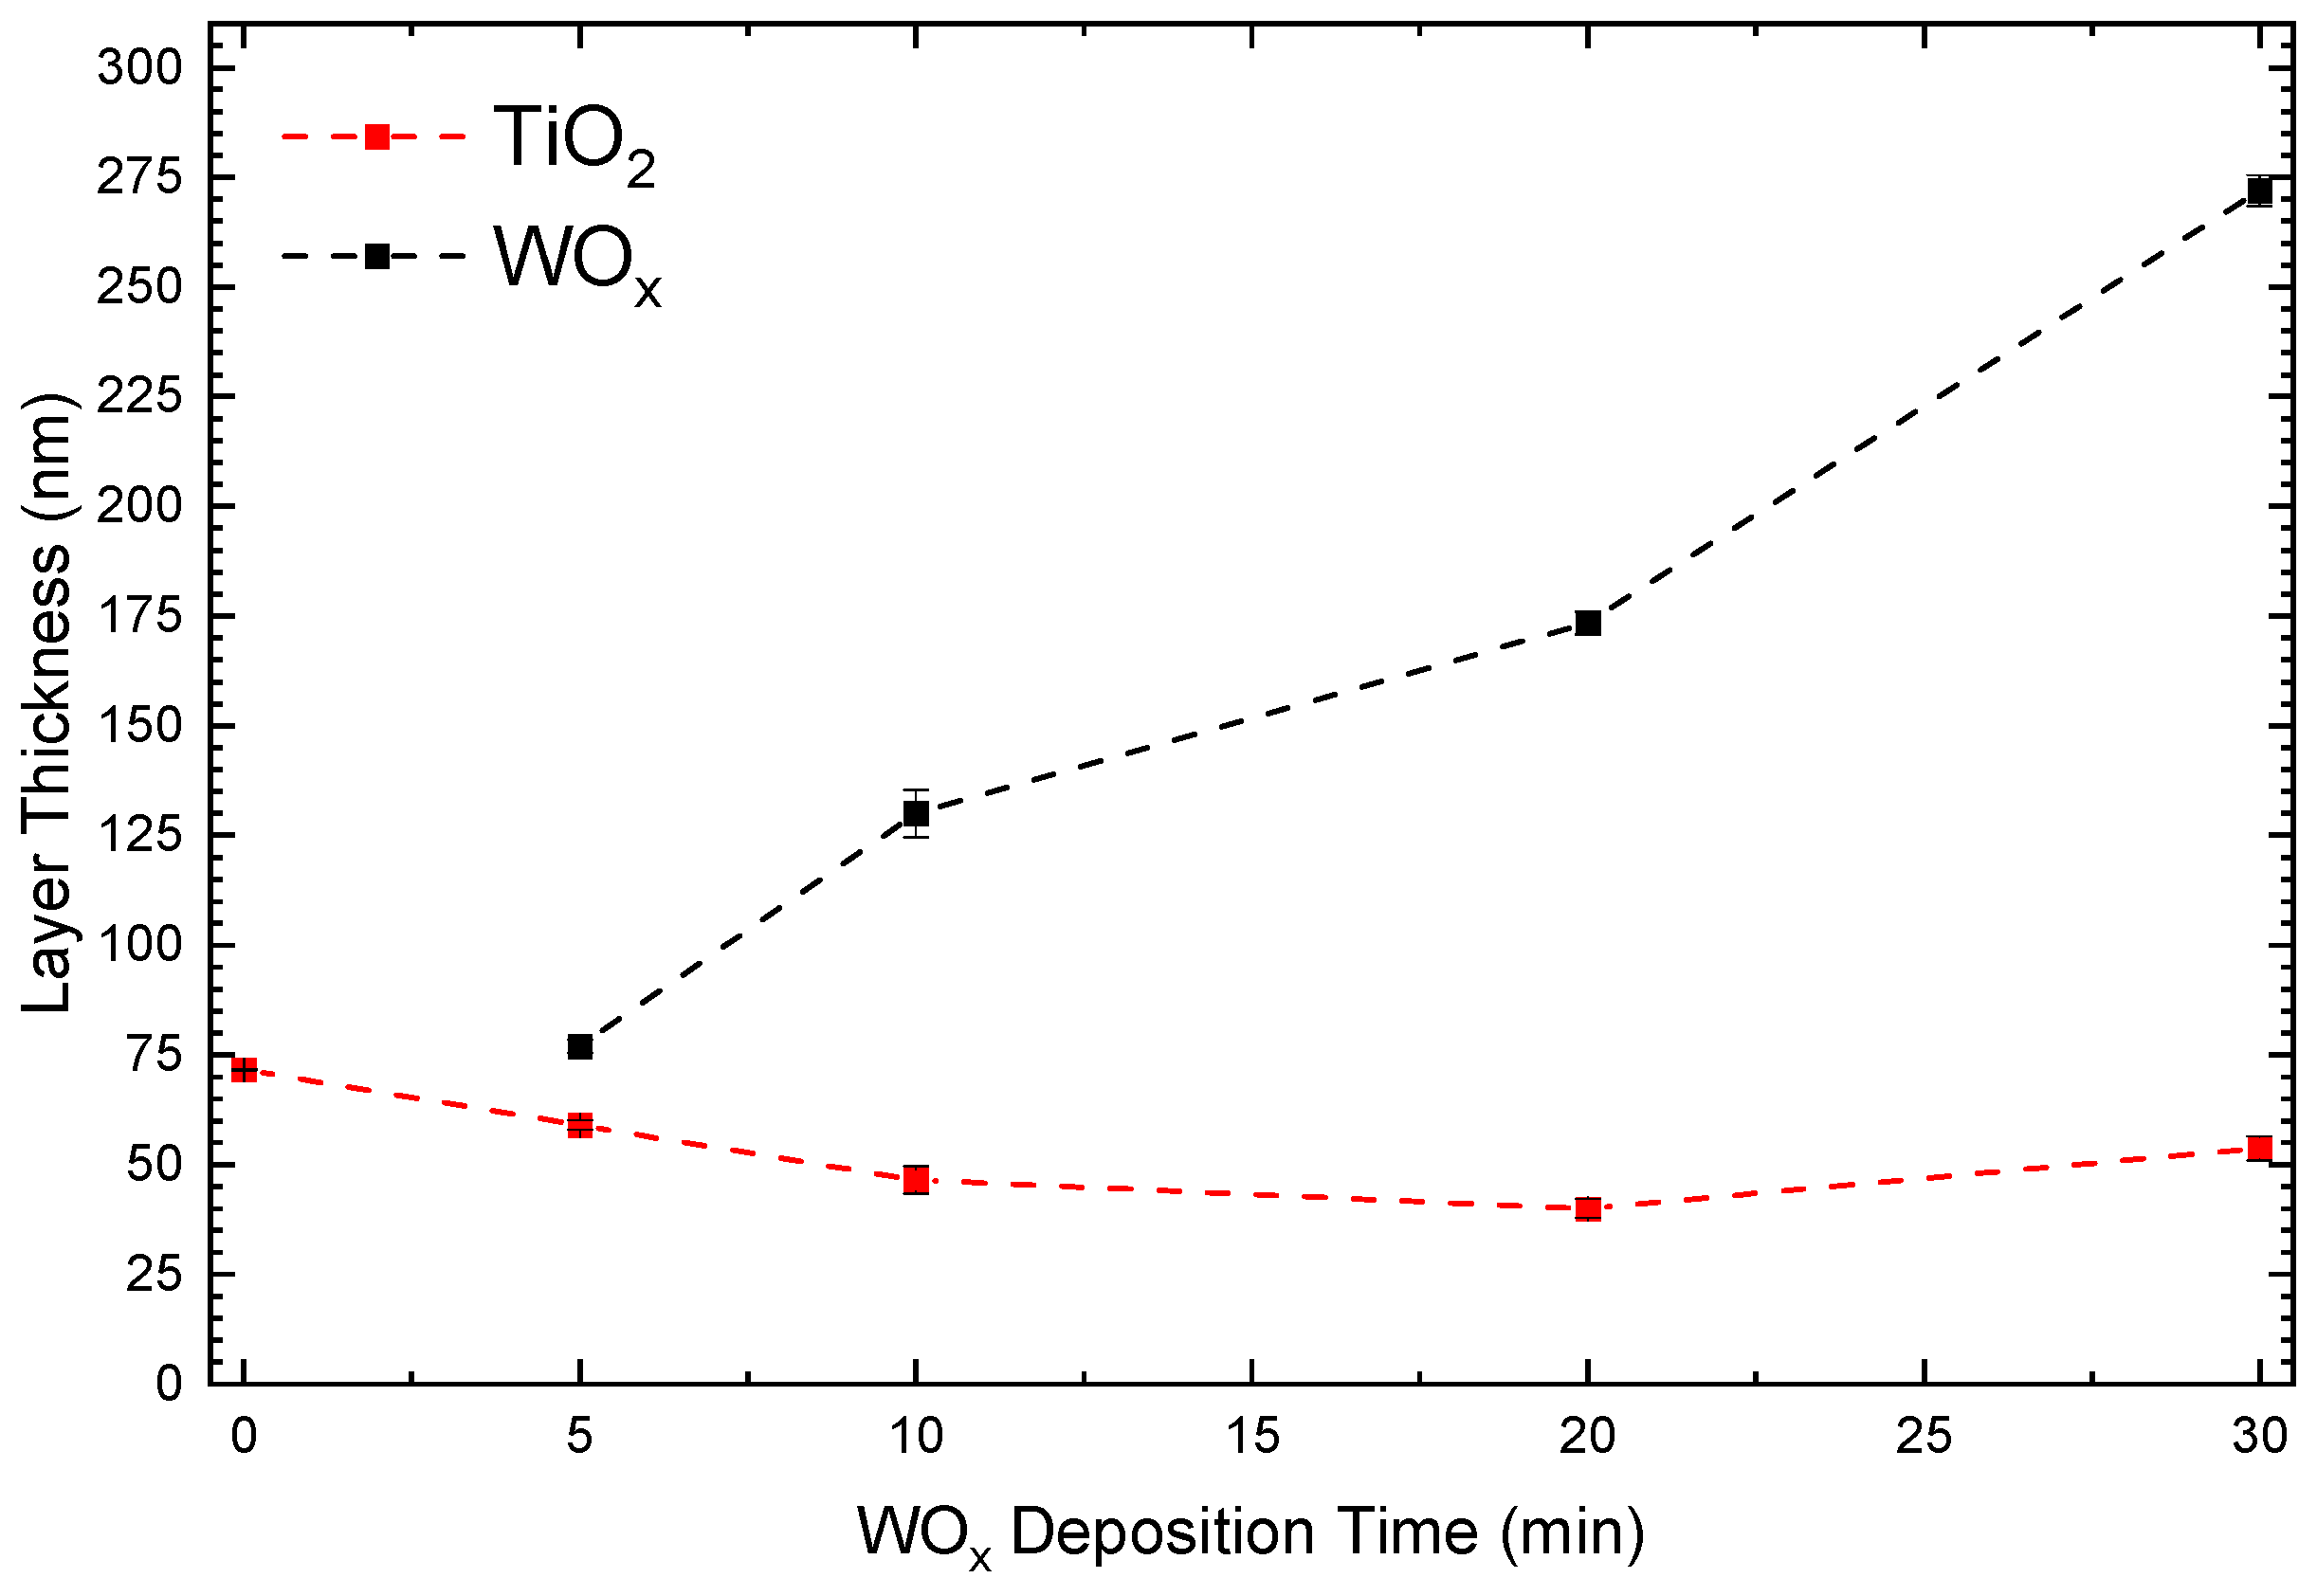
Figure 3 summarizes the film thicknesses obtained from the ellipsometric fits as a function of WOx sputtering time. As expected, the WOx underlayer thickness increases progressively with deposition time, rising from essentially zero in the reference bilayer to 75(2) nm after 5 min, 130(5) nm after 10 min, 170(3) nm after 20 min, and 270(4) nm after 30 min. These results correspond to an average growth rate of ~9 nm·min−1, with a higher initial rate (~15 nm·min−1 up to 10 min) that decreases at longer times—a behavior commonly attributed to target poisoning and the reduced sputtering yield of fully oxidized targets during reactive deposition.
In contrast, the TiO2 overlayer thickness remains effectively constant across the series. Its values fluctuate slightly, decreasing from 70(4) nm in the WOx-free sample to a minimum of 40(4) nm at 20 min of WOx deposition, before recovering to 52(4) nm at 30 min. Because the ellipsometry model that was used did not include an explicit effective-medium roughness layer at the buried TiO2/WOx interface, part of the interfacial topography was effectively absorbed into the fitted TiO2 ‘dense-film’ thickness, leading to a slight underestimation relative to TiO2 grown on smooth Si.

3.2. Refractive Index and Optical Contrast

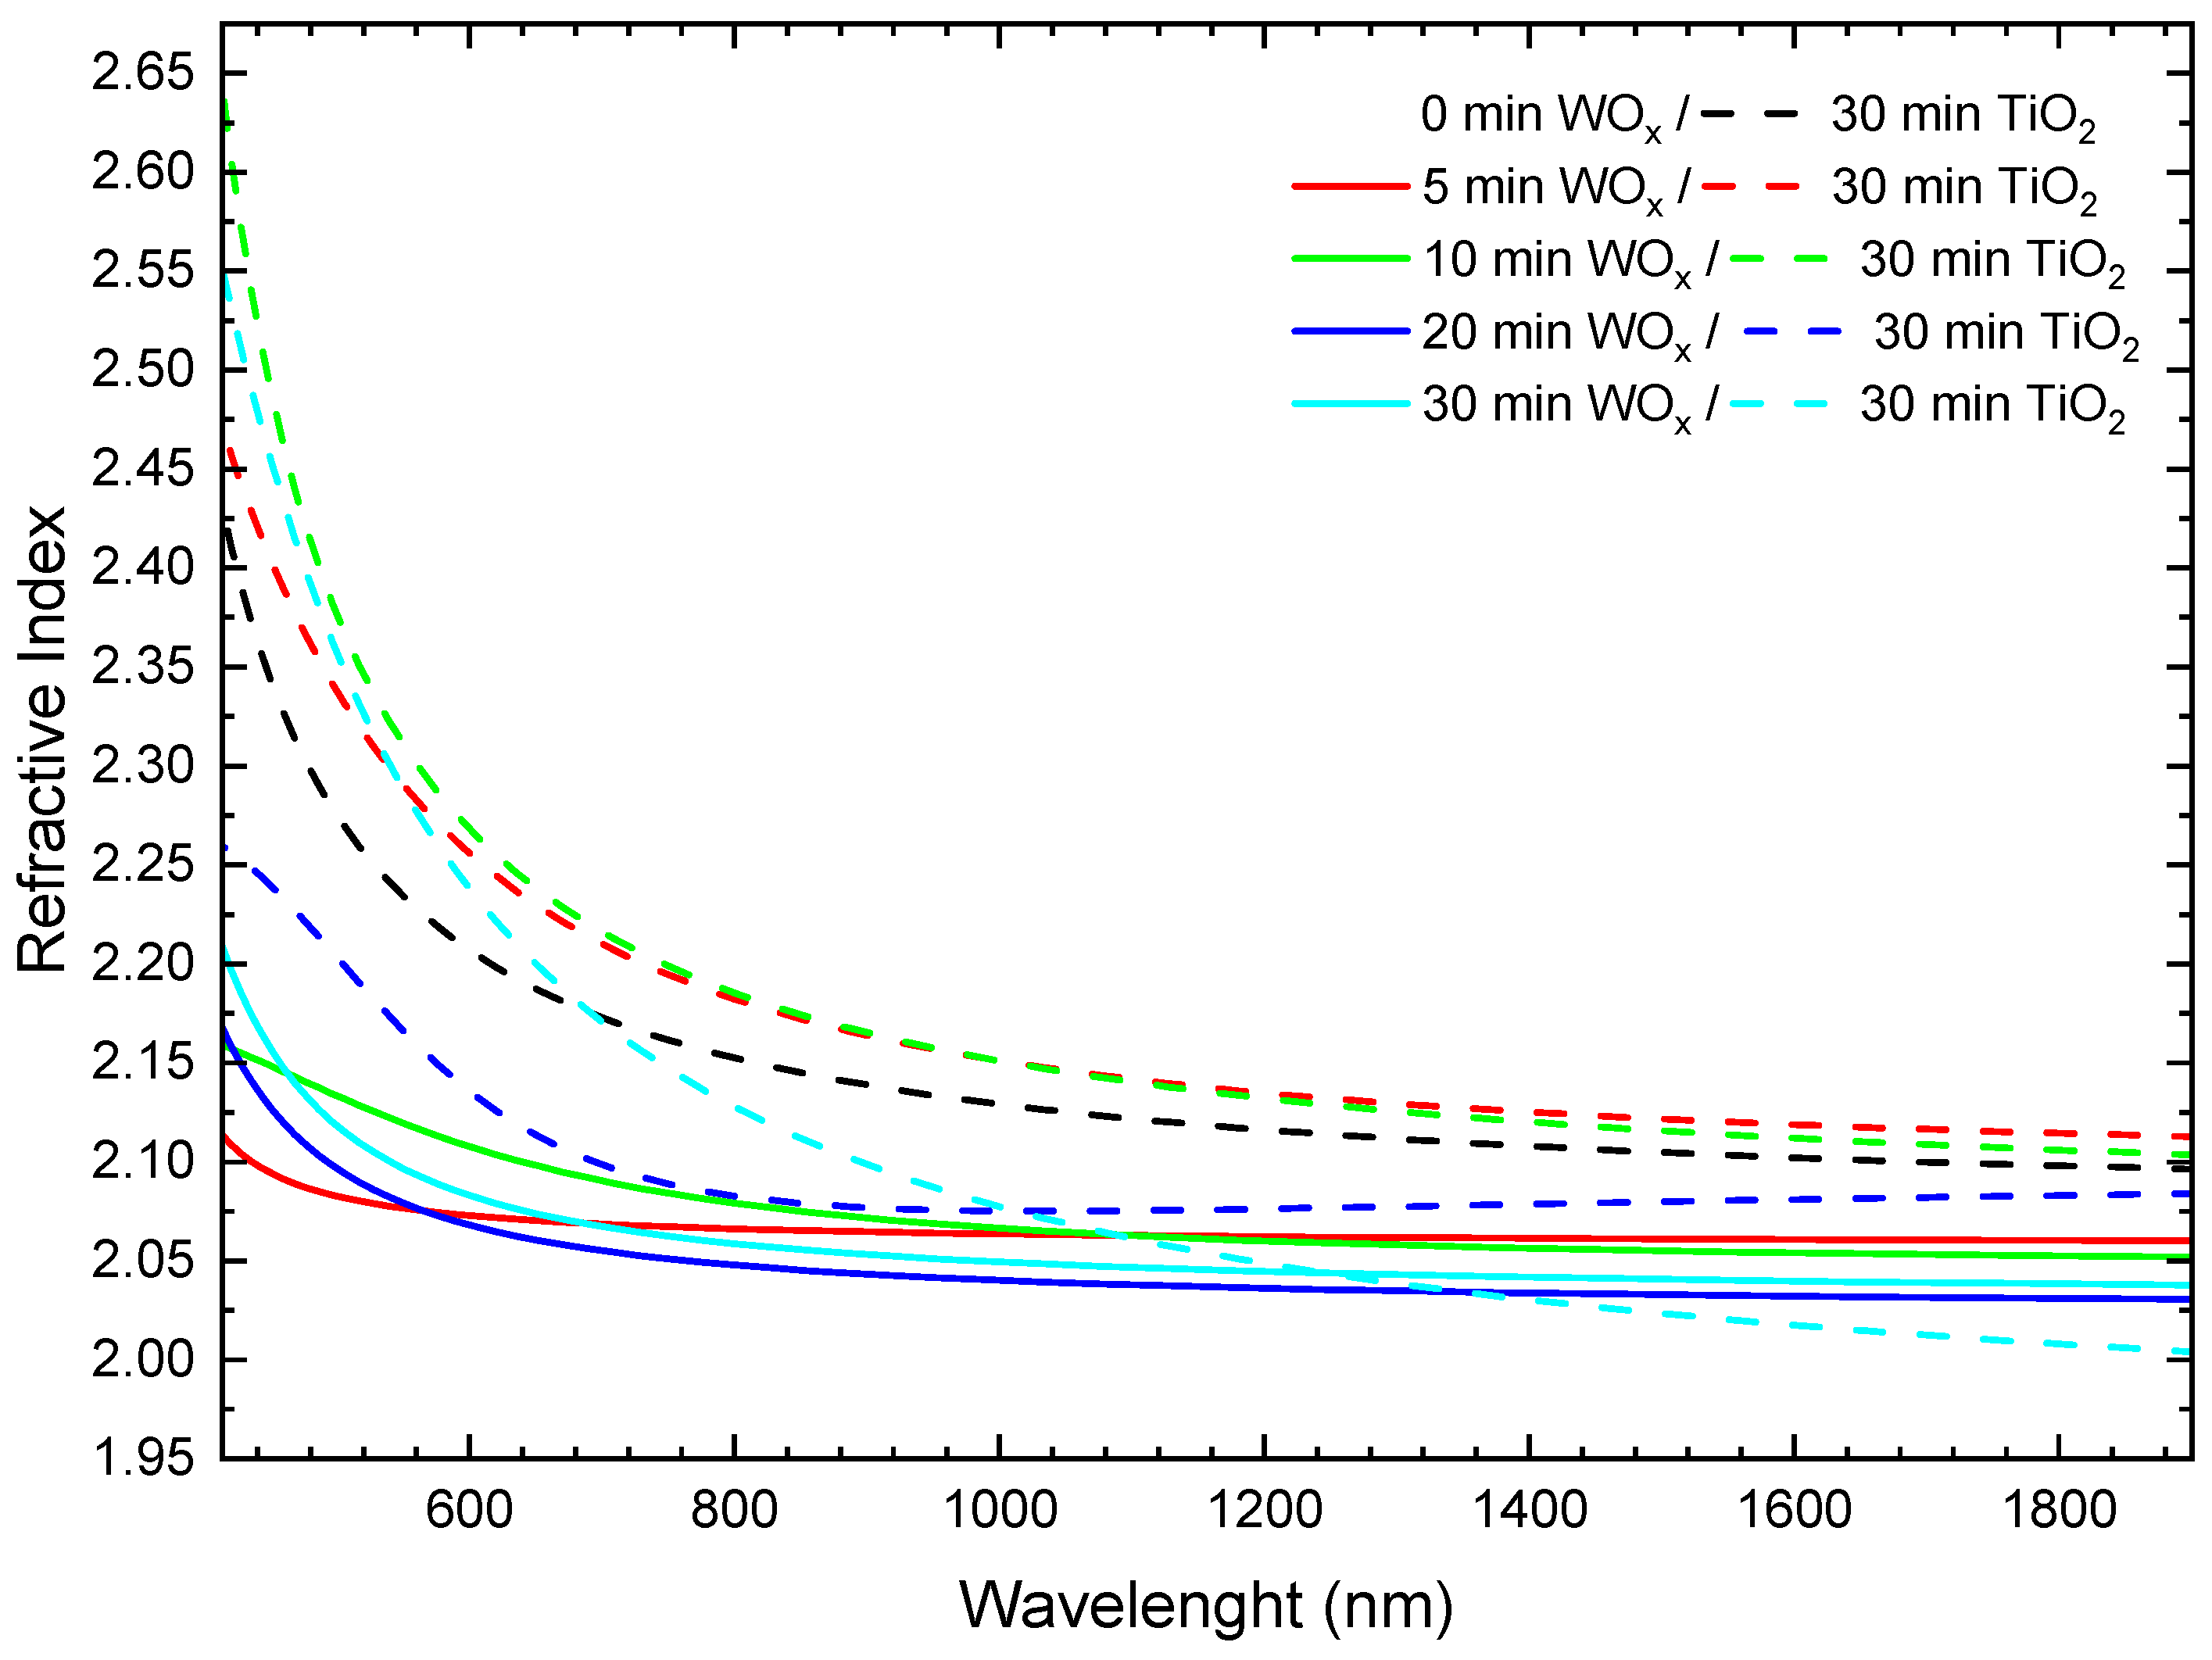
Figure 4 presents the wavelength-dependent refractive index (n) of the TiO2/WOx heterostructures, where solid curves correspond to WOx and dashed curves to the subsequently deposited TiO2. Both oxides display the normal dispersion characteristic of wide–band gap materials: nnn decreases sharply below ~600 nm and gradually approaches a plateau in the near-infrared. At 400 nm, the reference TiO2 film (0 min WOx) exhibits n ≈ 2.65, consistent with literature values for dense amorphous titania deposited by physical vapor processes [30]. The refractive index values of all other TiO2 layers remain within ±0.03 of this benchmark, confirming that the optical density of the titania overlayer is highly reproducible and essentially unaffected by variations in the underlying WOx thickness. The small scatter observed is attributed to the common cross-correlation between thickness and optical constants in multilayer ellipsometric fittings rather than to changes in film porosity or stoichiometry.
The WOx underlayer shows a flatter dispersion, with n at 400 nm decreasing monotonically from ~2.17 after 5 min of deposition to ~2.12 after 30 min, and converging to ~2.07 in the near-infrared. A similar reduction in refractive index with increasing oxygen incorporation has been reported for reactive-sputtered tungsten oxide films, where n at 550 nm decreases from 2.26 to 2.08 as the O2 partial pressure is raised [31]. This trend is consistent with a progressive evolution from an initially sub-stoichiometric, relatively dense phase toward a more oxygen-rich and slightly less dense matrix as the reactive process advances. The concurrent reduction in WOx growth rate at longer sputtering times (see Figure 3) is a well-known manifestation of target poisoning. Once the target surface becomes fully oxidized, the sputtering yield of the compound phase is significantly lower than that of elemental W, resulting in reduced deposition rates even under constant applied power [32].
Overall, the TiO2 cap retains a high and nearly constant refractive index regardless of the WOx thickness, whereas the WOx underlayer exhibits a modest oxygen-driven decrease in n. The optical contrast between the two oxides (Δn ≲ 0.4 across the visible spectrum) produces a smoothly graded refractive index profile that minimizes internal reflections, which is advantageous for photoelectrochemical architectures designed for efficient light harvesting and charge separation.

3.3. Morphology and Layer Integrity from Cross-Sectional FE-SEM

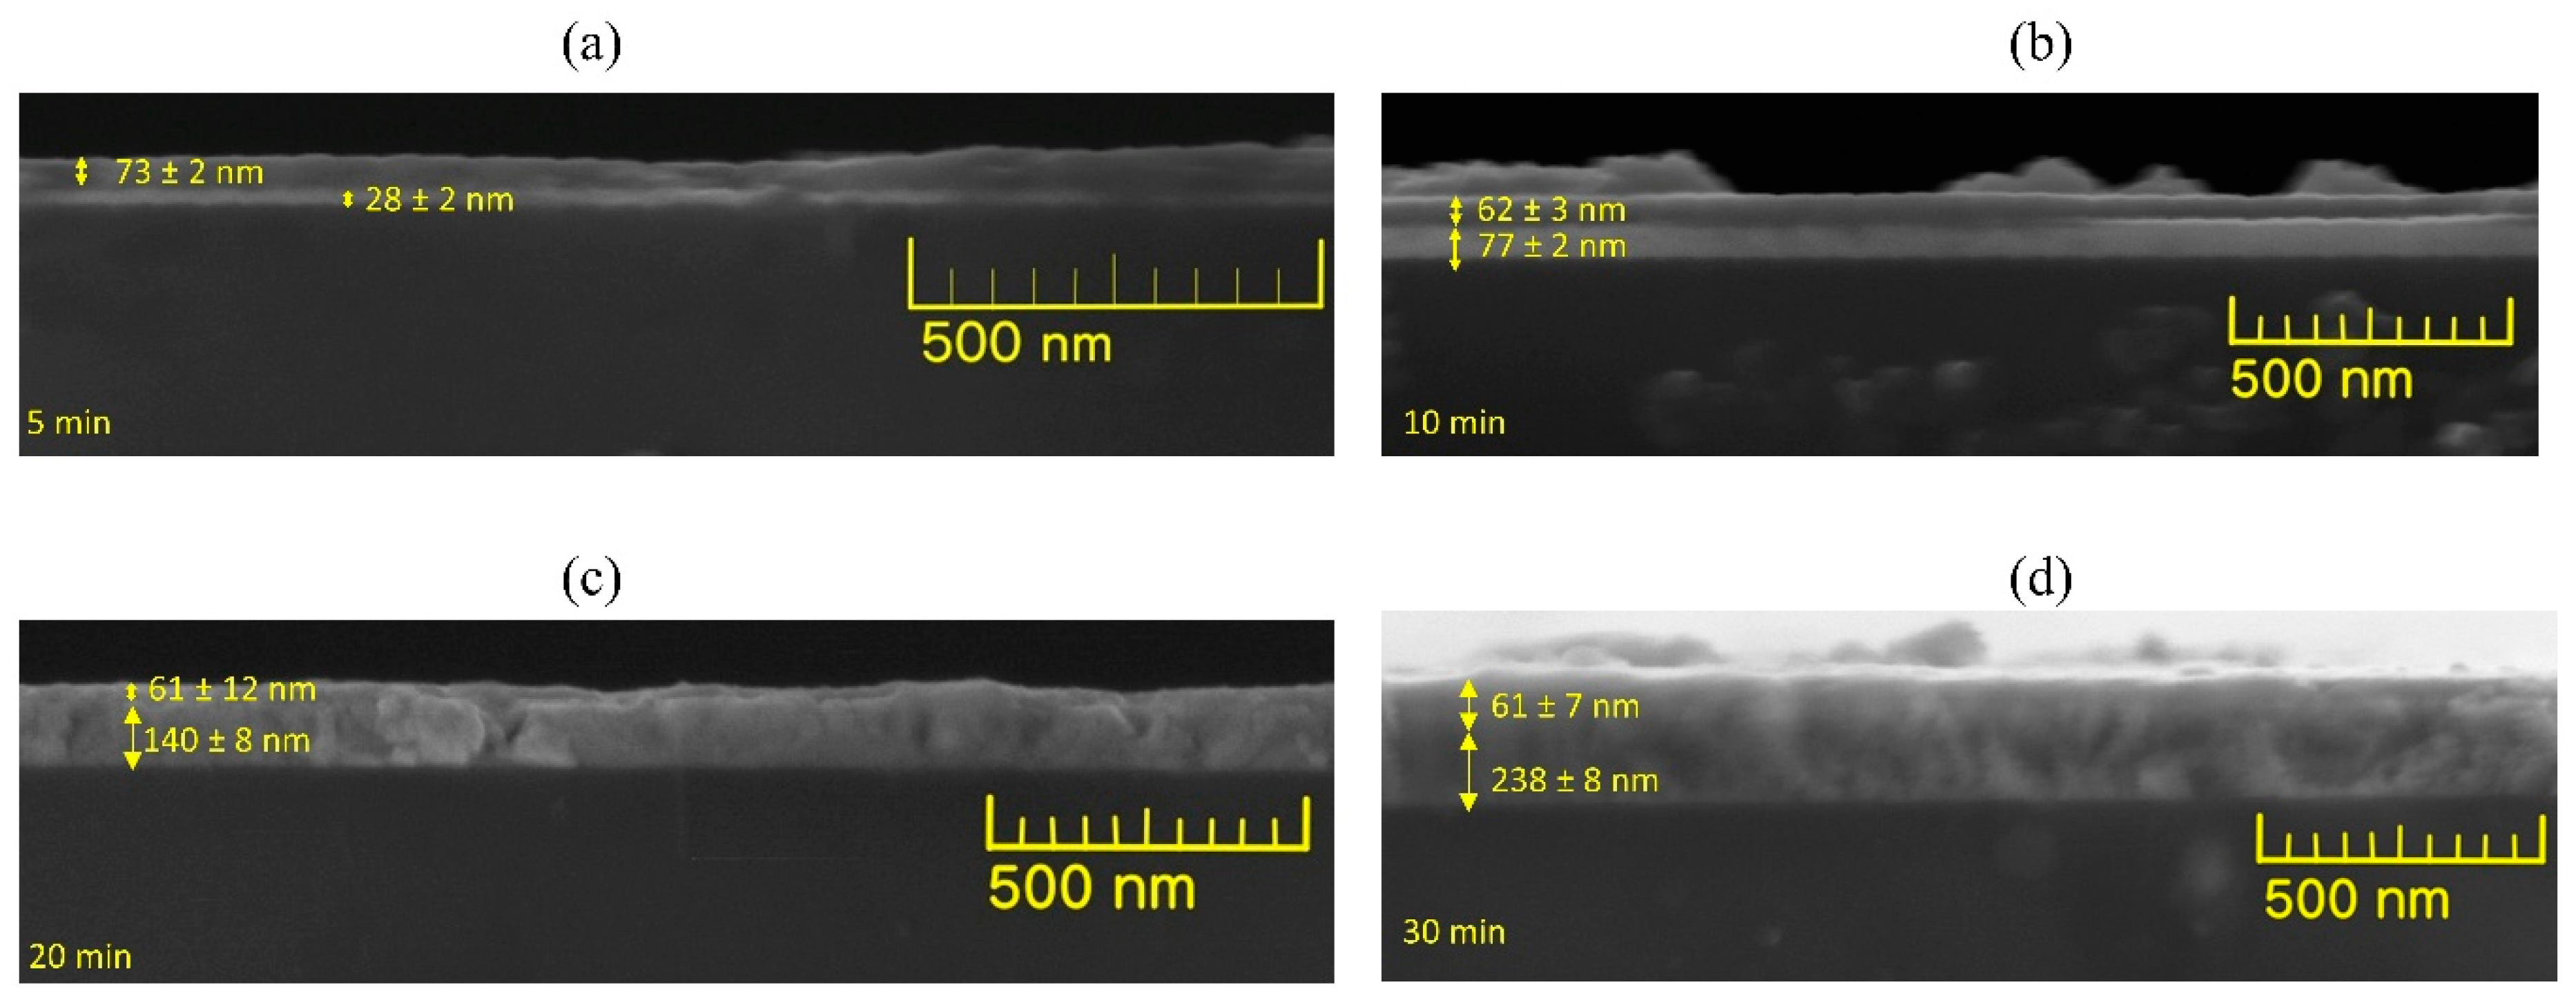
Cross-sectional field-emission scanning electron microscopy (FE-SEM) micrographs of the TiO2/WOx bilayers are presented in Figure 5 for WOx growth times of 5, 10, 20, and 30 min. In the 5 min and 10 min specimens, two distinct layers are clearly resolved: a bright TiO2 cap, measuring 73 ± 2 nm and 62 ± 3 nm in thickness, respectively, positioned above darker WOx layers of 28 ± 2 nm and 77 ± 2 nm. In contrast, the 20 min and 30 min samples display reduced contrast between the oxides, and the interface appears diffuse, a consequence of the increased surface roughness of thicker WOx films. In these cases, layer boundaries were determined by averaging gray-level profiles across multiple sites, resulting in TiO2 thicknesses of 61 ± 12 nm (20 min) and 61 ± 7 nm (30 min), together with WOx thicknesses of 140 ± 8 nm and 238 ± 8 nm, respectively.
The data supports three main points. First, the TiO2 cap shows excellent reproducibility, with a mean thickness of 64 ± 6 nm across the series, corresponding to a constant growth rate of 2.1 ± 0.2 nm·min−1 during the fixed 30 min deposition step. Second, the WOx underlayer thickens nearly linearly with sputtering time, yielding average deposition rates of 5.6, 7.7, 7.0, and 7.9 nm·min−1 for 5, 10, 20, and 30 min, respectively. Third, the SEM-derived thicknesses are consistent with the ellipsometric values within ±8%, validating the optical model even for the thicker films where the interface becomes less well defined. Taken together, these results demonstrate that the bilayer architecture can be reliably tailored by adjusting the WOx deposition time, while the TiO2 cap remains effectively thickness-invariant.
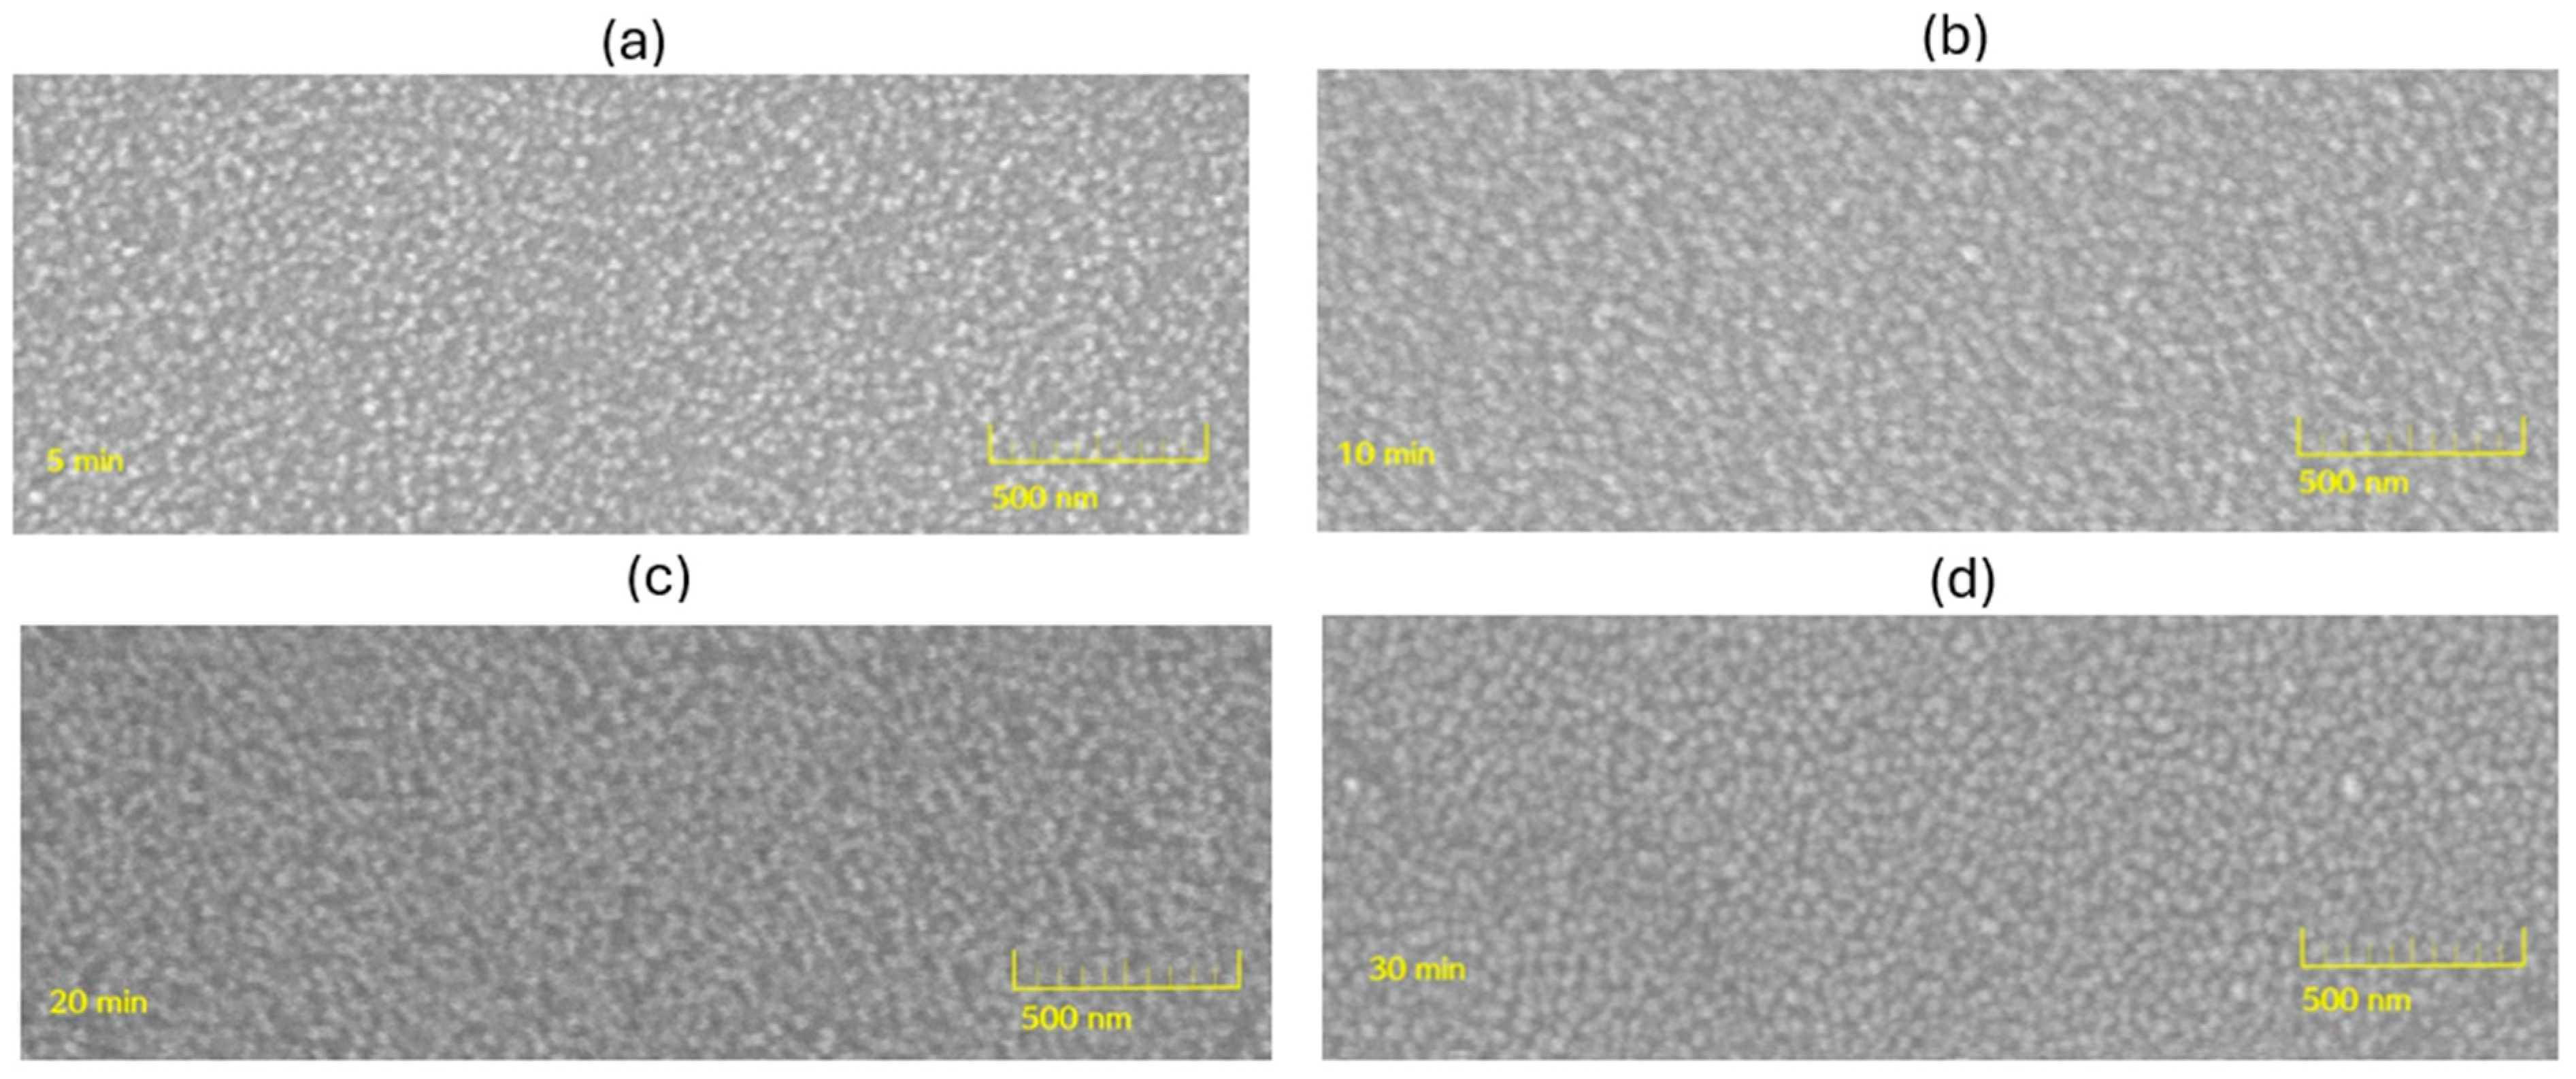
Complementing the cross-section analysis (Figure 5), the top-view micrographs and the grain-size Table 2 in Figure 6 reveal a thickness-driven surface evolution. The mean grain size (Table 2) increases from 29.5 ± 8 nm (5 min) to 47.9 ± 7 nm (10 min), shows a transient refinement at 20 min (38.5 ± 5 nm), and coarsens again at 30 min (46.5 ± 3 nm). The top views (Figure 6a–d) confirm pin-hole-free continuity and enhanced texture for 20–30 min. This non-monotonic trend agrees with the Structure Zone Model for reactive sputtering, where film thickening and chemistry/stoichiometry evolution (higher O incorporation and target poisoning) modulate adatom mobility: re-nucleation/splitting may prevail at intermediate thickness, while column coalescence dominates at larger thickness and after 450 °C annealing [31,32,33,34]. The larger electrochemically accessible area and roughness at 20–30 min rationalize the lower Rp and higher current/pseudocapacitance, consistent with more dispersive CPEs at rough interfaces [35,36].

3.4. Crystalline Structure from X-Ray Diffraction

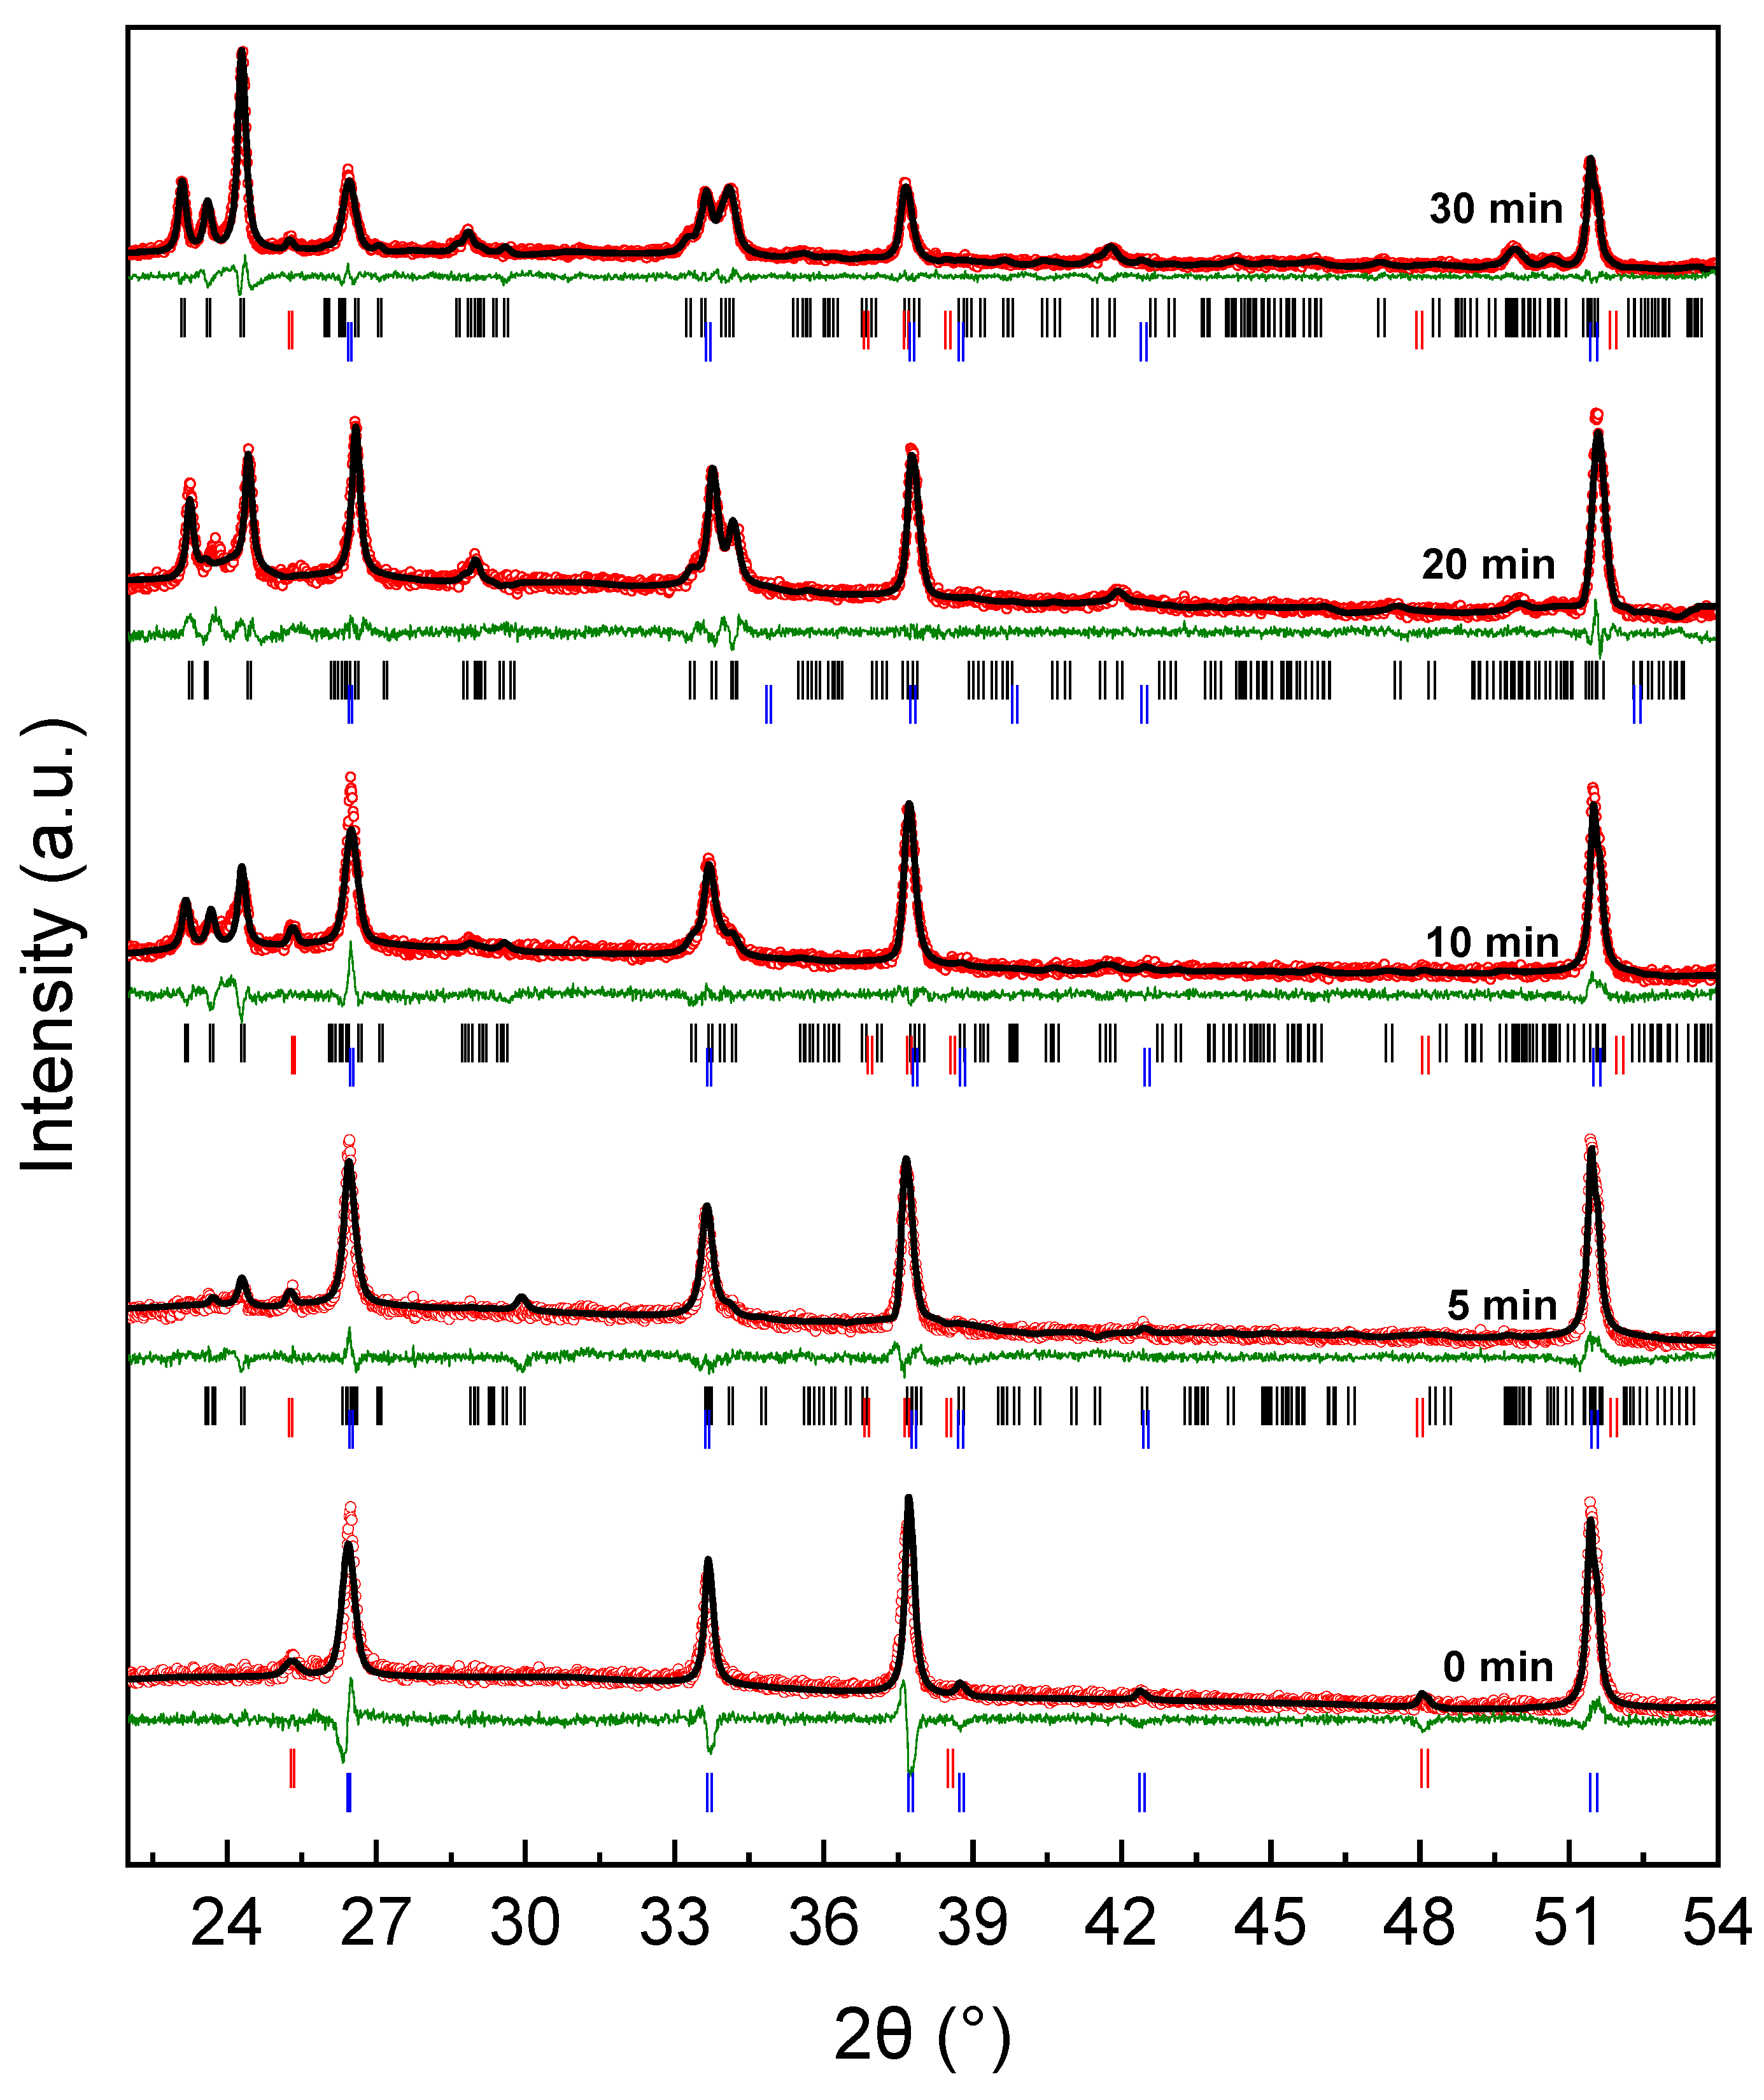
The X-ray diffraction (XRD) profiles in Figure 7 confirm that the annealed bilayers consist of anatase TiO2 and monoclinic γ-WO3, along with reflections from the underlying FTO/glass substrate. Because the films are textured, the measured peak intensities do not correspond to those of a random powder and therefore cannot be used for quantitative phase analysis; only the 2θ positions were exploited to extract structural information. Indexing and least-squares refinement of these positions were performed with the FullProf suite [37], and the refined lattice parameters are summarized in Table 3.
For anatase TiO2, the lattice constants remain essentially invariant (a~3.79 Å, c~9.55 Å) regardless of the WO3 deposition time, indicating that neither interdiffusion nor strain develops during the 450 °C annealing step. The γ-WO3 underlayer is also structurally stable across the series, yielding a~7.32–7.33 Å, b~7.54–7.55 Å, c~7.50–7.68 Å, and β values very close to 90°. These results are consistent with the reference monoclinic cell and demonstrate that the crystal structure is well preserved after annealing.
The crystallite size (D) of WO3 was estimated using the Scherrer equation applied to the diffraction angles of the (002) and (200) planes [38,39]:
D =   0.9 λ β cos θ
where λ is the X-ray wavelength and β is the full width at half maximum (FWHM, in radians) of the corresponding reflection. Because the strong diffuse scattering from the FTO substrate obscures these peaks in the 5 min sample, reliable D values could not be obtained for that specimen. For deposition times of 10, 20, and 30 min, the crystallite size increases from 36(3) nm to 44(5) nm, before leveling off at 41(1) nm. Although reports of D for sputtered monoclinic WO3 are limited, these values are comparable to the ~40 nm crystallites observed by Lethy et al. for orthorhombic WO3 films grown by pulsed-laser deposition at room temperature [38]. This similarity suggests that the grain growth kinetics of WO3 are broadly consistent across different physical vapor deposition techniques under moderate thermal budgets.

3.5. Vibrational Characterization by Raman Spectroscopy

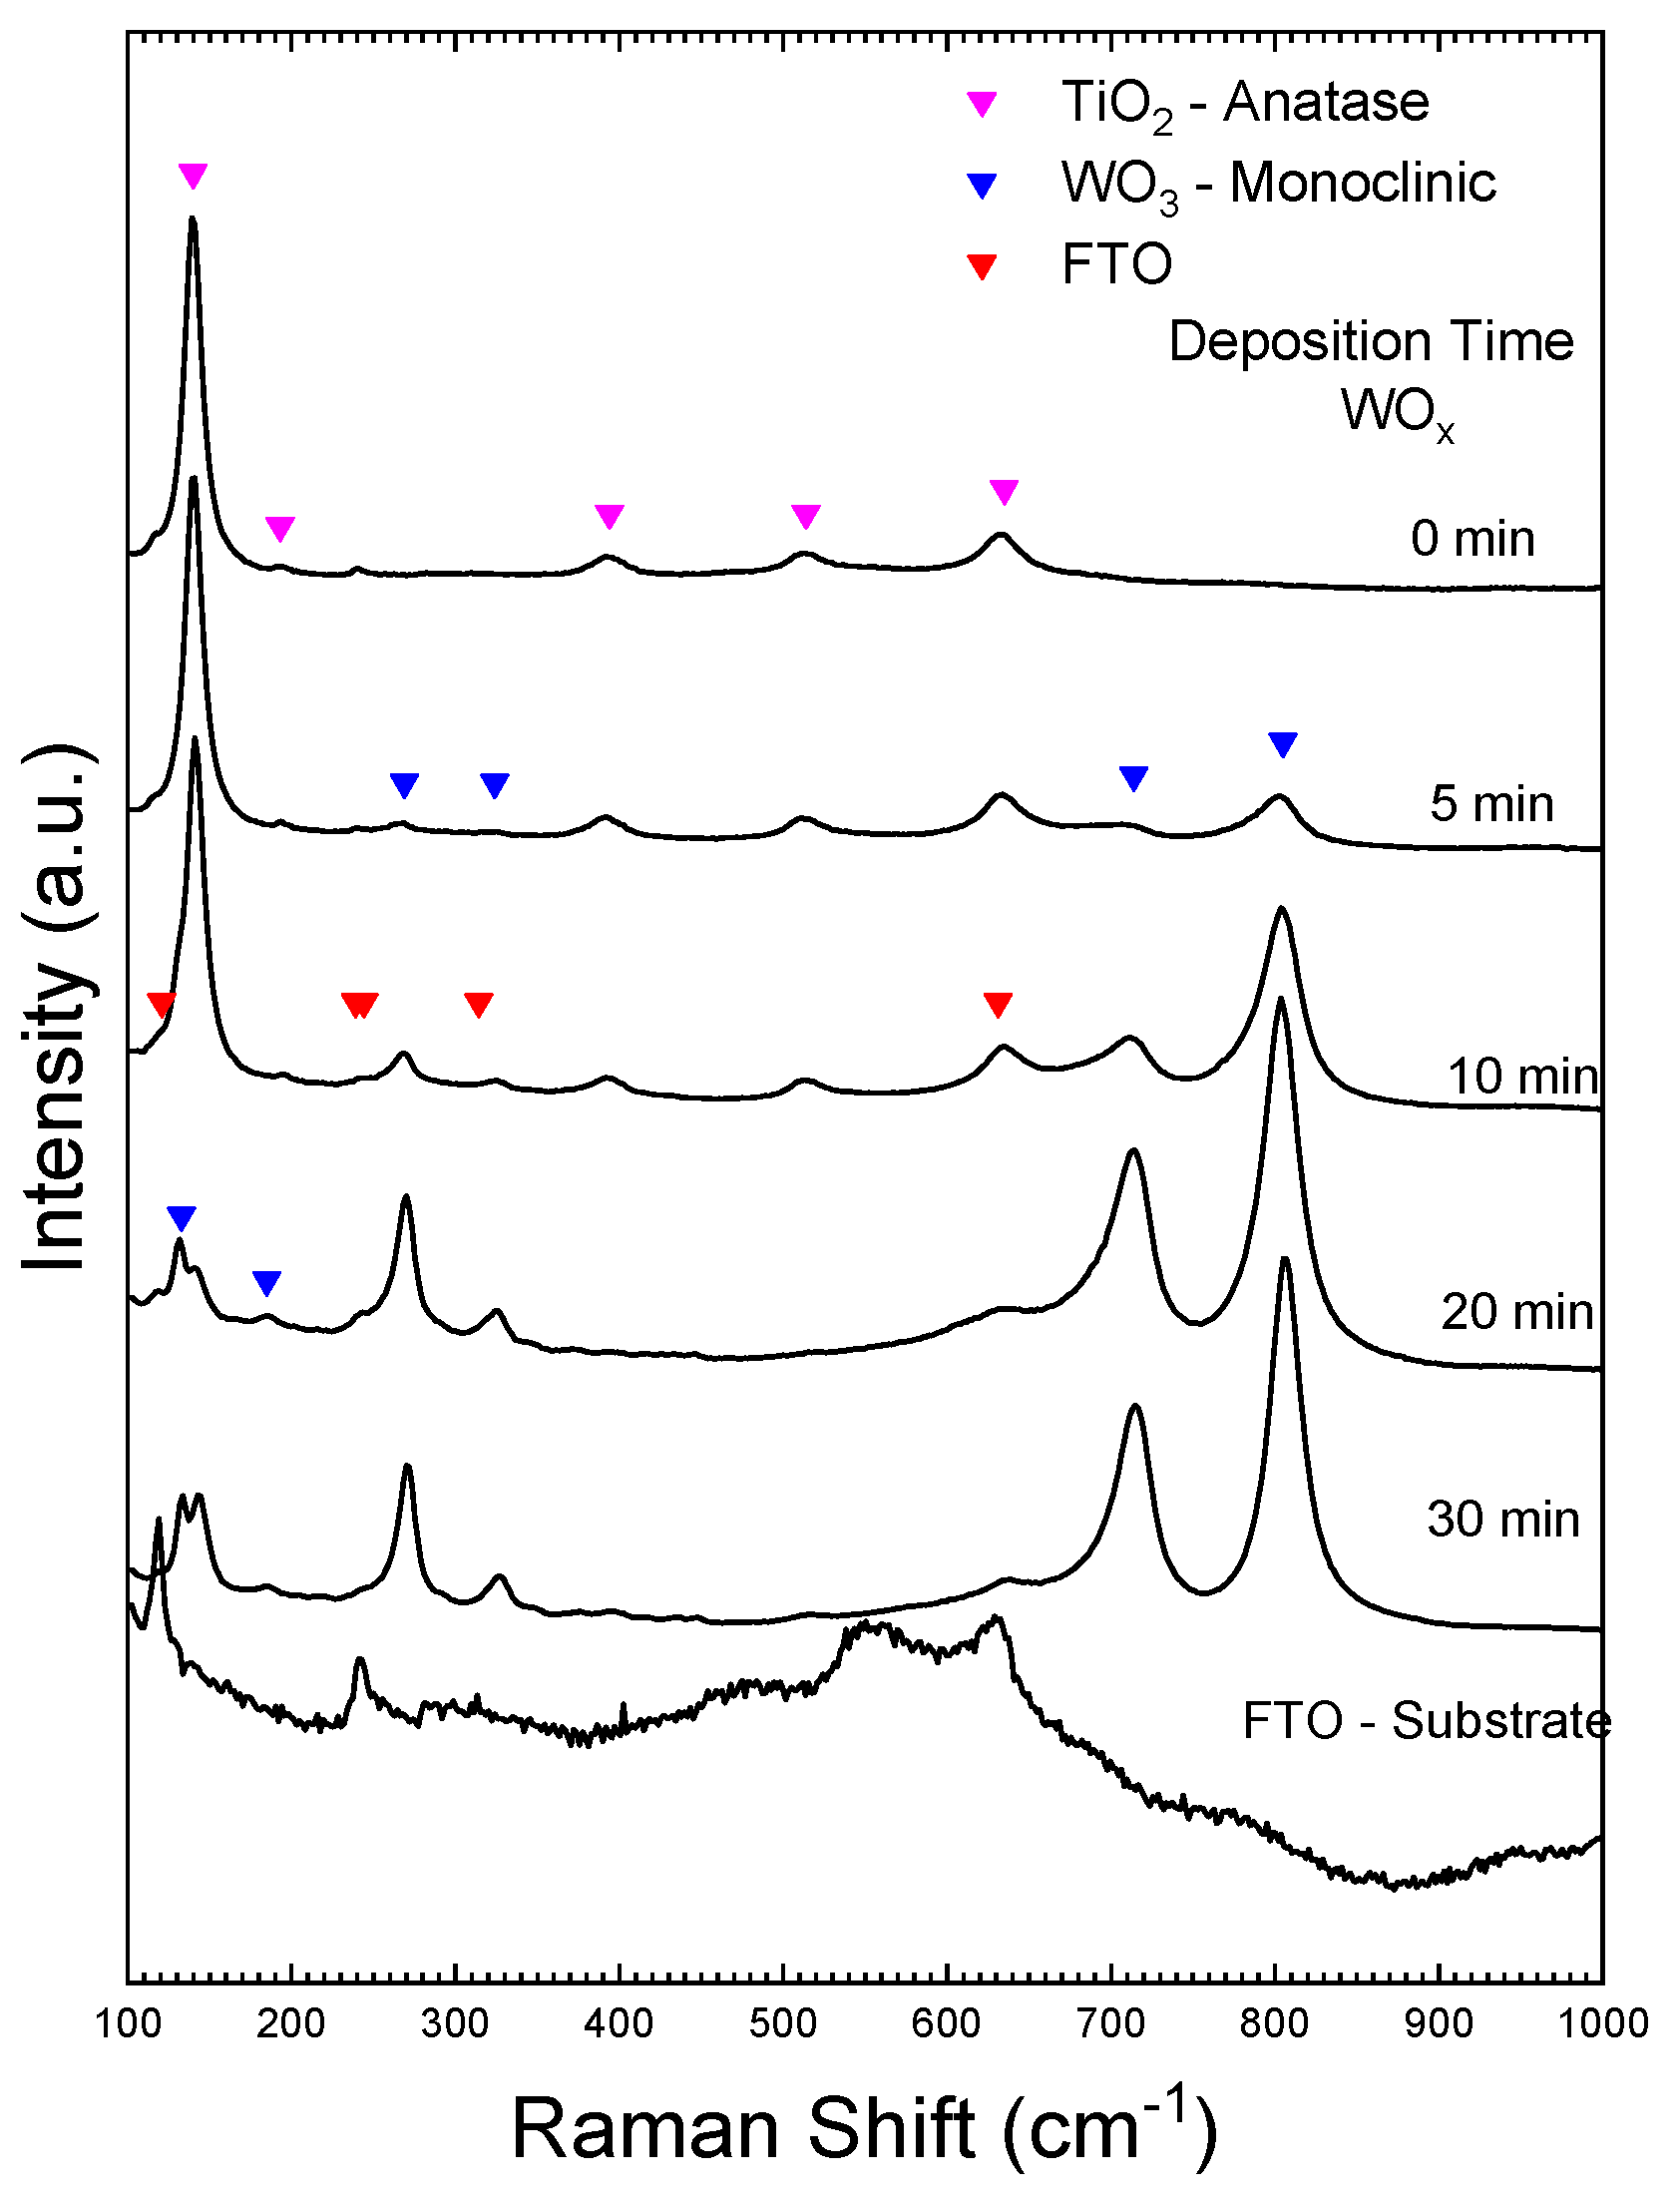
Raman spectroscopy was used to examine the structural evolution of the TiO2/WOx bilayers as a function of WOx deposition time. Figure 8 shows the Raman spectra of the samples deposited on FTO, where the deposition time of the WOx layer was varied from 0 to 30 min. The reference spectrum (0 min deposition, bare TiO2) displays five well-resolved peaks at approximately 145 cm−1 (Eg), 197 cm−1 (Eg), 399 cm−1 (B1g), 513 cm−1 (A1g), and 640 cm−1 (Eg), corresponding to the characteristic vibrational modes of the anatase phase of TiO2.
Upon extending the WOx deposition to 5 min, new Raman bands emerge, signaling the nucleation of tungsten oxide. At low wavenumbers, features near 130 cm−1 and 180 cm−1 are attributed to vibrational modes of (W2O2)ₙ chain units, where tungsten atoms are linked by twofold-coordinated oxygen ligands [40]. In the mid-frequency region, bands around 273 cm−1 and 329 cm−1 arise from W–O–W bending vibrations associated with bridging oxygen ions between adjacent WO6 octahedra [40]. In the high-frequency region, intense peaks at ~715 cm−1 and ~806 cm−1 correspond to W–O–W stretching vibrations, reflecting the strong tungsten–oxygen bonds characteristic of the monoclinic γ-WO3 framework [40].
This progressive spectral evolution with increasing deposition time confirms the growth of a WOx-rich surface layer. The simultaneous presence of anatase TiO2 and γ-WO3 vibrational signatures evidences the successful fabrication of TiO2/WOx heterojunctions and corroborates the structural information derived from XRD analysis (Figure 6).

3.6. Optical Transmittance and Band Gap Analysis

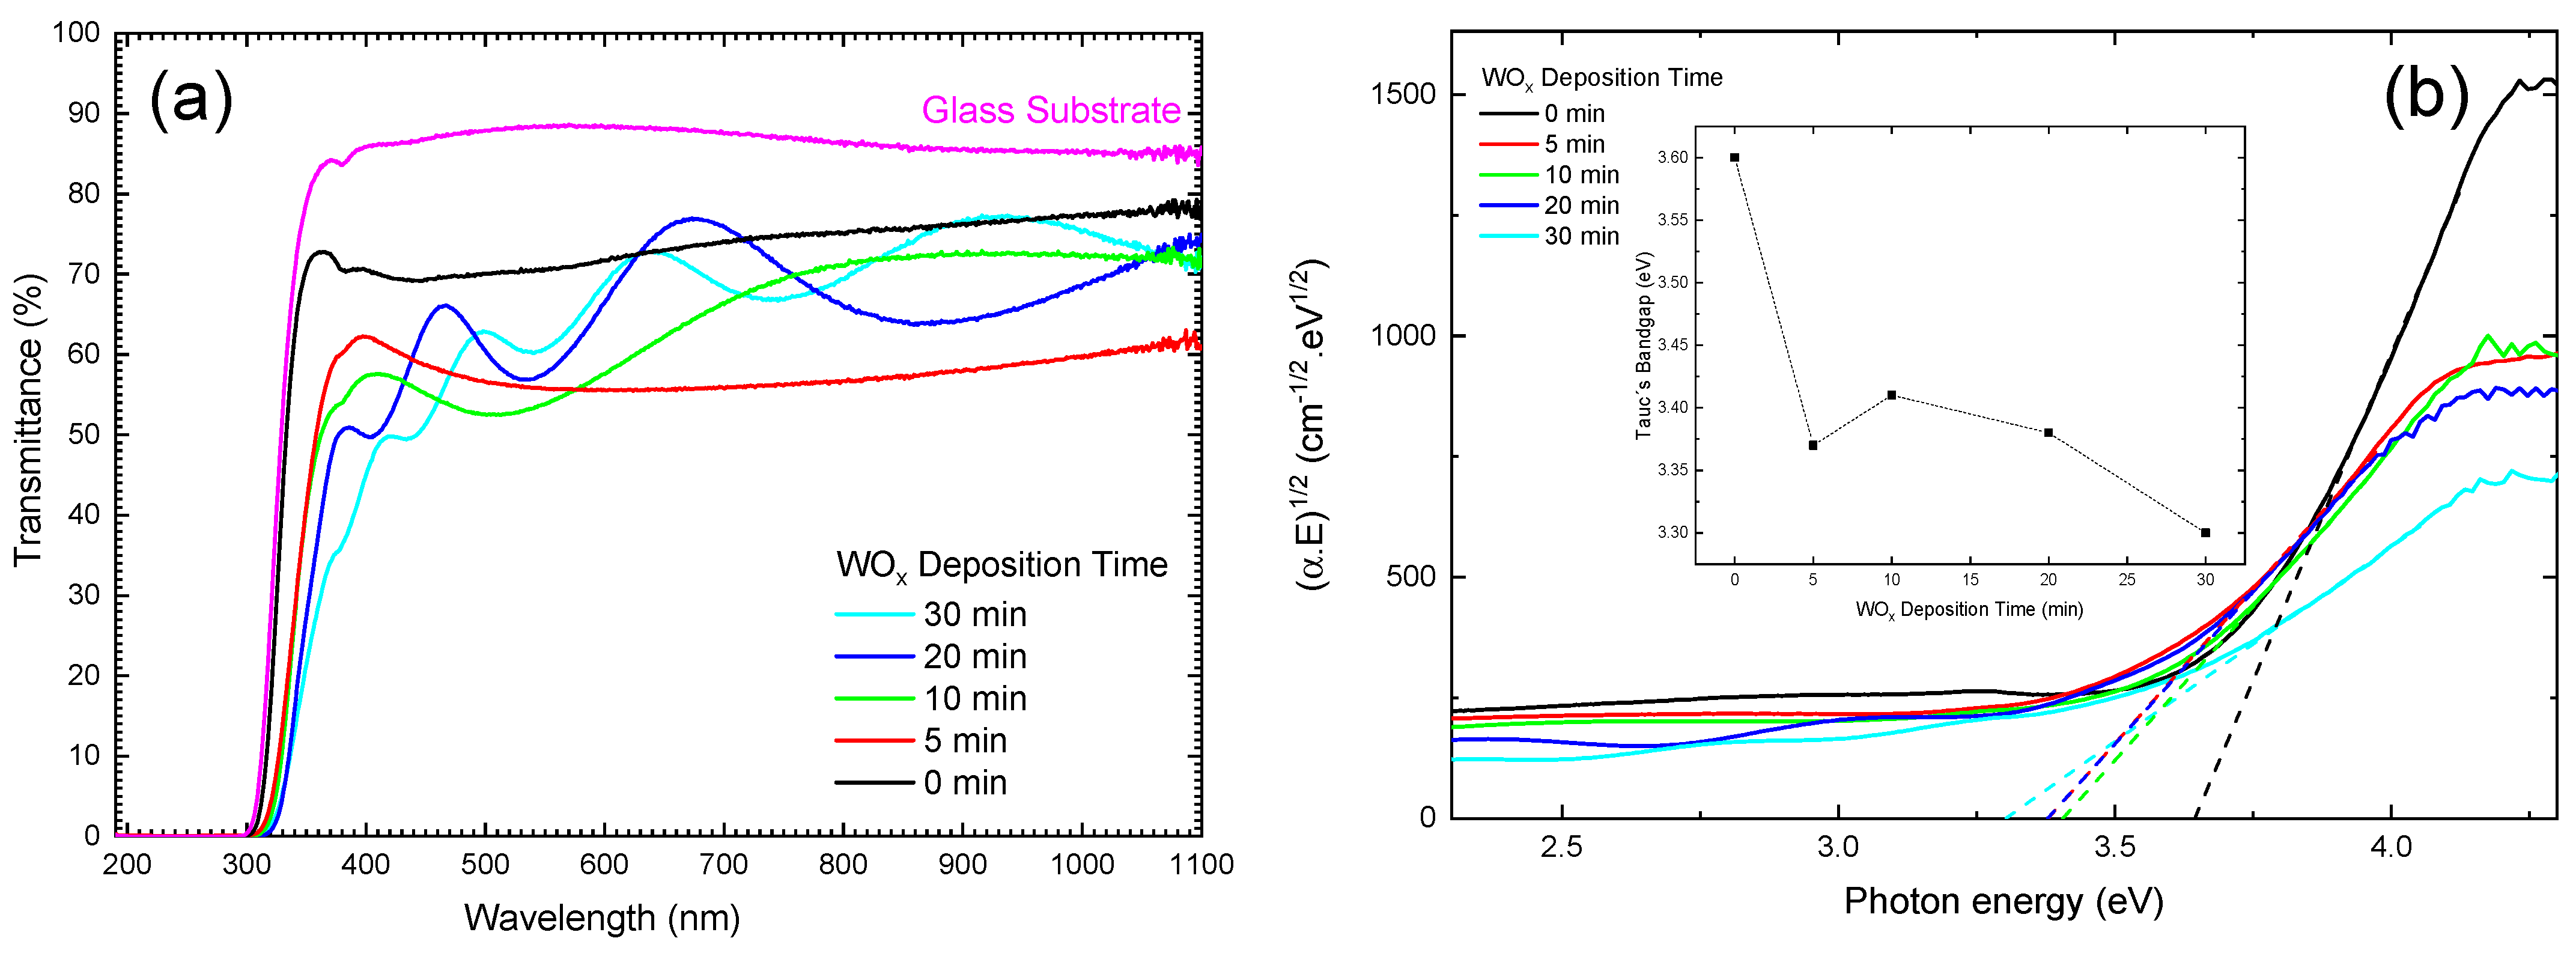
The normal-incidence transmittance curves in Figure 9a illustrate how the optical response of the stack evolves as the WOx underlayer thickens. For the bare TiO2 film (0 min) and the sample with 5 min of WOx deposition, the spectra are essentially smooth, with no discernible interference oscillations across the 350–1100 nm range. Previous reports indicate that the total thickness of these two coatings is below ~150 nm, i.e., smaller than ~λ/4n for visible wavelengths. Under this condition, the optical path difference between multiply reflected rays is insufficient to produce resolved Fabry–Pérot fringes, and the spectrum is governed primarily by bulk absorption and Fresnel losses. This behavior is typical of oxide films with thicknesses well below 100 nm and has been observed for TiO2 layers grown by sputtering or spin coating [41].
Once the WOx deposition time exceeds 10 min, a series of well-defined maxima and minima emerges and shifts progressively towards longer wavelengths. The presence of these fringes indicates that the optical thickness (n·d) of the bilayer has entered the interference regime. Their red shift and reduced spacing with increasing deposition time confirm a monotonic increase in physical thickness, consistent with ellipsometry results.
The corresponding Tauc representation, (αhν)12 plotted against photon energy, is shown in Figure 9b. Linear regions were fitted to the most linear portions of each curve, assuming an indirect allowed transition, and the intercept at (αhν)12 = 0 was taken as the optical band gap (Eg). Although the Tauc model is strictly valid for homogeneous semiconductors, it is widely used as an effective-gap approximation for oxide heterostructures. In such systems, the extracted value reflects the lowest energy at which the joint density of states becomes significant, rather than the true band edge of an individual phase.
The pristine TiO2 film yields an apparent band gap of 3.60 eV, higher than the bulk anatase value (~3.20 eV). Such overestimations are frequently observed in dc-sputtered titania and are attributed to compressive growth stress, which can shift the optical edge upward by several tens of meV per gigapascal through lattice contraction and antibonding state stabilization [42]. Adding a thin WOx layer narrows the gap to 3.37 eV (5 min) and then slightly widens it to 3.41 eV (10 min). This initial blue shift is consistent with interfacial oxidation, which removes Ti3+-related donor states from the TiO2 band gap [43]. Residual compressive stress from the dense WOx underlayer may further stiffen Ti–O bonds and contribute to the upward shift in the edge.
For longer deposition times, the trend reverses. The 20 min and 30 min samples show progressive redshifts to 3.38 eV and 3.30 eV, respectively. At these thicknesses, the optical response is increasingly dominated by WO3, whose intrinsic band gap lies near 2.7–2.8 eV, as well as by shallow donor states associated with W5+/oxygen-vacancy centers, which pull the absorption edge to lower energies [44]. The competition between band gap widening due to interfacial passivation and narrowing due to WO3 contributions thus explains the observed non-monotonic evolution of Eg.
Collectively, the characterization findings present a cohesive understanding of the system. The deposition conditions yield a γ-WO3/anatase-TiO2 heterostructure, characterized by systematic changes in its structural and optical properties. The WO3 underlayer thickens progressively with deposition time, developing both lattice and vibrational features of crystalline monoclinic WO3 while retaining nanometer-scale grains that favor high surface area. In contrast, the TiO2 cap remains structurally and optically stable, maintaining a dense anatase phase and acting as a chemically robust, high-index window. The two oxides form an abrupt but mechanically coherent interface, while the modest refractive index contrast between them establishes a graded optical profile that minimizes internal reflections. This combination provides a tunable platform in which the WO3 thickness can be precisely controlled without compromising film integrity, interfacial contact, or light-management characteristics, thereby enabling systematic studies of charge separation and photoelectrochemical performance.

3.7. Electrochemical Behavior by Cyclic Voltammetry

The scan rate study for each system was performed at 10 mV·s−1 to assess electrode behavior in terms of reversibility, to identify capacitive and pseudocapacitive processes associated with films deposited by magnetron sputtering, and to investigate photoelectrochemical effects under illumination. Measurements were conducted within the potential window of 0.0–1.0 V at a fixed scan rate of 10 mV·s−1. The shape of the voltammogram serves as a diagnostic tool: a nearly rectangular profile is indicative of electric double-layer capacitance [45,46], while the appearance of shoulders at specific potentials reflects redox reactions associated with localized surface processes within the electrode [36,47]. In cyclic voltammetry, the oxidation or reduction of adsorbed or intercalated species at the working electrode is governed by the applied potential. As the potential increases, positive charging of the electrode promotes oxidation; conversely, decreasing potential favors reduction reactions [48]. These redox processes are strongly influenced by material properties such as electronic structure and surface chemistry, which, in turn, are sensitive to synthesis parameters including WOx deposition time [49].
System reversibility is typically evaluated by the symmetry and separation of anodic and cathodic peaks. Reversible systems display closely spaced and symmetric peaks, while quasi-reversible systems exhibit broader or shifted responses [50]. In our case, several voltammograms suggest quasi-reversible behavior, due to limitations in charge transfer kinetics and structural rearrangements during cycling. Literature on oxide-based electrodes supports that factors such as porosity, crystallinity, and interfacial roughness critically determine pseudocapacitive and faradaic contributions [51,52]. Thus, analysis of the voltametric profiles enables assessment of both electrochemical activity and the kinetic regime governing charge storage.
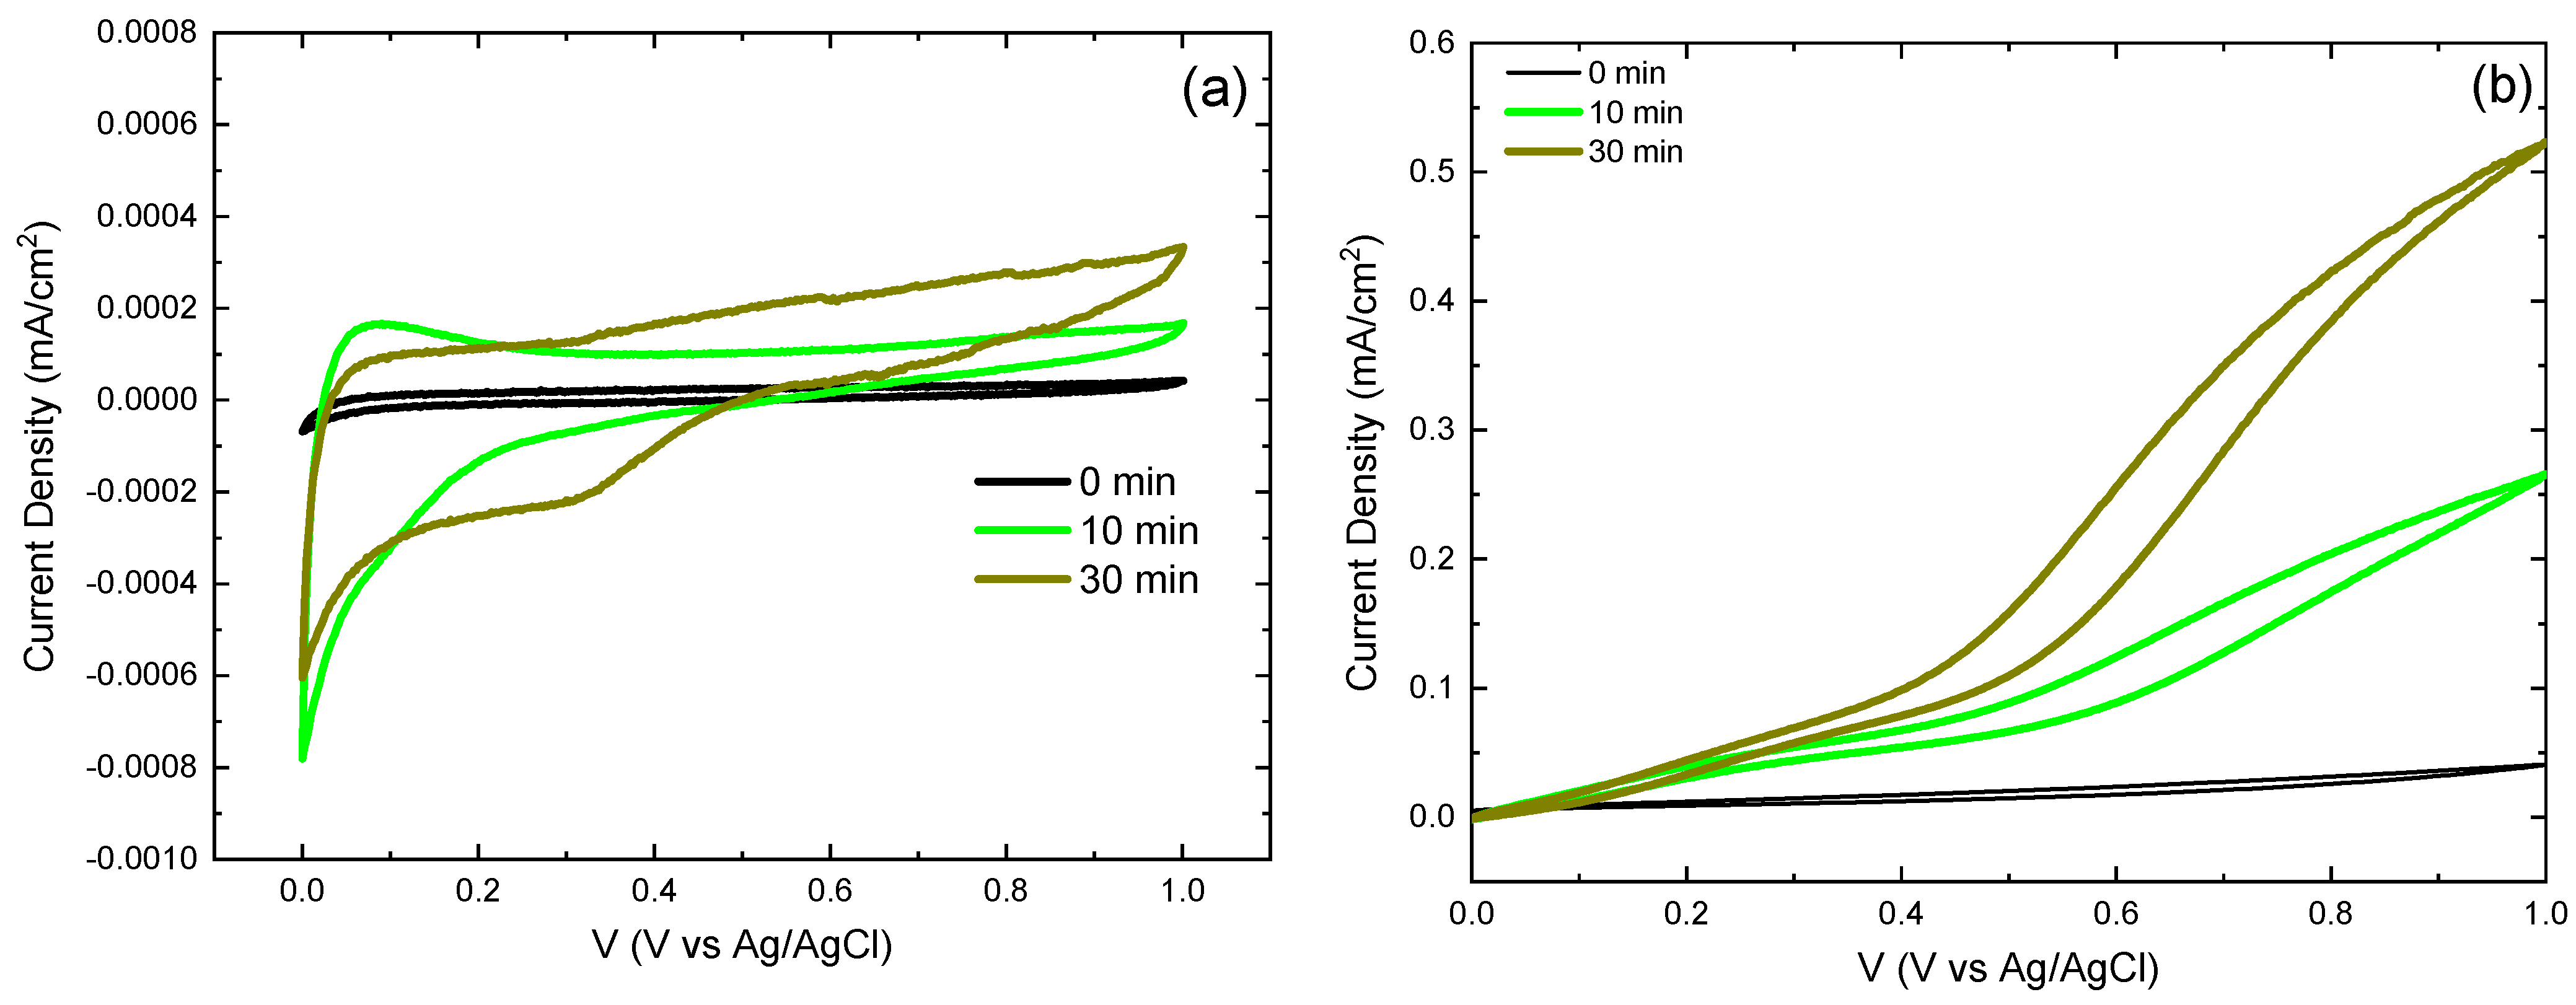
The representative voltammograms in Figure 10 highlight the response of the films under dark and illuminated conditions as a function of WOx deposition time. Electrodes consisting of TiO2/WOx bilayers exhibited higher current densities compared to bare TiO2 or isolated WOx. Figure S1 presents the voltammogram of all samples. This enhancement arises from the built-in electric field at the TiO2/WOx heterojunction, which promotes efficient charge separation and electron collection in TiO2 [12,53]. In addition, W6+/W5+ redox sites in WOx enable fast pseudocapacitive charge storage [35,54], while the microstructure of magnetron-sputtered films (structure-zone model) increases the effective interfacial area and surface roughness, typically lowering the charge-transfer resistance, as confirmed by EIS [33,34]. Consistently, our EIS fits show a reduced charge-transfer resistance for the heterostructures [55], and Mott–Schottky analysis indicates a higher donor density, in agreement with established procedures for extracting Nᴅ [56]. The TiO2 + 30 min WOx configuration displayed distinct peaks around 0.0–0.2 V vs. Ag/AgCl under dark conditions. Under AM 1.5G illumination, these peaks shifted to 0.5–1.0 V vs. Ag/AgCl and were accompanied by a more linear slope, suggesting enhanced surface redox activity due to photogenerated charge carriers. These carriers participate in faradaic reactions at the electrode–electrolyte interface, thereby amplifying pseudocapacitive contributions [45,47]. Similar light-enhanced pseudo capacitance has been reported in other metal oxide electrodes, where photogenerated electron–hole pairs facilitate reversible redox transitions and improve charge-storage performance [49].
In the TiO2/WOx electrode with the longest WOx deposition (30 min), the density of redox-active sites is higher than in thinner films or monolayers, leading to greater current density and charge-storage capacity [57]. Consequently, the TiO2 + 30 min WOx sample showed the highest current density of all specimens, a result attributed to its larger electrochemically accessible surface area, which provides more sites for both faradaic reactions and double-layer formation [58].
Reversible reactions occur when charge transfer at the electrode–electrolyte interface is sufficiently fast to establish dynamic equilibrium, with mass transport as the main limiting factor. Under these conditions, the Nernst equation describes the system [59]. In an ideal reversible case, the reduction and oxidation peaks occur at the same potential (Epc = Epa), the ratio of anodic to cathodic peak current equals unity (Ipa/Ipc = 1), and peak currents scale linearly with the square root of the scan rate [50]. Most systems, however, deviate from this ideality. Quasi-reversible systems exhibit slower charge transfer, with both mass transport and kinetic factors affecting current response, leading to peak shifts between oxidation and reduction [60].
In the present study, not all samples displayed well-defined redox peaks. Nonetheless, inflections and shoulder-like features emerged within 0.0–0.2 V vs. Ag/AgCl, depending on deposition time and illumination. These asymmetric features, often confined to one branch of the voltammogram, may arise from preferential stabilization of a specific oxidation state. Such asymmetry suggests kinetic limitations in charge transfer or selective stability of the oxide, consistent with pseudocapacitive behavior in transition-metal oxides [56,61].
The lack of symmetric peak pairs should not be interpreted as electrochemical instability. A system can exhibit quasi-irreversible characteristics while maintaining stable long-term performance. In fact, the studied electrodes retained reproducible profiles across six cycles, consistently showing a recurring anodic peak near 0.3 V vs. Ag/AgCl, associated with partial WOx oxidation. This distinction between kinetic reversibility and operational stability is critical when interpreting cyclic voltammetry results.
The semiconducting nature of TiO2 and WOx inherently limits the appearance of fully reversible voltametric features. WOx, with its multiple oxidation states (W6+/W5+/W4+), undergoes pseudocapacitive redox processes that are rarely fully reversible due to metastable intermediates and the complexity of ion intercalation [45]. TiO2, mainly anatase, contributes primarily via electric double-layer capacitance due to its wide band gap (~3.2 eV). Despite these constraints, the voltammograms remained stable over repeated cycling, confirming that TiO2/WOx electrodes exhibit reliable and reproducible electrochemical performance under both dark and illuminated conditions.

3.8. Energy and Power Density Evaluation

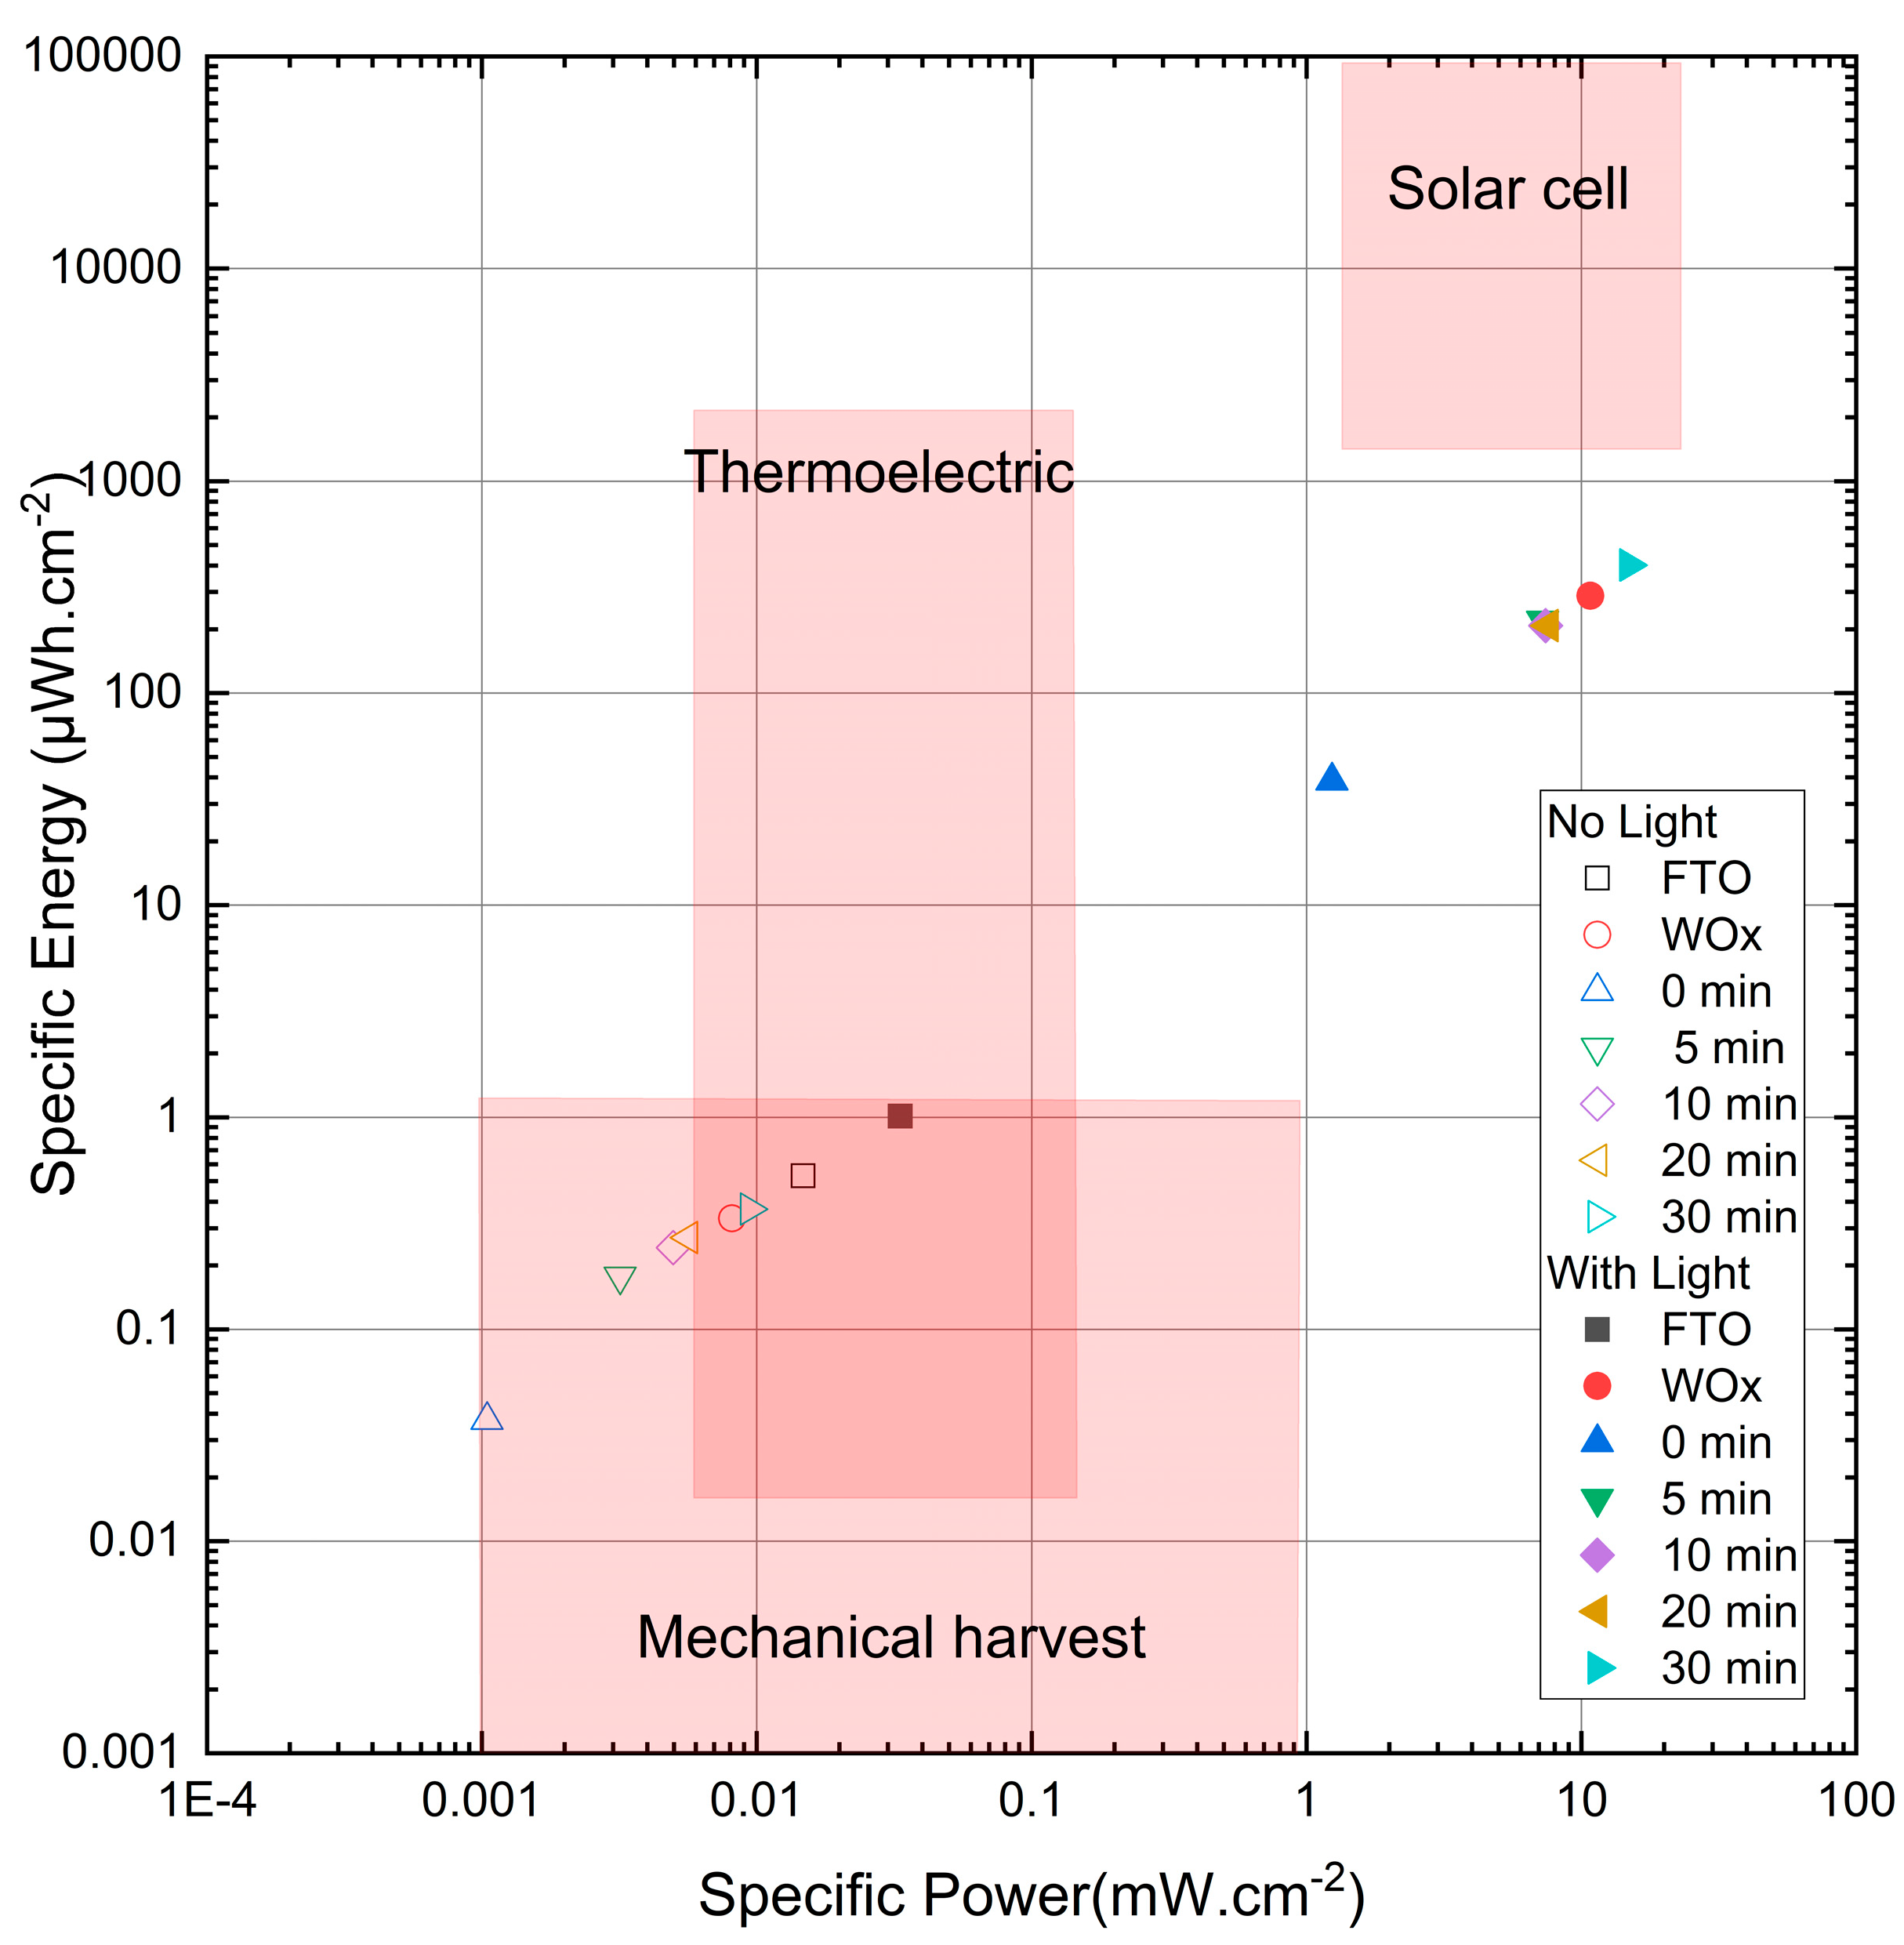
To benchmark, on an aerial basis, the energy power trades off these thin film electrodes and to compare dark vs. illuminated operation, we extracted specific power (Ps) and specific energy (Es) were calculated using Equations (2) and (3):
P s =   I d V A
E s = I . V d t A
where I is the instantaneous current, V is the potential, t is time, and A is the geometric area of the electrode [62]. A scan rate of 10 mV·s−1 was selected, as it provides a suitable compromise between resolving redox peaks and minimizing ohmic losses, while also ensuring reliable integration of the curve area for charge estimation [63]. The applied potential window was set to 1.0 V (0.0–1.0 V vs. Ag/AgCl), with all electrode areas standardized to 1 cm2. Each sample was tested in triplicate to guarantee statistical consistency.
As shown in the Ragone plot (Figure 11), the TiO2/WOx bilayer with 30 min of WOx deposition exhibited the highest values, reaching 0.19 Wh·cm−2 in specific energy and 0.16 W·cm−2 in specific power under illumination. This enhancement is attributed to the greater film thickness and higher density of electrochemically accessible redox states. The performance values place these electrodes within the region of hybrid pseudocapacitors, which exhibit intermediate energy–power characteristics between electric double-layer capacitors and batteries [64,65].

3.9. Semiconductor Properties from Mott–Schottky Analysis

Mott–Schottky (MS) analysis is a widely employed method for the electrochemical characterization of semiconductors, as it enables the extraction of key electronic parameters such as majority carrier densities (Nd) and flat-band potential (VFB). These parameters are essential for assessing the photoelectrochemical behavior of materials since they directly affect charge separation, the formation of potential barriers, and the efficiency of electron transfer at solid/electrolyte interfaces [66,67].
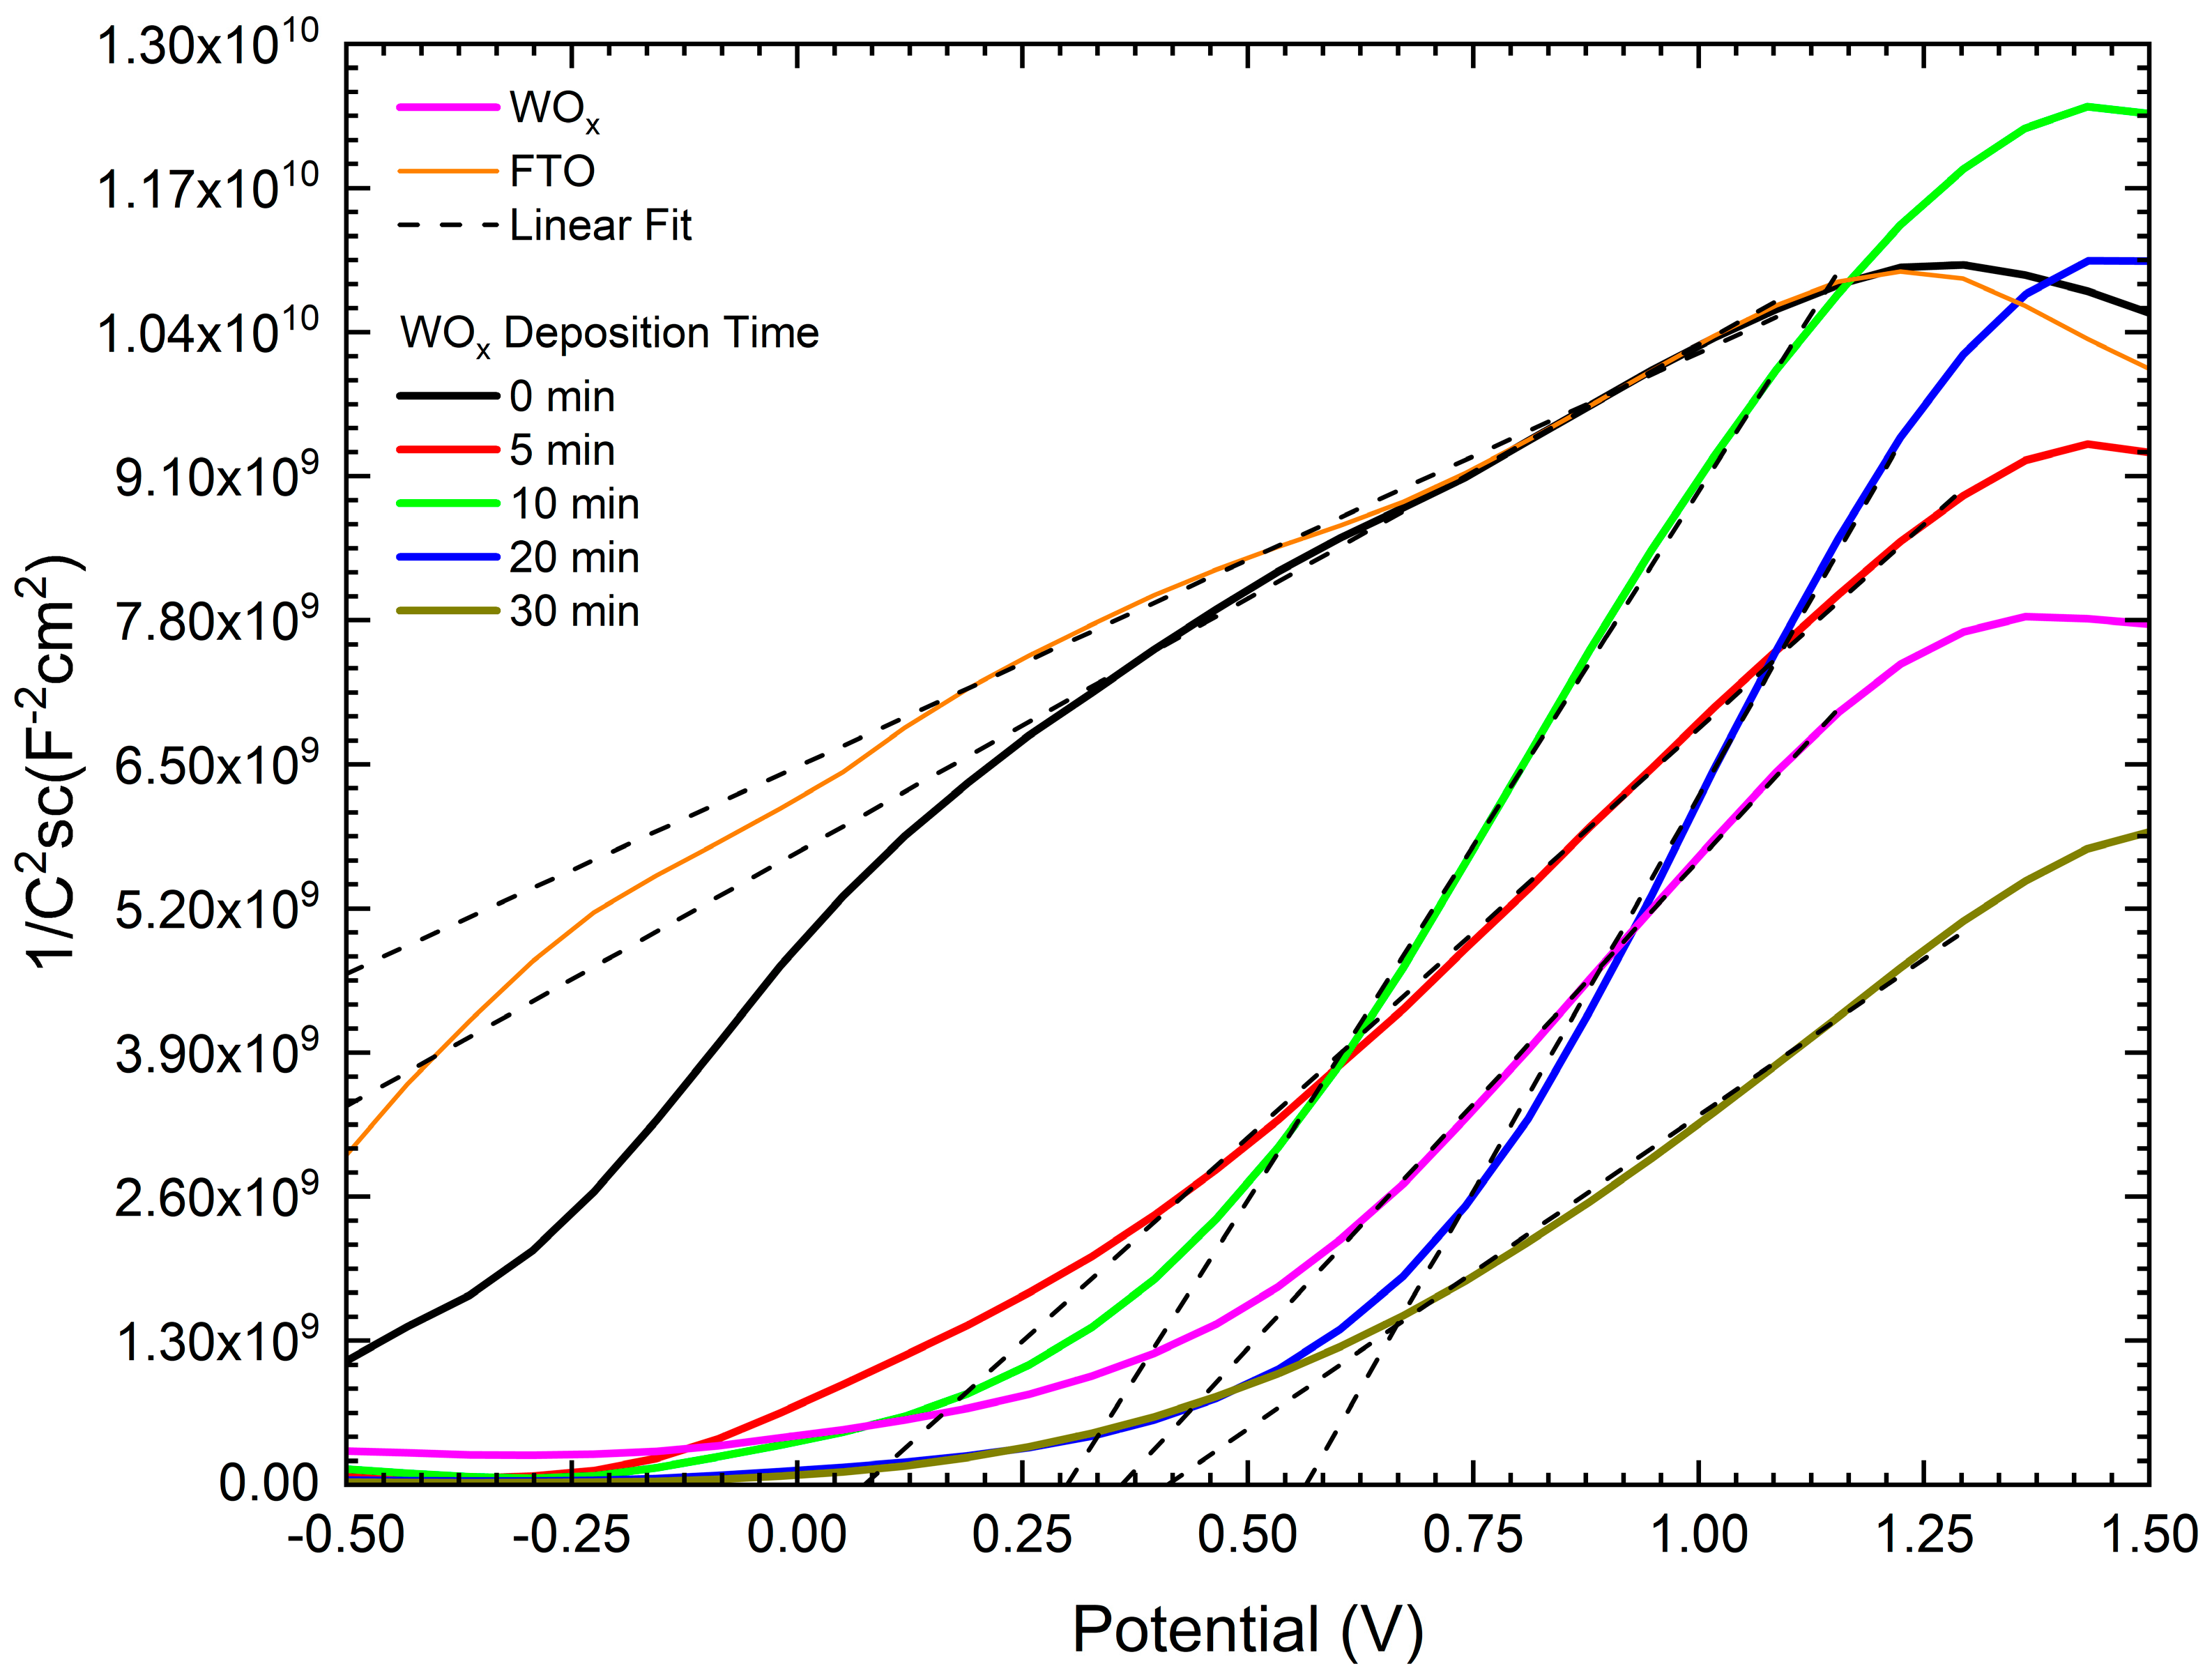
The MS curves were obtained under dark conditions using a 0.5 mol·L−1 Na2SO4 electrolyte, within a potential range of −0.5 V to 1.5 V vs. Ag/AgCl. The space-charge capacitance (CSC) was extracted from impedance measurements at high frequency (fixed at 1.0 kHz). The plots of 1/C2 as a function of applied potential (Figure 12) display the expected linear regions at more positive potentials, characteristic of n-type semiconductors such as TiO2 and WOx in partially oxidized states [68].
The Mott–Schottky equation for n-type semiconductors is expressed as:
1 C s c 2 = 2 ε ε 0 e . N d , a p p V V F B k B T e
where CSC is the space-charge capacitance, ε is the relative permittivity of the material, ε0 is the vacuum permittivity, e is the elementary charge, V is the applied potential, VFB is the flat-band potential, kB is the Boltzmann constant, and T is the absolute temperature [69]. From the slope of the linear regions, carrier densities (Nd,app) were determined, while the intercept with the potential axis yielded the VFB values.
It is important to note that in multilayer systems such as TiO2/WOx, the measured capacitance may include contributions from surface states and series junctions. Therefore, the extracted donor densities are more appropriately regarded as apparent (Nd,app) values. As highlighted in [70], “common-sense checks” must be applied, including verification of slope sign (n-type behavior), consistency of VFB with photocurrent onset, and correlation of Nd,app trends with impedance results. In this work, these checks were fulfilled, supporting the qualitative validity of the MS analysis while acknowledging its limitations for absolute quantification.
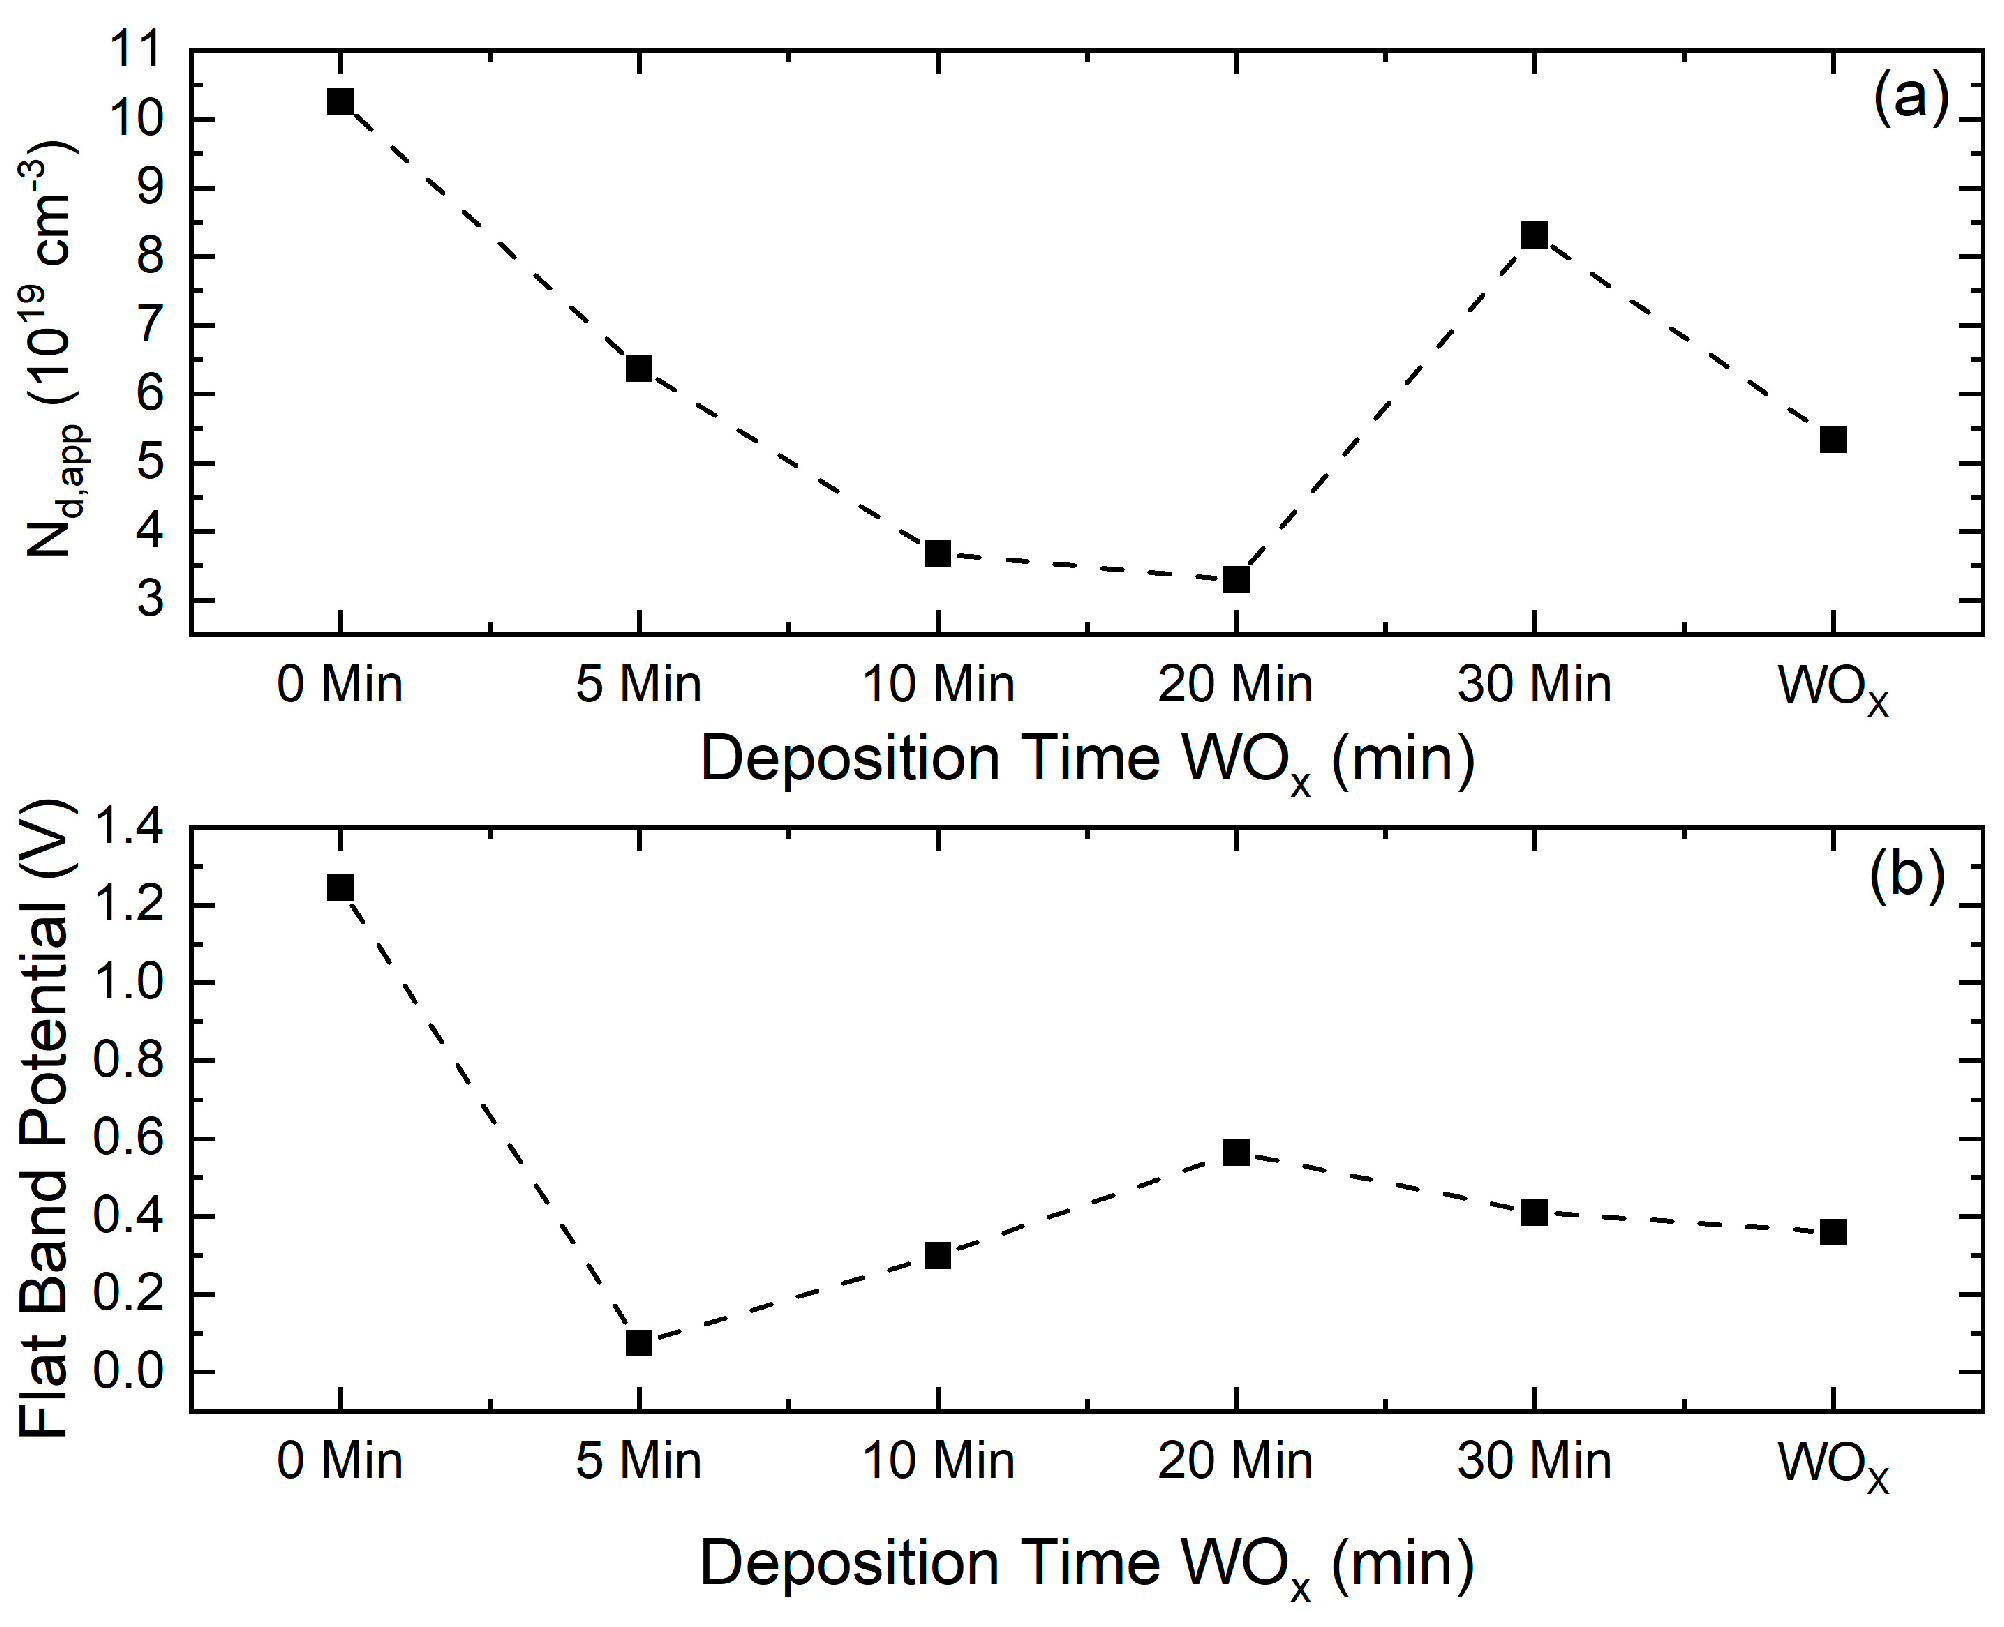
Table 4 summarizes the extracted electronic parameters. The pure TiO2 sample (0 min) presented the highest flat-band potential (VFB = 1.24 ± 0.02 V) and apparent donor density (Nd,app = 1.026 ± 0.007 × 1020 cm−3), indicative of a high concentration of intrinsic defects, particularly oxygen vacancies, which are commonly observed in sputtered TiO2 films [71].
The reported values correspond to apparent donor densities (Nd,app), since multilayer heterostructures may exhibit series capacitance contributions (space-charge + Helmholtz + interface). These values should therefore be interpreted as relative comparisons rather than absolute quantifications [70].
The decrease in flat-band potential observed in Figure 13 can be associated with the accumulation of positive charges at the interface, promoted by surface states and charge transfer across layers with different band gaps [72]. The introduction of WOx led to significant modifications in the electronic behavior of the samples. The sample with 5 min of WOx deposition showed the lowest VFB value (0.074 ± 0.009 V), suggesting a strong downward shift in the Fermi level and the possible formation of a potential well favorable for charge separation at the heterojunction interface [1]. However, this sample exhibited a considerably lower apparent donor density (6.37 ± 0.03 × 1019 cm−3) compared to pristine TiO2.
The samples with 10 and 20 min of WOx deposition displayed the lowest carrier densities (3.68 ± 0.03 × 1019 cm−3 and 3.30 ± 0.04 × 1019 cm−3, respectively), which may reflect a reduced density of electronic states available for conduction. This behavior could be related to a more ordered structure with fewer defects. By contrast, the sample with 30 min of WOx deposition exhibited a promising balance, with an intermediate VFB (0.41 ± 0.02 V) and a relatively high apparent donor density (8.32 ± 0.09 × 1019 cm−3). This combination suggests favorable band alignment together with good electrical conductivity, which supports both charge separation and transport. Such characteristics highlight the potential of this sample for applications in PEC water splitting [57] and in hybrid supercapacitors with enhanced performance [65].
The recurrence of higher apparent donor density (Nd,app) in the 30 min sample can be explained by a larger population of shallow donor states associated with oxygen vacancies and W5+ centers, which are well known to enhance n-type conductivity in substoichiometric WO3−x [71,73]. In addition, thermal annealing promotes more efficient percolation of conductive pathways and microstructural coarsening. The moderate crystallite growth observed by XRD suggests a reduced density of grain boundaries, which lowers carrier scattering and consequently decreases resistivity, an effect already reported for polycrystalline WO3 thin films [74] and in other conducting oxides [75]. Consistently, electrochemical impedance spectroscopy (EIS) fittings show a decrease in the charge-transfer resistance (Rp), in line with the standard interpretation of the high-frequency semicircle in Nyquist plots [76]. Taken together, these results support the qualitative validity of the apparent donor density (Nd,app) values extracted from Mott–Schottky analysis, provided that the usual methodological caveats such as frequency dependence, surface state contributions, and multilayer capacitance effects are considered [56].

3.10. Semiconductor Properties from Electrochemical Impedance Spectroscopy

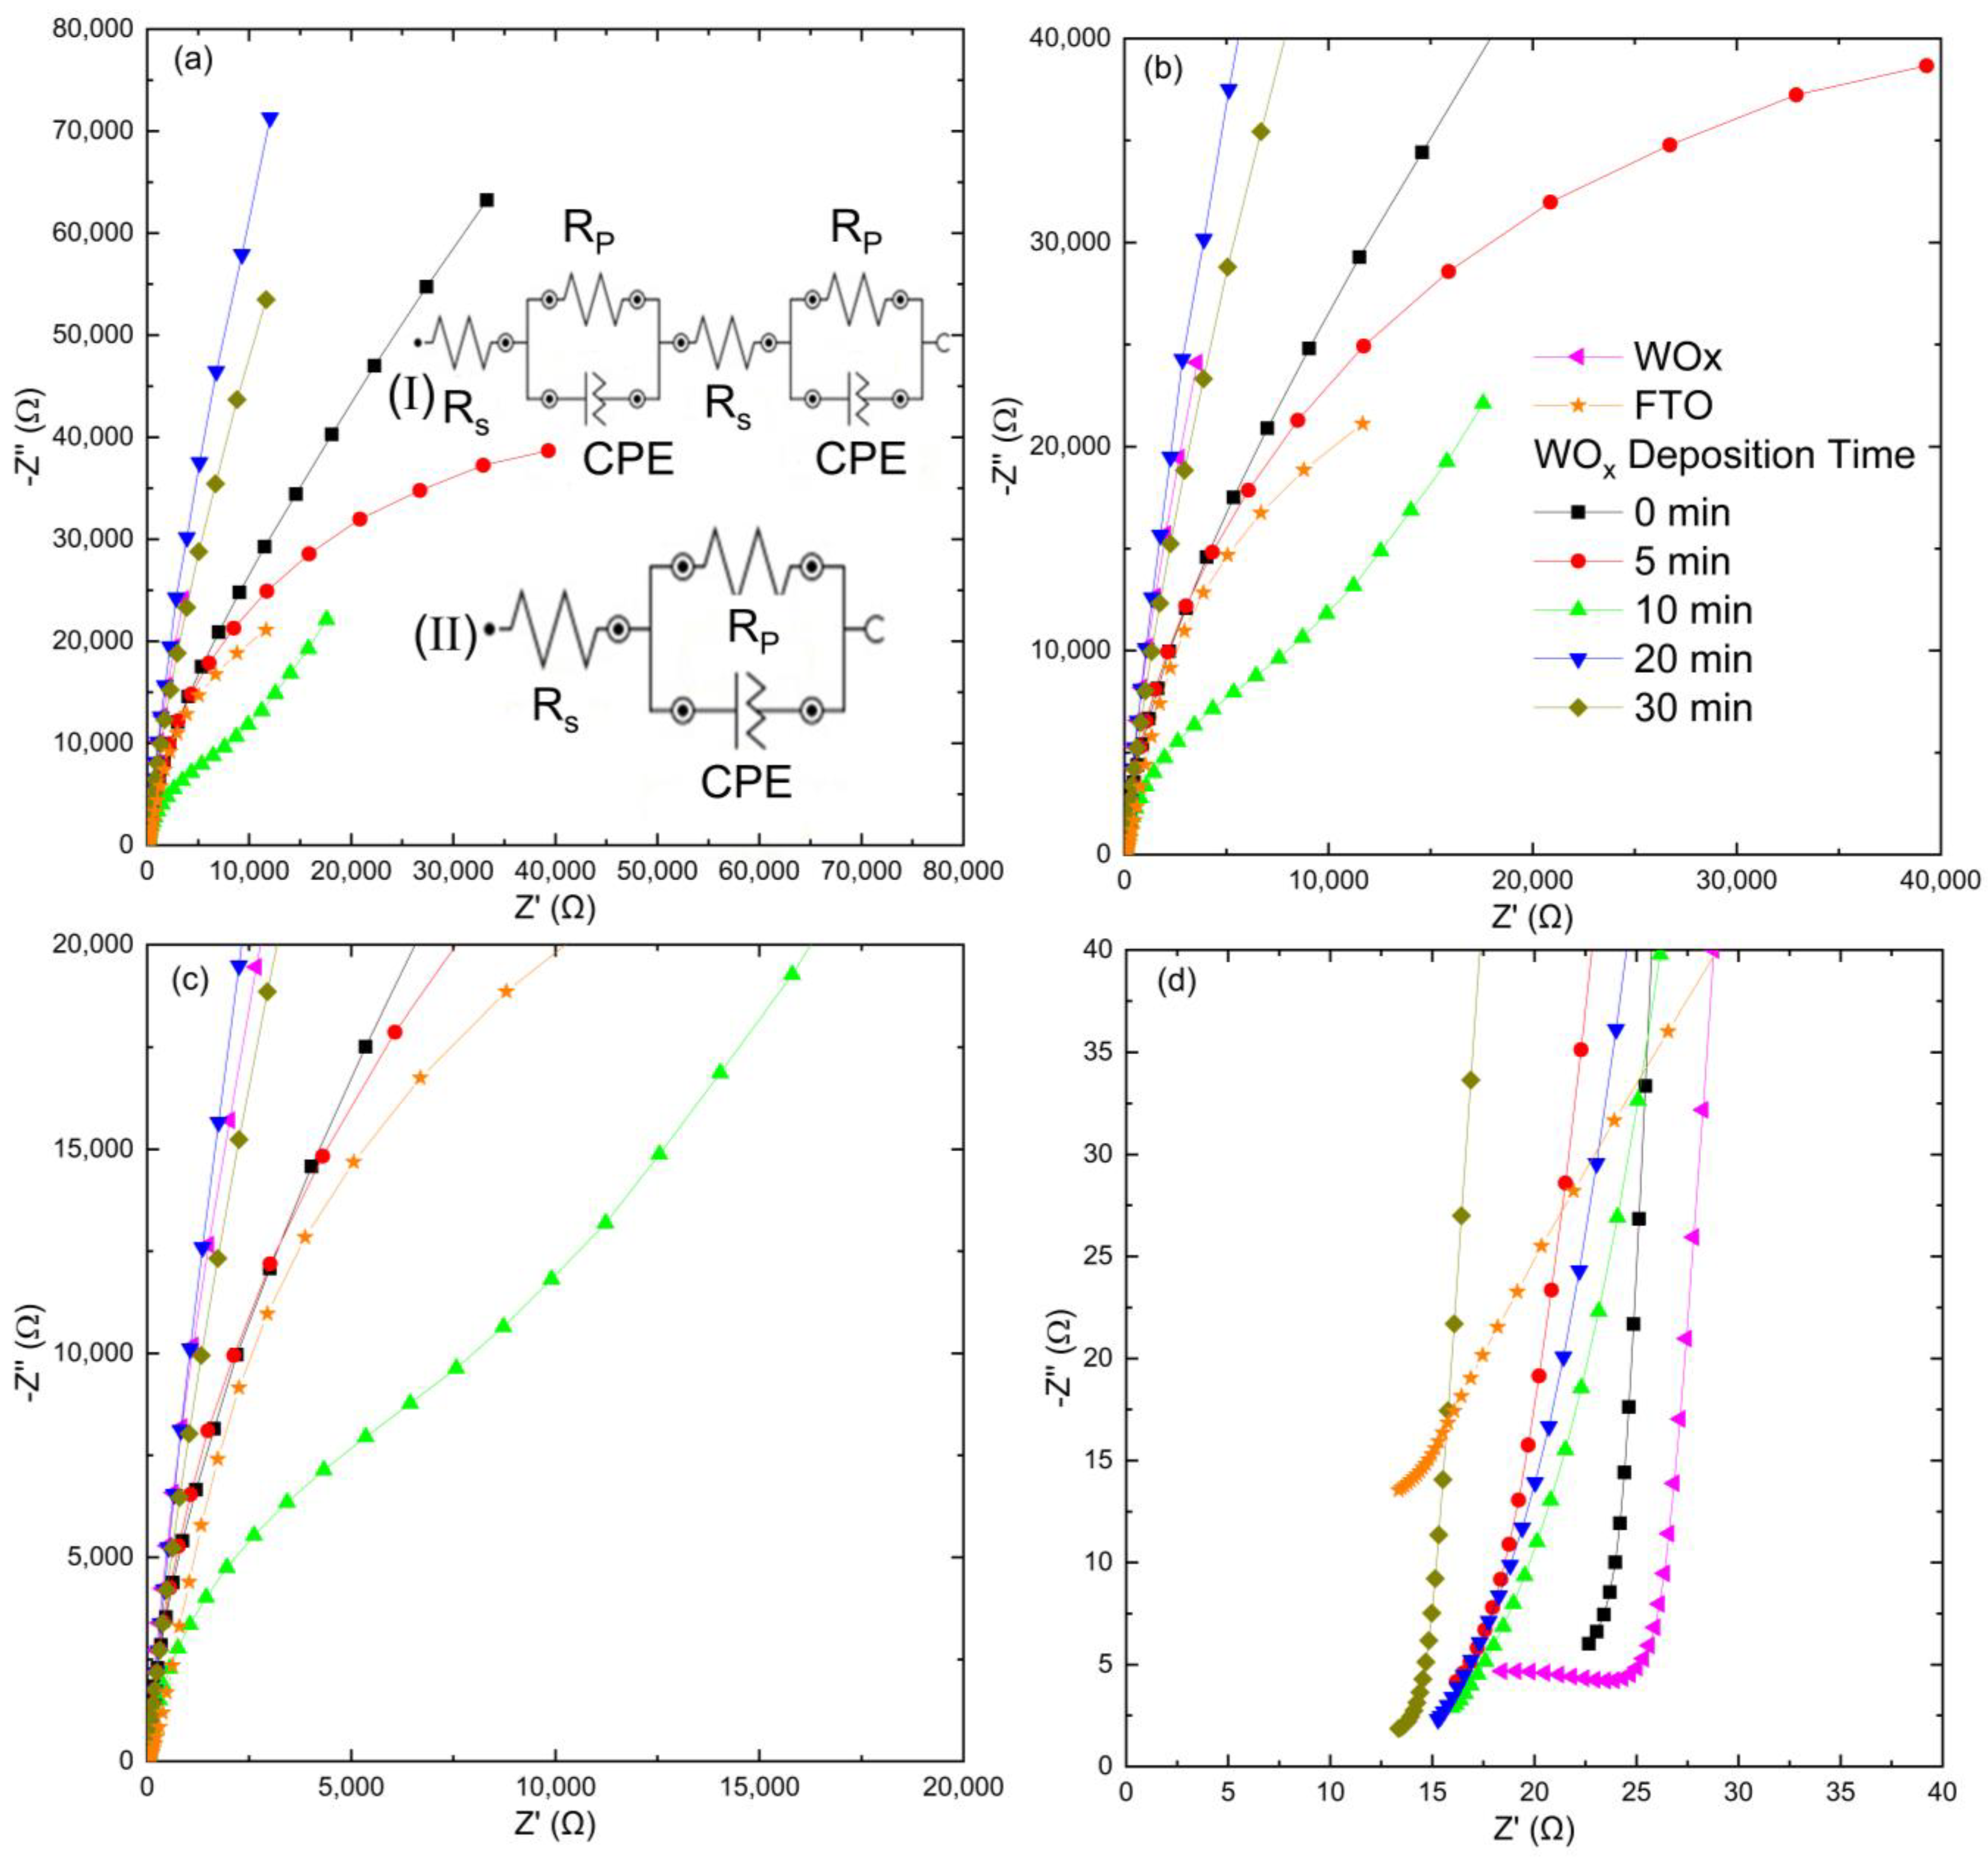
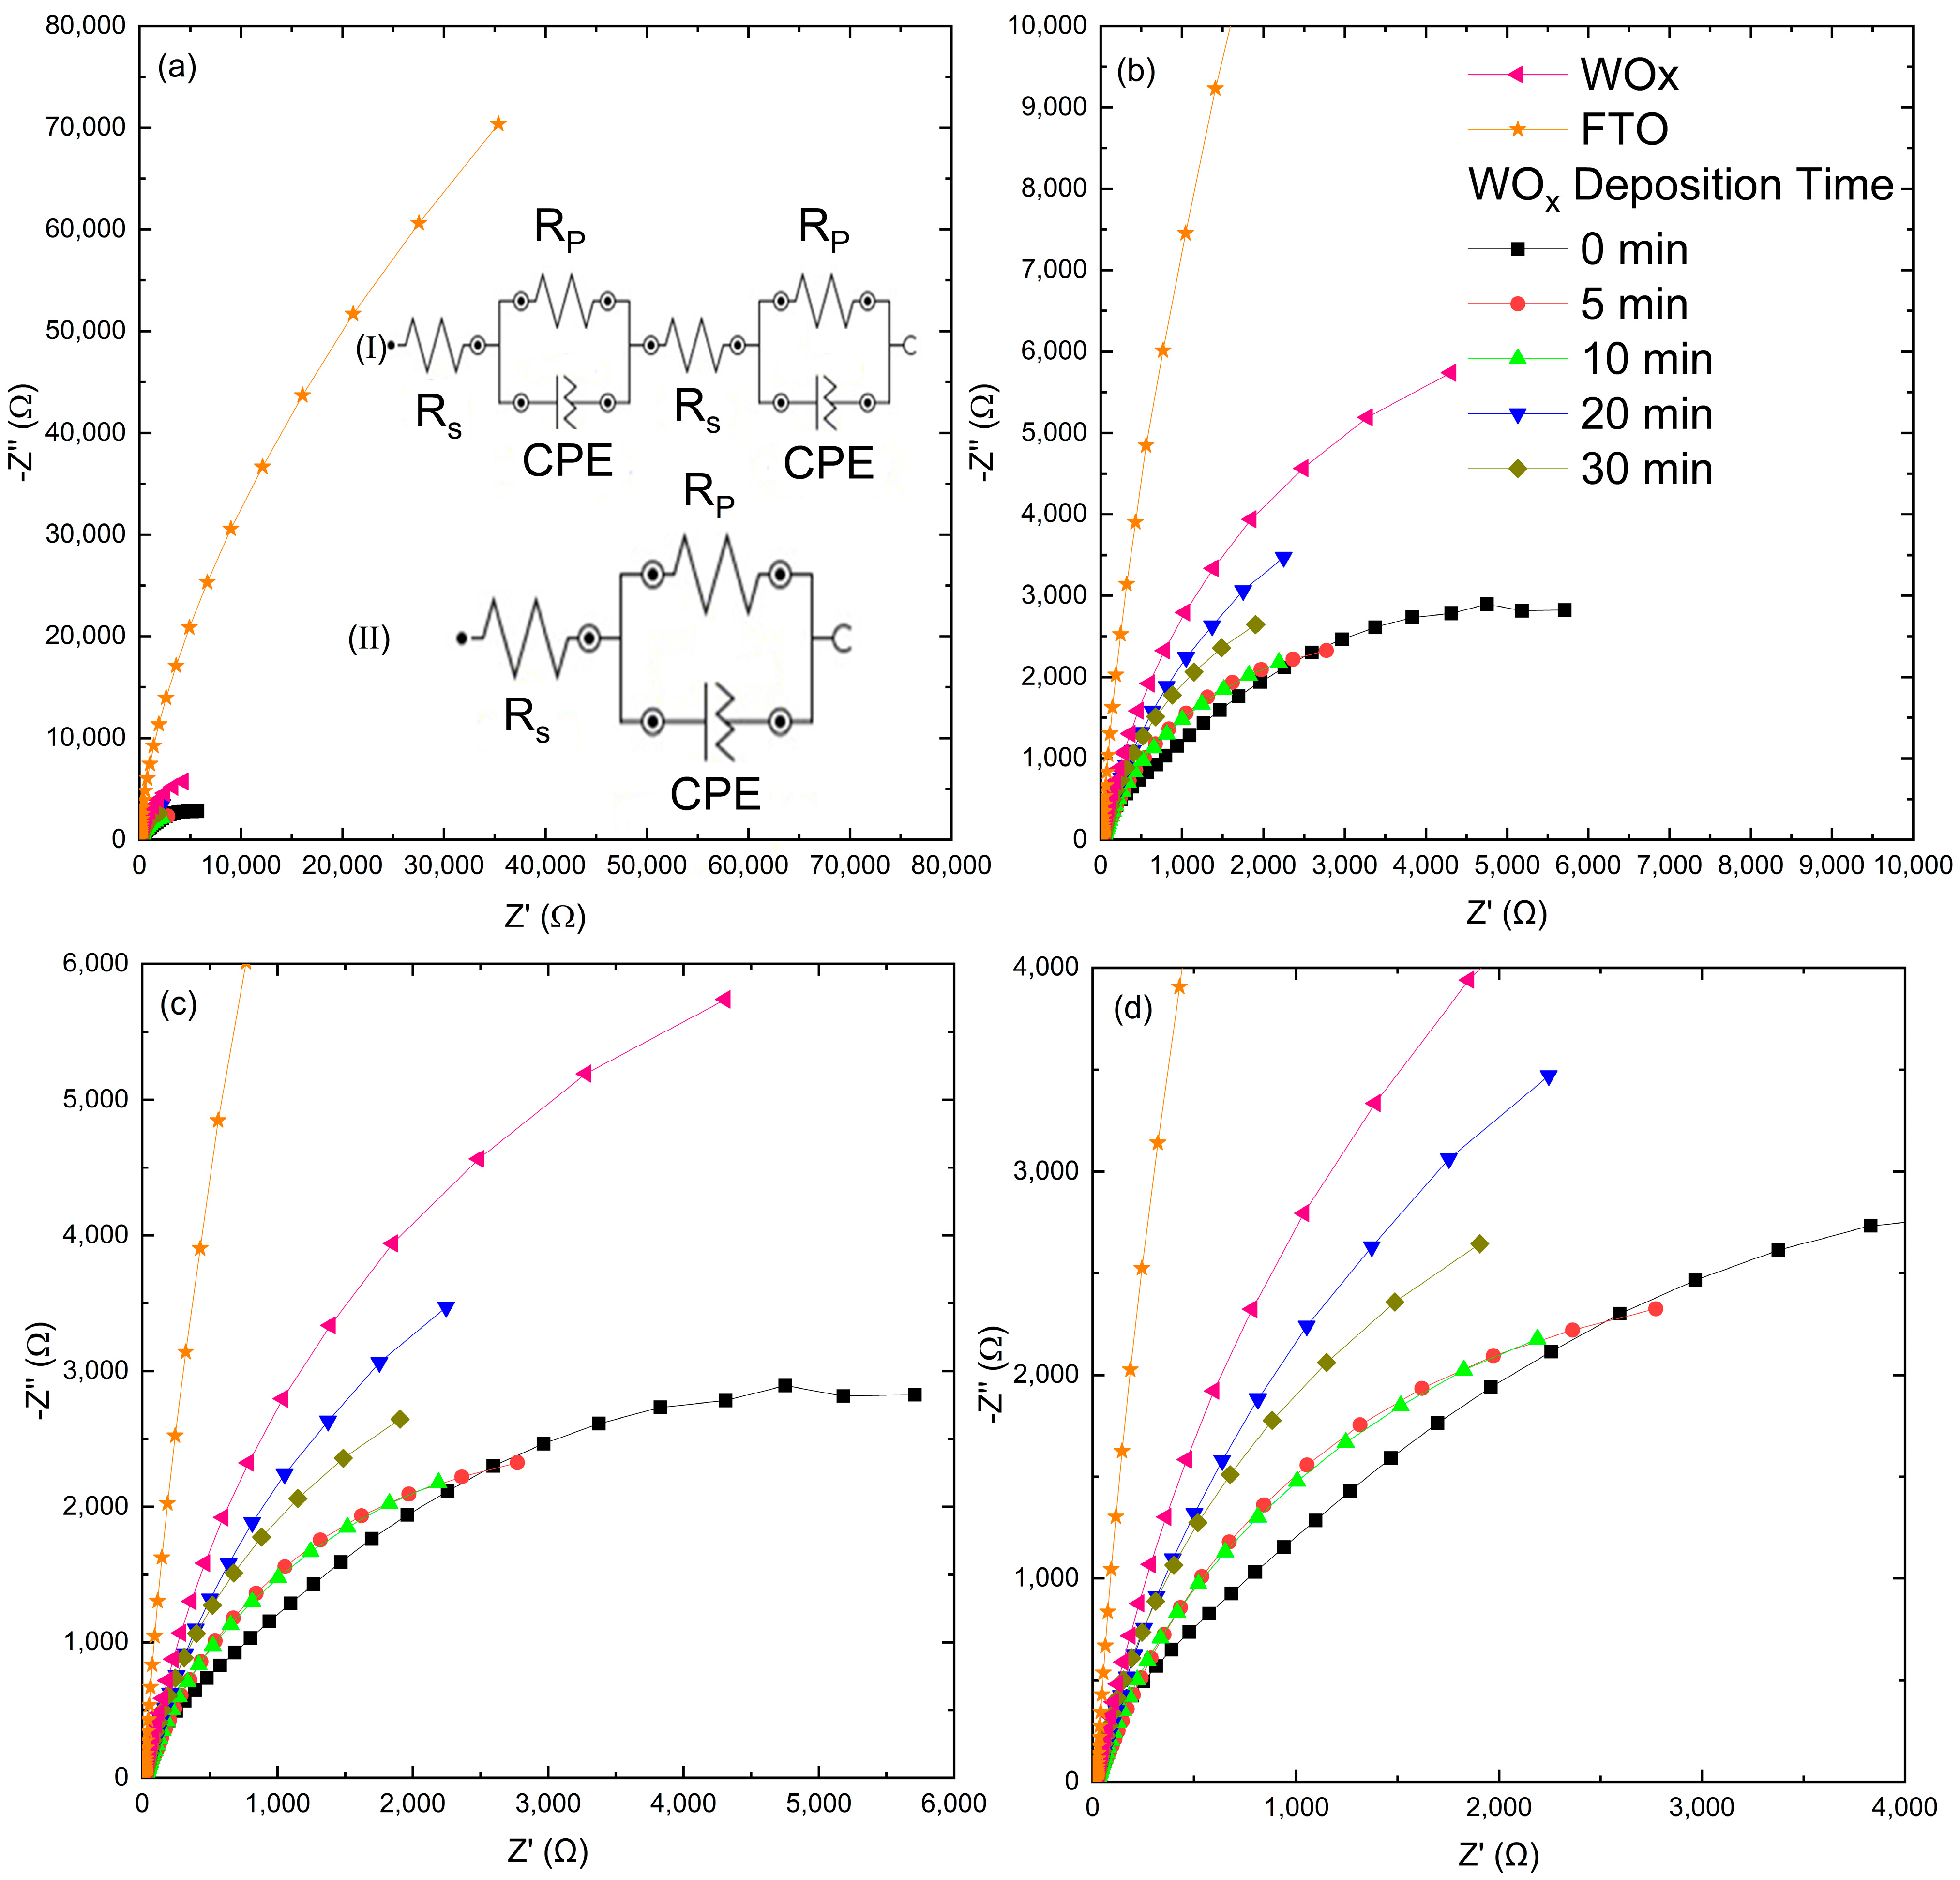
Impedance spectra were recorded in 0.5 mol L−1 Na2SO4 at open-circuit potential (OCP) over the frequency range of 0.1–100 kHz. Measurements were performed both in the dark and under solar-simulator illumination to evaluate the influence of light on the electrochemical response of TiO2/WOx films and their heterostructures. The resulting Nyquist plots are presented in Figure 13 and Figure 14, corresponding to dark and illuminated conditions, respectively. The spectra display in [71,73] complete or inclined semicircles, which are characteristic of pseudocapacitive behavior and dispersive processes typically associated with nanostructured films and rough interfaces [35], and contributions from pseudo-double-layer capacitance [54].
In the dark (Figure 14), samples with thicker WOx layers (20 and 30 min) exhibit smaller semicircle diameters, corresponding to reduced charge transfer resistance (Rₚ). This behavior suggests improved conductivity and facilitates redox processes, likely due to the higher density of active states and better connectivity between conductive domains [45].
Under illumination (Figure 15), all films displayed a significant reduction in impedance compared to the dark conditions. This effect is attributed to photon-induced generation of electron–hole pairs, which increases apparent donor density and enhances charge transfer at the semiconductor/electrolyte interface [47]. Among the tested films, TiO2/WOx heterostructures with longer WOx deposition times, particularly 30 min, showed the lowest impedance values, in agreement with the superior photoelectrochemical response observed in cyclic voltammetry (CV).
The equivalent circuit model employed consisted of a solution resistance (Rₛ), a charge-transfer resistance (Rₚ), and a constant phase element (CPE). The use of CPEs instead of ideal capacitors accounts for the heterogeneous distribution of relaxation times and the rough surface of the films [36,70]. The consistent trend of reduced Rₚ under illumination highlights the relevance of WOx thickness and heterostructure engineering for optimizing photoelectrode performance.
Analysis of the spectra revealed distinct electrochemical responses depending on the film composition and measurement condition. In the dark, only the WOx film exhibited two semicircles (circuit I in Figure 13a inset). Under illumination, two semicircles were observed for WOx, TiO2, and the TiO2/WOx heterostructure with 10 min WOx deposition, whereas the other samples were represented by a single semicircle (circuit II). The high-frequency semicircle corresponds to rapid interfacial charge-transfer processes, while the low-frequency semicircle is associated with slower phenomena such as intermediate charge storage or transport within the films [77].
To further support these observations, the quantitative parameters obtained from circuit fitting are presented in Table 5 and Table 6. These results confirm the trends identified in the Nyquist plots: under dark conditions, all TiO2/WOx bilayers exhibited a single relaxation process with Rp values dependent on WOx thickness, whereas the pure WOx film required two time constants, consistent with its more complex charge dynamics [54,77]. Under illumination, a pronounced decrease in Rp and an increase in Y0 were observed for all samples, particularly for the 10 min bilayer, which displayed an extremely low Rp, and the need for a second RC branch in the fitting. These findings quantitatively reinforce the enhanced charge-transfer efficiency induced by photoexcitation [46,78].
The appearance of two semicircles under illumination indicates activation of an additional photoinduced mechanism, involving the generation, separation, and migration of charge carriers. This effect was particularly evident for pure TiO2 and the heterostructure with 10 min of WOx deposition, suggesting that intermediate thicknesses enhance interfacial charge dynamics [57]. The combined results confirm that experimental conditions (illumination or dark), material composition, and WOx thickness critically influence charge-transfer kinetics and interfacial mechanisms.
The electrochemical results consistently demonstrated that TiO2/WOx heterostructures outperform individual TiO2 and WOx films, establishing them as promising photoanodes for photoelectrochemical (PEC) water splitting [45,57]. Cyclic voltammetry revealed a significant increase in current density, specific energy, and specific power for samples with longer WOx deposition times, particularly under illumination. This improvement is attributed to the higher density of redox-active states and more efficient charge separation and transport, consistent with pseudocapacitive contributions [65,78].
Mott–Schottky (MS) analysis showed marked changes in flat-band potential (VFB) and majority apparent donor density (Nd,app), with the 30 min WOx sample exhibiting favorable band alignment and higher apparent donor density. These characteristics indicate optimal conditions for photoinduced charge separation and electronic transport [45,47]. Complementarily, EIS results corroborated the reduction in charge-transfer resistance in heterostructures under illumination, underscoring the role of band alignment and film architecture in improving photoelectrochemical response. The activation of multiple processes, as evidenced by two semicircles in some Nyquist plots, reinforces the contribution of photoinduced carriers to charge-transfer dynamics [46].
The findings demonstrate that the synergistic combination of TiO2 and WOx, together with controlled deposition time, substantially enhances the electronic and photoelectrochemical properties of the films. This strategy proves highly effective for designing advanced electrodes for hydrogen generation through PEC water splitting, supporting the development of sustainable solar-to-fuel technologies [45,78].

3.11. Quantification of the Interfacial Capacitive Contribution and Photoelectrochemical Implications

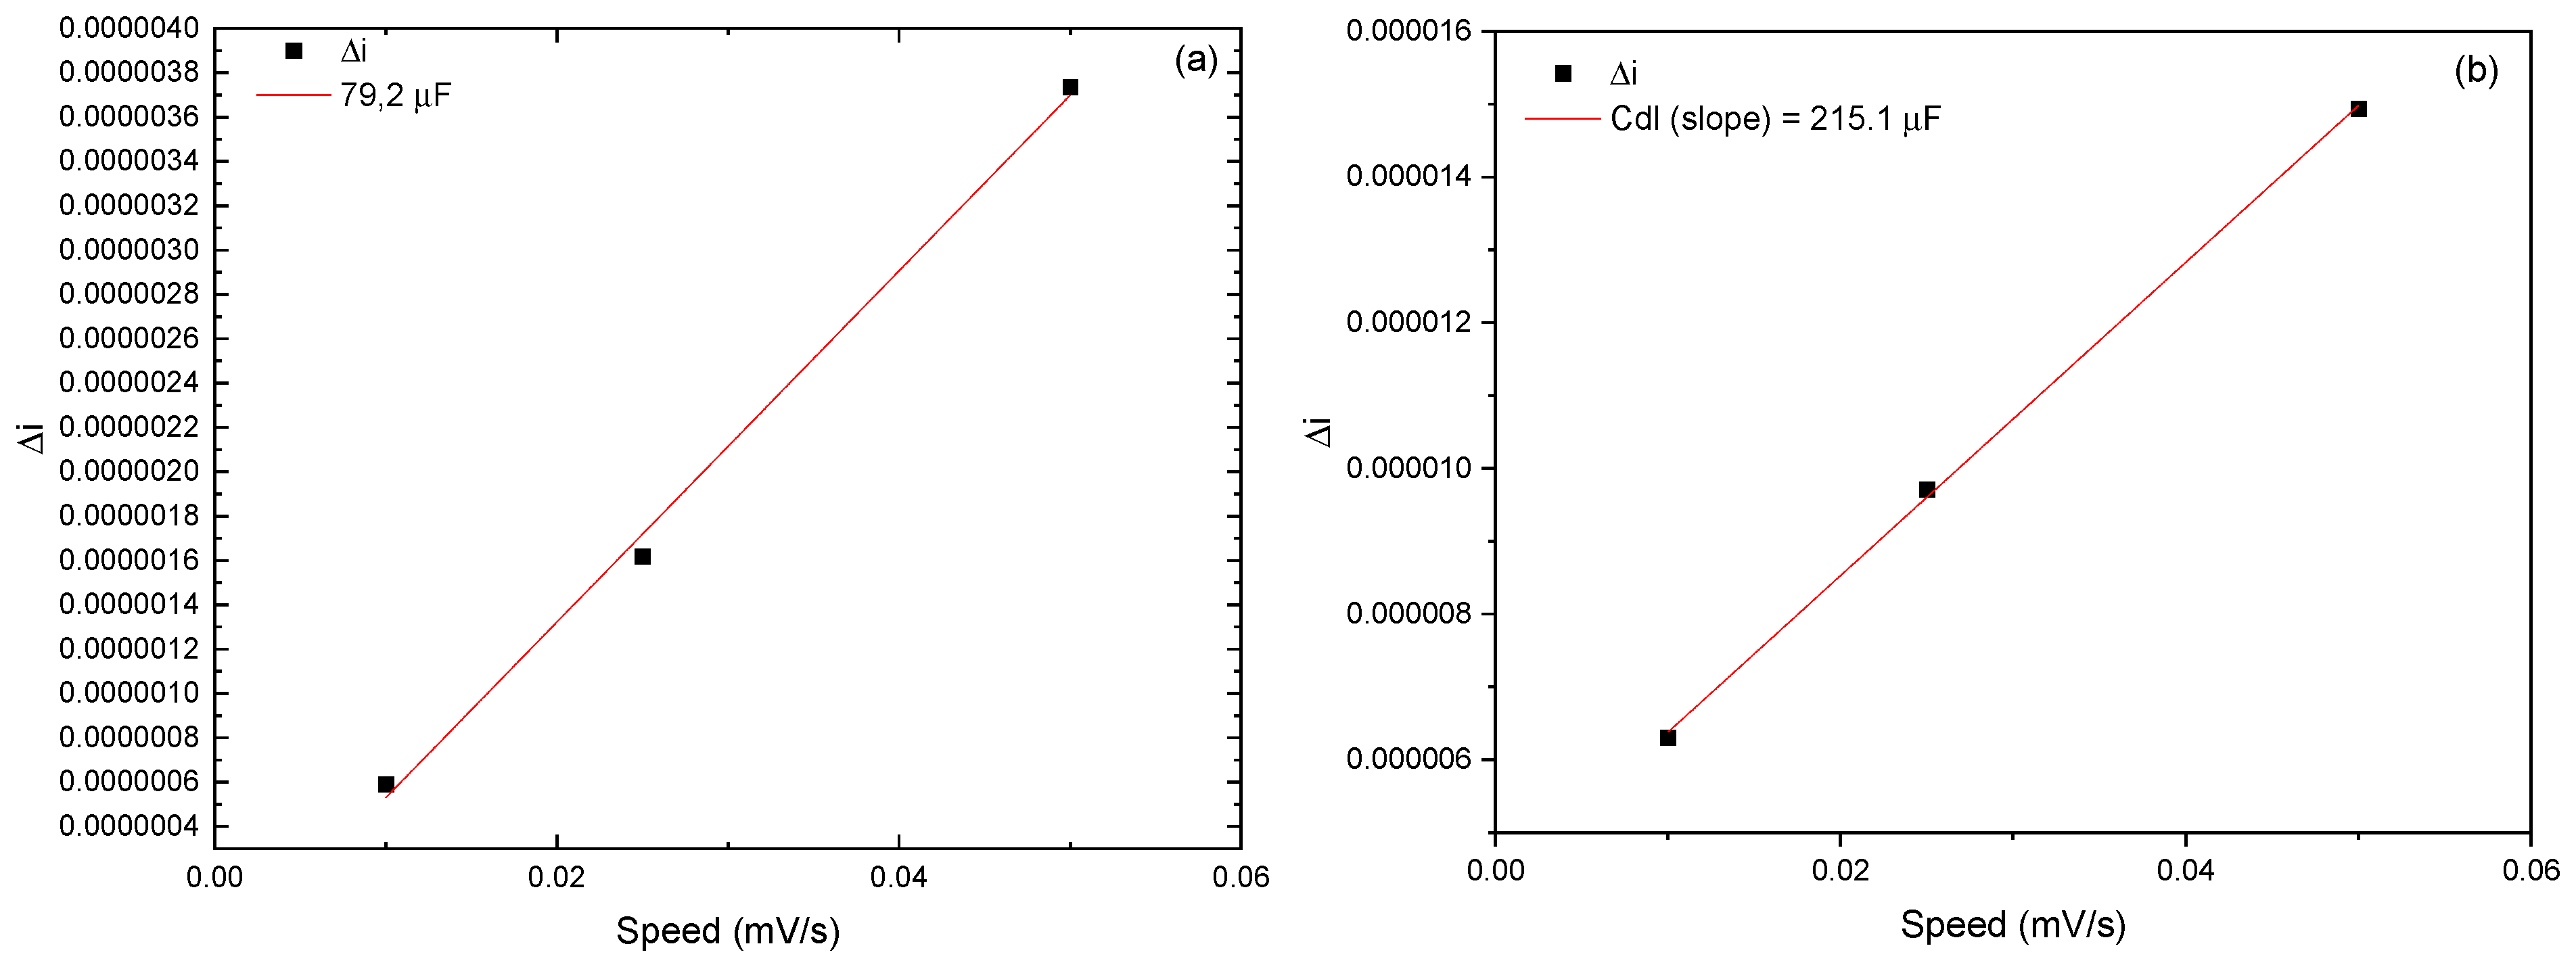
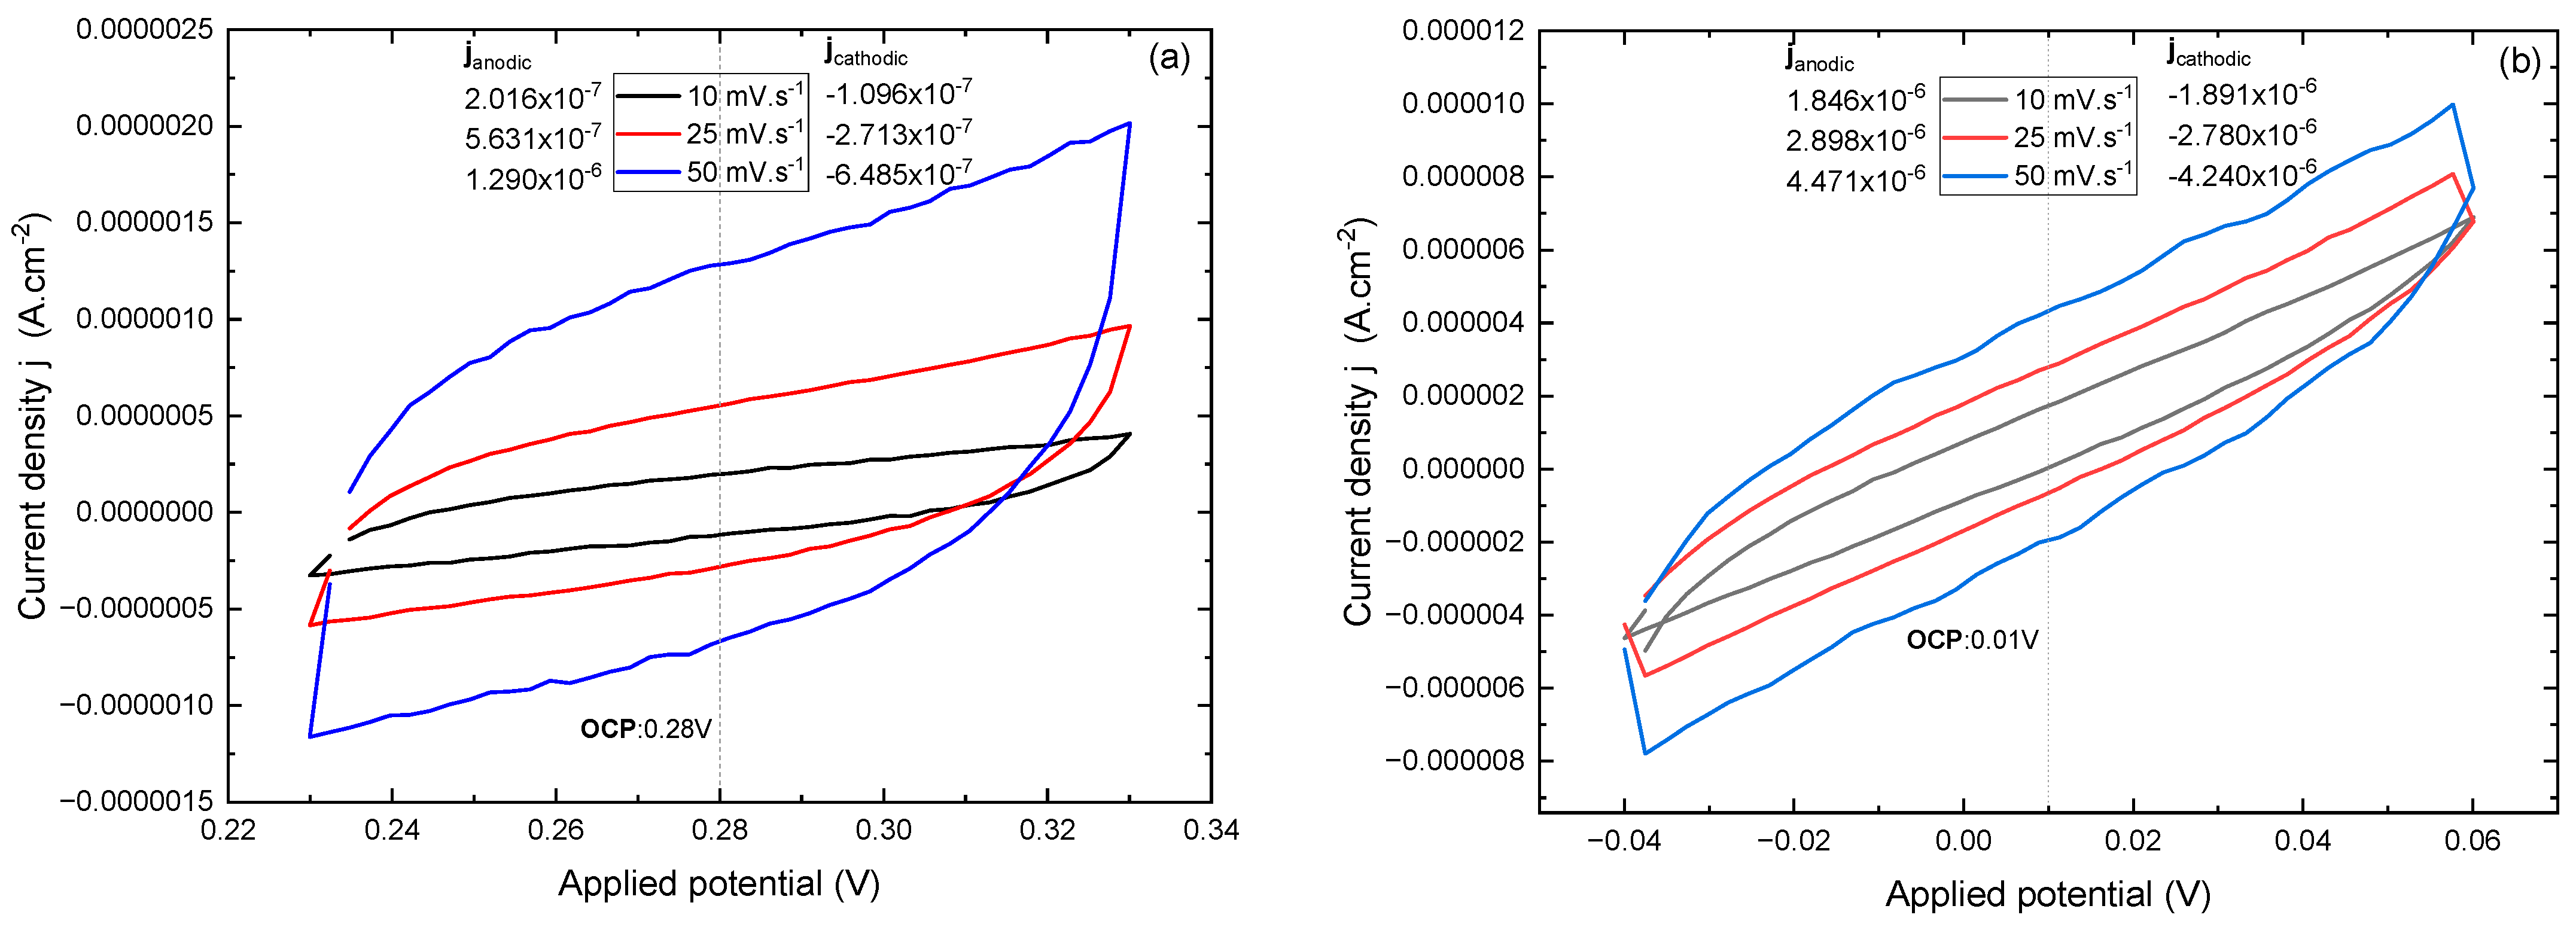
The quantification of the capacitive contribution of the electrode/electrolyte interface is an essential parameter to distinguish purely geometric effects from intrinsic electronic gains in semiconductor materials. In this context, the double-layer capacitance ( C d l ) was determined by cyclic voltammetry in the non-faradaic region (±50 mV around the open-circuit potential, OCP), avoiding overlap with faradaic processes performed at scan rates of 10, 25, and 50 mV·s−1. Under these conditions, the capacitive current ( i c ) exhibits a first-order linear relationship with the scan rate (ʋ) [79], as expressed in Equation (5) and experimentally confirmed in Figure 1 for the 30 min sample measured under dark and illuminated conditions:
i = C d l · ʋ
i = 2 · C d l · ʋ
The origin of the factor 2 arises from the definition of the capacitive current as i =   C d l   · ʋ . During the anodic scan, this current assumes positive values, and during the cathodic scan, negative values. When calculating the difference between anodic (ia) and cathodic (ic) currents at the same potential, the following expression is obtained, which also corresponds to the slope of the linear plots in Figure 16:
i   = i a i c = C d l   · ʋ C d l   · ʋ =   2 · C d l   · ʋ
where i c and i a denote the measured current (A), C d l is the double-layer capacitance (F), and ʋ is the scan rate (V·s−1). The linearization was performed by fitting the experimental i versus ʋ data using linear regression, and the slope directly yields C d l according to Equation (5) (see also Equation (6)). This procedure allows evaluating interfacial capacitance without interference from faradaic currents. This procedure allows evaluating the interfacial capacitance without interference from faradaic currents, as exemplified in the cyclic voltammograms in Figure 17.
The electrochemically active surface area (ECSA) was estimated using literature values of the specific capacitance (Cs = 25, 40, 45 µF cm−2) for ideally smooth oxide surfaces [80,81,82] under well-defined electrolytic and potential conditions, since Cs quantifies the capacitive charge stored per unit geometric area when the oxide/electrolyte interface is polarized within a potential window where only the double layer and at most a marginal pseudocapacitive contribution are involved. Varying Cs across these three values yields a range for ECSA that operates as a confidence interval for the accessible surface area. And the results for the 0- and 30 min samples under dark and illuminated conditions are summarized in Table 7.
Without illumination, the initial sample (0 min) exhibits an extremely low C d l (S2), reflecting a negligible ECSA (<0.002 cm2) and an essentially null roughness factor. After 30 min of deposition, C d l   increases by three orders of magnitude, yielding an ECSA of up to 3.17 cm2, consistent with the formation of a rougher, more porous surface [83]. Under illumination, these effects become even more pronounced. The 0 min sample shows C d l = 70.5 µF, whereas the 30 min sample reaches 215.1 µF, approximately three times higher; this translates into an ECSA of 8.60 cm2, indicating not only a geometric gain but also an electronic contribution arising from the TiO2/WOx heterostructure. The C d l , l i g t h / C d l , d a r k ratio for the 30 min sample (~2.72×) evidences a strong photocapacitive effect. This behavior is consistent with previous studies in different systems [84]. For TiO2/WO2, in addition to the increased surface roughness, additional electronic effects contribute to the observed performance. Oxygen vacancies act as shallow donors, increasing conductivity and narrowing the depletion region width [85], thereby favoring in excess; however, these defects generate deep states that act as recombination centers, thus impairing the photocurrent. Therefore, the analysis of C d l ,   ECSA, and Rf provides a quantitative understanding of both capacitive and structural contributions to the photoelectrochemical activity. The results demonstrate that the synergy between the TiO2/WOx structures yields combined gains in active area and electronic optimization, which are essential for photocatalytic applications.

3.12. Capacitive vs. Faradaic Decomposition by the Dunn Method

In voltammetry, the instantaneous current can be decomposed as [86]:
i V = k 1 v + k 2 v 1 / 2 ,
where k 1 v represents the contribution controlled by fast surface processes (capacitive/pseudocapacitive at high rate), and k 2 v 1 / 2   corresponds to diffusion-limited processes (classical faradaic). Operationally, a family of CVs curves is recorded at different scan rates; for each potential (V), i ( V ) / v 1 / 2 is plotted as a function of v 1 / 2 . A linear fit yields the intercept k 1 (capacitive component per unit scan rate) and the slope k 2 (faradaic component). By integrating i c a p V = k 1 v for i f a r V = k 2 v 1 / 2 over the potential range, the corresponding charges Q c a p and Q f a r per cycle are obtained. The average faradaic fraction is then expressed as f F =   Q f a r / ( Q c a p +   Q f a r ) , and the relative contributions of capacitive and faradaic processes were quantified for different scan rates (Figure 18).
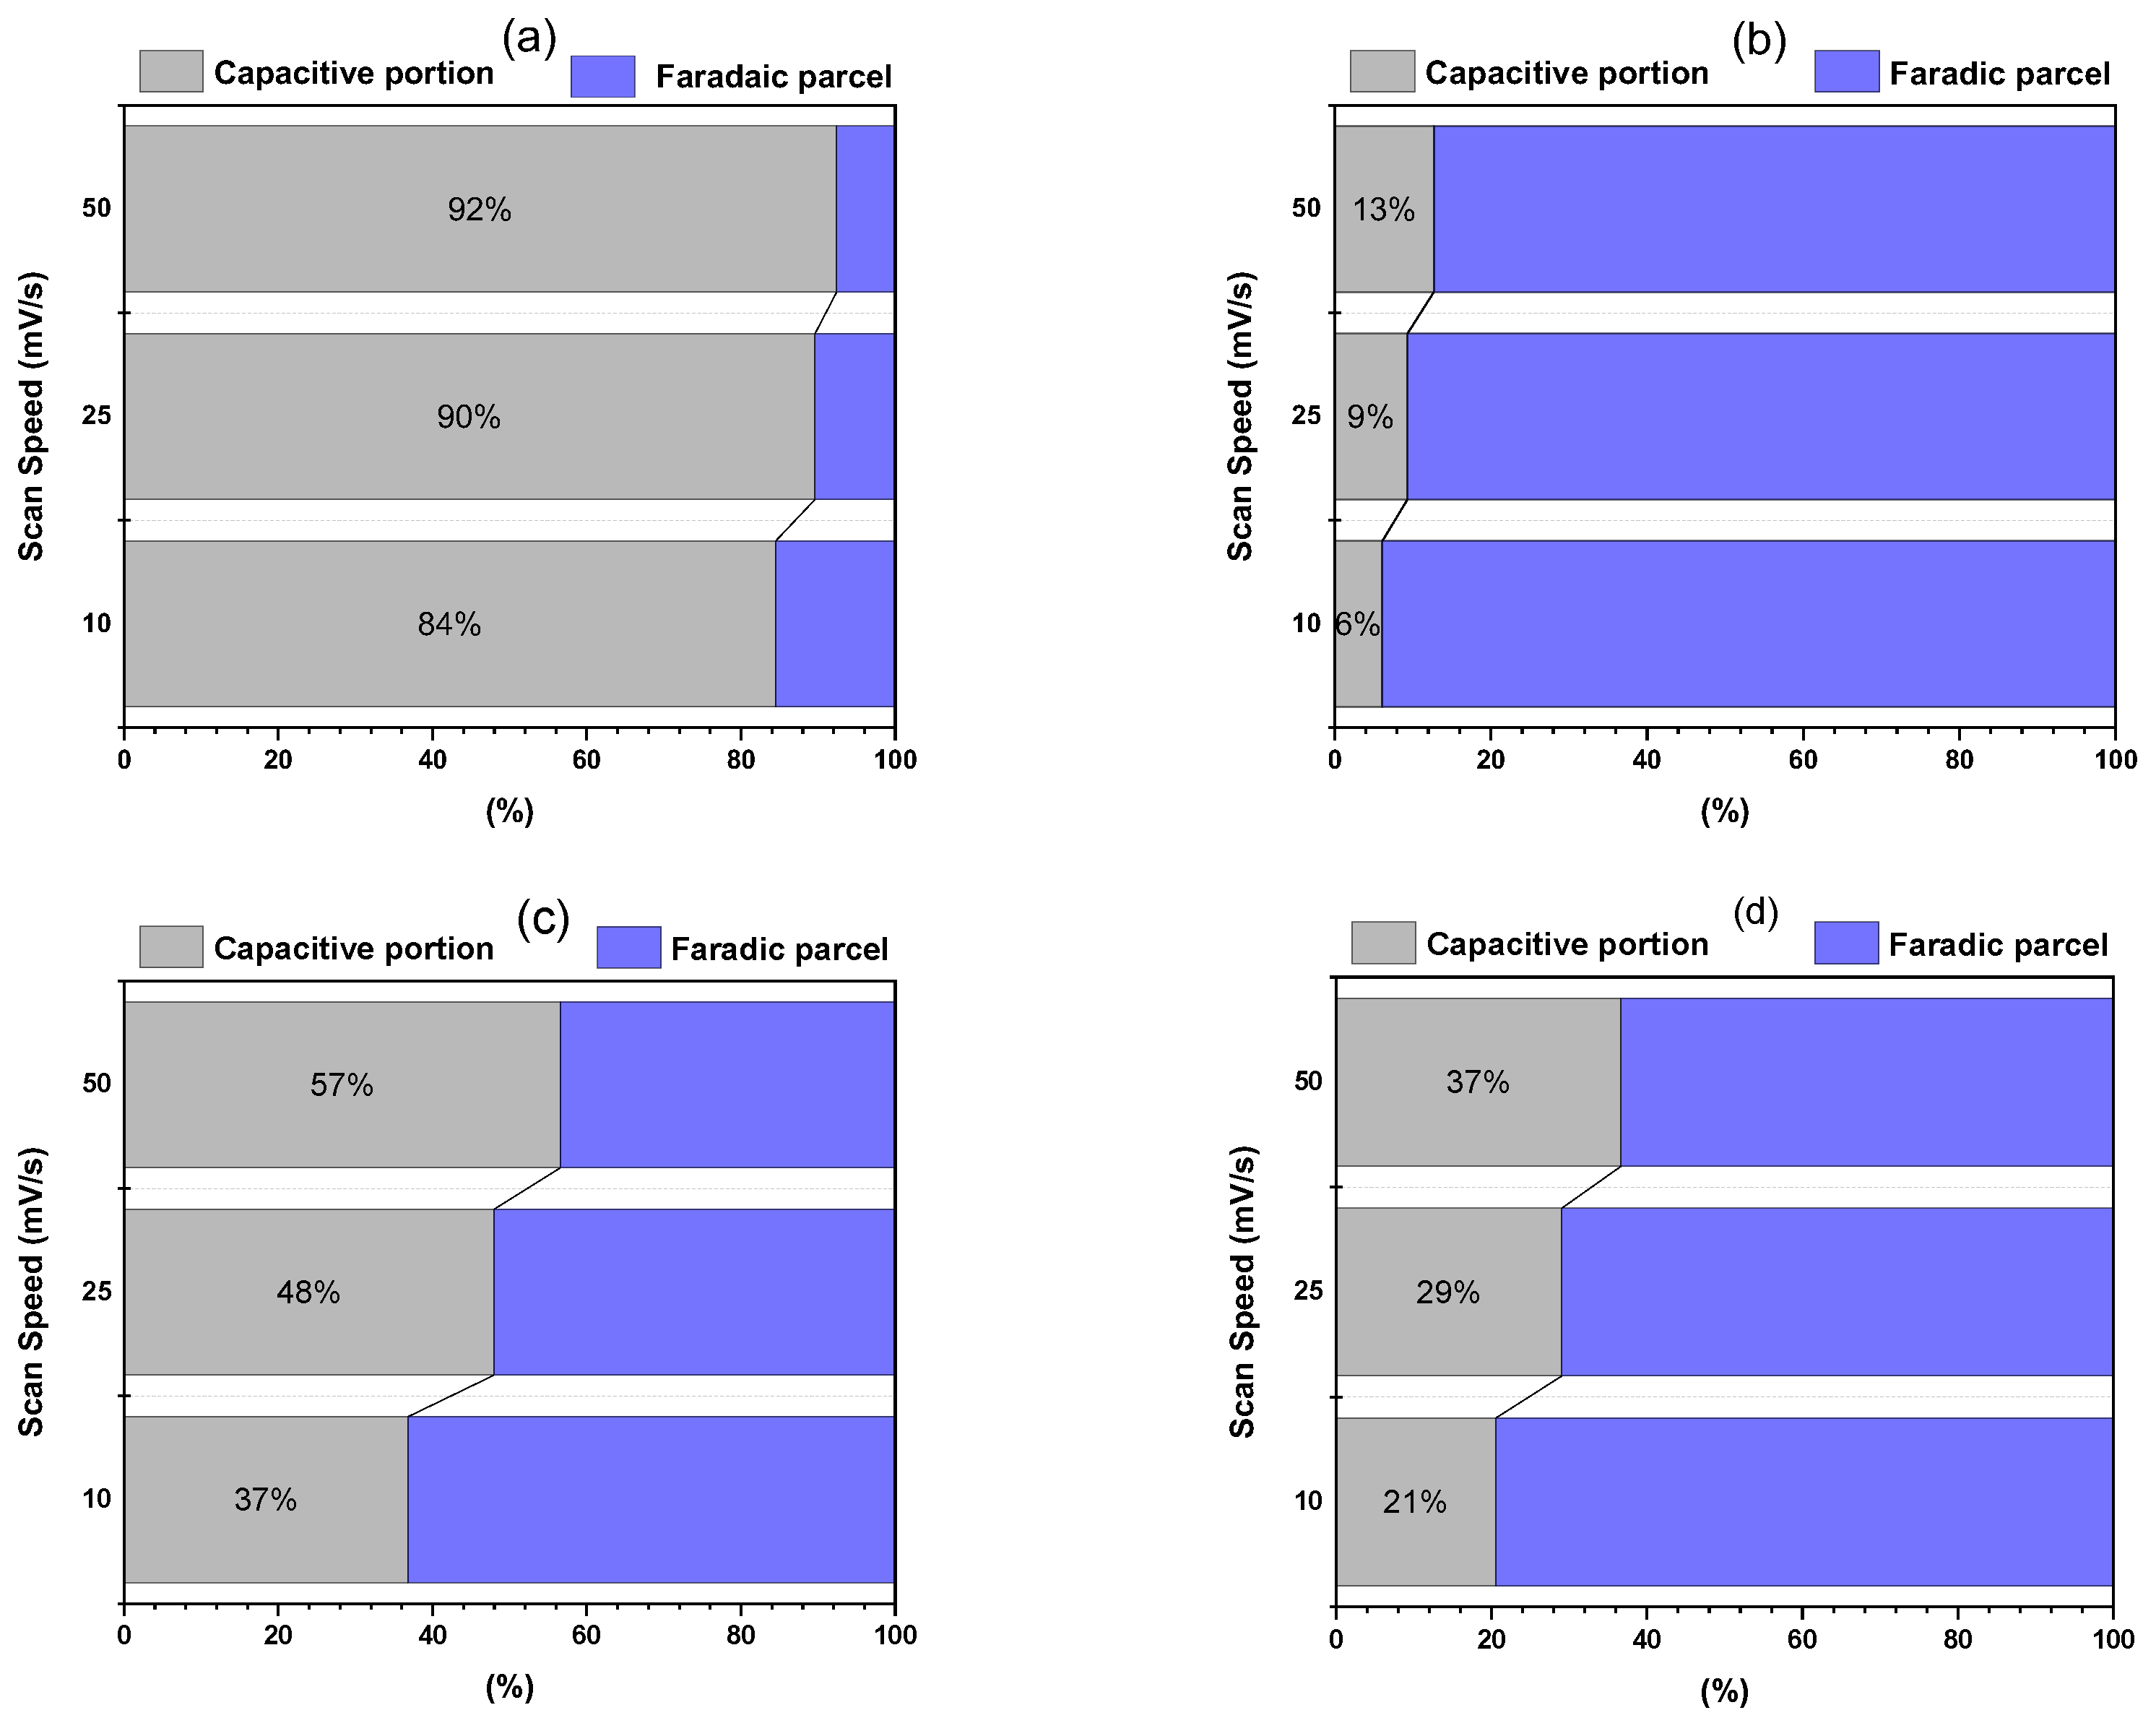
The TiO2/FTO electrode (0 min) exhibits, in the absence of light, a predominantly capacitive behavior (≈84–95%), with only a residual faradaic contribution. Under illumination, however, the relative balance is inverted, and the faradaic fraction becomes dominant [87], while maintaining the canonical trend of the Dunn method, in which the relative contribution of the capacitive component increases with the scan rate (ν). It is important to emphasize that such changes are expressed in percentage terms and, therefore, do not directly translate into the absolute current gain. As demonstrated by the ECSA extracted from Cdl (Table 7), this sample exhibits a much smaller active area compared to the heterostructure, which limits the effective performance even when the faradaic fraction increases under illumination.
For the TiO2/WOx heterostructure (30 min), the decomposition diagrams show faradaic dominance across the entire scan rate range (ν, 10–50 mV·s−1), both in the dark and under illumination. In the dark, the capacitive fractions evolve from 23% → 32% → 40% with increasing scan rates, while under illumination they increase from 21% → 29% → 37%. Correspondingly, the faradaic fractions decrease from 77% → 68% → 60% (dark) to 79% → 71% → 63% (light). This evolution with ν is consistent with the Dunn model: the capacitive term scales linearly with ν (fast surface processes), while the faradaic term is diffusion-limited and scales with ν 1/2; therefore, increasing ν enhances the capacitive contribution and reduces the faradaic fraction. Furthermore, illumination systematically shifts the balance toward the faradaic component without altering the fundamental physics of the double layer: the capacitive contribution maintains its linear dependence on ν, though with slightly reduced values. From a mechanistic standpoint, the photoexcitation of TiO2 (generation of e/h+ pairs) and the electronic coupling with WOx states increase the availability of carriers for redox steps and reduce interfacial recombination, thereby enhancing the faradaic fraction, particularly at slower scan rates, where diffusion processes have more time to manifest.
Thus, the combined analysis of Dunn percentages and absolute parameters (ECSA from Cdl) is essential, since although TiO2/WOx (0 min) exhibits a more pronounced variation in the faradaic fraction under illumination, its ability to convert this balance into useful current is limited by its much smaller ECSA. In contrast, TiO2/WOx (30 min) combines a high faradaic fraction with a substantially larger ECSA, resulting in a more favorable overall performance.

3.13. Stability Monitoring of TiO2/WOx by EIS Before and After Chronoamperometry

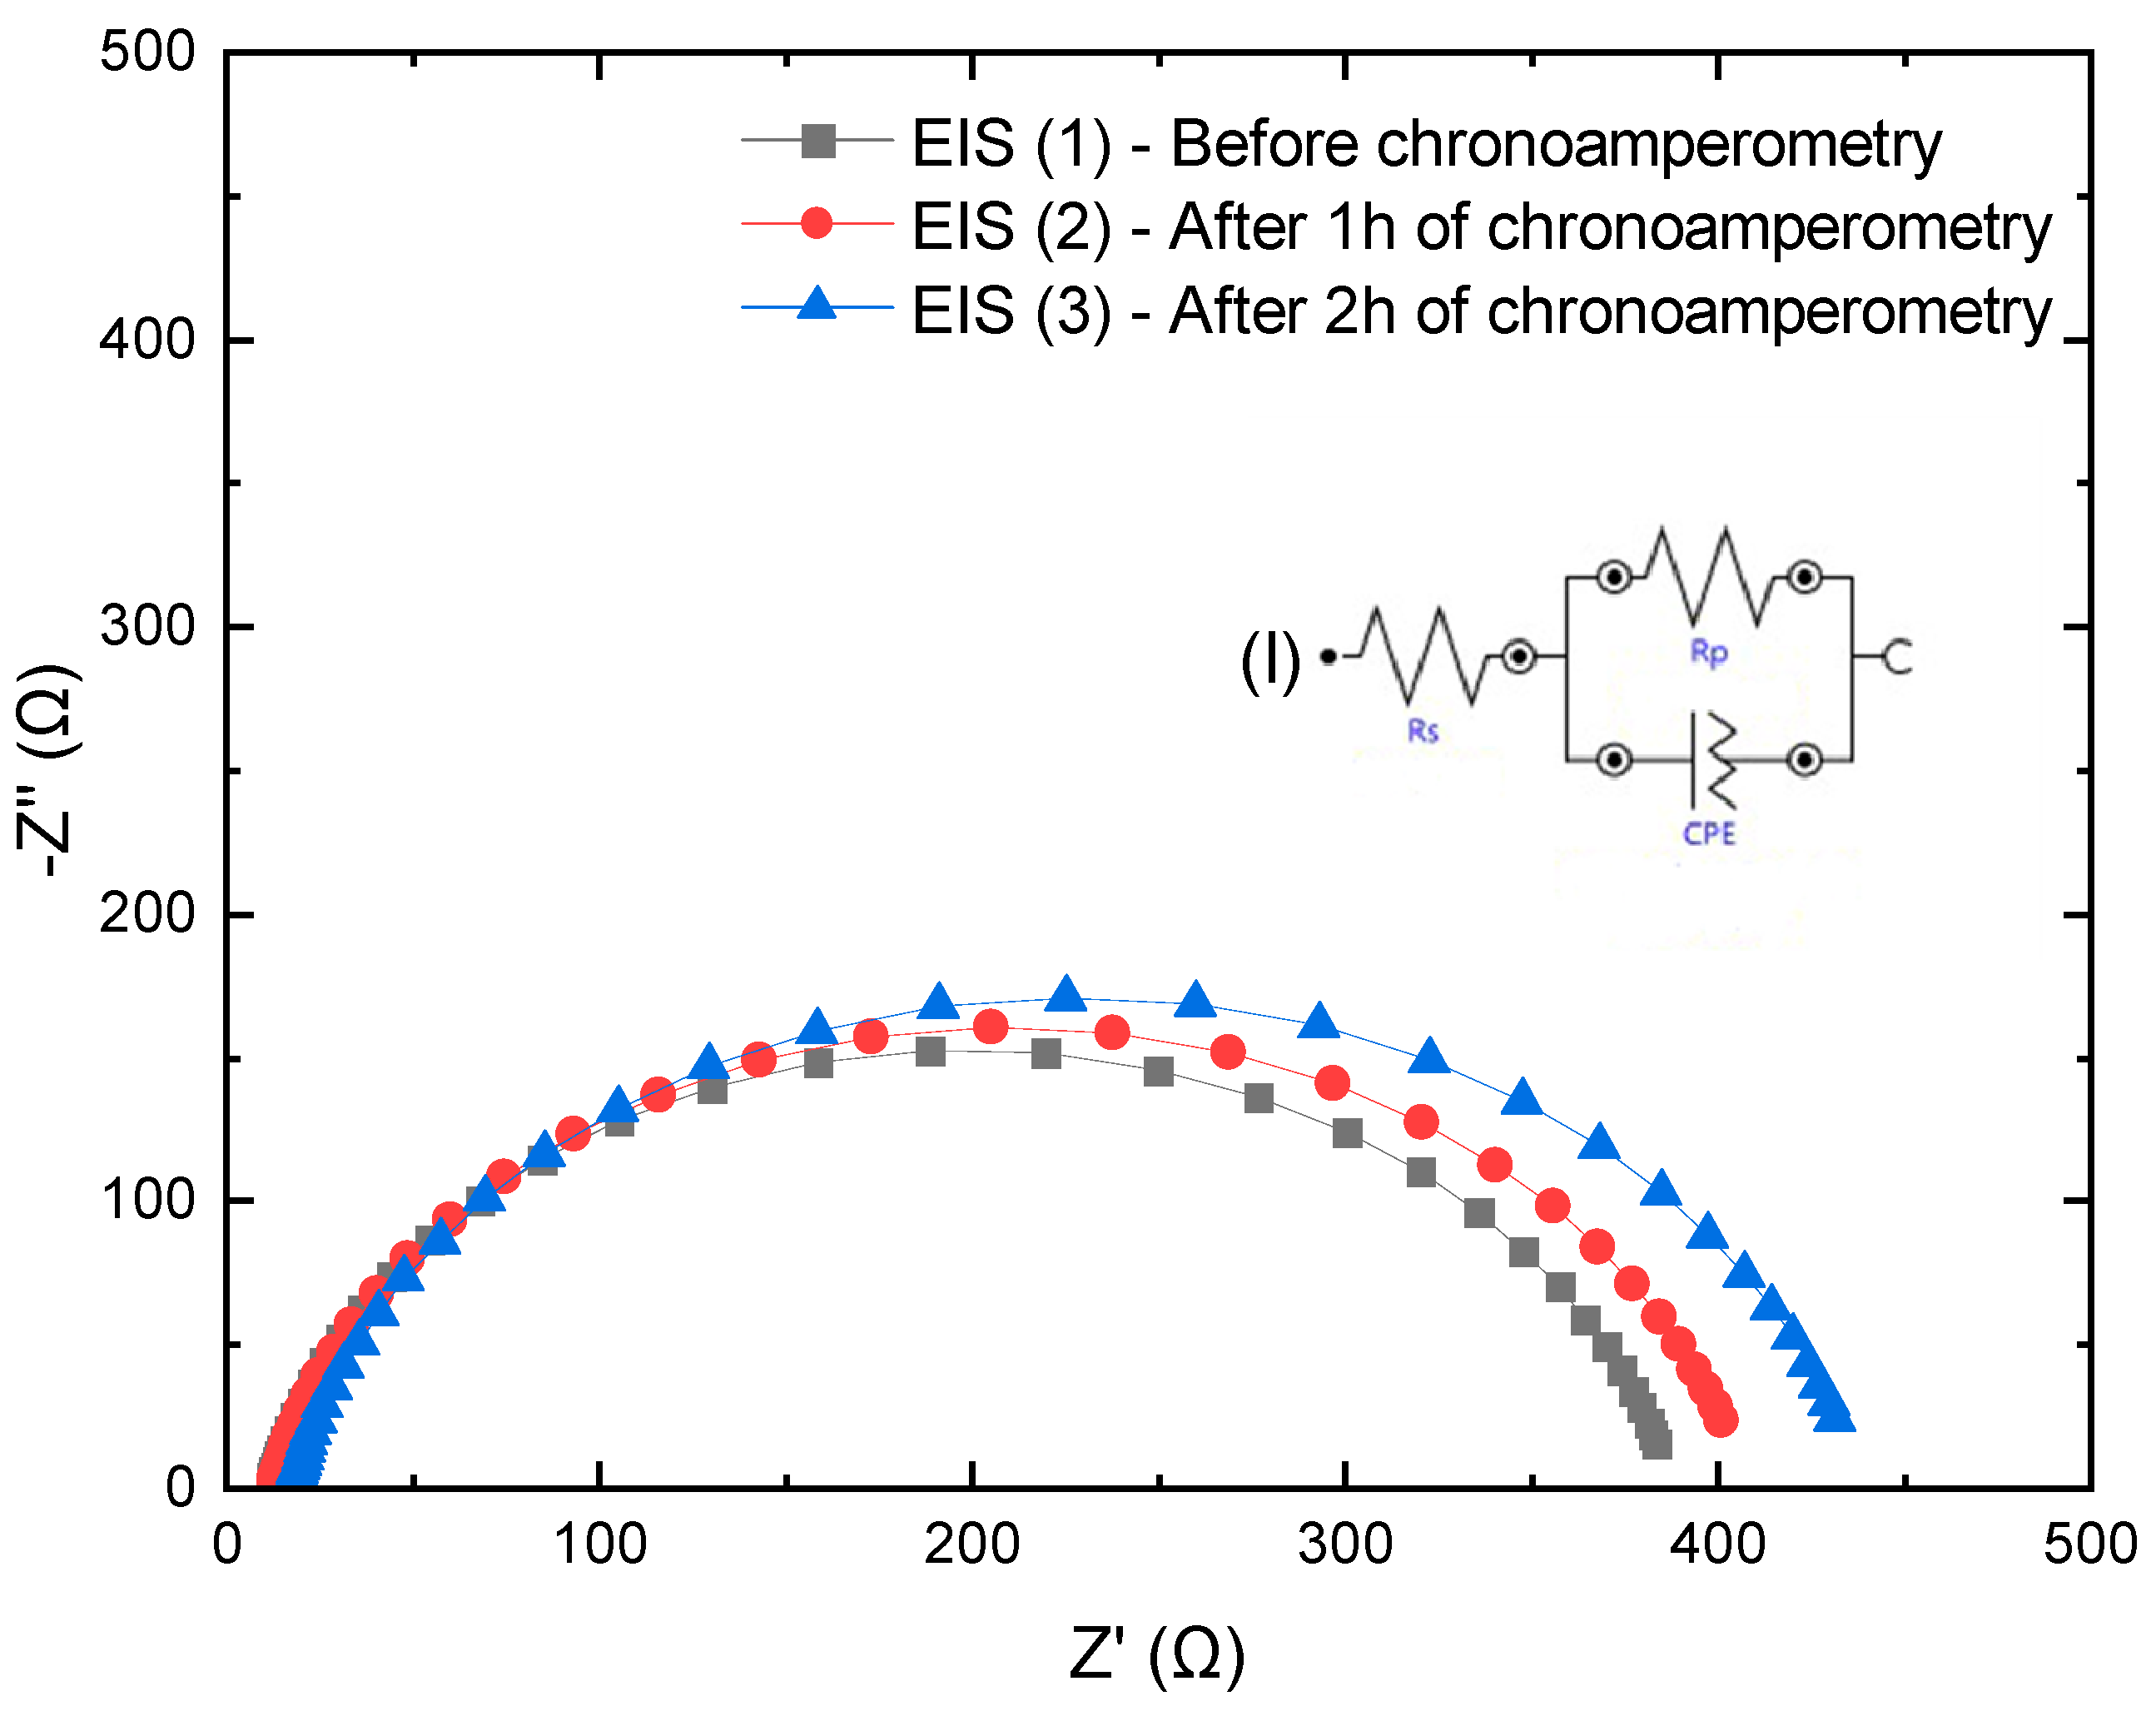
The operational stability of the 30 min sample, selected for presenting the best photoelectrochemical performance, was evaluated by chronoamperometry (CA) coupled with electrochemical impedance spectroscopy (EIS) [88]. The experimental protocol consisted of: (i) initial acquisition of the EIS spectrum (EIS-1), aimed at characterizing the interfacial properties before polarization; (ii) application of chronoamperometry at 0.61 V vs. Ag/AgCl under AM 1.5 G illumination for 1 h, followed by acquisition of a second EIS spectrum (EIS-2); (iii) a second CA step for an additional hour, totaling 2 h of continuous operation; and finally, (iv) acquisition of the third spectrum (EIS-3). A potential of 0.61 V vs. Ag/AgCl was adopted, which corresponds to a reversible potential of ERHE ≈ 1.23 V at pH ≈ 7, according to the reference conversion at 25 °C:
E R H E = E A g / A g C l + 0.210 + 0.059 × p H
This potential coincides with the thermodynamic limit of the OER and constitutes the standard benchmarking condition for photoanodes [50,89,90]. In addition, cyclic voltammetry of the 30 min sample consistently revealed an onset potential of approximately −0.55 to −0.60 V vs. Ag/AgCl; therefore, applying 0.61 V ensures operation near the onset photocurrent region, where the photoelectrode exhibits significant stability before the onset of degradation-related processes. In all cases, the EIS measurements were performed in the 100 kHz to 0.1 Hz range, with an amplitude of 10 mV (rms), and the results are presented in the form of Nyquist plots (Figure 19).
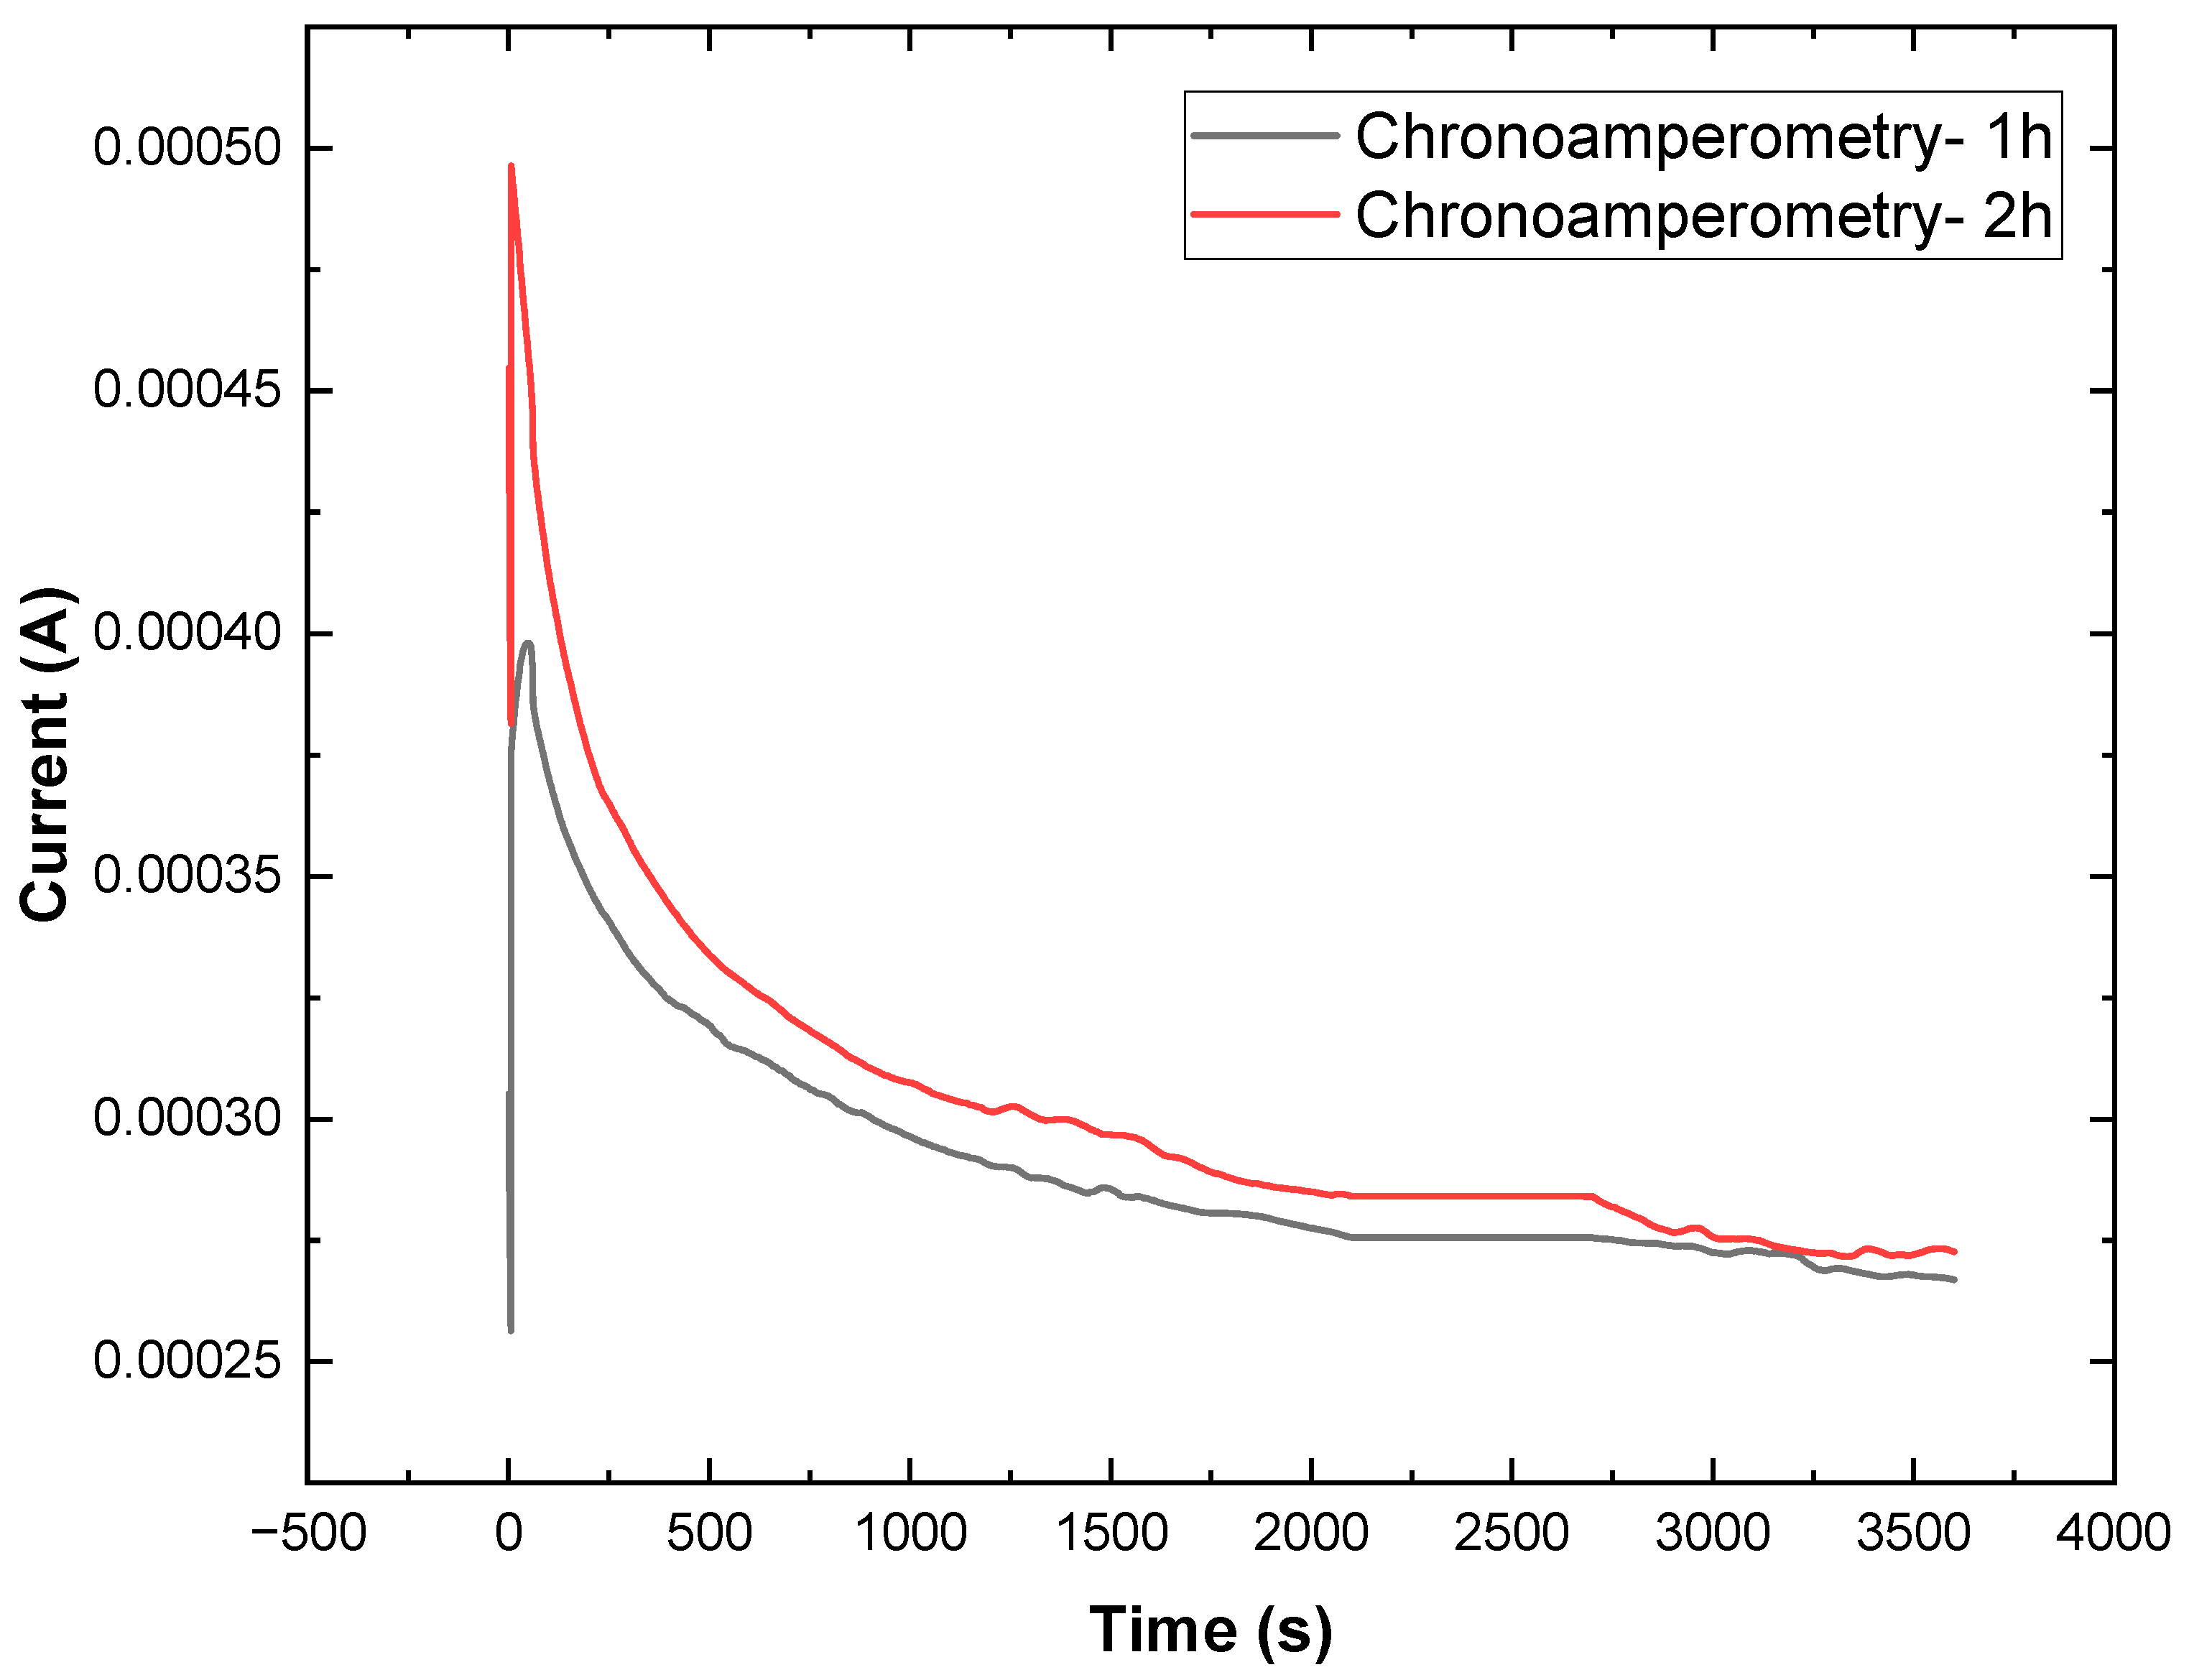
The chronoamperometric response (Figure 20) showed a current peak in the initial seconds, reaching approximately 5.0 × 10⁻⁴ A in the first hour and 4.0 × 10⁻⁴ A in the second hour, followed by the characteristic exponential decay until stabilization in a quasi-stationary regime, around (2.6–2.8) × 10−4 A.
The difference observed between the initial currents can be attributed to an electrochemical pre-conditioning effect of the electrode. During the first hour of polarization, the initial current density is higher due to the rapid occupation of surface electronic states and the initial contribution of interfacial capacitance, which results in a more intense transient charge flux. After this period, part of the active surface sites becomes reorganized or saturated, reducing the number of accessible states for immediate charge transfer in the second hour.
From a kinetic perspective, this difference can also be associated with an adjustment of the transport dynamics: the first stage promotes the stabilization of the equilibrium between proton insertion/extraction in WOX and the filling of sub-band gap states (oxygen vacancies or intermediate states in the lattice), thereby reducing the density of available carriers to contribute to the subsequent initial peak [91,92]. In addition, the formation of a stable charge layer at the semiconductor/electrolyte interface after the first hour minimizes rapid recombination of photogenerated carriers, resulting in a less intense initial peak in the second hour.
The maintenance of current density at similar values after 1 h and 2 h of operation indicates the absence of significant degradation of the material under continuous photoelectrochemical conditions. This behavior reflects both the stabilization of charge transport and the structural robustness of WOX under prolonged polarization [90,93]. Moreover, the comparative analysis of the EIS spectra before and after operation confirms discrete variations in the charge-transfer resistance (Rct) and in the double-layer capacitance [94], reinforcing the stability of the system.
The impedance data (Figure 19 and Table 8) corroborate this transient behavior observed in CA. The increase in Rs from 11.1 to 18.0 Ω·cm2 (EIS-1 → EIS-3) is related not only to electrolyte fluctuations but mainly to the formation and release of oxygen (O2) bubbles during the oxygen evolution reaction (OER), which temporarily reduce the effective electrode/electrolyte contact area [12]. The polarization resistance (Rp) increased from 377 to 420 Ω·cm2 after 2 h, indicating a charge-transfer conductance retention of approximately 90%, in agreement with the maintenance of quasi-stationary current density observed in CA. The Y0 parameter of the CPE increased from 95.7 to 130 µS·sⁿ after 1 h, stabilizing at 120 µS·sⁿ by the end of the test. This evolution is consistent with the larger current peak in the first hour, reflecting an initial process of electrochemical surface activation, possibly associated with the transient formation of HxWO3 species [95], followed by structural reorganization and stabilization in the second cycle [12,92]. Finally, the constant-phase exponent (~0.87) remained essentially unchanged, indicating preserved homogeneity of the capacitive response, consistent with the absence of significant structural degradation of the material over time [90,96].
To contextualize our findings, Table 9 compares the performance of our sputtered TiO2/WOx bilayers with representative state-of-the-art heterostructures reported in the literature. Typical photoanodes such as WO3/BiVO4 [97], TiO2/BiVO4 [98], or WO3/Fe2O3 [99] exhibit photocurrent densities in the range of 0.2–2.0 mA·cm−2 at 1.23 VRHE, depending on the architecture and electrolyte. Our TiO2/WOx electrode (30 min WOx) achieved a photocurrent density of ~0.19 mA·cm−2 at 1.23 VRHE under AM 1.5G illumination, accompanied by a flat-band potential of 0.41 VRHE and a donor density of 8.32 × 1019 cm−3. Although the absolute photocurrent remains lower than that of BiVO4- or Cu2O-based systems, the favorable band alignment, reduced charge-transfer resistance, and enhanced pseudocapacitive response highlight TiO2/WOx bilayers as competitive photoanodes. Their stability and tunable capacitive behavior provide a unique advantage rarely addressed in conventional PEC benchmarks.

4. Conclusions

This work systematically investigated WOx/TiO2 heterostructures fabricated by reactive DC magnetron sputtering, focusing on the effect of WOx layer thickness on their structural, optical, and photoelectrochemical properties.
Ellipsometry and FE-SEM analyses confirmed a controlled bilayer growth, with WOx thickness increasing almost linearly with deposition time, while the TiO2 overlayer remained essentially constant. The results demonstrate that the bilayer architecture can be reliably tailored through deposition parameters. The microstructural evolution revealed pinhole-free, continuous films with grain coarsening at higher WOx thicknesses, consistent with the Structure Zone Model for reactive sputtering.
Optical characterization by UV–vis transmittance and Tauc analysis indicated that the apparent band gap evolves non-monotonically with WOx thickness. Thin WOx layers initially induced a slight blue-shift in the TiO2 band edge due to interfacial oxidation and stress effects, while thicker WOx overlayers progressively red-shifted the absorption edge, reflecting the increasing contribution of monoclinic WO3 and defect-related states. These trends highlight the competing roles of interface passivation and sub-band gap absorption in defining the optical response of the bilayers.
Electrochemical characterization further established that the WOx layer significantly modifies the semiconductor/electrolyte interface. Mott–Schottky analysis revealed shifts in flat-band potential and changes in donor density, confirming the influence of WOx thickness on the electronic structure. Cyclic voltammetry and impedance spectroscopy demonstrated enhanced charge transfer and pseudocapacitive contributions for thicker WOx layers, while photocurrent measurements showed up to a threefold increase compared to bare TiO2, with stable performance under repeated illumination cycles.
Together, these findings provide clear evidence that sputtered WOx/TiO2 heterostructures form type-II junctions that improve charge separation and interfacial properties. The correlation between deposition conditions, structural/optical evolution, and electrochemical behavior establishes a valuable framework for the rational design of these systems in photoelectrochemical and hybrid energy applications.
Nevertheless, this study should be viewed as an initial step toward understanding such heterostructures. A more comprehensive mapping of WOx and TiO2 thickness combinations, complemented by advanced spectroscopic and time-resolved techniques, will be necessary to fully capture the structure–property relationships and unlock the potential of this material platform for solar-driven hydrogen generation and related applications.

Supplementary Materials

The following supporting information can be downloaded at: https://www.mdpi.com/article/10.3390/nanomanufacturing5040015/s1, Figure S1: Photocurrent voltammograms measured under (a) dark conditions and (b) simulated solar illumination (AM 1.5G) for pure TiO2 (0 min), and TiO2/WOx heterostructures with WOₓ layers deposited for 10 and 30 minutes; Figure S2: Cyclic voltammograms acquired at different scan rates (10, 25, and 50 mV·s−1) for the 0-min sample under (a) dark and (b) simulated solar illumination.

Author Contributions

Conceptualization, A.S.d.S.S. and A.L.J.P.; Data curation, L.D.A., B.S., D.A.G., M.S.W.M. and N.F.A.N.; Formal analysis, M.D.M.T., B.D.B.-N., M.S.W.M. and N.F.A.N.; Funding acquisition, R.S.P., A.S.d.S.S. and A.L.J.P.; Investigation, L.D.A., B.S., D.A.G. and B.D.B.-N.; Methodology, L.D.A., B.S., M.D.M.T. and D.M.G.L.; Project administration, A.S.d.S.S. and A.L.J.P.; Resources, D.A.G., D.M.G.L. and A.S.d.S.S.; Software, L.D.A.; Supervision, A.S.d.S.S. and A.L.J.P.; Validation, D.A.G., M.S.W.M. and R.S.P.; Visualization, L.D.A., M.D.M.T. and D.M.G.L.; Writing—Original draft, L.D.A. and B.S.; Writing—Review and editing, D.A.G., B.D.B.-N., N.F.A.N., D.M.G.L. and R.S.P. All authors have read and agreed to the published version of the manuscript.

Funding

This research was funded by the National Council for Scientific and Technological Development (CNPq-Brazil), grant number 310778/2021-2, 407805/2023-0, and São Paulo Research Foundation (FAPESP-Brazil), grant number 2022/02994-2.

Data Availability Statement

The original contributions presented in this study are included in the article/Supplementary Material. Further inquiries can be directed to the corresponding author(s).

Conflicts of Interest

The authors declare no conflicts of interest.

Abbreviations

The following abbreviations are used in this manuscript:
WOxTungsten oxide
TiO2Titanium dioxide
PECPhotoelectrochemical
DCDirect current
FTOFluorine-doped tin oxide
FE-SEMField-emission scanning electron microscopy
XRDX-ray diffraction
OCPOpen-circuit potential
EISElectrochemical impedance spectroscopy
CVCyclic voltammetry
MSMott–Schottky
NDMajority donor density
ND,APPMajority apparent donor density
VFBFlat-band potential
RsSolution resistance
RpCharge transfer resistance
CPEConstant phase element
χ2Goodness of fit (chi-squared)
EgOptical band gap
NdDonor density
PsSpecific power
EsSpecific energy
AM 1.5GAir mass 1.5 global (solar illumination standard)
RHEReversible hydrogen electrode
OEROxygen evolution reaction
CAChronoamperometry
CdlDouble-layer capacitance
ECSAElectrochemically active surface area
CsSpecific capacitance
RfRoughness factor
fFFaradaic fraction
FRAFrequency Response Analyzer
sccmStandard cubic centimeters per minute

References

  1. Li, S.; Xu, W.; Meng, L.; Tian, W.; Li, L. Recent Progress on Semiconductor Heterojunction-Based Photoanodes for Photoelectrochemical Water Splitting. Small Sci. 2022, 2, 2100112. [Google Scholar] [CrossRef]
  2. Pessoa, R.S.; Fraga, M.A.; Santos, L.V.; Massi, M.; Maciel, H.S. Nanostructured thin films based on TiO2 and/or SiC for use in photoelectrochemical cells: A review of the material characteristics, synthesis and recent applications. Mater. Sci. Semicond. Process. 2015, 29, 56–68. [Google Scholar] [CrossRef]
  3. Schneider, J.; Matsuoka, M.; Takeuchi, M.; Zhang, J.; Horiuchi, Y.; Anpo, M.; Bahnemann, D.W. Understanding TiO2 Photocatalysis: Mechanisms and Materials. Chem. Rev. 2014, 114, 9919–9986. [Google Scholar] [CrossRef]
  4. Wang, W.; Cheng, B.; Luo, G.; Yu, J.; Cao, S. S-scheme heterojunction photocatalysts based on 2D materials. Mater. Today 2024, 81, 137–158. [Google Scholar] [CrossRef]
  5. Shabbir, A.; Sardar, S.; Mumtaz, A. Mechanistic investigations of emerging type-II, Z-scheme and S-scheme heterojunctions for photocatalytic applications–A review. J. Alloys Compd. 2024, 1003, 175683. [Google Scholar] [CrossRef]
  6. Wang, H.; Fu, W.; Yang, X.; Huang, Z.; Li, J.; Zhang, H.; Wang, Y. Recent advancements in heterostructured interface engineering for hydrogen evolution reaction electrocatalysis. J. Mater. Chem. 2020, 8, 6926–6956. [Google Scholar] [CrossRef]
  7. Li, X.Z.; Li, F.B.; Yang, C.L.; Ge, W.K. Photocatalytic activity of WOx-TiO2 under visible light irradiation. J. Photochem. Photobiol. A Chem. 2001, 141, 209–217. [Google Scholar] [CrossRef]
  8. Wang, Q.; Zhang, W.; Hu, X.; Xu, L.; Chen, G.; Li, X. Hollow spherical WO3/TiO2 heterojunction for enhancing photocatalytic performance in visible-light. J. Water Process Eng. 2021, 40, 101943. [Google Scholar] [CrossRef]
  9. Rostami, M.; Badiei, A.; Ganjali, M.R.; Rahimi-Nasrabadi, M.; Naddafi, M.; Karimi-Maleh, H. Nano-architectural design of TiO2 for high performance photocatalytic degradation of organic pollutant: A review. Environ. Res. 2022, 212, 113347. [Google Scholar] [CrossRef]
  10. Yang, Y.; Ma, G.; Hu, X.; Wang, W.; Du, Z.; Wang, Y.; Gong, X.-Z.; Tan, H.; Guo, F.; Tang, J. Hollow flower-like WO3@TiO2 heterojunction microspheres for the photocatalytic degradation of rhodamine B and tetracycline. RSC Adv. 2025, 15, 12629–12644. [Google Scholar] [CrossRef]
  11. He, X.; Gong, Y.; Niu, L.; Li, C. Development of Defect-Rich WO3-x/TiO2 Heterojunction Toward Dual-Functional Enhancement: Boosting SERS and Photocatalytic Performance. Nanomaterials 2025, 15, 521. [Google Scholar] [CrossRef]
  12. Castro, I.A.; Byzynski, G.; Dawson, M.; Ribeiro, C. Charge transfer mechanism of WO3/TiO2 heterostructure for photoelectrochemical water splitting. J. Photochem. Photobiol. A Chem. 2017, 339, 95–102. [Google Scholar] [CrossRef]
  13. Chappanda, K.N.; Smith, Y.R.; Rieth, L.W.; Tathireddy, P.; Misra, M.; Mohanty, S.K. TiO2–WO3 Composite Nanotubes from Co–Sputtered Thin Films on Si Substrate for Enhanced Photoelectrochemical Water Splitting. J. Electrochem. Soc. 2014, 161, H431–H437. [Google Scholar] [CrossRef]
  14. Sotelo-Vazquez, C.; Quesada-Cabrera, R.; Ling, M.; Scanlon, D.O.; Kafizas, A.; Thakur, P.K.; Lee, T.; Taylor, A.; Watson, G.W.; Palgrave, R.G.; et al. Evidence and Effect of Photogenerated Charge Transfer for Enhanced Photocatalysis in WO3/TiO2 Heterojunction Films: A Computational and Experimental Study. Adv. Funct. Mater. 2017, 27, 1605413. [Google Scholar] [CrossRef]
  15. Dobromir, M.; Apetrei, R.P.; Rebegea, S.; Manole, A.; Nica, V.; Luca, D. Synthesis and characterization of RF sputtered WO3/TiO2 bilayers. Surf. Coat. Technol. 2016, 285, 197–202. [Google Scholar] [CrossRef]
  16. Qamar, M.; Drmosh, Q.; Ahmed, M.I.; Qamaruddin, M.; Yamani, Z.H. Enhanced photoelectrochemical and photocatalytic activity of WO3-surface modified TiO2 thin film. Nanoscale Res. Lett. 2015, 10, 54. [Google Scholar] [CrossRef]
  17. Puddu, V.; Mokaya, R.; Li Puma, G. Novel one step hydrothermal synthesis of TiO2/WO3 nanocomposites with enhanced photocatalytic activity. Chem. Commun. 2007, 4749–4751. [Google Scholar] [CrossRef] [PubMed]
  18. Smith, W.; Wolcott, A.; Fitzmorris, R.C.; Zhang, J.Z.; Zhao, Y. Quasi-core-shell TiO2/WO3 and WO3/TiO2 nanorod arrays fabricated by glancing angle deposition for solar water splitting. J. Mater. Chem. 2011, 21, 10792–10800. [Google Scholar] [CrossRef]
  19. Silva, L.C.; Barrocas, B.; Melo Jorge, M.E.; Sério, S. Photocatalytic Degradation of Rhodamine 6G Using TiO2/WO3 Bilayered Films Produced by Reactive Sputtering. In Proceedings of the 6th International Conference on Photonics, Optics and Laser Technology, Coruña, Spain, 25–27 January 2018; SciTePress-Science and Technology Publications: Setúbal, Portugal, 2018; pp. 334–340. [Google Scholar]
  20. Neto, N.F.A.; de Jesus Pereira, A.L.; Leite, D.M.G.; da Silva, J.H.D.; da Silva Pelissari, M.R. Evaluation of ITO/TiO2/Co3O4 as a non-enzymatic heterojunction electrode to glucose electrooxidation. Ionics 2021, 27, 1597–1609. [Google Scholar] [CrossRef]
  21. Escaliante, L.C.; Azevedo Neto, N.F.; Mendoza, H.E.; Xiao, C.; Kandel, R.; da Silva, J.H.D.; Osterloh, F.E. Sputter-Coated TiO2 Films as Passivation and Hole Transfer Layers for Improved Energy Conversion with Solar Fuel WO3/CuWO4 Photoanodes. ACS Appl. Mater. Interfaces 2024, 16, 69229–69238. [Google Scholar] [CrossRef]
  22. Mahjabin, S.; Haque, M.; Sobayel, K.; Selvanathan, V.; Jamal, M.S.; Bashar, M.S.; Sultana, M.; Hossain, M.I.; Shahiduzzaman; Algethami, M.; et al. Investigation of Morphological, Optical, and Dielectric Properties of RF Sputtered WOx Thin Films for Optoelectronic Applications. Nanomaterials 2022, 12, 3467. [Google Scholar] [CrossRef]
  23. Mahjabin, S.; Mahfuzul Haque, M.; Khan, S.; Selvanathan, V.; Jamal, M.; Bashar, M.; Alkhammash, H.I.; Hossain, M.I.; Shahiduzzaman, M.; Amin, N.; et al. Effects of oxygen concentration variation on the structural and optical properties of reactive sputtered WOx thin film. Sol. Energy 2021, 222, 202–211. [Google Scholar] [CrossRef]
  24. Khare, C.; Sliozberg, K.; Meyer, R.; Savan, A.; Schuhmann, W.; Ludwig, A. Layered WO3/TiO2 nanostructures with enhanced photocurrent densities. Int. J. Hydrogen Energy 2013, 38, 15954–15964. [Google Scholar] [CrossRef]
  25. Lv, Z.; Yang, D.; Mo, J.; Jin, Z.; Chang, S. Construction of TiO2/WO3/TiO2 double heterojunction films for excellent electrochromic performance. Sci. Rep. 2024, 14, 11443. [Google Scholar] [CrossRef] [PubMed]
  26. Chuenkruit, A.; Thongjoon, W.; Aiempanakit, M.; Aiempanakit, C.; Aiempanakit, K. Preparation of WO3 on TiO2 Nanotubes for Electrochromic-Enhanced Photocatalytic Activity. Curr. Appl. Sci. Technol. 2025, 25, e0263966. [Google Scholar] [CrossRef]
  27. Mak, C.L.; Lai, B.; Wong, K.H.; Choy, C.L.; Mo, D.; Zhang, Y.L. Spectroellipsometric study of sol–gel derived potassium sodium strontium barium niobate films. J. Appl. Phys. 2001, 89, 4491–4496. [Google Scholar] [CrossRef]
  28. Forouhi, A.R.; Bloomer, I. Optical dispersion relations for amorphous semiconductors and amorphous dielectrics. Phys. Rev. B 1986, 34, 7018–7026. [Google Scholar] [CrossRef]
  29. Forouhi, A.R.; Bloomer, I. Optical properties of crystalline semiconductors and dielectrics. Phys. Rev. B 1988, 38, 1865–1874. [Google Scholar] [CrossRef]
  30. Eiamchai, P.; Chindaudom, P.; Pokaipisit, A.; Limsuwan, P. A spectroscopic ellipsometry study of TiO2 thin films prepared by ion-assisted electron-beam evaporation. Curr. Appl. Phys. 2009, 9, 707–712. [Google Scholar] [CrossRef]
  31. Madhavi, V.; Kondaiah, P.; Hussain, O.M.; Uthanna, S. Structural, Optical, and Luminescence Properties of Reactive Magnetron Sputtered Tungsten Oxide Thin Films. ISRN 2012, 2012, 801468. [Google Scholar] [CrossRef]
  32. Berg, S.; Nyberg, T. Fundamental understanding and modeling of reactive sputtering processes. Thin Solid Films 2005, 476, 215–230. [Google Scholar] [CrossRef]
  33. Thornton, J.A. Influence of apparatus geometry and deposition conditions on the structure and topography of thick sputtered coatings. J. Vac. Sci. Technol. 1974, 11, 666–670. [Google Scholar] [CrossRef]
  34. Kusano, E. Structure-Zone Modeling of Sputter-Deposited Thin Films: A Brief Review. Appl. Sci. Converg. Technol. 2019, 28, 179–185. [Google Scholar] [CrossRef]
  35. Yu, G.; Xie, X.; Pan, L.; Bao, Z.; Cui, Y. Hybrid nanostructured materials for high-performance electrochemical capacitors. Nano Energy 2013, 2, 213–234. [Google Scholar] [CrossRef]
  36. Boukamp, B.A. Nonlinear Least Squares Fit procedure for analysis of immittance data of electrochemical systems. Solid State Ion. 1986, 20, 31–44. [Google Scholar] [CrossRef]
  37. Rodríguez-Carvajal, J. Recent advances in magnetic structure determination by neutron powder diffraction. Phys. B Condens. Matter 1993, 192, 55–69. [Google Scholar] [CrossRef]
  38. Lethy, K.J.; Beena, D.; Vinod Kumar, R.; Pillai, V.M.; Ganesan, V.; Sathe, V. Structural, optical and morphological studies on laser ablated nanostructured WO3 thin films. Appl. Surf. Sci. 2008, 254, 2369–2376. [Google Scholar] [CrossRef]
  39. Boulova, M.; Lucazeau, G. Crystallite Nanosize Effect on the Structural Transitions of WO3 Studied by Raman Spectroscopy. J. Solid State Chem. 2002, 167, 425–434. [Google Scholar] [CrossRef]
  40. Christou, K.; Louloudakis, D.; Vernardou, D.; Katsarakis, N.; Koudoumas, E. One-pot synthesis of WO3 structures at 95 °C using HCl. J. Solgel Sci. Technol. 2015, 73, 520–526. [Google Scholar] [CrossRef]
  41. Chen, W.-F.; Koshy, P.; Sorrell, C.C. Effects of film topology and contamination as a function of thickness on the photo-induced hydrophilicity of transparent TiO2 thin films deposited on glass substrates by spin coating. J. Mater. Sci. 2016, 51, 2465–2480. [Google Scholar] [CrossRef]
  42. Guillén C Band Gap Energy and Lattice Distortion in Anatase TiO2 Thin Films Prepared by Reactive Sputtering with Different Thicknesses. Materials 2025, 18, 2346. [CrossRef]
  43. Pan, X.; Yang, M.-Q.; Fu, X.; Zhang, N.; Xu, Y.-J. Defective TiO2 with oxygen vacancies: Synthesis, properties and photocatalytic applications. Nanoscale 2013, 5, 3601–3614. [Google Scholar] [CrossRef]
  44. Sachs, M.; Park, J.-S.; Pastor, E.; Kafizas, A.; Wilson, A.A.; Francàs, L.; Gul, S.; Ling, M.; Blackman, C.; Yano, J.; et al. Effect of oxygen deficiency on the excited state kinetics of WO3 and implications for photocatalysis. Chem. Sci. 2019, 10, 5667–5677. [Google Scholar] [CrossRef] [PubMed]
  45. Miyagi, T.; Takahashi, Y.; Akimoto, Y. Characterization of photocatalytic hybrid TiO2–WOX thin films deposited via co-sputtering. Thin Solid Films 2024, 789, 140195. [Google Scholar] [CrossRef]
  46. Alruwaili, M.; Roy, A.; Alhabradi, M.; Yang, X.; Chang, H.; Tahir, A.A. Heterostructured WO3–TiVO4 thin-film photocatalyst for efficient photoelectrochemical water splitting. Heliyon 2024, 10, e25446. [Google Scholar] [CrossRef] [PubMed]
  47. Zhou, B.-X.; Ding, S.-S.; Wang, Y.; Wang, X.-R.; Huang, W.-Q.; Li, K.; Huang, G.-F. Type-II/type-II band alignment to boost spatial charge separation: A case study of g-C3N4 quantum dots/a-TiO2/r-TiO2 for highly efficient photocatalytic hydrogen and oxygen evolution. Nanoscale 2020, 12, 6037–6046. [Google Scholar] [CrossRef]
  48. Anandhu, T.P.R.; Mohan, R.; Cherusseri, J.; Varma, S.J. High areal capacitance and enhanced cycling stability of binder-free, pristine polyaniline supercapacitor using hydroquinone as a redox additive. Electrochim. Acta 2022, 425, 140740. [Google Scholar] [CrossRef]
  49. Liu, Y.; Wang, N.; Zhao, X.; Fang, Z.; Zhang, X.; Liu, Y.; Bai, Z.; Dou, S.; Yu, G. Hierarchical nanoarchitectured hybrid electrodes based on ultrathin MoSe2 nanosheets on 3D ordered macroporous carbon frameworks for high-performance sodium-ion batteries. J. Mater. Chem. A 2020, 8, 2843–2850. [Google Scholar] [CrossRef]
  50. Allen, J.B.; Larry, R. Faulkner Electrochemical Methods: Fundamentals and Applications; John Wiley & Sons: New York, NY, USA, 2001. [Google Scholar]
  51. Augustyn, V.; Simon, P.; Dunn, B. Pseudocapacitive oxide materials for high-rate electrochemical energy storage. Energy Environ. Sci. 2014, 7, 1597–1614. [Google Scholar] [CrossRef]
  52. Simon, P.; Gogotsi, Y. Materials for electrochemical capacitors. Nat. Mater. 2008, 7, 845–854. [Google Scholar] [CrossRef]
  53. Iqbal, A.; Kafizas, A.; Sotelo-Vazquez, C.; Wilson, R.; Ling, M.; Taylor, A.; Blackman, C.; Bevan, K.; Parkin, I.; Quesada-Cabrera, R. Charge Transport Phenomena in Heterojunction Photocatalysts: The WO3/TiO2 System as an Archetypical Model. ACS Appl. Mater. Interfaces 2021, 13, 9781–9793. [Google Scholar] [CrossRef] [PubMed]
  54. Zou, B.-X.; Liang, Y.; Liu, X.-X.; Diamond, D.; Lau, K.-T. Electrodeposition and pseudocapacitive properties of tungsten oxide/polyaniline composite. J. Power Sources 2011, 196, 4842–4848. [Google Scholar] [CrossRef]
  55. Gelderman, K.; Lee, L.; Donne, S.W. Flat-Band Potential of a Semiconductor: Using the Mott–Schottky Equation. J. Chem. Educ. 2007, 84, 685. [Google Scholar] [CrossRef]
  56. Sivula, K. Mott–Schottky Analysis of Photoelectrodes: Sanity Checks Are Needed. ACS Energy Lett. 2021, 6, 2549–2551. [Google Scholar] [CrossRef]
  57. Mohd Raub, A.A.; Bahru, R.; Mohd Nashruddin, S.N.A.; Yunas, J. Advances of nanostructured metal oxide as photoanode in photoelectrochemical (PEC) water splitting application. Heliyon 2024, 10, e39079. [Google Scholar] [CrossRef]
  58. Bilal, S.; Akbar, A.; Shah, A.-H.A. Highly Selective and Reproducible Electrochemical Sensing of Ascorbic Acid Through a Conductive Polymer Coated Electrode. Polymers 2019, 11, 1346. [Google Scholar] [CrossRef]
  59. Laviron, E. General expression of the linear potential sweep voltammogram in the case of diffusionless electrochemical systems. J. Electroanal. Chem. Interfacial Electrochem. 1979, 101, 19–28. [Google Scholar] [CrossRef]
  60. Nicholson, R.S. Theory and Application of Cyclic Voltammetry for Measurement of Electrode Reaction Kinetics. Anal. Chem. 1965, 37, 1351–1355. [Google Scholar] [CrossRef]
  61. Espinosa-Angeles, J.C.; Goubard-Bretesché, N.; Quarez, E.; Payen, C.; Sougrati, M.-T.; Crosnier, O.; Brousse, T. Investigating the Cycling Stability of Fe2WO6 Pseudocapacitive Electrode Materials. Nanomaterials 2021, 11, 1405. [Google Scholar] [CrossRef]
  62. Aydın, H.; Kurtan, U.; Demir, M.; Karakuş, S. Synthesis and Application of a Self-Standing Zirconia-Based Carbon Nanofiber in a Supercapacitor. Energy Fuels 2022, 36, 2212–2219. [Google Scholar] [CrossRef]
  63. Wang, C.; Zhang, H.-W.; Zhang, J.-F.; Wu, D.; Tian, Z.-Q.; Tian, Z.-W.; Shi, K. New Strategy for Electrochemical Micropatterning of Nafion Film in Sulfuric Acid Solution. Electrochim. Acta 2014, 146, 125–133. [Google Scholar] [CrossRef]
  64. Shabani-Nooshabadi, M.; Zahedi, F. Electrochemical reduced graphene oxide-polyaniline as effective nanocomposite film for high-performance supercapacitor applications. Electrochim. Acta 2017, 245, 575–586. [Google Scholar] [CrossRef]
  65. Shen, C.; Xu, S.; Xie, Y.; Sanghadasa, M.; Wang, X.; Lin, L. A Review of On-Chip Micro Supercapacitors for Integrated Self-Powering Systems. J. Microelectromech. Syst. 2017, 26, 949–965. [Google Scholar] [CrossRef]
  66. Yang, W.; Prabhakar, R.R.; Tan, J.; Tilley, S.D.; Moon, J. Strategies for enhancing the photocurrent, photovoltage, and stability of photoelectrodes for photoelectrochemical water splitting. Chem. Soc. Rev. 2019, 48, 4979–5015. [Google Scholar] [CrossRef]
  67. Chiu, M.; Tseng, W.; Tang, H.; Chang, Y.; Chen, C.; Hsu, W.; Chang, W.; Wu, C.; Li, L. Band Alignment of 2D Transition Metal Dichalcogenide Heterojunctions. Adv. Funct. Mater. 2017, 27, 1603756. [Google Scholar] [CrossRef]
  68. O’Hayre, R.; Nanu, M.; Schoonman, J.; Goossens, A. Mott−Schottky and Charge-Transport Analysis of Nanoporous Titanium Dioxide Films in Air. J. Phys. Chem. C 2007, 111, 4809–4814. [Google Scholar] [CrossRef]
  69. Oliva, F.Y.; Avalle, L.B.; Santos, E.; Cámara, O.R. Photoelectrochemical characterization of nanocrystalline TiO2 films on titanium substrates. J. Photochem. Photobiol. A Chem. 2002, 146, 175–188. [Google Scholar] [CrossRef]
  70. Lee, K.K.; Chin, W.S.; Sow, C.H. Cobalt-based compounds and composites as electrode materials for high-performance electrochemical capacitors. J. Mater. Chem. A 2014, 2, 17212–17248. [Google Scholar] [CrossRef]
  71. Kavan, L.; Tétreault, N.; Moehl, T.; Grätzel, M. Electrochemical Characterization of TiO2 Blocking Layers for Dye-Sensitized Solar Cells. J. Phys. Chem. C 2014, 118, 16408–16418. [Google Scholar] [CrossRef]
  72. Bolts, J.M.; Wrighton, M.S. Correlation of photocurrent-voltage curves with flat-band potential for stable photoelectrodes for the photoelectrolysis of water. J. Phys. Chem. 1976, 80, 2641–2645. [Google Scholar] [CrossRef]
  73. Gillet, M.; Lemire, C.; Gillet, E.; Aguir, K. The role of surface oxygen vacancies upon WO3 conductivity. Surf. Sci. 2003, 532–535, 519–525. [Google Scholar] [CrossRef]
  74. Semikina, T.V. Optical properties of dielectric layers with CeO2. Semicond. Phys. Quantum Electron. Optoelectron. 2004, 7, 291–296. [Google Scholar] [CrossRef]
  75. Mayadas, A.F.; Shatzkes, M. Electrical-Resistivity Model for Polycrystalline Films: The Case of Arbitrary Reflection at External Surfaces. Phys. Rev. B 1970, 1, 1382–1389. [Google Scholar] [CrossRef]
  76. Magar, H.S.; Hassan, R.Y.A.; Mulchandani, A. Electrochemical Impedance Spectroscopy (EIS): Principles, Construction, and Biosensing Applications. Sensors 2021, 21, 6578. [Google Scholar] [CrossRef]
  77. Lazanas, A.C.; Prodromidis, M.I. Electrochemical Impedance Spectroscopy—A Tutorial. ACS Meas. Sci. Au 2023, 3, 162–193. [Google Scholar] [CrossRef]
  78. Anucha, C.B.; Altin, I.; Bacaksiz, E.; Stathopoulos, V.N. Titanium dioxide (TiO2)-based photocatalyst materials activity enhancement for contaminants of emerging concern (CECs) degradation: In the light of modification strategies. Chem. Eng. J. Adv. 2022, 10, 100262. [Google Scholar] [CrossRef]
  79. Kasap, S.O.; Kabir, M.Z.; Ramaswami, K.O.; Johanson, R.E.; Curry, R.J. Charge collection efficiency in the presence of non-uniform carrier drift mobilities and lifetimes in photoconductive detectors. J Appl Phys 2020, 128, 124501. [Google Scholar] [CrossRef]
  80. Trasatti, S.; Petrii, O.A. Real surface area measurements in electrochemistry. Pure Appl. Chem. 1991, 63, 711–734. [Google Scholar] [CrossRef]
  81. McCrory, C.C.L.; Jung, S.; Ferrer, I.M.; Chatman, S.M.; Peters, J.C.; Jaramillo, T.F. Benchmarking Hydrogen Evolving Reaction and Oxygen Evolving Reaction Electrocatalysts for Solar Water Splitting Devices. J. Am. Chem. Soc. 2015, 137, 4347–4357. [Google Scholar] [CrossRef]
  82. Nanda, J.; Augustyn, V. Transition Metal Oxides for Electrochemical Energy Storage; Wiley: Hoboken, NJ, USA, 2022. [Google Scholar]
  83. Wang, S.; Wan, K.; Feng, J.; Yang, Y.; Wang, S. BiVO4 photoanodes with enhanced photoelectrochemical performance: Preparation, modification and emerging applications. J. Mater. Sci. Technol. 2025, 217, 182–220. [Google Scholar] [CrossRef]
  84. Trotochaud, L.; Young, S.L.; Ranney, J.K.; Boettcher, S.W. Nickel–Iron Oxyhydroxide Oxygen-Evolution Electrocatalysts: The Role of Intentional and Incidental Iron Incorporation. J. Am. Chem. Soc. 2014, 136, 6744–6753. [Google Scholar] [CrossRef]
  85. Huang, S.; Bao, R.; Wang, J.; Yi, J.; Zhang, Z.; Liu, L.; Han, Y.; Li, Z.; Min, D.; Zhang, W.; et al. Synergistic effect of oxygen vacancy defects and TiO2/WO3 heterostructures in photocatalytic hydrogen production and dye degradation. J. Alloys Compd. 2023, 961, 170945. [Google Scholar] [CrossRef]
  86. Zhang, X.; Chi, Z.; Xu, B.; Jiang, L.; Zhou, X.; Zhang, Y.; Liu, S.; Xu, J. Multifunctional organic fluorescent materials derived from 9,10-distyrylanthracene with alkoxyl endgroups of various lengths. Chem. Commun. 2012, 48, 10895–10897. [Google Scholar] [CrossRef]
  87. Shao, H.; Lin, Z.; Xu, K.; Taberna, P.-L.; Simon, P. Electrochemical study of pseudocapacitive behavior of Ti3C2Tx MXene material in aqueous electrolytes. Energy Storage Mater. 2019, 18, 456–461. [Google Scholar] [CrossRef]
  88. Speldrich, S.; Wark, M.; Wittstock, G. Metal Oxide Protection Layers for Enhanced Stability and Activity of WO3 Photoanodes in Alkaline Media. ACS Appl. Energy Mater. 2023, 6, 9602–9614. [Google Scholar] [CrossRef]
  89. Rodríguez-Pérez, M.; Rodríguez-Gutiérrez, I.; Vega-Poot, A.; García-Rodríguez, R.; Rodríguez-Gattorno, G.; Oskam, G. Charge transfer and recombination kinetics at WO3 for photoelectrochemical water oxidation. Electrochim. Acta 2017, 258, 900–908. [Google Scholar] [CrossRef]
  90. Orazem, M.E.; Tribollet, B. Electrochemical Impedance Spectroscopy; Wiley: Hoboken, NJ, USA, 2008. [Google Scholar]
  91. Ho, H.H.; Zahran, Z.N.; Chandra, D.; Katsuki, T.; Tsubonouchi, Y.; Hoshino, N.; Shiroishi, H.; Ishizaki, M.; Kurihara, M.; Chu, H.M.; et al. Highly stable and efficient photoelectrochemical water oxidation at an anisotropically crystallized monoclinic WO3 film with predominant growth of the (202) plane. J. Mater. Chem. A 2025, 13, 17898–17909. [Google Scholar] [CrossRef]
  92. Jiang, H.; Hong, J.J.; Wu, X.; Surta, T.W.; Qi, Y.; Dong, S.; Li, Z.; Leonard, D.P.; Holoubek, J.J.; Wong, J.C.; et al. Insights on the Proton Insertion Mechanism in the Electrode of Hexagonal Tungsten Oxide Hydrate. J. Am. Chem. Soc. 2018, 140, 11556–11559. [Google Scholar] [CrossRef]
  93. Lasia, A. Electrochemical Impedance Spectroscopy and Its Applications. In Modern Aspects of Electrochemistry; Kluwer Academic Publishers: Boston, MA, USA, 2002; pp. 143–248. [Google Scholar]
  94. Knöppel, J.; Kormányos, A.; Mayerhöfer, B.; Hofer, A.; Bierling, M.; Bachmann, J.; Thiele, S.; Cherevko, S. Photocorrosion of WO3 Photoanodes in Different Electrolytes. ACS Phys. Chem. Au 2021, 1, 6–13. [Google Scholar] [CrossRef]
  95. Zhu, M.; Meng, W.; Huang, Y.; Zhi, C. Proton-Insertion-Enhanced Pseudocapacitance Based on the Assembly Structure of Tungsten Oxide. ACS Appl. Mater. Interfaces 2014, 6, 18901–18910. [Google Scholar] [CrossRef]
  96. Logar, A.; Kozlica, D.K.; Vodeb, O.; Gaberšček, M.; Hodnik, N.; Strmčnik, D. Bubble Trouble: Quantifying the Effects of Bubbles on the Electrochemical Interface. ACS Catal. 2025, 15, 6380–6385. [Google Scholar] [CrossRef]
  97. Grigioni, I.; Di Liberto, G.; Dozzi, M.V.; Tosoni, S.; Pacchioni, G.; Selli, E. WO3/BiVO4 Photoanodes: Facets Matching at the Heterojunction and BiVO4 Layer Thickness Effects. ACS Appl. Energy Mater. 2021, 4, 8421–8431. [Google Scholar] [CrossRef]
  98. Resasco, J.; Zhang, H.; Kornienko, N.; Becknell, N.; Lee, H.; Guo, J.; Briseno, A.L.; Yang, P. TiO2/BiVO4 Nanowire Heterostructure Photoanodes Based on Type II Band Alignment. ACS Cent. Sci. 2016, 2, 80–88. [Google Scholar] [CrossRef]
  99. Al-Aisaee, N.; Alhabradi, M.; Yang, X.; Alruwaili, M.; Rasul, S.; Tahir, A.A. Fabrication of WO3 heterostructure photoanode by PVD for photoelectrochemical applications. Sol. Energy Mater. Sol. Cells 2023, 263, 112561. [Google Scholar] [CrossRef]
  100. Salimi, R.; Sabbagh Alvani, A.A.; Mei, B.T.; Naseri, N.; Du, S.F.; Mul, G. Ag-Functionalized CuWO4/WO3 nanocomposites for solar water splitting. New J. Chem. 2019, 43, 2196–2203. [Google Scholar] [CrossRef]
  101. Ahmed, K.; Wang, Y.; Bai, Y.; Sekar, K.; Li, W. A carbon nanowire-promoted Cu2O/TiO2 nanocomposite for enhanced photoelectrochemical performance. New J. Chem. 2022, 46, 15495–15503. [Google Scholar] [CrossRef]
  102. Kim, K.; Moon, J.H. Three-Dimensional Bicontinuous BiVO4/ZnO Photoanodes for High Solar Water-Splitting Performance at Low Bias Potential. ACS Appl. Mater. Interfaces 2018, 10, 34238–34244. [Google Scholar] [CrossRef]
  103. Noh, E.; Noh, K.-J.; Yun, K.-S.; Kim, B.-R.; Jeong, H.-J.; Oh, H.-J.; Jung, S.-C.; Kang, W.-S.; Kim, S.-J. Enhanced Water Splitting by Fe2 O3-TiO2-FTO Photoanode with Modified Energy Band Structure. Sci. World J. 2013, 2013, 723201. [Google Scholar] [CrossRef]
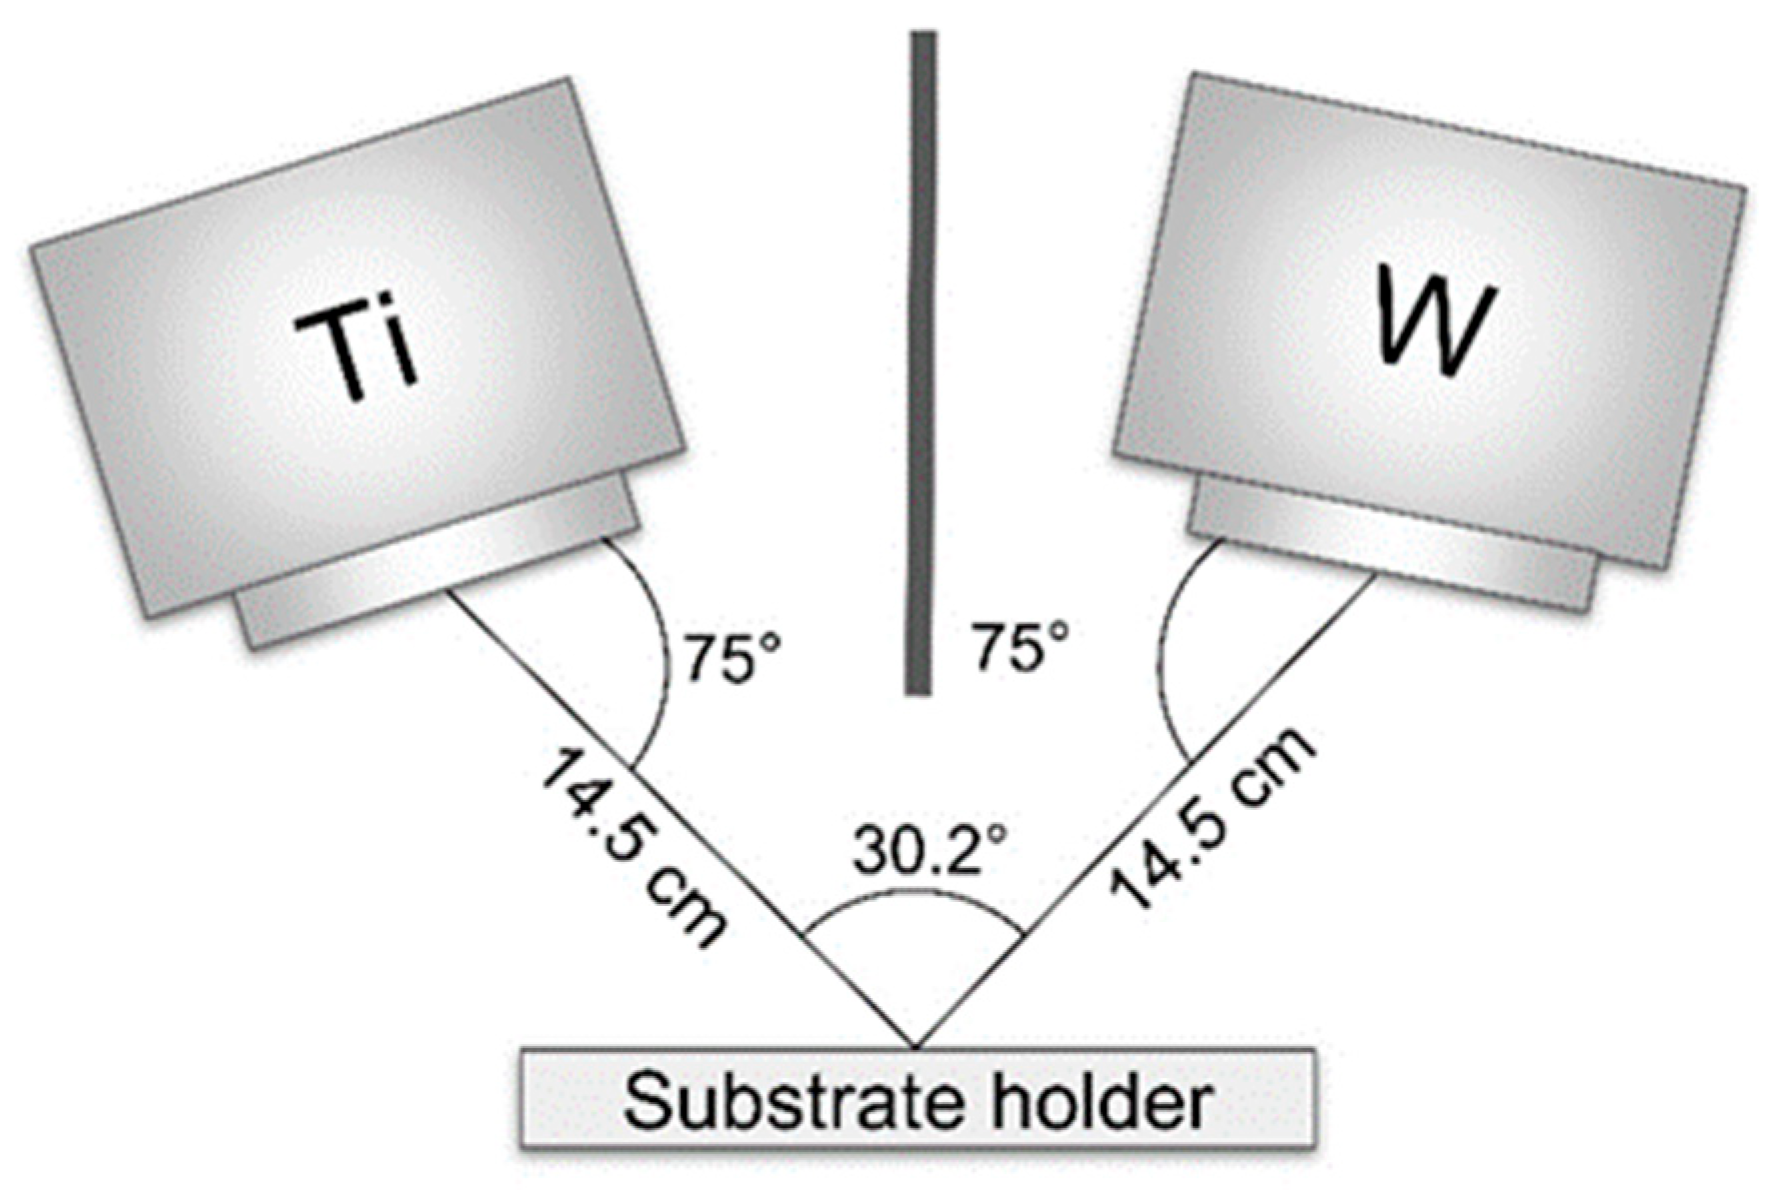
Figure 1. Schematic diagram of the DC magnetron sputtering chamber used for depositing the TiO2/WOx films.
Nanomanufacturing 05 00015 g001
Figure 2. Experimental (symbols) and fitted (lines) ellipsometric spectra of Is (black) and Ic (red) for TiO2/WOx bilayer films deposited on Si. From top to bottom, the curves correspond to WOx deposition times of 0, 5, 10, 20, and 30 min. The inset illustrates the optical model used for fitting.
Nanomanufacturing 05 00015 g002
Figure 3. Thickness of the WOx (black squares, dotted guide) and TiO2 (red squares, dotted guide) layers extracted from ellipsometric fits as a function of WOx deposition time.
Nanomanufacturing 05 00015 g003
Figure 4. Wavelength-dependent refractive index (n) derived from Forouhi–Bloomer Amorphous dispersion fits to the ellipsometric data of TiO2/WOx bilayers. Solid curves correspond to the WOx underlayer, and dashed curves correspond to the TiO2 overlayer.
Nanomanufacturing 05 00015 g004
Figure 5. Cross-sectional FE-SEM images of TiO2/WOx bilayers deposited on Si for (a) 5 min, (b) 10 min, (c) 20 min, and (d) 30 min WOx growth. Yellow arrows indicate the measured thicknesses of the TiO2 cap (upper value) and the WOx underlayer (lower value).
Nanomanufacturing 05 00015 g005
Figure 6. Top-view FE-SEM micrographs of TiO2/WOx films for WOx deposition times of 5 min (a), 10 min (b), 20 min (c), and 30 min (d). Images show pin-hole-free continuity and progressively enhanced surface texture at longer deposition times. Scale bars: 500 nm.
Nanomanufacturing 05 00015 g006
Figure 7. XRD patterns of thin films as a function of WO3 deposition time. The red circles, black solid line, and olive solid line correspond to the experimental data, Le Bail fit, and difference profile, respectively. The black, red, and blue ticks denote the Bragg positions for WOx, TiO2, and FTO phases, respectively.
Nanomanufacturing 05 00015 g007
Figure 8. Raman spectra of TiO2/WOx bilayers deposited on FTO, stacked from top to bottom for WOx sputtering times of 0, 5, 10, 20, and 30 min. The spectrum of the bare FTO substrate is shown at the bottom for reference. Magenta symbols identify the vibrational modes of anatase TiO2, while blue and red symbols highlight the characteristic bands of monoclinic γ-WO3 and FTO substrate, respectively.
Nanomanufacturing 05 00015 g008
Figure 9. (a) UV–vis–NIR transmittance spectra of TiO2/WOx films deposited with 0, 5, 10, 20, and 30 min WOx growth, and (b) corresponding Tauc plots (αhν)12 vs. photon energy with linear fits (dashed) for indirect band gap extraction. The inset shows the extracted Eg as a function of WOx deposition time.
Nanomanufacturing 05 00015 g009
Figure 10. Photocurrent voltammograms measured under (a) dark conditions and (b) simulated solar illumination (AM 1.5G) for pure TiO2 (0 min), and TiO2/WOx heterostructures with WOx layers deposited for 10 and 30 min.
Nanomanufacturing 05 00015 g010
Figure 11. Ragone plot of specific power density and specific energy density for WOx and TiO2/WOx samples, as well as the bare FTO substrate, under dark conditions and simulated solar illumination. Illumination shifts the data points to higher energy and power regions, evidencing the photo-assisted enhancement of capacitive performance. Figure adapted from Shen et al. [65].
Nanomanufacturing 05 00015 g011
Figure 12. Mott–Schottky plots (1/C2 vs V) obtained in the dark for FTO, WOx, TiO2 (0 min), and TiO2/WOx heterostructures with different WOx deposition times (5, 10, 20, and 30 min). Linear regions were used to extract flat-band potential (VFB) and carrier densities (Nd).
Nanomanufacturing 05 00015 g012
Figure 13. (a) Apparent donor density (Nd,app) and (b) flat-band potential (VFB) as a function of WOx deposition time for TiO2/WOx heterostructures. The sample with 30 min deposition exhibits the highest Nd, indicating improved conductivity.
Nanomanufacturing 05 00015 g013
Figure 14. Nyquist impedance spectra obtained in the dark for FTO, WOx, pure TiO2 (0 min), and TiO2/WOx heterostructures with different WOx deposition times (5, 10, 20, and 30 min). To aid visualization, the spectra are presented at different scales: (a) 80k/80k, (b) 10k/10k, (c) 6k/6k, and (d) 4k/4k. The inset in panel (a) illustrates the equivalent circuit models used to fit the data: Circuit I was applied for WOx, whereas Circuit II was employed for FTO, TiO2 (0 min), and TiO2/WOx heterostructures (5–30 min).
Nanomanufacturing 05 00015 g014
Figure 15. Nyquist impedance spectra obtained under solar illumination for FTO, WOx, pure TiO2 (0 min), and TiO2/WOx heterostructures with different WOx deposition times (5, 10, 20, and 30 min). To aid visualization, the spectra are presented at different scales: (a) 80k/80k, (b) 10k/10k, (c) 6k/6k, and (d) 4k/4k. The inset in panel (a) illustrates the equivalent circuit models used to fit the data: Circuit I was applied for WOx, 0 min, and 10 min samples, whereas Circuit II was used for FTO, 5 min, 20 min, and 30 min samples.
Nanomanufacturing 05 00015 g015
Figure 16. Linearization of the capacitive current difference ( i ) as a function of scan rate (ʋ) for the 30 min sample: (a) in the dark and (b) under simulated solar illumination. The slope of the linear fit corresponds to the double-layer capacitance ( C d l ), obtained from Equation (5).
Nanomanufacturing 05 00015 g016
Figure 17. Cyclic voltammograms acquired at different scan rates (10, 25, and 50 mV·s−1) for the 30 min sample under (a) dark and (b) simulated solar illumination.
Nanomanufacturing 05 00015 g017
Figure 18. Capacitive vs. faradaic decomposition (Dunn method) for TiO2 on FTO (0 min) under dark (a) and illuminated (b) conditions, and for TiO2/WOx (30 min) under dark (c) and illuminated (d) conditions, at scan rates of 10, 25, and 50 mV·s−1.
Nanomanufacturing 05 00015 g018
Figure 19. Nyquist plots at t = 0 (EIS-1), 1 h (EIS-2), and 2 h (EIS-3). Inset (I): schematic representation of the equivalent circuit.
Nanomanufacturing 05 00015 g019
Figure 20. Chronoamperogram at 0.61 V vs. RHE (AM 1.5G) for the 30 min sample: curves in the first hour (black) and in the second hour (red).
Nanomanufacturing 05 00015 g020
Table 1. Deposition parameters of the TiO2/WOx heterostructures.
Deposition ParameterValue
Residual Pressure (Torr)1.0 × 10⁻⁵
Working Pressure (Torr)3.0 × 10⁻³
WOx Layer
DC Power (W)150
ΦAr (sccm)10
ΦO2 (sccm)10
Deposition Time (min)0, 5, 10, 20, 30
TiO2 Layer
DC Power (W)300
ΦAr (sccm)10
ΦO2 (sccm)2
Deposition Time (min)30
Table 2. Mean grain size (nm) extracted from top-view FE-SEM micrographs of TiO2/WOx films with WOx deposition times of 5, 10, 20, and 30 min. Values are mean ± standard deviation.
SamplesMedium Length (nm)
5 min29.5 ± 8
10 min47.9 ± 7
20 min38.5 ± 5
30 min46.5 ± 3
Table 3. Indexed lattice parameters, density, and crystallite size of WO3 thin films obtained from XRD analysis.
WO3 Deposition
Time (min)
Structurea
(Å)
b
(Å)
c
(Å)
β
(°)
V
(Å3)
ρ
(g.cm−3)
D (nm)χ2
0TiO23.7849 ± 5-9.5744 ± 29-137.16 ± 423.87 ± 1-4.74
5WO37.3286 ± 87.5465 ± 87.5076 ± 1891.83 ± 2415.00 ± 127.42 ± 2-2.01
TiO23.7923 ± 9-9.5538 ± 2-137.40 ± 43.86 ± 1
10WO37.3266 ± 157.5159 ± 127.6781 ± 1690.39 ± 1422.79 ± 147.29 ± 236 ± 32.11
TiO23.7840 ± 10-9.5421 ± 11-136.63 ± 53.88 ± 5-
20WO37.2873 ± 27.5497 ± 37.6517 ± 490.65 ± 1420.95 ± 37.32 ± 144 ± 51.88
TiO23.8175 ± 1-9.5034 ± 6-138.50 ± 13.84 ± 1-
30WO37.3274 ± 17.5366 ± 27.7022 ± 290.67 ± 1425.32 ± 27.24 ± 341 ± 11.97
TiO23.7930 ± 6-9.5576 ± 7-137.50 ± 33.86 ± 3-
Table 4. Electronic parameters extracted from Mott–Schottky analysis: flat-band potential (VFB) and apparent donor density (Nd,app).
SamplesVFB (V)Nd,app (×1019 cm−3)
0 min1.24 ± 210.26 ± 7
5 min0.074 ± 96.37 ± 3
10 min0.29 ± 13.68 ± 3
20 min0.56 ± 23.30 ± 4
30 min0.41 ± 28.32 ± 9
WOx0.36 ± 15.34 ± 3
Table 5. Equivalent circuit fitting parameters from EIS measurements in the dark.
Samples Rs 1   ( · c m 2 ) Rp 1   ( k · c m 2 ) Rs 2   ( · c m 2 ) Rp 2   ( k · c m 2 ) CPE1CPE2Χ2
Y0 (µS·sn)nY0 (µS·sn)n
0 min22.3144--15.20.933--0.300
5 min17.383.2--17.800.940--0.135
10 min17.7013.2--25.000.918--0.233
20 min16.701.51 × 103--22.400.933--0.231
30 min13.90355--27.300.946--0.052
WOx1.4917.47.9323246.70.60462.700.9650.022
Table 6. Equivalent circuit fitting parameters from EIS measurements under AM 1.5G illumination.
SamplesRs1 ( · c m 2 ) Rp 1   ( k · c m 2 ) Rs 2   ( · c m 2 ) Rp 2   ( k · c m 2 ) CPE1CPE2Χ2
Y0 (µS·sn)nY0 (µS·sn)n
0 min20.50.6581.497.51 × 10−346.10.964111.00.8070.060
5 min16.409.15--313.00.741--0.436
10 min3.667.66 × 10−39.546.2059.00.7033400.8070.005
20 min16.4014.2--323.00.832--0.019
30 min13.78.05--3860.866--0.009
WOx6.7615.83.0415.736.50.629172.00.8950.005
Table 7. Double-layer capacitance ( C d l ) and electrochemically active surface area (ECSA). Calculated using Cs = 25, 40, 45 µF cm−2.
Samples
(Without Lighting)
Cdl (µF)ECSA (Cs = 25)
cm2
ECSA (Cs = 40)
cm2
ECSA (Cs = 45)
cm2
0 min4.17 × 10−21.67 × 10−31.04 × 10−39.26 × 10⁻³
30 min79.23.171.981.76
Samples
(With Lighting)
Cdl (µF)ECSA (Cs = 25)
cm2
ECSA (Cs = 40)
cm2
ECSA (Cs = 45)
cm2
0 min70.52.821.761.57
30 min215.18.65.374.78
Table 8. Equivalent circuit fitting parameters obtained from EIS measurements under AM 1.5G illumination after chronoamperometry.
Samples Rs   ( · c m 2 ) Rp   ( · c m 2 ) CPEΧ2
Y0 (µS·sn)n
30 min-EIS (1)11.137795.70.8670.003
30 min-EIS (2)12.53951300.8680.001
30 min-EIS (3)18.04201200.8690.009
Table 9. Comparison of representative TiO2/WOx bilayers developed in this work with state-of-the-art photoanode heterostructures reported in the literature.
SystemElectrolyteJ
(1.23 VRHE (mA·cm-2))
VFB
(VRHE)
ND/NA
(cm-3)
Reference
TiO2/WOx0.5 M Na2SO4~0.190.418.32 × 1019This work
WO3/BiVO40.5 M Na2SO4~1.0[97]
TiO2/BiVO4 (Ta:TiO2 NWs)0.5 M Na2SO4 2.1TiO2 ≈ 0.19; BiVO4 ≈ 0.08Ta:TiO2 ~1 × 10²⁰[98]
CuWO4/WO3/Ag0.5 M phosphate 0.205-0.045↑ vs. single phases[100]
WO3/Fe2O3 (nanorods, PVD/RF)0.1 M phosphate0.5880.49~9.57 × 10²⁰[99]
Cu2O/TiO2 (p–n)1 M NaOH 0.139TiO2: 0.76; Cu2O: 0.54; Cu2/TiO2
–0.72;
Cu2O: 5.36 × 10¹⁸; TiO2: 1.06 × 10¹⁹; TiO2+C-NW: 1.30 × 10¹⁹[101]
BiVO4/ZnO
(3D bicontinuous)
0.5 M Na2SO44.1[102]
Fe2O3/TiO21 M NaOH ~5.8[103]
Disclaimer/Publisher’s Note: The statements, opinions and data contained in all publications are solely those of the individual author(s) and contributor(s) and not of MDPI and/or the editor(s). MDPI and/or the editor(s) disclaim responsibility for any injury to people or property resulting from any ideas, methods, instructions or products referred to in the content.