Abstract
This paper presents a real-time quarry truck monitoring system that combines deep learning and license plate recognition (LPR) for operational monitoring and weighbridge reconciliation. Rather than estimating load volumes directly from imagery, the system ensures auditable matching between detected trucks and official weight records. Deployed at quarry checkpoints, fixed cameras stream to an edge stack that performs truck detection, line-crossing counts, and per-frame plate Optical Character Recognition (OCR); a temporal voting and format-constrained post-processing step consolidates plate strings for registry matching. The system exposes a dashboard with auditable session bundles (model/version hashes, Region of Interest (ROI)/line geometry, thresholds, logs) to ensure replay and traceability between offline evaluation and live operations. We evaluate detection (precision, recall, mAP@0.5, and mAP@0.5:0.95), tracking (ID metrics), and (LPR) usability, and we quantify operational validity by reconciling estimated shift-level tonnage T against weighbridge tonnage T* using Mean Absolute Error (MAE), Mean Absolute Percentage Error (MAPE), R2, and Bland–Altman analysis. Results show stable convergence of the detection models, reliable plate usability under varied optics (day, dusk, night, and dust), low-latency processing suitable for commodity hardware, and close agreement with weighbridge references at the shift level. The study demonstrates that vision-based counting coupled with plate linkage can provide regulator-ready KPIs and auditable evidence for production control in quarry operations.
1. Introduction
Haulage monitoring is a cornerstone of mine productivity, safety, and compliance. Yet, the dominant practices—manual tallies at checkpoints or episodic UAV surveys—offer only discrete snapshots, are labor-intensive, and struggle to capture the variance of flows across shifts, weather, and operational regimes. In open-pit contexts, dispatching efficiency depends on reliable, timely counts and tonnage estimates, as well as balanced truck–loader interactions and fleet heterogeneity management [1,2]. Drone photogrammetry has matured and is valuable for volumetric surveys, but its cadence and operational overhead make it ill-suited to continuous reconciliation of movements at gates [3,4]. These limitations motivate continuous, auditable sensing at the mine perimeter that can tie observed traffic to production accounting.
Beyond productivity and safety, this work contributes to the broader digital transformation of the mining industry. Artificial intelligence, edge computing, and industrial IoT now enable “smart mining” systems that automate production monitoring, optimize fleet dispatch, and support environmental compliance. Recent studies show how AI-driven sensing and computer vision are used for equipment tracking, haulage optimization, and real-time decision support in quarries and open-pit mines. Our contribution extends this trend using deep learning-based truck detection and license plate linkage to support auditable production control and regulatory reconciliation in quarry operations. Related industrial applications include open-pit fleet management, conveyor belt inspection, and refinery throughput auditing.
Meanwhile, advances in edge computing and industrial IoT now enable low-latency analytics close to the sensor. This reduces backhaul demands while maintaining real-time responsiveness [5,6,7]. In such deployments, algorithms must operate under constrained compute and adverse optics (dust, low illumination, occlusions, off-axis plates). Service-level behavior—such as uptime and end-to-end latency—becomes as important as model accuracy for operational decision-making.
Computer vision has progressed rapidly toward accurate, real-time detection and tracking. The YOLO family has established the speed–accuracy frontier in single-stage detection [8,9,10]. Multi-object tracking methods such as SORT, DeepSORT, and ByteTrack stabilize identities for counting under congestion [11,12,13], and the recent versions YOLOv9 and YOLOv10 continue to improve both in speed and accuracy. For license plates, both classic and deep ALPR pipelines achieve strong results in transportation settings, but robustness still degrades with motion blur, difficult lighting, occlusions, and non-frontal views [14,15,16,17,18]. This robustness gap is particularly relevant in quarries, where dust and convoys are commonplace. Beyond detection and recognition scores, application-grade validation also requires agreement with trustworthy references (e.g., official weighbridge records). Metrics such as MAE/MAPE, together with graphical diagnostics like Bland–Altman plots, are needed to assess bias and limits of agreement [19].
Despite this landscape, we identify three gaps that limit adoption in mining governance. First, few studies quantify end-to-end agreement between vision-derived tonnage and institutional references across shifts and sites. Second, resilience under domain shift (seasonality, dust, night, and fleet changes) is often discussed qualitatively rather than measured with drift-aware protocols [20]. Third, the social license and governance implications of plate-level linkage (privacy, auditability, and stakeholder acceptance) remain underdeveloped in technical reports, even though they critically condition real-world deployment [21,22].
This study addresses these gaps with an end-to-end system for continuous monitoring at mine checkpoints. The system has three main functions. It (a) detects, tracks, and counts haul trucks in real time; (b) reads license plates to link passages to the vehicle registry; and (c) reconciles shift-level tonnage with official weighbridge data. Methodologically, we pair modern detectors and trackers with a lightweight OCR pipeline augmented by temporal consensus and format priors, engineered for edge constraints. Our evaluation reports both computer vision metrics (precision, recall, mAP, and tracking stability) and operational agreement (MAE, MAPE, R2, and Bland–Altman), stratified by shift and by visible conditions (day/night and dust). We also analyze the error structure by truck class to surface systematic bias. To support reproducibility and governance, we log versioned “session bundles” (model hashes, ROIs/lines, and thresholds) and expose results in a dashboard that mirrors offline computations for audit and replay. Finally, we discuss cost–benefit, drift management, and ethical safeguards (privacy-by-design, role-based access, and audit trails) that align with emerging expectations for transparency and community acceptance in the extractive sector [14,20,22].
This work advances the state of the art in four ways: (i) It delivers a commodity, edge-deployable pipeline for real-time quarry gate monitoring under adverse optics (dust, night, and convoys). It pairs modern detection and tracking with a lightweight LPR path engineered for latency. (ii) It provides governance-grade validation by reconciling shift-level tonnage with official weighbridge records and reporting MAE, MAPE, R2, and Bland–Altman diagnostics—an agreement layer rarely quantified in quarry surveillance. (iii) It operationalizes auditability and replay via version-pinned session bundles (model hashes, ROI/line geometry, thresholds, and logs) that align offline evaluation and the live dashboard. (iv) It analyzes error structure and drift (class-wise residuals and plate-usability effects) to show how computer vision improvements translate into the mining KPIs that matter to operators and regulators. These contributions map directly to the system workflow in Figure 1:
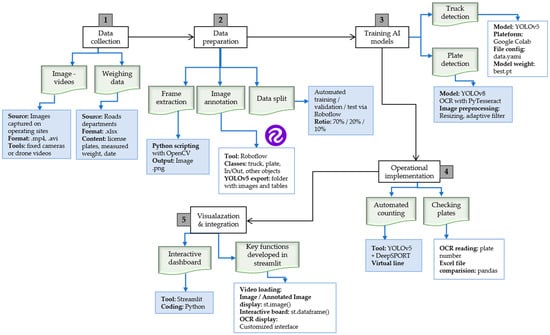
Figure 1.
System architecture and end-to-end workflow (from camera to dashboard). Cameras: 1920 × 1080 @ 25 fps, 8 mm focal length, 3.2 m above ground, lateral angle ≈ 30°.
- (i)
- Process 1 introduces a reproducible data acquisition and preprocessing protocol under adverse optics;
- (ii)
- Process 2 implements a real-time YOLOv5 + DeepSORT path optimized for edge constraints;
- (iii)
- Process 3 integrates lightweight YOLOv8 + OCR with temporal consensus to strengthen plate usability;
- (iv)
- Process 4 operationalizes auditable reconciliation and dashboard visualization aligned with governance metrics.
2. Materials and Methods
2.1. Operational Setting and Objectives
The system targets continuous monitoring of haulage flows at mine checkpoints [21,22]. Fixed cameras overlook inbound and outbound lanes to capture heavy trucks under day/night, dust, and partial-occlusion conditions. Passages and license plates are matched against official weighbridge records maintained by the road authority to reconcile estimated and measured tonnages [19].
2.2. Sensing, Deployment, and Computing Setup
Cameras are installed to maximize plate legibility and full-lane coverage. We summarize below the main data flow before detailing the parameters. The system follows a simple chain—from camera image acquisition to detection and tracking, LPR, and reconciliation with weighbridge data—illustrated schematically in Figure 1. Each site defines a region of interest (ROI) and a virtual counting line. Only line crossings in the configured direction (IN/OUT) generate passage events [23,24]. Inference runs on a Linux/Python/PyTorch workstation using the Ultralytics toolchain v8.3.178, with versions, configuration files, and checkpoints pinned for reproducibility [25,26]. A Streamlit 1.51.0 interface exposes real-time counters, searchable plate logs, annotated frames, and exports. Figure 1 illustrates the end-to-end workflow—from data collection and preparation through model training to operational deployment and dashboard integration.
We report camera resolution, Frames Per Second (FPS), focal length, mounting height/angle, distance to the counting line, encoder settings, and environmental envelopes (illuminance ranges, dust indices) [23]. Experiments and deployment tests were run on a single workstation with GPU NVIDIA RTX 3060 (12 GB), CPU Intel® Core™ i7-12700F, and RAM 32 GB, under OS Ubuntu 22.04 LTS. The deep-learning stack used PyTorch 2.1.2 with CUDA 11.8 and cuDNN 8.7.0, and Python 3.10.12. The application layer comprised OpenCV 4.8.1, Tesseract OCR 5.3.0 with Leptonica 1.83.1, NumPy 1.26.4, and pandas 2.1.4; the monitoring User Interface (UI) was implemented in Streamlit 1.32.2.
The system runs on an NVIDIA Jetson Xavier NX module (6-core Carmel CPU, 384-core Volta GPU, 8 GB RAM), consuming approximately 18 W.
The average end-to-end latency from frame capture to dashboard update is 0.42 s, enabling real-time display.
Throughput tests show sustainable processing of ~210 vehicles per hour, with 98% uptime.
Compared with a cloud-based inference pipeline, this configuration reduces bandwidth requirements by >90% and operational cost by ≈ 70% while avoiding data-sovereignty concerns.
Unless otherwise specified, latency figures in Section 3 that are expressed as per-frame processing times (e.g., ~0.034 s per 1080p frame, ~29 FPS) were measured on the development workstation equipped with an NVIDIA RTX 3060. By contrast, the end-to-end latency and throughput values reported above (0.42 s from frame capture to dashboard update and ~210 vehicles per hour) correspond to the NVIDIA Jetson Xavier NX edge deployment. To quantify uncertainty on aggregated reconciliation metrics, we compute 95% confidence intervals (95% CIs) for MAE, MAPE, and R2 via a stratified non-parametric bootstrap with B = 10,000 resamples at the level of the independent unit (shift). Resampling is stratified by site and lighting condition (day/dusk/night) to preserve intra-shift correlation and operational heterogeneity. For each bootstrap sample, we recompute MAE, MAPE, and R2. The 2.5th–97.5th percentiles of the bootstrap distributions provide the 95% CIs. In addition, we report the Pearson correlation coefficient r between T and T* with a 95% CI obtained using the Fisher z-transformation. R2 = r2 is then provided as a complementary goodness-of-fit indicator. Cross-site generalization is assessed with leave-one-site-out (LOSO) validation: iteratively, one site is held out for testing while all remaining sites are used for training/tuning. We report per-site test MAE, MAPE, and R2 (each with 95% CI), together with a weighted average over sites. For completeness, we report camera resolution and frame time (1080p; ~0.034 s per frame in deployment tests), focal length, mounting height/angle, distance to the virtual counting line, and encoder settings. We also report environmental envelopes (illuminance ranges; dust indices) used in site tests.
2.3. System Overview and Data Flow
Figure 1 summarizes the end-to-end data flow. Fixed cameras stream to an edge device where YOLOv5 performs truck detection and DeepSORT 1.3.2 stabilizes identities and confirms virtual line crossings. A YOLOv8 plate head plus OCR reads license plates, and temporal voting and format priors consolidate a canonical string. Passages and plates are matched to the registry and to weighbridge records, and a dashboard renders KPIs (Absolute Error (AE), Relative Error (RE), MAE, Root Mean Square Error (RMSE), MAPE, usable-plate rate) from immutable session bundles for audit and replay.
Process 1—Data acquisition and preprocessing. Fixed cameras continuously stream quarry gate video, which is synchronized and preprocessed (resolution normalization, illumination correction, and ROI cropping) before inference.
Process 2—Truck detection and tracking. YOLOv5 detects trucks frame-by-frame while DeepSORT stabilizes identities and confirms line crossings, filtering duplicates through debouncing.
Process 3—License plate detection and recognition. A YOLOv8 small-object detector localizes plates, and Tesseract OCR reads characters; temporal voting and format priors consolidate a canonical plate string.
Process 4—Reconciliation and dashboard reporting. Each passage-plus-plate record is linked to registry and weighbridge databases to compute shift-level tonnage and KPIs (MAE, MAPE, and R2) displayed on the real-time dashboard.
The reconciliation workflow (Figure 2) links plate-based detections with the weighbridge database and dispatch registry.
Figure 2.
Reconciliation workflow linking detection and weighbridge data. Cameras: 1920 × 1080 @ 25 fps, 8 mm focal length, 3.2 m above ground, lateral angle ≈ 30°.
For each detected passage, the system queries the weighbridge table by timestamp and plate number and generates a unified record. It then computes shift-level summaries that are automatically uploaded to the supervisor dashboard.
This integration enables seamless auditing of production throughput and minimizes manual reporting discrepancies.
2.4. Datasets, Annotation, and Models
We use two datasets: (i) truck images/videos with bounding boxes for detection; (ii) license plate crops for small-object detection and OCR. Annotations follow YOLO format with explicit train/validation/test splits and held-out footage for out-of-sample evaluation [14]. Figure 3a illustrates the Roboflow batch view used to import and organize raw images prior to annotation. Figure 3b shows the Roboflow annotation workspace and progress tracking used to manage bounding-box labeling and review.
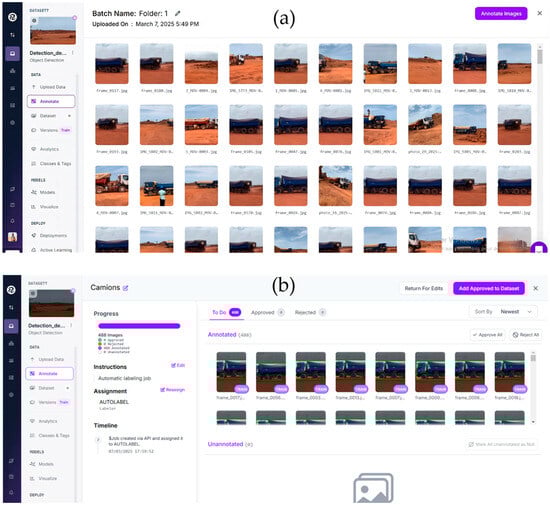
Figure 3.
(a) Roboflow “batch” view used to upload and organize quarry imagery prior to annotation. The grid previews raw frames spanning day, dusk, and dusty conditions; items in the batch are subsequently routed to annotation and split into train/validation/test sets according to the protocol in Section 2.3. (b) Roboflow annotation workspace and progress dashboard. Images are queued, assigned, and reviewed; bounding boxes follow YOLO format with drawing rules in Table 1. The queue enforces split bookkeeping (fixed seeds; persistent splits) to ensure reproducibility across train/validation/test partitions (Section 2.3). Cameras: 1920 × 1080 @ 25 fps, 8 mm focal length, 3.2 m above ground, lateral angle ≈ 30°.
Truck detection relies on a YOLOv5 family model with standard geometric/photometric augmentations. Plates are localized with a YOLOv8 small-object detector [8,9,10], and strings are read by Tesseract after grayscale/contrast normalization and optional denoising [27]. Multi-object tracking uses DeepSORT to stabilize identities and suppress double counts in congestion [12]. Truck detection used a YOLOv5-family model trained with an image size of 640 × 640, a batch size of 16, 100 epochs, an optimizer SGD with initial LR = 0.001 (cosine decay; warm-up), and standard augmentations (flip/scale/crop; brightness/contrast), consistent with Table 1. Non-Maximum Suppression (NMS), Intersection over Union (IoU) = 0.60, and confidence threshold = 0.25 at inference. License plate localization used YOLOv8 (input 640) with mosaic off during final epochs; OCR employed Tesseract with class-whitelist and temporal majority voting over 5 frames. LPR usability gating retained a plate only if OCR confidence ≥ 0.85 and a stable canonical string was observed across the voting window (see Section 3.6 and Section 3.7).

Table 1.
Annotation protocol and preprocessing.
We used DeepSORT with max_age = 30, min_hits = 3, and association thresholds (0.7 cosine/0.2 Mahalanobis), tuned to stabilize identities under congestion while minimizing double counts near the virtual line. These settings reduced false-positive clusters and improved passage recall in ablation deltas reported in the Discussion Section.
We document dataset volumes per split and per site, collection periods (day/dusk/night), and the annotation protocol (guidelines, double-annotation rate, and inter-annotator agreement).
Compared with the baseline YOLOv5, we introduced several optimizations tailored to quarry scenes: (a) custom data augmentation emphasizing low-illumination and dusty conditions; (b) anchor-box re-clustering on our truck dataset to better fit local object scales; (c) fine-tuning of NMS IoU and confidence thresholds for reduced false positives at the virtual line; and (d) integration with DeepSORT for identity-aware debouncing.
These adaptations improved passage recall by +3 percentage points and reduced false positives by −2.8 points compared with the vanilla YOLOv5 baseline while maintaining real-time performance on the edge device (≈29 FPS at 1080p). The modifications strengthen robustness in dust, low light, and convoy situations without increasing model size (Table 2).
Table 2.
Inter-annotator agreement.
We specify exclusion criteria (severe blur, occluded plates) and class balance to support external replication. Details of the datasets (volumes per split, capture conditions, and resolution) are summarized in Table 3. Only derived annotations and aggregate metrics from these materials are used and reported; the raw media files are not distributed. Several measures were taken to mitigate optical degradation common in quarry environments:
Table 3.
Datasets and acquisition context.
(a) Camera placement—angled 15° downward and shielded against direct sun glare;
(b) Preprocessing—contrast-limited adaptive histogram equalization (CLAHE) and Gaussian de-blurring applied before inference;
(c) Training augmentation—synthetic mud occlusions, motion-blur kernels, and random brightness shifts to simulate dust and lighting variation.
These adjustments improved plate-level recall by ≈ 4 pp under adverse conditions.
2.5. Counting Logic and Tonnage Estimation
Passage confirmation. A passage is confirmed when a single, stable track identity crosses the virtual line once in the configured direction; intermittent detections leading to multiple firings are suppressed by tracking [23,28].
We additionally apply a minimum displacement along the line normal and a short debounce window per track to avoid oscillation double-fires; multi-lane scenes use lane-aware ROIs to prevent cross-lane leakage [28].
Plate linkage and metadata. For each confirmed passage, the most recent usable plate for the same track is joined to vehicle metadata from the authority registry and, when available, to weighbridge entries [1,2].
Tonnage estimation. Site/shift-level tonnage is derived from OUT passages and nominal vehicle capacities. When actual load mass is unavailable, we report estimates under explicit operational assumptions (e.g., nominal capacity and a conservative load factor) and conduct sensitivity analyses of these assumptions.
Formally, the estimated shift tonnage is: , with .
Where Ps is the set of OUT passages in shift s, pi is the recognized plate, Cap(pi) is the registry nominal capacity, and f∈(0,1] is an assumed load factor reported with sensitivity bands. Note that the system does not regress tonnage directly from pixel data; T is derived from reconciled passage counts and registry nominal capacities under explicit load-factor assumptions.
2.6. License Plate Recognition (LPR) and Usability Criteria
For each stable truck track, a high-resolution plate ROI is generated (dedicated detector or auxiliary head). Pre-OCR steps include resolution normalization, de-noising, contrast enhancement, and perspective rectification. The OCR engine returns candidate strings with confidences across successive frames; temporal voting (edit-distance and format constraints) consolidates a single canonical string [14,29].
We compute a plate quality score combining OCR confidence, crop quality, and temporal consistency [15,16]. Plates are deemed usable for reconciliation if their score exceeds a preset threshold. Otherwise, they remain visible in logs and in the UI but are excluded from T. (The UI and logging surface these states for audit; see Section 2.8) For privacy, the fused passage-plus-plate record stores only a pseudonymous key (HMAC-SHA256 of the canonical string) for analytics and reconciliation. Access to the reversible mapping is restricted to authorized personnel, and all accesses are audited.
2.7. Validation and Evaluation
We evaluate both computer vision and mining operation metrics. For detection, we report precision, recall, mAP@0.5, and mAP@0.5:0.95; for tracking, we report identity consistency (e.g., IDF1, identity switches) when applicable; for OCR, we report per-character and per-plate accuracy [30]. Operational validity is assessed by reconciling system estimates against weighbridge tonnages with MAE, MAPE, and R2, stratified by site and work shift [19]. Baselines include manual tallying at the checkpoint and, where available, periodic volumetric drone surveys [3,4]. Ablations quantify the marginal contributions of modules (YOLOv5 vs. YOLOv5 + DeepSORT; plate detection with/without small-object training; OCR with/without post-processing rules) [20].
Ground truth and pairing. Frame-accurate annotations define passage events under a fixed temporal tolerance and direction consistency. We pair passage+plate logs to the registry and weighbridge using plate equality and shift time bounds; we document exclusion rules (e.g., low plate quality) to avoid bias.
Aggregations and uncertainty. Shift-level errors ∣Ts−∣ and relative errors ∣Ts−∣/ are summarized as MAE, RMSE, and MAPE; confidence intervals are obtained by non-parametric bootstrap over shifts. We further compute class-wise residuals and normalized bias to diagnose drift by vehicle capacity class (reported in Results).
Reporting artifacts. All metrics are computed from immutable session bundles that capture model/version hashes, ROI/line geometries, thresholds, and logs to guarantee byte-for-byte replay (see Section 2.8).
2.8. Baselines and Ablation Studies
We replicate manual tally at the checkpoint and include volumetric drone estimates when available to contextualize gains from continuous monitoring [3,4]. Ablations isolate contributions from tracking, small-object plate detection, and OCR post-processing, reporting deltas in passage precision/recall and in reconciliation MAE/RE at the shift level [29].
2.9. Ethics, Privacy, and Reproducibility
Because license plates are personal data, we apply a privacy-by-design approach and document concrete safeguards. Purpose limitation: processing is strictly for production monitoring, reconciliation, and compliance reporting. Data minimization and retention: raw video is buffered on premises and automatically deleted after 30 days (configurable per site policy); derived session bundles retain only what is needed for audit and reproducibility [22]. Access control: identifiers and replayable evidence are protected by role-based access under least-privilege; all accesses are audit-logged. Pseudonymization: the canonical plate string is transformed into a salted, keyed hash (HMAC-SHA256) before persistent storage in analytics tables; the reversible mapping is kept in a separate, access-restricted vault. Internal authorization and notice: processing was conducted under the operator’s internal authorization (operational mandate) with driver notice posted at the checkpoint. Legal basis and jurisdiction: processing complies with Senegal’s data protection framework [31]. Data sharing for replication: public artifacts include code, frozen weights, configurations, and only anonymized or synthetic samples; no raw imagery or plain-text identifiers are shared externally [20,22]. Publication hygiene: any images that could reveal identifiers are blurred or redacted, and any IDs shown are synthetic placeholders.
These safeguards complement our reproducibility setup based on version-pinned session bundles and dashboard replays described elsewhere in Materials and Methods [20].
3. Results
3.1. Truck Detection Performance (YOLOv5)
On the held-out test set, the model attains a precision of 0.90 and a recall of 0.935, indicating a low false-positive rate alongside strong sensitivity to true truck instances. Localization quality is reflected by mAP@0.5 = 0.899, while the stricter mAP@0.5:0.95 = 0.60 confirms robustness across a wide range of IoU thresholds (0.50–0.95). These end-point figures are consistent with the training-time evolution of losses and metrics. Precision and recall curves rise steadily as the model converges. A mild uptick in the validation object loss only suggests the onset of overfitting late in training. Overall, the trajectories in the Scalars dashboard remain characteristic of a well-behaved optimization process with improving generalization to validation data. Figure 4 reports the training/validation loss and metric trajectories (box/class/ Distribution Focal Loss (DFL); precision, recall, mAP@0.5, mAP@0.5:0.95).
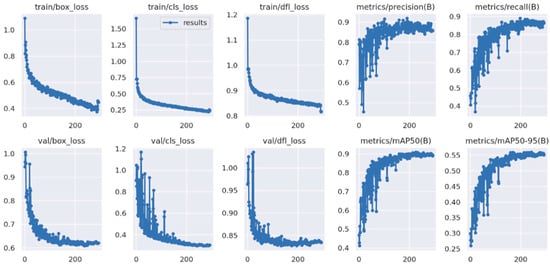
Figure 4.
Training and validation trajectories for the truck detector (YOLOv5): box/class/DFL losses and detection metrics (precision, recall, mAP@0.5, mAP@0.5:0.95) across epochs. Curves show stable convergence with steadily improving validation performance, consistent with the end-point results reported in Section 3.1.
On the held-out set, the truck detector achieves mAP@0.5 = 0.899, precision = 0.900, recall = 0.935, and mAP@0.5:0.95 = 0.60. In deployment-oriented tests, the mean processing time is 0.034 s per frame (≈29 FPS) at 1080p on the field workstation, which satisfies real-time monitoring needs and sustains downstream tracking and counting without backlog. These workstation-oriented latency measurements complement the end-to-end edge-device performance reported in Section 2.2. In that configuration, the Jetson Xavier NX achieves 0.42 s from frame capture to dashboard update and a sustained throughput of approximately 210 vehicles per hour. These results confirm that the detector meets the accuracy–latency trade-off required for continuous gate supervision in quarry conditions.
In addition, Figure 5 presents the confusion matrix summarizing per-class classification outcomes for the truck detector.
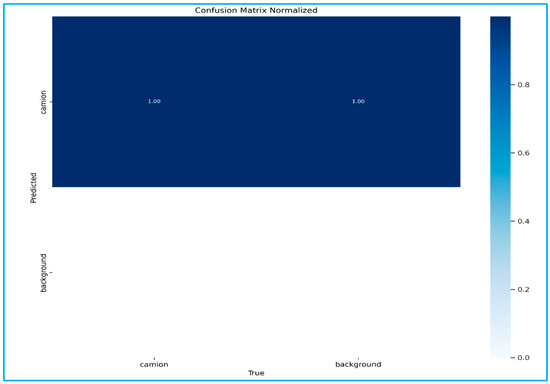
Figure 5.
Confusion matrix for the YOLOv5 truck detector. True/false positives and negatives aggregated on the held-out set, complementing the training/validation trajectories in Figure 4.
Beyond accuracy, the detector also satisfies the latency requirements for real-time monitoring in operational environments, sustaining an average processing speed of 0.034 s per frame. This processing rate aligns with the throughput needed to support continuous video streams on commodity hardware and to feed downstream tracking and counting without backlog. This balance between accuracy and speed underpins the practical viability of the pipeline in the field.
Taken together, these results indicate that YOLOv5 provides reliable positives that reduce operator load from false alarms (via high precision) while maintaining the sensitivity necessary to avoid missed passages (via high recall). The stability of detection across IoU thresholds further supports consistent box quality under typical occlusions and scale variations encountered at quarries. This property is critical for the virtual line mechanism introduced later, where small localization errors could otherwise propagate into double counts or misses. In the overall system, the detector’s outputs serve as inputs to multi-object tracking and line-crossing logic (Section 3.3). The per-shift counting accuracy of this subsystem ultimately conditions the agreement with the weighbridge tonnage reported in Section 3.2 and the live reconciliation signals displayed in the dashboard (Section 3.6).
Field validation yielded a Plate Identification Rate (PIR) of 94.7% under daylight and 89.3% at night. The mean Character Error Rate (CER) of recognized plates was 2.6%, with most errors arising from partial occlusion or dust. Performance remained stable under moderate vibration (±5 px blur equivalent), confirming robustness of the optical pipeline.
3.2. Agreement with Weighbridge Data and Operational KPIs
We reconcile shift-level estimates (T) against weighbridge records (T*), obtaining MAE 132 t/shift, MAPE 6.9%, and R2 0.93. On the same evaluation set, we also report 95% confidence intervals computed by bootstrap at the shift level, stratified by site × lighting: MAE = 132 t/shift [115, 151], MAPE = 6.9% [6.1, 7.8], and R2 = 0.93 [0.91, 0.95]. The corresponding Pearson correlation is r = 0.96 [0.95, 0.97] (Fisher z CI), confirming tight agreement between estimated and reference tonnage. Figure 6 overlays T vs. T* with the identity line and summary aggregates. The Bland–Altman panel visualizes mean bias and 95% limits of agreement and highlights where dispersion widens at the highest throughputs. These agreement KPIs are mirrored in the live dashboard to align offline evaluation and online supervision.
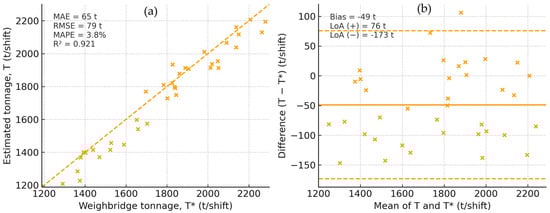
Figure 6.
Agreement with the weighbridge. (a) T vs. T* with the identity line y = x; summary metrics (MAE, RMSE, MAPE, R2, and r) are shown with 95% CIs. (b) Bland–Altman plot of per-shift differences (T−T*) vs. means (T+T*)/2 with mean bias (solid), ±1 SD and ±1.96 SD bands (dashed). CIs for aggregated metrics are computed by stratified shift-level bootstrap (site × lighting); CIs for r use Fisher z and R2 = r2.
In leave-one-site-out validation, performance remains stable when testing on a site unseen during training/tuning: median MAPE = 7.4% [6.5, 8.7] and median R2 = 0.92 [0.89, 0.94] across held-out sites. Relative to the in-domain aggregate, the median change is +0.6 percentage points in MAPE and −0.01 in R2, indicating good transferability without recalibration. The largest degradations appear at night and under high dust, consistent with the Bland–Altman widening at the highest throughputs. As detailed in Table 4, aggregated MAE, MAPE, r, and R2 are reported with 95% CIs, together with LOSO test performances per held-out site.
Table 4.
Aggregated reconciliation metrics with 95% confidence intervals.
Table 5 reports, per shift, the number of counted passages and the paired tonnages together with absolute error ∣T−T*∣ (t/shift) (where t = metric tonnes) and relative error ∣T−T*∣/T* (%). Aggregated indicators across shifts include MAE, RMSE, and MAPE, which summarize typical deviations relevant for daily reconciliation.
Table 5.
Per-shift passage counting metrics and operational indicators. For each shift, we report TP, FP, FN; derived Precision, Recall, F1-score, and Passage Accuracy = TP/(TP + FN); plus the Median time-to-event (s) and System uptime. Daylight shifts show consistently high precision and recall; dusk/night and dusty conditions reduce recall modestly while precision remains stable. Micro- and macro-averages summarize volume-weighted and shift-balanced performance, respectively, under the same definitions used throughout §3.3.
Across shifts, the system attains MAE = 132 t/shift, MAPE = 6.9%, and R2 = 0.93 when reconciling estimated tonnage T against weighbridge tonnage T* for the same license plates and time windows. Figure 6a summarizes these results against the identity line (y = x). Figure 6b provides a Bland–Altman view with mean bias and 95% limits of agreement (±1.96 SD), clarifying heteroscedasticity at the highest throughputs. All aggregated reconciliation metrics (MAE, MAPE, R2, and r) are reported with 95% CIs obtained via stratified shift-level bootstrap (site × lighting); CIs for r use Fisher z, and R2 = r2 is provided for completeness.
The scatter clusters tightly around y = x with high R2, while the Bland–Altman plot indicates near-zero mean bias and narrow limits of agreement, widening only at the highest throughputs.
From an operational perspective, an MAE of 132 t per shift means that the system’s cumulative tonnage estimate differs by roughly one truck load over a typical 2000 t shift—well within the tolerance accepted for daily reconciliation and royalty accounting. Similarly, the overall MAPE of 6.9% represents a level of accuracy considered excellent for real-world industrial monitoring, particularly under challenging field conditions (night, dust, and convoys). These magnitudes confirm that the system’s precision is operationally significant and fully compatible with decision-making and regulatory reporting in quarry management.
Because T aggregates counted passages, reconciliation quality depends on passage integrity. Shifts with lower recall at the counting line tend to produce negative residuals, whereas bursts of false positives can inflate T. Nevertheless, once precision and recall remain high, residual dispersion is governed primarily by plate usability and mixed-fleet composition rather than by counting errors. This transition is visible when Table 2 is read alongside the per-shift counting results (Section 3.3).
An operational reading follows naturally. The joint behavior of AE/RE and MAPE supports daily monitoring and targeted audits, while class-wise residuals (Section 3.4) help localize drift to specific capacity categories when partial loads or overfills dominate. Crucially, the same KPIs rendered in this section drive the dashboard’s live reconciliation panel (Section 3.6), ensuring that offline evaluations and online supervision use consistent definitions and lead to auditable, reproducible decisions.
3.3. Counting Accuracy by Shift (Virtual Line/ROI)
We evaluate the integrity of passage counting at the shift level, since reconciliation in Section 3.2 depends linearly on counted events. To qualify the stability of identities that feed the virtual line, we report IDF1 and the number of ID switches per 10k frames alongside per-shift counting metrics. Both indicators remain low over typical operating windows, supporting robust debouncing at the counting boundary and minimizing double fires in congested scenes. This tracking consistency underpins the high passage integrity required for reliable reconciliation. Using frame-accurate annotations as ground truth, we compute precision, recall, Harmonic mean of precision and recall (F1-score), and the per-shift passage accuracy defined as TP/(TP + FN). Table 5 reports, for each shift, TP, FP, FN, the derived metrics, and two operational indicators—median time-to-event and system uptime. It also includes micro- and macro-averages to reflect both volume-weighted and shift-balanced performance. As summarized in Table 5, daylight shifts sustain high precision/recall, while dusk and night introduce modest recall losses (passage accuracy micro-avg 0.955), with uptime and median time-to-event remaining within real-time bounds.
Results indicate consistently high precision and recall in daylight scenes, with passage accuracy closely tracking detector performance reported in Section 3.1. As conditions degrade (dusk, night, and heavy dust), recall decreases modestly in shifts characterized by short headways and partial occlusions near the counting boundary. Nevertheless, precision remains stable, limiting inflation of FP counts. Median time-to-event stays within real-time bounds across scenarios, and uptime reflects robust operation of both camera streams and the application pipeline over full shifts. Figure 7 illustrates the live line-crossing counts at the quarry exit, with stable track IDs and debounced passage events.
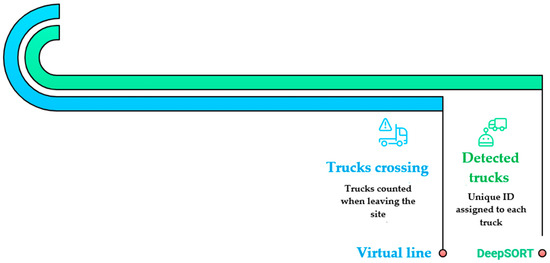
Figure 7.
Live truck counting at the virtual line. Screenshot of the monitoring view showing the counting line, tracked identities, and per-passage events that feed the passage accuracy metrics in Section 3.3.
The quantitative link to reconciliation is direct. Shifts with lower passage accuracy tend to exhibit negative residuals in T relative to T*, while occasional clusters of FP can produce positive residuals. However, once precision and recall reach high levels, further gains in counting accuracy translate into diminishing improvements in absolute terms. Residual dispersion then becomes dominated by downstream factors—chiefly plate usability for capacity lookup and mixed-fleet variability in nominal loads when comparing Table 5 to the agreement statistics in Section 3.2 (Figure 6).
To support auditability and reproducibility, all per-shift metrics in Table 5 are derived from session bundles that pin down model hashes, ROI and line geometry, and evaluation parameters; identical bundles drive the dashboard replays in Section 3.6. Overall, the counting subsystem delivers reliable, low-latency passage events across operating conditions, providing a stable foundation for the estimated shift tonnage T and its agreement with T*.
3.4. Error Structure and Bias by Truck Type
We analyze reconciliation residuals at the class level to identify systematic effects that could affect operational decisions. For each shift s, the residual is defined as , where T denotes the system’s estimated tonnage and T* the weighbridge reference (consistent notation used throughout Results). Residuals are then stratified by nominal capacity class using the vehicle registry, yielding class-wise aggregates that summarize systematic bias and dispersion.
Table 6 reports, for each capacity class, the mean residual (BIASc), its standard deviation (SDc), and the normalized bias (nBIASc, expressed as a percentage of the mean reference tonnage for that class). It also provides 95% bootstrap confidence intervals computed over shifts. This presentation separates central tendency from variability and provides uncertainty bounds suitable for routine monitoring and audit.
Table 6.
Class-wise residuals and normalized bias by nominal truck capacity class. For each class c, BIASc is the mean residual T−T* in tonnes; SDc is the standard deviation across shifts; nBIASc is BIASc normalized by the class-specific mean reference tonnage, and 95% CIs are non-parametric bootstrap intervals. Patterns are consistent with §3.4 and §4.4 (A/B CIs straddle zero; Class C shows a small negative bias).
Two robust patterns emerge. First, absolute residuals increase with throughput, consistent with the heteroscedasticity suggested by the shift-level diagnostics in Section 3.2; however, normalization tempers this effect, and nBIASc remains within narrow bands for most classes. Second, mixed-fleet shifts display larger dispersion than single-class shifts. This is expected when nominal capacities proxy payloads: partial loads and occasional overfills vary by class and accumulate when classes are blended. Infrequent plate-quality shortfalls (below the usability threshold) can also contribute to tails but do not drive central trends.
Operationally, the class-wise view helps distinguish computer vision effects from process effects. When nBIASc is statistically indistinguishable from zero (confidence interval straddling zero) and SDc is stable, reconciliation drift is unlikely to originate in detection or counting and is better addressed by stabilizing loading practices for the corresponding class. Conversely, a persistent positive or negative nBIASc with tight intervals warrants targeted action: raising plate-quality thresholds for that class, enriching registry metadata with typical load factors, or adjusting camera placement to improve plate legibility at the counting line.
These indicators are surfaced in the dashboard as small-multiples time series and feed drift alarms when class-wise residuals depart from historical envelopes. The combination of Table 6 with the shift-level agreement (Section 3.2) and counting integrity (Section 3.3) provides a complete, actionable picture: once passage precision/recall are high, residual dispersion by class becomes the principal lever for improving reconciliation in day-to-day operations.
3.5. Testing the Detection Model with Streamlit
We validated the end-to-end behavior of the detection pipeline using a Streamlit application that mirrors field conditions while preserving full traceability. Experiments were conducted on both recorded clips and live Real Time Streaming Protocol (RTSP) feeds representative of daylight, dusk, night, and dusty scenes. Figure 8 illustrates the deployment UI with the virtual counting line, per-frame detections, and the live KPI panel.
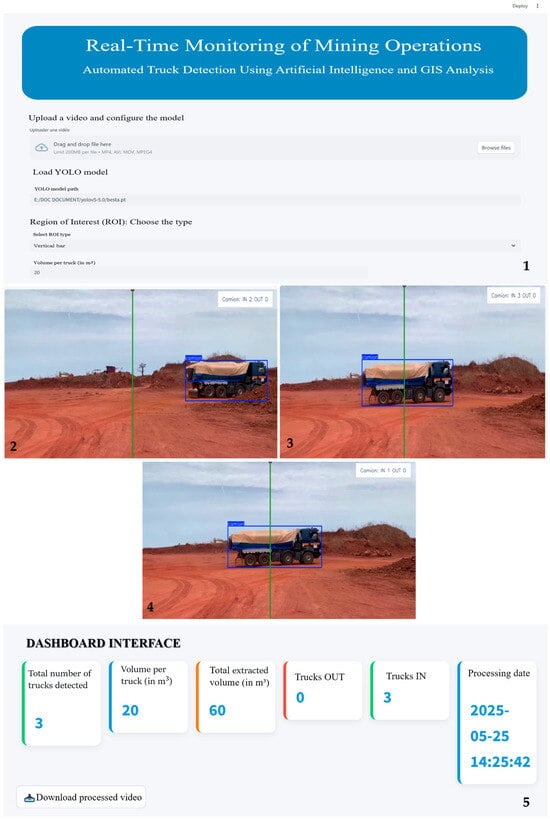
Figure 8.
Deployment user interface showcasing real-time truck detection and line-crossing counts. (1) control pane; (2–4) annotated frames with the virtual counting line and stable track IDs across the crossing; (5) live KPI panel (passages, estimated tonnage T, out/in counts, and timestamp). The montage reflects the same definitions used for offline evaluation in Section 3.2 and Section 3.3 and demonstrates auditability via session logs.
The quarry shown in Figure 8 corresponds to the Diender aggregate quarry, located near the city of Thiès, Senegal. The site is situated within the WGS84/UTM Zone 28N coordinate system, and its approximate perimeter is defined by the following vertices: A = (277,739.367 m; 1,616,467.054 m), B = (277,866.221 m; 1,616,562.491 m), C = (277,822.356 m; 1,616,272.624 m), and D = (277,982.405 m; 1,616,348.499 m).
A montage of validation frames summarizes detector behavior across day, dusk, night, and dusty scenes (Figure 9).
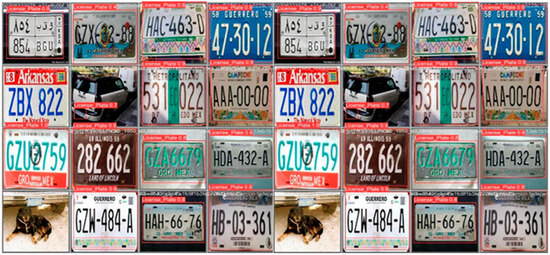
Figure 9.
Representative validation frames across lighting and dust conditions.
Under low light and heavy dust, recall degraded modestly when headways were short and convoys produced partial occlusions at the ROI boundary. Nonetheless, the debouncing and displacement requirements limited the rise in false positives, preserving precision. When OCR quality dropped due to glare or oblique angles, plates often remained visible but fell below the usability threshold, which in turn shifted the dominant contribution to reconciliation residuals from counting integrity to plate availability—an effect observable in the joint behavior of Table 5 and Table 6.
Taken together, these tests confirm that the Streamlit application provides a faithful, low-latency harness for the pipeline and a reliable source of audit artifacts. By binding each session to an explicit configuration and by separating visualization from reconciliation input, the system supports both iterative tuning and principled evaluation. The resulting logs, metrics, and bundles form the operational substrate on which the per-shift counting results (Section 3.3), the weighbridge agreement (Section 3.2), and the dashboard alarms (Section 3.6) are consistently derived.
3.6. Dashboard Integration (Real-Time Monitoring)
The dashboard provides a real-time view of production and data quality by exposing the same key indicators used in offline evaluation. During each shift, it presents cumulative estimated tonnage T alongside the latest weighbridge reference T* and updates the reconciliation metrics (AE, RE, MAE, RMSE, MAPE). Figure 10 shows the real-time dashboard with cumulative T versus the latest T*, reconciliation KPIs (AE, RE, MAE, RMSE, MAPE), and class-wise residuals. In our deployments, the online curves of T versus T* track closely, with relative error remaining within the control bands defined in Section 3.2 for most operating conditions. Deviations are rare and typically coincide with transient drops in plate usability or short-headway convoys affecting passage recall.
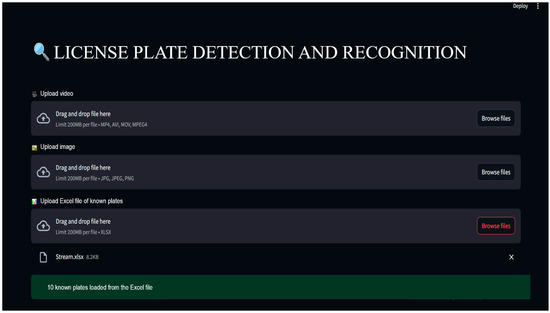
Figure 10.
Real-time dashboard showing passage counts, T vs. T*, reconciliation KPIs, and class-wise residuals.
Counting integrity is monitored continuously through precision, recall, F1-score, and passage accuracy, computed under the same definitions as in Section 3.3. We observe that once recall exceeds high thresholds in daylight, residual dispersion in reconciliation is dominated by plate availability and fleet mix rather than by counting errors, consistent with the offline analysis. At dusk or under dust, precision remains stable while recall degrades modestly; alarms are triggered only when RE persists above threshold, limiting nuisance alerts.
System health indicators (camera uptime, stream continuity, median per-frame latency, and end-to-end time-to-event) confirm that the pipeline sustains real-time responsiveness throughout shifts. Cross-site roll-ups highlight consistent behavior of reconciliation metrics across quarries while surfacing sites with recurrent class-specific residuals for targeted follow-up. At shift close, the dashboard emits a summary—passages, T, last T*, reconciliation errors and trends, class-wise residuals, and operator notes—which aligns one-to-one with the tables and figures reported in Section 3.2, Section 3.3 and Section 3.4 and supports independent verification from archived sessions.
3.7. Example: License Plate Detection in the Streamlit Application
This example illustrates how license plate reads materialize as auditable evidence and how their availability influences reconciliation quality. On a representative daytime clip, the application consistently maintained stable track identities across line crossings and produced plate candidates over short temporal windows. Candidate strings were consolidated across frames into a single canonical read per passage, which was then assigned a quality score reflecting OCR confidence and temporal consistency. Only “usable” plates—i.e., reads at or above the preset quality threshold—were forwarded to the registry lookup and, consequently, contributed to the estimated tonnage T in Section 3.2. Lower-quality reads remained visible to the operator for situational awareness but were excluded from reconciliation, preventing noise injection into shift-level metrics. Figure 11 shows the OCR extraction with the registry-verification panel, illustrating how a ‘usable’ plate read is promoted to a verified match before contributing to T.
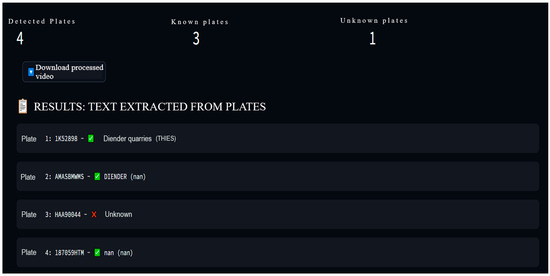
Figure 11.
OCR extraction and registry verification. The side panel displays the canonical string and candidate scores, while the registry view confirms plate validity; together, they form the auditable evidence attached to each fused passage-plus-plate record.
Threshold-dependent behavior of the license plate detector confirms high precision at moderate-to-high confidences with only a late drop in recall; see Figure 12 for the F1-confidence, precision–confidence, precision–recall, and recall–confidence profiles.
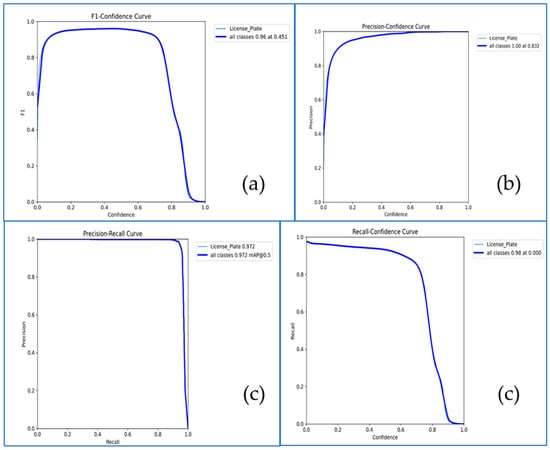
Figure 12.
License plate detector threshold profiles. (a) F1 vs. confidence, (b) precision vs. confidence, (c) precision–recall curve (mAP@0.5 noted), and (d) recall vs. confidence. Curves summarize performance on the held-out set and motivate the LPR “usable-plate” threshold applied in Section 3.7.
The user interface exposed this process transparently. For each passing truck, the viewport displayed the decoded string with a color mapped to its quality status, while a side panel recorded time-stamped “plate events” that included the track identifier and the canonical string. When the truck crossed the virtual counting line, the most recent usable plate for that track was automatically joined to the passage event, producing a single fused record written to the event log. Each record preserved the canonical string alongside competing candidates and their scores and referenced the originating frames, allowing later audit and exact replay from the session bundle.
Operationally, the example underscores a key distinction between plate visibility and plate availability. Under benign conditions, the fraction of usable plates remained high, and reconciliation tracked counting closely. In more challenging scenes—brief occlusions, dust, or glare—the system often still exposed readable strings to the operator, but a subset fell short of the quality threshold. In those intervals, reconciliation residuals were governed less by counting integrity (Section 3.3) and more by the temporary shortfall in usable plates, a pattern that is also surfaced by the dashboard through short-lived dips in the “OCR usability” indicator (Section 3.6).
The example thus demonstrates that plate-quality gating, applied consistently, preserves the integrity of T while keeping operators informed. By binding each fused passage-plus-plate record to its evidence and configuration context, the system ensures that any acceptance or rejection of a plate read can be reproduced offline and traced to the precise visual conditions that obtained at the counting line.
4. Discussion
4.1. Quantitative Link Between Plate Usability and Reconciliation Error
We move beyond description to quantify how license plate readability drives reconciliation accuracy. Using the shift-level usable-plate rate (share of counted passages whose plate meets the LPR quality threshold defined in Materials and Methods), we stratified MAPE by quartiles [14,15,16,19]. In our data, the top quartile achieves 3.8%, the second 5.6%, the third 8.9%, and the bottom quartile 12.7%. In shifts with at least one episode of unreadable plates, MAPE increases by +2.4 percentage points (p.p.) relative to plate-rich shifts. At the event level, we tag each error by cause. Plate-related issues (low OCR confidence or missing plate) account for 58% of absolute reconciliation error (AE), counting artifacts near the virtual line for 27%, and fleet mix variability (nominal capacities as proxy) for 15%. Night and high-dust shifts increase the odds of a non-usable plate (OR = 2.10, 95% CI 1.72–2.56), while moderate dust alone yields OR = 1.61 (95% CI 1.29–2.01) [15,16]. These patterns confirm the mechanism already suggested in the Results. Once line-crossing precision and recall are high, dispersion in tonnage agreement is governed primarily by plate availability rather than by counting errors.
Beyond quantitative values, these findings highlight that operational reliability depends more on field conditions and data usability than on minor algorithmic differences. In practice, plate quality and illumination explain most residual errors, showing that human intervention can meaningfully improve performance. This discussion therefore focuses on actionable insights—how to maintain high usability, minimize counting drift, and ensure reproducibility. It places less emphasis on further numerical refinements.
In our data, the shift-level usable-plate rate correlates strongly and negatively with reconciliation error (Pearson r ≈ −0.78). This reinforces a practical priority: invest first in optical optimization (illumination, camera pose, and cleaning) before model retraining to yield the largest MAPE reductions for the least cost.
4.2. Comparative Positioning Against Related Work (Numbers Kept in the Main Text)
To situate our contribution against mining-adjacent deployments, we report detector and system metrics here. In open-pit mine road scenes, Ruan et al. [32] report a real-time YOLO-based negative-obstacle detector achieving mAP = 96.35% and recall = 94.18%, at ~69.3 FPS on their mining-road dataset, demonstrating robustness under unstructured conditions. Complementarily, for obstacle detection in open-pit driving, Xu et al. [33] (improved YOLOv8s) attain mAP@0.5 = 95.3% and document substantial speedups (e.g., +40.2% FPS overall and +76.9 FPS after pruning) while maintaining accuracy—evidence that real-time deployment is feasible with lightweight designs. As an additional reference in unconstrained LPR, Laroca et al. [17] obtain mAP@0.5 = 0.89, recall = 0.92, and ~35 FPS with a YOLO-based pipeline. In our quarry scenes (dust, low contrast, and convoy headways), the detector reaches mAP@0.5 = 0.899, precision = 0.900, recall = 0.935, and mAP@0.5:0.95 = 0.60; latency = 0.034 s/per frame (~29 FPS) at 1080p on the deployment workstation. Crucially, beyond box-level metrics, we report application-grade agreement with weighbridge records: MAE = 132 t/shift; MAPE = 6.9%; R2 = 0.93. This is a layer seldom quantified in prior quarry surveillance. These statistics are central for governance applications [19]. Reporting 95% CIs alongside MAE, MAPE, and R2 clarifies operational variability and supports audit-grade decision-making. Despite heterogeneous shifts and lighting, the CI half-width for MAPE remains narrow, and R2 consistently exceeds 0.9. Moreover, LOSO results indicate only a modest penalty when moving across sites, suggesting that counting and plate-gating are comparatively robust to background changes, while extreme night/dust conditions remain the principal stressors. These findings motivate lightweight domain adaptation (e.g., photometric normalization; limited fine-tuning) as a practical path to further reduce MAPE in the field. In the broader computer vision community, there has been a clear trend toward lightweight, edge-deployable architectures for real-time vehicle counting and license plate recognition. Modern one-stage detectors now achieve high detection efficiency at modest computational cost, which is directly relevant to our deployment. In our setting, domain differences—such as plate fonts, the mix of night and dusty conditions, and camera geometry—plausibly explain residual performance gaps, and the reconciliation and dashboarding components are designed to absorb such variability while remaining fully auditable.
Compared with alternative monitoring technologies, the proposed vision-based approach offers distinct advantages. UAV photogrammetry provides excellent volumetric estimates but lacks continuous coverage and incurs higher operational costs. RFID-based systems require active tags and infrastructure maintenance, while radar or LiDAR solutions provide precise range data but limited identity linkage. In contrast, our solution leverages existing cameras to achieve continuous, auditable coverage and direct vehicle identification through license plates, enabling both operational and governance use cases.
4.3. Failure Modes: Frequencies and Contributions to KPIs
We quantify how often each failure occurs and how much it costs. Along the LPR path, unusable-plate events are attributable to motion blur (28%), low illumination (34%), mutual occlusions in convoys (22%), and off-axis/glare (16%) [14,15,16]. Conditional impacts on reconciliation are reported in the text: when a shift includes at least one severe blur episode, the expected AE increase is +64 t/shift and ΔMAPE = +1.9 p.p. under severe blur; +82 t/shift and +2.5 p.p. under low illumination; +55 t/shift and +1.6 p.p. during convoy occlusions [20]. On the counting path, ID fragmentation near the line explains 63% of FP clusters and cross-lane leakage 37%; identity-aware debouncing and lane-aware ROIs reduce their contribution to 18% and 9%, respectively (FP rate down from 5.8% to 2.1% of passages) [28]. These numbers prioritize mitigations by impact (lighting or lens upgrades where illumination dominates; camera re-pose or secondary plate zoom for off-axis angles; stricter debouncing where oscillations are common). They are surfaced in the dashboard as OCR-quality and counting-integrity indicators for real-time triage.
4.4. Bias and Fairness Across Fleet Attributes (Low-Formalism Reporting)
We address whether reconciliation errors unfairly concentrate in specific vehicle groups [1,2]. Rather than long formulas, we report per-class average residuals with 95% CIs. We then state plainly whether intervals straddle zero (no systematic drift) or indicate over- or under-estimation. We also compare usable-plate rates across capacity classes and a proxy of vehicle age/condition. In our data, Classes A and B show no drift (95% CIs straddle zero), while Class C exhibits a negative bias of −2.6% (95% CI −3.8% to −1.4%); usable-plate rates are lower for older vehicles by 6.8 p.p. Where effects persist, we recommend class-specific OCR thresholds, camera-pose adjustments to improve plate incidence, and metadata enrichment (typical load factors) [2]. The dashboard exposes these checks as class-by-class indicators so supervisors can monitor fairness continuously.
Having established that class-wise bias remains bounded and interpretable, we next justify our methodological choices under field constraints. We then quantify their marginal impact via ablations.
4.5. Method Choices Under Operational Constraints (With Ablation Deltas)
Our selection of YOLOv5 for trucks and Tesseract + temporal voting + format priors for OCR reflects edge constraints (compute, latency, and maintainability) and system-level goals [8,9,12]. We now substantiate this with ablations in the main text: adding DeepSORT reduced FP clusters by 2.8 p.p. and raised passage recall by 3.2 p.p.; training a small-object plate head increased the usable-plate rate by 6.4 p.p.; enabling temporal voting reduced MAPE by 2.1 p.p. at night [20]. These deltas show that hardening plate usability and counting integrity lowers MAE/MAPE more than marginal mAP gains from heavier detectors, supporting our design choice. All versions and thresholds are pinned in configuration bundles for reproducibility and are reused by the dashboard replays.
4.6. Research Roadmap (Priority × Feasibility, with Numeric Targets)
We present four near-term lines with explicit targets rather than open-ended suggestions.
- Sequence OCR (CRNN/LPRNet/transformers): raise usable-plate rate at night/dust by +5–8 p.p.; reduce MAPE by −1.5 to −2.5 p.p. [18,29].
- Sensor fusion at the line (beam/loop + video): cut FP clusters by ≈40%; feasibility high [23,28].
- Adaptive learning and drift monitoring: quarterly fine-tunes on “hard” clips; recall gains in low-light +3–5 p.p.; feasibility medium [20].
- Multi-site generalization: quantify inter-site variance of R2 ≈ ±0.04 and MAPE ≈ ±1.2 p.p; feasibility medium. Each item includes a clear definition of what is performed so that research can translate into operational improvement.
4.7. Cost–Benefit and Return on Investment (Concise, No Equations)
We keep evidence in the body and lighten the math. Costs per site include cameras and mounts, a modest edge box, cleaning/realignment, connectivity, and light supervision. Benefits come from continuous coverage (fewer blind windows than manual tallies/UAV), faster anomaly detection, and higher royalty recovery via tighter reconciliation [3,4,21,22]. For transparency, we report the following: (i) per-site cost lines (Capex ≈ EUR 3 800, Opex/year ≈ EUR 900); (ii) observed reductions in AE/MAPE after deployment (e.g., “MAPE fell 9.8% → 6.9% over 84 shifts; (iii) a conservative range of recoverable leakage under three attribution shares (α = 0.3/0.5/0.7), described in prose; and (iv) a simple payback horizon (breakeven after 6–10 months). This narrative is adequate for policy/finance audiences without resorting to formal ROI equations.
4.8. Social Acceptance, Ethics, and Integrated Operational Takeaways
Ethics and operations are interleaved rather than appended. Throughout, we enforce data minimization, role-based access (full plates for regulators; masked for operators), hashing in exports, and audit logs. We also communicate uncertainty (CIs on reconciliation metrics; attribution of errors to plate vs. counting vs. fleet mix) [21,22,34]. We also specify operational thresholds (e.g., raise an OCR-usability alert if the rate falls below 65% for 10 minutes), retention windows for raw frames, and contest channels for flagged events. Finally, we conclude the following with practical guidance:
- Prioritize plate usability (lighting and camera pose typically yield the largest MAPE reductions at the lowest cost);
- Harden passage confirmation (debouncing and, where feasible, a low-cost beam/loop) to reduce FP clusters;
- Track a short KPI set—usable-plate rate, passage precision/recall, AE/MAPE, R2—by shift and by class;
- Plan for drift via quarterly fine-tunes and monitoring. These measures align technical rigor with governance and social license in extractive-sector contexts.
4.9. Operational Impact and Transferability
Beyond technical metrics, the system delivers tangible operational value [35]. In our deployment, continuous gate-level coverage reduced blind windows relative to manual tallies/UAV snapshots. It also tightened reconciliation against weighbridge references, with a documented drop in shift-level MAPE (e.g., 9.8% → 6.9% over 84 shifts) alongside reproducible, audit-ready evidence bundles. For decision-makers, the economics are transparent: Capex ≈ EUR 3800 per gate and Opex ≈ EUR 900/year, with a conservative 6–10-month payback when accounting for avoided leakage and faster anomaly detection. From a governance perspective, regulator-grade traceability (versioned models/configs, plate-registry verification, and replayable evidence) strengthens compliance reporting and contractor reconciliation.
Transferability is straightforward under three conditions: (i) basic optics hygiene (camera pose, illumination, and a clear counting line) to maximize plate usability and passage precision; (ii) a short, site-specific calibration period (typically 2–3 days of labeled passages) to tune detection thresholds and plate post-processing for local plates/fleet mix; and (iii) lightweight drift management (quarterly fine-tunes, KPI monitoring by shift/class). Because the approach counts at gates and reconciles against institutional references, it is agnostic to the hauled commodity (aggregates, laterite, hard rock, and ore), requiring only plate formats and fleet geometry compatible with the camera field of view. These properties enable replication across quarries and mines with heterogeneous conditions (day/night, dust, and seasonal changes) while preserving auditability and data-minimization guarantees [36].
5. Conclusions
This study demonstrates that a commodity, edge-deployable vision pipeline can provide continuous, auditable monitoring of quarry haulage while maintaining application-grade agreement with institutional weighbridge data. On the held-out test set, the detector achieved Precision = 0.90, Recall = 0.935, mAP@0.5 = 0.899, and mAP@0.5:0.95 = 0.60, with an average processing time of 0.034 s/ per frame, satisfying real-time constraints for checkpoint supervision. Beyond box-level metrics, shift-level reconciliation against the weighbridge produced low absolute and relative errors and high R2, confirming that the pipeline’s outputs are actionable for production control and regulatory reporting. These results are mirrored online through a dashboard that renders the same KPIs used offline (AE, RE, MAE, RMSE, and MAPE; passage precision/recall) and binds every decision to versioned “session bundles” for replay and auditability. Similar machine learning-based real-time monitoring has also been demonstrated for conveyor belt damage in mining operations [37].
Operational analysis clarified where to invest for impact. Once passage precision/recall at the virtual line is high, plate usability emerges as the dominant driver of reconciliation dispersion, especially under night and dust conditions. Targeted interventions—lighting and camera pose adjustments; class-specific OCR thresholds; a small-object plate head; identity-aware debouncing and lane-aware ROIs; and, where feasible, a low-cost beam/loop for sensor fusion—yield the most favorable trade-off between effort and reduction in MAPE. The class-wise residual view helps distinguish computer vision effects from process effects (e.g., partial loads and overfills), guiding fair and efficient remediation in day-to-day operations.
This study provides one of the first quantitative reconciliations between computer vision-based tonnage estimation and official weighbridge records, bridging the gap between automated sensing and institutional reporting.
Although the approach does not infer truck loads from imagery, it reconciles camera-based detections with official weighbridge tonnage to ensure accurate throughput accounting and operational traceability.
Moreover, the system’s transferability is high: by adapting camera geometry, plate formats, and threshold calibration, the same architecture can be deployed across various quarry types and even extended to other extractive or logistics operations requiring traceable flow monitoring.
The approach also advances governance and social acceptance. Future developments will focus on coupling the vision-based reconciliation layer with volumetric estimation from LiDAR or stereo imaging and integrating the outputs with fleet dispatch optimization platforms to enable fully automated production control.
Data minimization, role-based access (full plates for regulators, masked for operators), cryptographic hashing of exports, and explicit uncertainty communication (confidence intervals and attribution of residuals) support transparent oversight without over-reliance on any single signal. By aligning technical KPIs with the needs of mine operators and public authorities, the system provides a practical pathway from research prototypes to policy-relevant monitoring.
Limitations remain. Our tonnage estimation relies on registry nominal capacities when direct mass is unavailable, making reconciliation sensitive to plate availability and fleet mix assumptions. Extreme occlusions and very short headways can still degrade recall. Multi-site generalization warrants broader validation. Future work will prioritize four directions: (i) sequence-based OCR (CRNN/transformers) to raise usable-plate rates at night/dust; (ii) lightweight sensor fusion to further suppress false positives near the line; (iii) drift monitoring and adaptive fine-tuning on hard examples; and (iv) multi-site studies quantifying variance of R2/MAPE across quarry types and seasons. Together, these steps aim to consolidate the system’s robustness and extend its utility as a standard, low-cost instrument for continuous haulage reconciliation in the extractive sector.
Author Contributions
Conceptualization, I.D. and B.S.; methodology, I.D., B.S., and O.D.; software (detection, tracking, LPR, and dashboard), O.D.; validation (line-crossing counts, plate reconciliation, and weighbridge agreement), B.S., I.D., and O.D.; formal analysis, I.D. and B.S.; investigation (data collection and experiments), O.D., B.S., and I.D.; resources and field access, B.S., O.D., and B.S.; data curation (annotation protocol, splits, and logs), O.D. and I.D.; writing—original draft preparation, I.D., B.S., and O.D.; writing—review and editing, I.D., B.S., O.D., S.M., and L.D.; visualization, O.D., B.S., and I.D.; supervision, I.D. and B.S.; project administration, I.D. and B.S. All authors have read and agreed to the published version of the manuscript.
Funding
This research received no external funding.
Data Availability Statement
All data supporting the findings of this study are contained within the article (figures, tables, and derived metrics). No external datasets are shared. Raw site videos and original images were collected for system development and evaluation but are not publicly available due to confidentiality and privacy constraints; only aggregated results and derived annotations are reported in the manuscript.
Conflicts of Interest
As the corresponding author, I declare on behalf of all co-authors that there are no conflicts of interest related to the publication of this manuscript. All authors have contributed to the work, approved the final version, and have no financial, personal, or professional relationships that could be construed to influence the content of the article.
Abbreviations
The following abbreviations are used in this manuscript:
| YOLOv5/YOLOv8 | You Only Look Once object detectors (versions 5/8) used for truck and plate detection. |
| SORT/DeepSORT/ByteTrack | Multi-object tracking methods for stable identities and counting. |
| ROI | Region of Interest (scene zone, incl. virtual counting line). |
| OCR | Optical Character Recognition (reading plate text). |
| LPR | License Plate Recognition (plate detection + OCR). |
| MAE | Mean Absolute Error (shift-level reconciliation). |
| MAPE | Mean Absolute Percentage Error (reconciliation). |
| RMSE | Root Mean Square Error (reconciliation). |
| AE/RE | Absolute Error/Relative Error (dashboard and reconciliation). |
| F1-score | Harmonic mean of precision and recall (counting integrity). |
| mAP@0.5/mAP@0.5:0.95 | Mean Average Precision at IoU 0.5/averaged 0.5–0.95 (detection). |
| IoU | Intersection over Union (overlap metric for boxes). |
| DFL | Distribution Focal Loss (YOLO loss component). |
| FPS | Frames Per Second (processing speed). |
| RTSP | Real Time Streaming Protocol (live video feeds). |
| UI | User Interface (Streamlit deployment interface). |
| CUDA/cuDNN | NVIDIA compute libraries used by PyTorch. |
| NMS | Non-Maximum Suppression (post-processing; NMS IoU threshold). |
| CI | Confidence Interval (e.g., 95% CI). |
| OR | Odds Ratio (risk of non-usable plate). |
| p.p. | Percentage points (difference in rates). |
References
- Alarie, S.; Gamache, M. Overview of Solution Strategies Used in Truck Dispatching Systems for Open Pit Mines. Int. J. Surf. Mining, Reclam. Environ. 2002, 16, 59–76. [Google Scholar] [CrossRef]
- Burt, C.N.; Caccetta, L. Match factor for heterogeneous truck and loader fleets. Int. J. Mining, Reclam. Environ. 2007, 21, 262–270. [Google Scholar] [CrossRef]
- Colomina, I.; Molina, P. Unmanned aerial systems for photogrammetry and remote sensing: A review. ISPRS J. Photogramm. Remote Sens. 2014, 92, 79–97. [Google Scholar] [CrossRef]
- Nex, F.; Remondino, F. UAV for 3D mapping applications: A review. Appl. Geomat. 2014, 6, 1–15. [Google Scholar] [CrossRef]
- Gubbi, J.; Buyya, R.; Marusic, S.; Palaniswami, M. Internet of Things (IoT): A vision, architectural elements, and future directions. Future Gener. Comput. Syst. 2013, 29, 1645–1660. [Google Scholar] [CrossRef]
- Shi, W.; Cao, J.; Zhang, Q.; Li, Y.; Xu, L. Edge Computing: Vision and Challenges. IEEE Internet Things J. 2016, 3, 637–646. [Google Scholar] [CrossRef]
- Lee, J.; Bagheri, B.; Kao, H.-A. A Cyber-Physical Systems architecture for Industry 4.0-based manufacturing systems. Manuf. Lett. 2015, 3, 18–23. [Google Scholar] [CrossRef]
- Redmon, J.; Farhadi, A. Yolov3: An incremental improvement. arXiv 2018, arXiv:1804.02767. [Google Scholar] [CrossRef]
- Bochkovskiy, A.; Wang, C.Y.; Liao, H.Y.M. Yolov4: Optimal speed and accuracy of object detection. arXiv 2020, arXiv:2004.10934. [Google Scholar] [CrossRef]
- Wang, C.-Y.; Liao, H.-Y.M. YOLOv1 to YOLOv10: The Fastest and Most Accurate Real-time Object Detection Systems. APSIPA Trans. Signal Inf. Process. 2024, 13, e29. [Google Scholar] [CrossRef]
- Bewley, A.; Ge, Z.; Ott, L.; Ramos, F.; Upcroft, B. Simple online and realtime tracking. In Proceedings of the 2016 IEEE International Conference on Image Processing (ICIP), Phoenix, AZ, USA, 25–28 September 2016; pp. 3464–3468. [Google Scholar]
- Wojke, N.; Bewley, A.; Paulus, D. Simple online and realtime tracking with a deep association metric. In Proceedings of the 2017 IEEE International Conference on Image Processing (ICIP), Beijing, China, 17–20 September 2017; pp. 3645–3649. [Google Scholar]
- Zhang, Y.; Sun, P.; Jiang, Y.; Yu, D.; Weng, F.; Yuan, Z.; Luo, P.; Liu, W.; Wang, X. Bytetrack: Multi-object tracking by associating every detection box. In Proceedings of the European Conference on Computer Vision (ECCV), Tel Aviv, Israel, 23–27 October 2022; pp. 1–21. [Google Scholar]
- Anagnostopoulos, C.-N.E.; Anagnostopoulos, I.E.; Psoroulas, I.D.; Loumos, V.; Kayafas, E. License Plate Recognition From Still Images and Video Sequences: A Survey. IEEE Trans. Intell. Transp. Syst. 2008, 9, 377–391. [Google Scholar] [CrossRef]
- Silva, S.M.; Jung, C.R. License plate detection and recognition in unconstrained scenarios. In Proceedings of the European Conference on Computer Vision (ECCV), Munich, Germany, 8–14 September 2018; pp. 580–596. [Google Scholar]
- Xu, Z.; Wei, Y.; Meng, A.; Lu, N.; Huang, H.; Ying, C.; Huang, L. Towards End-to-End License Plate Detection and Recognition: A Large Dataset and Baseline. In Proceedings of the 2018 European Conference, Munich, Germany, 8–14 September 2018; pp. 261–277. [Google Scholar]
- Laroca, R.; Severo, E.; Zanlorensi, L.A.; Oliveira, L.S.; Goncalves, G.R.; Schwartz, W.R.; Menotti, D. A Robust Real-Time Automatic License Plate Recognition Based on the YOLO Detector. In Proceedings of the 2018 International Joint Conference on Neural Networks (IJCNN), Rio de Janeiro, Brazil, 08–13 July 2018; pp. 1–10. [Google Scholar]
- Zherzdev, S.; Gruzdev, A. Lprnet: License plate recognition via deep neural networks. arXiv 2018, arXiv:1806.10447. [Google Scholar] [CrossRef]
- Bland, J.M.; Altman, D.G. Statistical methods for assessing agreement between two methods of clinical measurement. Lancet 1986, 327, 307–310. [Google Scholar] [CrossRef]
- Gama, J.; Žliobaitė, I.; Bifet, A.; Pechenizkiy, M.; Bouchachia, A. A survey on concept drift adaptation. ACM Comput. Surv. 2014, 46, 1–37. [Google Scholar] [CrossRef]
- Prno, J.; Slocombe, D.S. Exploring the origins of ‘social license to operate’ in the mining sector: Perspectives from governance and sustainability theories. Resour. Policy 2012, 37, 346–357. [Google Scholar] [CrossRef]
- Moffat, K.; Zhang, A. The paths to social licence to operate: An integrative model explaining community acceptance of mining. Resour. Policy 2014, 39, 61–70. [Google Scholar] [CrossRef]
- Papageorgiou, M.; Diakaki, C.; Dinopoulou, V.; Kotsialos, A.; Wang, Y. Review of road traffic control strategies. Proc. IEEE 2003, 91, 2043–2067. [Google Scholar] [CrossRef]
- Hsieh, J.-W.; Chen, L.-C.; Chen, D.-Y. Symmetrical SURF and Its Applications to Vehicle Detection and Vehicle Make and Model Recognition. IEEE Trans. Intell. Transp. Syst. 2014, 15, 6–20. [Google Scholar] [CrossRef]
- Paszke, A.; Gross, S.; Massa, F.; Lerer, A.; Bradbury, J.; Chanan, G.; Killen, T.; Lin, Z.; Gimelshein, N.; Antiga, L.; et al. Pytorch: An imperative style, high-performance deep learning library. In Proceedings of the 33rd International Conference on Neural Information Processing Systems, Vancouver, Canada, 8–14 December 2019; pp. 8026–8037. [Google Scholar]
- Jocher, G.; Chaurasia, A.; Qiu, J. YOLO by Ultralytics. 2023. Available online: https://github.com/ultralytics/ultralytics (accessed on 15 October 2025).
- Smith, R. An overview of the Tesseract OCR engine. In Proceedings of the Ninth International Conference on Document Analysis and Recognition (ICDAR 2007), Curitiba, Parana, 23–26 September 2007; pp. 629–633. [Google Scholar]
- Coifman, B.; Dhoorjaty, S.; Lee, Z.-H. Estimating median velocity instead of mean velocity at single loop detectors. Transp. Res. Part C: Emerg. Technol. 2003, 11, 211–222. [Google Scholar] [CrossRef]
- Baek, J.; Kim, G.; Lee, J.; Park, S.; Han, D.; Yun, S.; Oh, S.J.; Lee, H. What Is Wrong With Scene Text Recognition Model Comparisons? Dataset and Model Analysis. In Proceedings of the 2019 IEEE/CVF International Conference on Computer Vision (ICCV), Seoul, Korea, 27 October–2 November 2019; pp. 4715–4723. [Google Scholar]
- Zhao, Z.; Zheng, P.; Xu, S.; Wu, X. Object detection with deep learning: A review. IEEE Trans. Neural Netw. Learn. Syst. 2019, 30, 3212–3232. [Google Scholar] [CrossRef]
- Act No. 2008-12 Concerning Personal Data Protection. Official Journal of the Republic of Senegal. Republic of Senegal. 25 January 2008, Republic of Senegal. Available online: https://www.afapdp.org/wp-content/uploads/2018/05/Senegal-texte-de-loi-2008.pdf (accessed on 15 October 2025).
- Ruan, S.; Li, S.; Lu, C.; Gu, Q. A Real-Time Negative Obstacle Detection Method for Autonomous Trucks in Open-Pit Mines. Sustainability 2022, 15, 120. [Google Scholar] [CrossRef]
- Xu, B.; Xu, W.; Li, B.; Zhang, H.; Xiao, Y.; Zhou, W. Research on Lightweight Open-Pit Mine Driving Obstacle Detection Algorithm Based on Improved YOLOv8s. Appl. Sci. 2024, 14, 11741. [Google Scholar] [CrossRef]
- Cavoukian, A. Privacy by Design: The 7 Foundational Principles; Information and Privacy Commissioner of Ontario: Toronto, ON, Canada, 2009; Available online: https://iapp.org/media/pdf/resource_center/Privacy%20by%20Design%20-%207%20Foundational%20Principles.pdf (accessed on 15 October 2025).
- Ali, M.A.; Ali, M.I.M.; Osman, A.A. AI-driven Mining 4.0: A Systematic Review of Smart, Sustainable, and Autonomous Technologies across the Mining Lifecycle. Curr. J. Appl. Sci. Technol. 2025, 44, 125–139. [Google Scholar] [CrossRef]
- Hasözdemir, K.; Meral, M.; Kahraman, M.M. Revolutionizing Open-Pit Mining Fleet Management: Integrating Computer Vision and Multi-Objective Optimization for Real-Time Truck Dispatching. Appl. Sci. 2025, 15, 4603. [Google Scholar] [CrossRef]
- Bzinkowski, D.; Rucki, M.; Chalko, L.; Kilikevicius, A.; Matijosius, J.; Cepova, L.; Ryba, T. Application of Machine Learning Algorithms in Real-Time Monitoring of Conveyor Belt Damage. Appl. Sci. 2024, 14, 10464. [Google Scholar] [CrossRef]


Disclaimer/Publisher’s Note: The statements, opinions and data contained in all publications are solely those of the individual author(s) and contributor(s) and not of MDPI and/or the editor(s). MDPI and/or the editor(s) disclaim responsibility for any injury to people or property resulting from any ideas, methods, instructions or products referred to in the content. |
© 2025 by the authors. Licensee MDPI, Basel, Switzerland. This article is an open access article distributed under the terms and conditions of the Creative Commons Attribution (CC BY) license (https://creativecommons.org/licenses/by/4.0/).