Abstract
Background: Intraoral pressure contributes significantly to bolus transport during swallowing, along with tongue and pharyngeal pressures. However, conventional assessment methods (e.g., manometry, tongue pressure measurement) have limitations, including invasiveness, difficulty in capturing pressure gradients, and reliance on cognitive function. Objective: This study aimed to examine differences in intraoral pressure between patients with dysphagia and healthy controls using a newly developed, noninvasive intraoral pressure sensor. Methods: Sixteen individuals with dysphagia were categorized into two groups based on the Dysphagia Severity Scale (DSS): eight with mild dysphagia (DSS6-5) and eight with moderate dysphagia (DSS4-3). Seven healthy young adults (DSS7) were included as controls. Intraoral pressure was measured using a sensor enclosed in a silicone balloon placed in a standardized position. Three thickened liquids (mildly, moderately, and extremely thick) were tested, and intraoral pressure duration, peak pressure, and area were analyzed. Results: Pressure duration and area significantly increased with higher-viscosity samples in participants with dysphagia. Both parameters were significantly higher in the dysphagia groups than in controls (p < 0.001). For the extremely thick sample, pressure area was significantly greater in the mild dysphagia group than in controls (p = 0.031), and in the moderate group across all viscosities (p = 0.036; mildly thick, p = 0.010; moderately thick, p = 0.006; extremely thick, respectively). Conclusions: Intraoral pressure measurement may be a valuable supplementary screening tool, particularly for identifying moderate or more severe dysphagia.
1. Introduction
Over the past few decades, research on the physiology and biomechanics of swallowing has advanced significantly, leading to the development of various assessment techniques [,,]. Methods such as videofluoroscopy (VF) [,], videoendoscopy [,], electromyography [], pharyngeal and esophageal pressure measurement [], and pharyngeal impedance [] have been widely used to evaluate swallowing function. These technological advancements have enabled a detailed analysis of the swallowing process, yielding many important findings. In particular, manometry is a valuable method for assessing pressure changes in the pharyngeal and esophageal regions during swallowing [].
However, the conventional methods used to evaluate pharyngeal pressure primarily measure contact pressure generated by pharyngeal contraction, making it difficult to accurately assess the actual intraluminal pressure during swallowing []. Additionally, the significant invasiveness and specialized equipment required for manometry limit its applicability to a restricted number of practitioners []. Moreover, manometry is susceptible to variations in bolus viscosity and volume, making consistent evaluations challenging []. These limitations hinder its widespread clinical use.
Tongue pressure is frequently measured as an indicator of oral function. Tongue pressure correlates with food texture preferences [,], overall physical function [], and nutritional status [], making it a useful tool for assessing dysphagia []. However, tongue pressure also measures contact pressure and does not accurately represent the pressure gradient, which is considered crucial during swallowing []. Furthermore, a major drawback of tongue pressure measurement is its dependency on cognitive function and the participant’s ability to follow instructions, which can result in difficulties in measurement and reduced reliability of the obtained values [,].
To overcome these challenges, lip closure pressure and lip closing force have gained attention [,]. Lip closure function plays a crucial role in both the oral and pharyngeal phases of swallowing, and its decline in older individuals might contribute to dysphagia []. Various methods have been developed to evaluate lip muscle function, including systems that combine lip closure pressure measurements with electromyography [].
In this study, we focused on intraoral pressure as a noninvasive and simple evaluation method, considering the limitations of previous swallowing assessment techniques, such as the invasiveness of manometry and the constraints of tongue pressure measurement. Intraoral pressure refers to the dynamic air pressure generated within the oral cavity during swallowing, reflecting the overall pressure environment required to propel the bolus through the oral phase. Unlike tongue pressure, which measures localized contact force against the palate, intraoral pressure captures the integrated effect of multiple oral structures, including the tongue, cheeks, palate, and lips. The contact pressure measured by conventional tongue pressure and manometry devices reflects pressure applied directly to a surface, whereas the internal pressure measured by the developed intraoral manometer reflects pressure fluctuations within a sealed space, offering a more integrated representation of intraoral dynamics. Measuring intraoral pressure might be a useful tool for early detection of oral hypofunction, which precedes swallowing dysfunction and dysphagia [,]. Based on previous research [,], we developed a device to measure intraoral pressure more conveniently. The objective of this study was to measure and compare intraoral pressure between healthy individuals and patients with dysphagia to examine the relationship between swallowing function and intraoral pressure.
2. Materials and Methods
2.1. Participant Characteristics
The primary participants in this study were 16 individuals with dysphagia, categorized into two groups based on the Dysphagia Severity Scale (DSS) [,]: eight with mild dysphagia (DSS6-5, 81.4 ± 7.8 years) and eight with moderate dysphagia (DSS4-3, 81.8 ± 6.2 years). Detailed characteristics of the participants with dysphagia are presented in Table 1. In addition, a control group of seven healthy young adults without dysphagia (DSS7, 26.0 ± 0.8 years) was included for comparative purposes (Table 1). All participants or their legal representatives provided written informed consent after being fully informed about the study’s objectives and procedures.

Table 1.
Subject characteristics.
2.2. Intraoral Pressure Sensor
Participants were seated in a chair and made comfortable; the barometric waveform was not visible to them on the monitor during measurements. The intraoral pressure sensor used in this study was the same type as that used in previous research [MPL115A1 miniature serial peripheral interface (SPI) digital barometer; NXP Semiconductors, San Jose, CA, USA] [,]. The detailed specifications of this sensor have been described in recent reports [,]. The intraoral pressure measurement system consisted of a pressure sensor connected to a measurement unit via cable, enabling real-time monitoring of intraoral pressure. The system detects air pressure fluctuations within a silicone balloon placed intraorally, transmitting signals to a microcontroller through an I2C interface. Internally, the sensor signal is received at the pressure sensor input connector, then processed via an I2C switching circuit and an I2C isolator before entering the microcontroller. The microcontroller converts the incoming data into time-series intraoral pressure values, which are monitored on a personal computer. The data can also be exported in CSV format, allowing for subsequent analysis. This system allows non-invasive, real-time pressure monitoring during swallowing, and provides a simple means for data acquisition and analysis of intraoral pressure dynamics in clinical and research settings. The transducer (1.5 × 3 × 5 mm) was sealed within the balloon, and after securing the balloon and sensor sheet with adhesive tape, air leakage was checked by applying manual pressure. Only the tip of the silicone balloon was derived from a tongue pressure probe manufactured by JMS (TPM02, 20 × 30 mm; JMS Co., Ltd., Hiroshima, Japan) (Figure 1). Just before data acquisition, the absence of air leakage from both the balloon and the adhesion site between the balloon and sensor sheet was reconfirmed using a dental magnifying loupe. Unlike conventional tongue pressure measurements, which detect contact pressure between the tongue and palate, the intraoral pressure in this study refers to spatial pressure changes within the oral cavity relative to atmospheric pressure. Therefore, this measurement captures the dynamic pressure gradient generated during swallowing, rather than localized contact force. Although the sensor was placed close to the tongue surface, the measurements represent the overall intraoral pressure dynamics rather than localized tongue pressure.
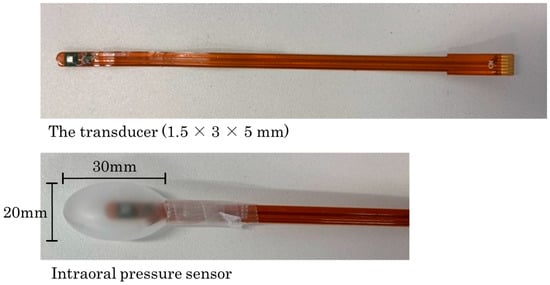
Figure 1.
Intraoral pressure sensor used in this study. The pressure sensor was placed inside a silicone balloon. The transducer (1.5 × 3 × 5 mm) was sealed within the balloon, and after securing the balloon with adhesive tape, air leakage was checked by applying manual pressure. Only the tip of the balloon was derived from a 20 × 30 mm tongue pressure probe manufactured by JMS (TPM02; JMS Co, Ltd., Hiroshima, Japan).
2.3. Experimental Design
In this study, three types of thickened liquid were used based on the 2021 Japanese Dysphagia Diet Classification []. The viscosity of the thickened liquids was categorized as follows: mildly thick (50–100 mPa·s), moderately thick (100–400 mPa·s), and extremely thick (400–600 mPa·s). These thickened liquids were prepared using a thickening agent (Neo High Toromeal III; Food Care, Kanagawa, Japan).
During measurements, the tip of the balloon was placed at the intersection of the midline of the palate and the line connecting the maxillary first molars on both sides under direct vision. To ensure consistency in the measurement position, a mark was placed on the lips while the participant held the probe in their mouth (Figure 2). Each participant received 4 mL of each thickened liquid (mildly thick, moderately thick, and extremely thick) in a randomized order, and each condition was tested five times. The test sample was administered sublingually, and participants were instructed to swallow in a single attempt. The entire procedure was recorded using VF to identify swallowing waveforms and ensure that each sample was swallowed in a single attempt. VF was performed with a stationary digital general-purpose X-ray fluoroscopy system (Astorex i9 ASTX-I900; Canon Medical Systems, Otawara, Japan), capturing lateral images at 30 frames per second. The recordings were conducted by three dentists experienced in the examination method, with prior calibration of the procedure.
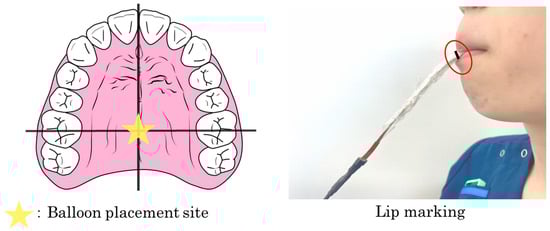
Figure 2.
Placement of the silicone balloon. During measurement, the tip of the balloon was visually positioned at the intersection of the midline of the palate and the line connecting the maxillary first molars on both sides. To ensure consistency in measurement position, a mark was placed on the device while the participant held the probe in their mouth.
The pressure signals from the intraoral pressure sensor were amplified using a custom-made amplifier and then transmitted to a computer via an analog-to-digital (A/D) converter. Data analysis was performed using dedicated software (Data Monitor multichannel continuous data acquisition and analysis system, version 1; Tokyo Giken, Inc., Tokyo, Japan) with a resolution of 0.15 kPa and a sampling frequency of 3 ms (Figure 3). Before and after each trial, the sensor position was verified to ensure consistent placement within the oral cavity.
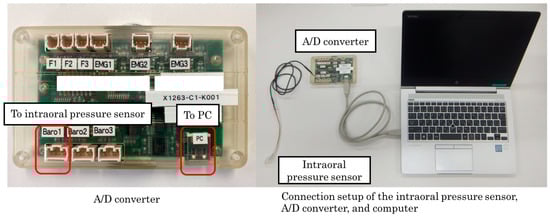
Figure 3.
Connection setup of the intraoral pressure sensor, analog-to-digital (A/D) converter, and computer used in this study. The pressure signals from the intraoral pressure sensor were amplified using a custom-made amplifier and transmitted to a computer via an A/D converter. Data analysis was performed using dedicated software with a resolution of 0.15 kPa and a sampling frequency of 3 ms.
2.4. Data Analyses
For each participant, the mean values from five trials were used for analysis. The pressure waveform analysis included intraoral pressure duration (s), peak intraoral pressure (kPa), and intraoral pressure area (kPa·s). The duration of the pressure waveform was defined as the time interval between the onset and offset of pressure exceeding the baseline mean ± 2 SD. The baseline pressure was defined as the average pressure measured during a 3 min resting period before swallowing. The peak intraoral pressure was recorded as the highest pressure value within the pressure duration, and the intraoral pressure area was calculated as the total area of the waveform within the measured pressure duration (Figure 4).
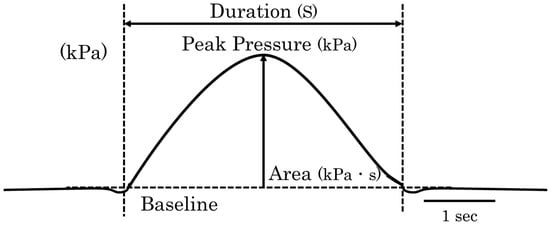
Figure 4.
Analysis method of pressure waveforms. The intraoral pressure duration (s), peak intraoral pressure (kPa), and intraoral pressure area (kPa·s) were analyzed. The duration of the pressure waveform was defined as the time interval between the onset and offset of pressure exceeding the baseline mean ± 2 SD. The baseline was defined as the average intraoral pressure measured during a 3 min rest period before the swallowing task. The peak intraoral pressure was recorded as the highest pressure value within the pressure duration, and the intraoral pressure area was calculated as the total waveform area within the measured pressure duration.
To compare differences in intraoral pressure among the different test samples and participant groups, the Friedman test or the Kruskal–Wallis test was performed, followed by post hoc analysis using the Bonferroni test as needed (IBM SPSS Statistics for Windows, version 24.0; IBM Japan, Tokyo, Japan). Data were expressed as mean ± SEM, and statistical significance was set at p < 0.05.
All methods were performed in accordance with the relevant guidelines and regulations.
3. Results
3.1. Comparison Among Test Samples
The reproducibility of intraoral pressure measurements was evaluated across five trials for each participant. The results showed that intraoral pressure duration, peak pressure, and pressure area remained consistent across trials (Figure 5). Therefore, the average values from the five trials were used for analysis.
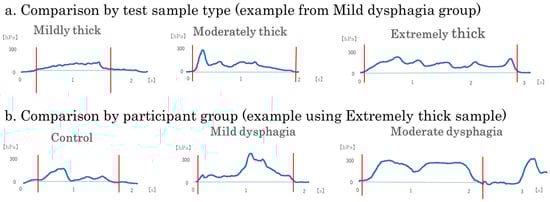
Figure 5.
Representative intraoral pressure waveforms by test sample type and participant group. Representative intraoral pressure waveforms recorded during swallowing are shown to illustrate typical patterns of pressure changes: (a) A single participant from the Mild dysphagia group was selected to show the effects of test sample type (mildly thick, moderately thick, and extremely thick); (b) A single test sample type (extremely thick) was used to show differences across participant groups (control, mild dysphagia, and moderate dysphagia). Each waveform illustrates a single swallow trial. Waveforms corresponding to the extremely thick sample and to participants with moderate dysphagia display longer pressure durations and broader pressure areas. These examples highlight variations in swallowing dynamics associated with bolus viscosity and dysphagia severity.
Significant differences were observed among test samples in intraoral pressure duration and pressure area (Table 2). Among all primary participants with mild or moderate dysphagia (All dysphagia: n = 16), pressure duration was significantly longer for the extremely thick sample compared with the mildly thick sample (p = 0.024). Additionally, pressure area was significantly greater for the extremely thick sample compared with the mildly thick sample (p = 0.001).
Table 2.
Intraoral pressure parameters by test sample type.
When participants with dysphagia were divided into groups, in the mild dysphagia group, pressure duration and peak pressure were significantly greater for the extremely thick sample compared with the mildly thick sample (p = 0.008 and p = 0.037, respectively). Furthermore, pressure area was significantly greater for the extremely thick sample compared with the mildly thick sample (p = 0.008). In the moderate dysphagia group, pressure area was significantly greater for both the moderately thick and extremely thick samples compared with the mildly thick sample (p = 0.024 for both comparisons). No significant differences among test samples were observed in the control group. (Figure 6).
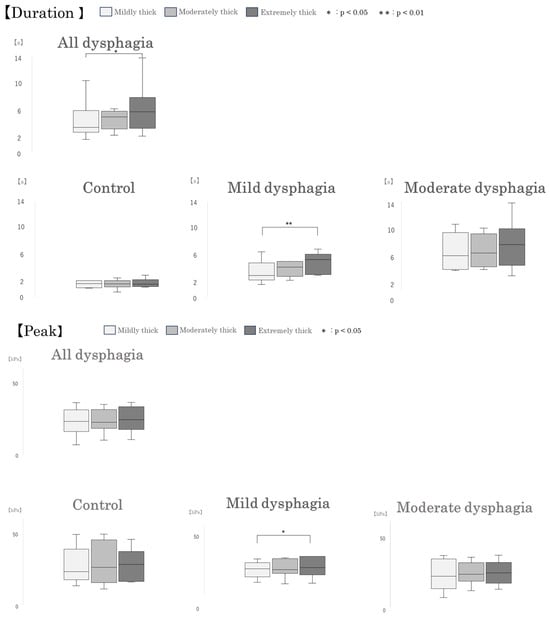
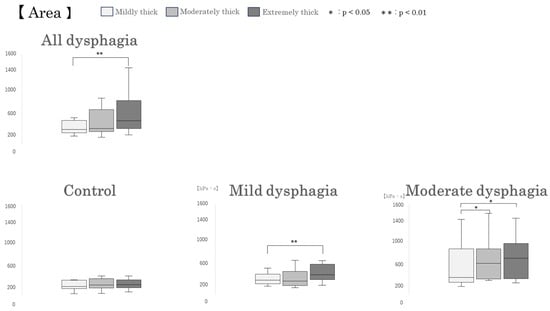
Figure 6.
Box-and-whisker plots of intraoral pressure parameters by test sample type. Box-and-whisker plots illustrating intraoral pressure duration, peak pressure, and pressure area during swallowing of different test samples. Each box represents the interquartile range (IQR), with the median indicated by a horizontal line. Whiskers show the range of the data, excluding outliers.
3.2. Comparison Among Participant Groups
Group-wise comparisons revealed significant differences in intraoral pressure duration and intraoral pressure area, consistent with the findings based on participant groups (Figure 5). However, no significant differences were observed in peak intraoral pressure (Table 3). Excluding the influence of test sample conditions, both intraoral pressure duration and area were significantly greater in the mild and moderate dysphagia groups than in the control group (p < 0.001 and p < 0.001, respectively). When comparing within each test sample, intraoral pressure duration was significantly longer in the moderate dysphagia group than in the control group under all conditions: mildly thick, moderately thick, and extremely thick (p = 0.001, p < 0.001, and p = 0.002, respectively). Additionally, for the moderately thick and extremely thick samples, pressure duration was also significantly longer in the mild dysphagia group compared with the control group (p = 0.028 and p = 0.019, respectively).
Table 3.
Intraoral pressure parameters by participant group.
Regarding intraoral pressure area, similar to pressure duration, values were significantly higher in the moderate dysphagia group compared with the control group across all test samples: mildly thick, moderately thick, and extremely thick (p = 0.036, p = 0.010, and p = 0.006, respectively). Moreover, for the extremely thick sample, intraoral pressure area was also significantly greater in the mild dysphagia group than in the control group (p = 0.031) (Figure 7).
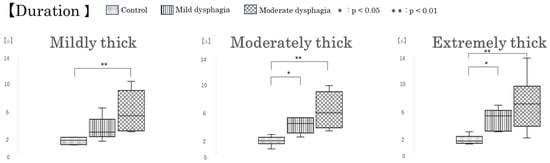
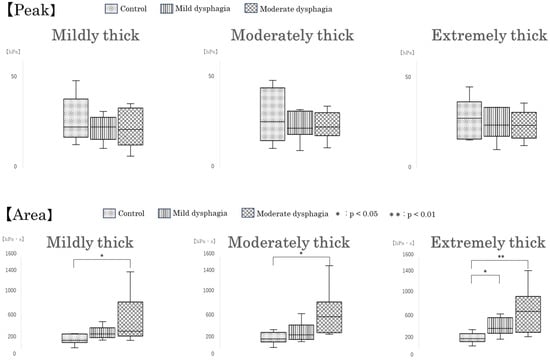
Figure 7.
Box-and-whisker plots of intraoral pressure parameters by participant group. Box-and-whisker plots showing intraoral pressure duration, peak pressure, and pressure area across participant groups. Each box indicates the interquartile range (IQR), with the median shown as a horizontal line. Whiskers show the range of the data, excluding outliers.
4. Discussion
This study preliminarily examined differences in intraoral pressure between patients with mild or moderate dysphagia and healthy controls using a newly developed, noninvasive intraoral pressure measurement device. The results demonstrated that as the viscosity of the test samples increased, both intraoral pressure duration and area significantly increased in individuals with dysphagia. Moreover, compared with the healthy control group, the dysphagia groups exhibited significantly prolonged pressure duration and increased intraoral pressure area, suggesting that altered intraoral pressure dynamics are associated with swallowing impairment.
4.1. Viscosity of Test Samples and Intraoral Pressure
In this study, increased pressure duration and intraoral pressure area were observed with higher-viscosity test samples (extremely thick) in the all dysphagia group. This finding suggests that swallowing higher-viscosity liquids requires a longer and more effortful application of pressure for patients with dysphagia. Previous studies have reported that increased viscosity extends the duration of tongue pressure and pharyngeal pressure and increases the total pressure area, which is consistent with our findings [,,]. When participants with dysphagia were divided into groups, the mild dysphagia group exhibited significantly greater pressure duration and intraoral pressure area for the extremely thick sample compared with the mildly thick sample. In contrast, in the moderate dysphagia group, intraoral pressure area was significantly greater for both the moderately thick and extremely thick samples compared with the mildly thick sample. These findings suggest that the effects of viscosity on intraoral pressure may differ depending on the severity of dysphagia, possibly because of changes in intraoral pressure dynamics as the condition progresses. Additionally, no significant differences in peak intraoral pressure were found between test samples in the control group, all dysphagia, or moderate dysphagia groups. This finding implies that pressure duration and area may be more sensitive indicators of swallowing effort and function than peak pressure values alone.
Importantly, the healthy control group showed no significant differences in any intraoral pressure parameters across viscosity conditions, suggesting that unimpaired individuals can adapt to varying bolus consistencies with stable pressure dynamics. Suggesting that healthy individuals maintain consistent intraoral pressure across viscosities due to their well-preserved muscular function and neuromuscular adaptability.
In contrast, individuals with dysphagia, particularly those with compromised pharyngeal function, are more affected by the physical properties of the bolus.
4.2. Swallowing Function and Intraoral Pressure
Intraoral pressure during swallowing is a crucial factor in bolus transport, working in conjunction with tongue and pharyngeal pressures []. Previous studies have reported that patients with dysphagia exhibit reduced pharyngeal and tongue pressures, indicating a relationship between pressure generation and swallowing dysfunction [,].
In the present study, when test sample conditions were excluded, no significant difference was observed in peak pressure; however, the pressure area was increased in the dysphagia groups compared to the control group, which appears to result from a prolonged pressure duration. These findings suggest that individuals with dysphagia may be unable to generate intraoral pressure efficiently or in a well-coordinated manner, and therefore require sustained pressure over time to transport the bolus. Such prolonged pressure application may reflect compensatory mechanisms associated with impaired swallowing dynamics.
When analyzing each test sample separately, the moderate dysphagia group consistently showed significantly prolonged pressure duration and increased intraoral pressure area compared with the control group. This indicates that intraoral pressure measurement may serve as a useful supplementary screening tool, particularly for identifying moderate or more severe dysphagia. Moreover, for the moderately thick sample, the mild dysphagia group demonstrated significantly prolonged pressure duration compared with the control group; however, there was no significant difference in pressure area between the mild dysphagia and control groups. In contrast, differences in intraoral pressure parameters were more pronounced with the extremely thick sample than with the moderately thick sample. This observation may be attributed not only to the specific gravity and resistance to bolus propulsion of the test materials [,,], but also to factors such as the subjective ease of swallowing and palatability [], as well as changes in intraoral pressure dynamics associated with the progression of dysphagia []. These findings suggest that the extremely thick sample may be more effective in distinguishing intraoral pressure differences according to dysphagia severity during swallowing evaluation. The wide interquartile range observed in some intraoral pressure parameters, particularly in the dysphagia groups, may reflect heterogeneity within this population. Some individuals with dysphagia exhibited intraoral pressure values similar to those of healthy participants. This suggests that their swallowing difficulties may result from sensory impairments, such as oral hypoesthesia, rather than reduced pressure generation or motor dysfunction. As the intraoral pressure sensor is designed to measure pressure fluctuations, it may be less sensitive in detecting dysphagia primarily caused by sensory deficits.
4.3. Clinical Significance and Limitations of This Study
The intraoral pressure measurement device used in this study offers several advantages over conventional swallowing function assessment methods, including noninvasiveness, ease of use, and the ability to measure pressure without restricting participants. Our findings suggest that this device has potential as a useful tool for dysphagia screening. Additionally, intraoral pressure measurements could serve as valuable indicators for evaluating the effects of swallowing rehabilitation.
However, this study has several limitations. First, as a pilot study, it was necessary to identify swallowing events based on intraoral pressure waveforms and confirm bolus movement during swallowing. Therefore, VF, which involves radiation exposure, was used for simultaneous recording. The implementation of VF limited the number of participants, potentially affecting statistical analysis. In particular, sex differences should be considered when measuring intraoral pressure [,], but this study did not examine such differences. Furthermore, a larger sample size is needed for a more detailed analysis of swallowing impairment. The preliminary findings of this study demonstrated the feasibility of identifying swallowing events based on intraoral pressure waveforms, suggesting that future studies can validate these findings using a larger participant pool without VF.
Second, the effects of head and neck position and posture on intraoral pressure measurements were not investigated. Because previous studies have reported that tongue pressure and lip pressure vary depending on posture [,], future research should examine the influence of trunk positioning on intraoral pressure.
Third, the intraoral pressure measurement device used in this study measures overall intraoral pressure and, theoretically, variations because of probe insertion position should be minimal. However, although preliminary tests were conducted to determine the most stable placement for the balloon, measuring pressure changes at different intraoral sites could allow for a more detailed evaluation. Finally, the size of the balloon tip used in this study may have interfered with swallowing movements, leading to discomfort during swallowing. For clinical applications, further modifications, such as redesigning the balloon shape and reducing the weight of the sensor and electronic components, are necessary. In the future, automatic diagnostic support is expected through pressure waveform analysis using machine learning algorithms [].
5. Conclusions
This study investigated intraoral pressure during swallowing in healthy controls and individuals with dysphagia using a noninvasive, easy-to-use intraoral pressure measurement device. The results showed that intraoral pressure duration and area increased with higher-viscosity test samples, especially in patients with mild or moderate dysphagia. These findings suggest that intraoral pressure measurement may be a valuable supplementary screening tool, particularly for identifying moderate or more severe dysphagia. Based on these preliminary findings, further research involving larger participant samples and comparisons with other swallowing assessment methods is necessary to validate the clinical utility of intraoral pressure measurement.
Author Contributions
H.T.: Contributed to conception, design, data acquisition and interpretation, drafted and critically revised the manuscript; S.M.: Contributed to conception, study design, data acquisition and analysis, drafted the manuscript; S.N., R.S., A.T., K.A., M.O. and A.O.: Contributed to data interpretation, drafted and critically revised the manuscript; Y.I.: Contributed to conception, study design, data interpretation, critically revised the manuscript. All authors have read and agreed to the published version of the manuscript.
Funding
This research received no external funding. The APC was funded by the Research Grant from the Graduate School of Asahi University.
Institutional Review Board Statement
The study was conducted in accordance with the Declaration of Helsinki, and approved by the Institutional Review Board of Asahi University (protocol code: 2023-01-07, approved on 7 January 2023).
Informed Consent Statement
Informed consent was obtained from all subjects involved in the study.
Data Availability Statement
The datasets generated and analyzed during the current study are available from the corresponding author on reasonable request.
Acknowledgments
We thank Yoshiaki Yamada, DDS, from the Oral Health Science Center, Tokyo Dental College, for his contribution to the development and provision of the intraoral pressure sensor used in this study. We also thank Helen Jeays and Andrea Baird, from Edanz (https://jp.edanz.com/ac, accessed on 6 May 2025) for editing drafts of this manuscript.
Conflicts of Interest
The authors declare that there are no conflicts of interest regarding the publication of this paper.
References
- Franciotti, R.; Di Maria, E.; D’Attilio, M.; Aprile, G.; Cosentino, F.G.; Perrotti, V. Quantitative Measurement of Swallowing Performance Using Iowa Oral Performance Instrument: A Systematic Review and Meta-Analysis. Biomedicines 2022, 10, 2319. [Google Scholar] [CrossRef]
- Malandraki, G.A. Advances for Dysphagia in the Digital Age: Integrative Imaging and Wearable Technologies. Folia Phoniatr. Logop. 2023, 75, 208–218. [Google Scholar] [CrossRef] [PubMed]
- Shieh, W.-Y.; Wang, C.-M.; Cheng, H.-Y.K.; Imbang, T.I. Noninvasive Measurement of Tongue Pressure and Its Correlation with Swallowing and Respiratio. Sensors 2021, 21, 2603. [Google Scholar] [CrossRef] [PubMed]
- Mehraban-Far, S.; Alrassi, J.; Patel, R.; Ahmad, V.; Browne, N.; Lam, W.; Jiang, Y.; Barber, N.; Mortensen, M. Dysphagia in the elderly population: A Videofluoroscopic study. Am. J. Otolaryngol. 2021, 42, 102854. [Google Scholar] [CrossRef] [PubMed]
- Sanjeevi, G.; Gopalakrishnan, U.; Pathinarupothi, R.K.; Iyer, K.S. Artificial Intelligence in Videofluoroscopy Swallow Study Analysis: A Comprehensive Review. Dysphagia 2025, 40, 1035–1048. [Google Scholar] [CrossRef]
- Araújo, R.C.P.; Ferreira, L.M.B.M.; Godoy, C.M.A.; Magalhães, H. Pharyngeal phase of swallowing in post-stroke dysphagia: Videoendoscopy and speech-language-hearing assessment. Codas 2024, 19, e20230242. [Google Scholar] [CrossRef]
- Sugaya, N.; Goto, F.; Okami, K.; Nishiyama, K. Association between swallowing function and muscle strength in elderly individuals with dysphagia. Auris Nasus Larynx 2021, 48, 261–264. [Google Scholar] [CrossRef]
- Ng, K.B.; Hernandez, E.G.; Erfmann, K.L.C.; Jones, R.D.; Macrae, P.; Huckabee, M.-L. Effect of Volitional Effort on Submental Surface Electromyographic Activity During Healthy Swallowing. Dysphagia 2022, 37, 297–306. [Google Scholar] [CrossRef]
- Diver, E.M.; Regan, J. Use of Pharyngeal High-Resolution Manometry to Evaluate Dysphagia in Adults with Motor Neurone Disease: A Scoping Review. Dysphagia 2022, 37, 1697–1714. [Google Scholar] [CrossRef]
- Omari, T.; Cock, C.; Wu, P.; Szczesniak, M.M.; Schar, M.; Tack, J.; Rommel, N. Using high resolution manometry impedance to diagnose upper esophageal sphincter and pharyngeal motor disorders. Neurogastroenterol. Motil. 2023, 35, e14461. [Google Scholar] [CrossRef]
- Omari, T.I.; Maclean, J.C.F.; Cock, C.; McCulloch, T.M.; Nativ-Zeltzer, N.; O’Rourke, A.K.; Szczesniak, M.M.; Wu, P.I.; Allen, J.; Aoyagi, Y.; et al. Defining Pharyngeal and Upper Esophageal Sphincter Disorders on High-Resolution Manometry-Impedance: The Leuven Consensus. Neurogastroenterol. Motil. 2025, 9, e70042. [Google Scholar] [CrossRef] [PubMed]
- Omari, T.I.; Dejaeger, E.; van Beckevoort, D.; Goeleven, A.; Davidson, G.P.; Dent, J.; Tack, J.; Rommel, N. A method to objectively assess swallow function in adults with suspected aspiration. Gastroenterology 2011, 140, 1454–1463. [Google Scholar] [CrossRef]
- Omari, T.I.; Dejaeger, E.; Van Beckevoort, D.; Goeleven, A.; De Cock, P.; Hoffman, I.; Smet, M.H.; Davidson, G.P.; Tack, J.; Rommel, N. A novel method for the nonradiological assessment of ineffective swallowing. Am. J. Gastroenterol. 2011, 106, 1796–1802. [Google Scholar] [CrossRef]
- Nollet, J.L.; Cajander, P.; Ferris, L.F.; Ramjith, J.; Omari, T.I.; Savilampi, J. Pharyngo-Esophageal Modulatory Swallow Responses to Bolus Volume and Viscosity Across Time. Laryngoscope 2022, 132, 1817–1824. [Google Scholar] [CrossRef]
- Murakami, K.; Hori, K.; Minagi, Y.; Uehara, F.; Salazar, S.E.; Ishihara, S.; Nakauma, M.; Funami, T.; Ikebe, K.; Maeda, Y.; et al. Coordination of tongue pressure production, hyoid movement, and suprahyoid muscle activity during squeezing of gels. Arch. Oral Biol. 2020, 111, 104631. [Google Scholar] [CrossRef]
- Kohyama, K. Application of a balloon-type pressure sensor in texture evaluation of tongue-crushable foods. J. Texture Stud. 2022, 53, 357–365. [Google Scholar] [CrossRef] [PubMed]
- Higa, C.; Mori, T.; Hiraoka, A.; Takeda, C.; Kuroki, A.; Yoshikawa, M.; Yoshida, M.; Tsuga, K. Five-year change in maximum tongue pressure and physical function in community-dwelling elderly adults. J. Dent. Sci. 2020, 15, 265–269. [Google Scholar] [CrossRef]
- Izumi, M.; Sonoki, K.; Ohta, Y.; Fukuhara, M.; Nagata, M.; Akifusa, S. Impact of Tongue Pressure and Peak Expiratory Flow Rate on Nutritional Status of Older Residents of Nursing Homes in Japan: A Cross-Sectional Study. J. Nutr. Health Aging 2020, 24, 512–517. [Google Scholar] [CrossRef]
- Shimizu, A.; Fujishima, I.; Maeda, K.; Wakabayashi, H.; Nishioka, S.; Ohno, T.; Nomoto, A.; Shigematsu, T.; Kayashita, J. Effect of low tongue pressure on nutritional status and improvement of swallowing function in sarcopenic dysphagia. Nutrition 2021, 90, 111295. [Google Scholar] [CrossRef] [PubMed]
- Youmans, S.R.; Stierwalt, J.A. Measures of tongue function related to normal swallowing. Dysphagia 2006, 21, 102–111. [Google Scholar] [CrossRef] [PubMed]
- Utanohara, Y.; Hayashi, R.; Yoshikawa, M.; Yoshida, M.; Tsuga, K.; Akagawa, Y. Standard values of maximum tongue pressure taken using newly developed disposable tongue pressure measurement device. Dysphagia 2008, 23, 286–290. [Google Scholar] [CrossRef]
- Hasegawa, M.; Kurose, M.; Okamoto, K.; Yamada, Y.; Tsujimura, T.; Inoue, M.; Sato, T.; Narumi, T.; Fujii, N.; Yamamura, K. Differential Response Pattern of Oropharyngeal Pressure by Bolus and Dry Swallows. Dysphagia 2018, 33, 83–90. [Google Scholar] [CrossRef]
- Sugano, A.; Ofusa, W.; Sugito, H.; Matsubayashi, N.; Hakkaku, M.; Yamada, Y. Development of a novel composite sensor for evaluating lip function. J. Oral Rehabil. 2019, 46, 920–926. [Google Scholar] [CrossRef] [PubMed]
- Lee, J.H.; Kim, H.S.; Yun, D.H.; Chon, J.; Han, Y.J.; Yoo, S.D.; Kim, D.H.; Lee, S.A.; Joo, H.I.; Park, J.S.; et al. The Relationship Between Tongue Pressure and Oral Dysphagia in Stroke Patients. Ann. Rehabil. Med. 2016, 40, 620–628. [Google Scholar] [CrossRef]
- Nakatsuka, K.; Adachi, T.; Kato, T.; Oishi, M.; Murakami, M.; Okada, Y.; Masuda, Y. Reliability of novel multidirectional lip-closing force measurement system. J. Oral Rehabil. 2011, 38, 18–26. [Google Scholar] [CrossRef]
- Huang, P.; Hsu, Y.C.; Li, C.H.; Hsieh, S.W.; Lee, K.W.; Wu, K.H.; Chen, W.C.; Lin, C.W.; Chen, C.H. Videofluoroscopy dysphagia severity scale is predictive of subsequent remote pneumonia in dysphagia patients. Int. J. Med. Sci. 2023, 20, 429–436. [Google Scholar] [CrossRef]
- Matsuo, H.; Yoshimura, Y. Calf circumference is associated with dysphagia in acute-care inpatients. Geriatr. Nurs. 2018, 39, 186–190. [Google Scholar] [CrossRef] [PubMed]
- Hiraki, K.; Yamada, Y.; Kurose, M.; Ofusa, W.; Sugiyama, T.; Ishida, R. Application of a barometer for assessment of oral functions: Donders space. J. Oral Rehabil. 2017, 44, 65–72. [Google Scholar] [CrossRef]
- Kayashita, J.; Fujishima, I.; Fujitani, J.; Hironaka, S.; Kojo, A.; Mizukami, M.; Senda, N.; Moriwaki, M.; Watanabe, E. The Japanese Dysphagia Diet of 2021 by the Japanese Society of Dysphagia Rehabilitation. Jpn. J. Compr. Rehabil. Sci. 2022, 13, 64–77. [Google Scholar] [CrossRef] [PubMed]
- Taniguchi, H.; Tsukada, T.; Ootaki, S.; Yamada, Y.; Inoue, M. Correspondence between food consistency and suprahyoid muscle activity, tongue pressure, and bolus transit times during the oropharyngeal phase of swallowing. J. Appl. Physiol. 2008, 105, 791–799. [Google Scholar] [CrossRef]
- Steele, C.M. The influence of tongue strength on oral viscosity discrimination acuity. J. Texture Stud. 2018, 49, 249–255. [Google Scholar] [CrossRef]
- Ferris, L.; Doeltgen, S.; Cock, C.; Rommel, N.; Schar, M.; Carrión, S.; Scholten, I.; Omari, T. Modulation of pharyngeal swallowing by bolus volume and viscosity. Am. J. Physiol. Gastroin. Liver Physiol. 2021, 320, G43–G53. [Google Scholar] [CrossRef]
- Hori, K.; Ono, T.; Nokubi, T. Coordination of tongue pressure and jaw movement in normal and dysphagic subjects. J. Oral Rehabil. 2006, 33, 275–283. [Google Scholar] [CrossRef]
- Chitose, S.I.; Fukahori, M.; Kurita, T.; Hamakawa, S.; Sato, K.; Kuroiwa, T.; Ono, T.; Umeno, H.; Sato, K. Relationship between Swallowing Pressure and Saliva Residue on Endoscopic Evaluation in Pharyngeal Dysphagia. Laryngoscope 2024, 134, 3519–3526. [Google Scholar] [CrossRef]
- Kunieda, K.; Fujishima, I.; Wakabayashi, H.; Ohno, T.; Shigematsu, T.; Itoda, M.; Oshima, F.; Mori, T.; Ogawa, N.; Ogawa, S. Relationship Between Tongue Pressure and Pharyngeal Function Assessed Using High-Resolution Manometry in Older Dysphagia Patients with Sarcopenia: A Pilot Study. Dysphagia 2021, 36, 33–40. [Google Scholar] [CrossRef]
- Cichero, J.A. Thickening agents used for dysphagia management: Effect on bioavailability of water, medication and feelings of satiety. Nutr. J. 2013, 12, 54. [Google Scholar] [CrossRef] [PubMed]
- Arakawa, I.; Igarashi, K.; Imamura, Y.; Müller, F.; Abou-Ayash, S.; Schimmel, M. Variability in tongue pressure among elderly and young healthy cohorts: A systematic review and meta-analysis. J. Oral Rehabil. 2021, 48, 430–448. [Google Scholar] [CrossRef]
- Jones, C.A.; Ciucci, M.R.; Abdelhalim, S.M.; McCulloch, T.M. Swallowing Pressure Variability as a Function of Pharyngeal Region, Bolus Volume, Age, and Sex. Laryngoscope 2021, 131, E52–E58. [Google Scholar] [CrossRef] [PubMed]
- Paris-Alemany, A.; Proy-Acosta, A.; Adraos-Juárez, D.; Suso-Martí, L.; La Touche, R.; Chamorro-Sánchez, J. Influence of the Craniocervical Posture on Tongue Strength and Endurance. Dysphagia 2021, 36, 293–302. [Google Scholar] [CrossRef] [PubMed]
- Yoshikawa, M.; Nagakawa, K.; Tanaka, R.; Yamawaki, K.; Mori, T.; Hiraoka, A.; Higa, C.; Nishikawa, Y.; Yoshida, M.; Tsuga, K. Improper sitting posture while eating adversely affects maximum tongue pressure. J. Dent. Sci. 2021, 16, 467–473. [Google Scholar] [CrossRef]
- Dong, W.; Sheng, K.; Chen, C.; Qiu, X. Machine learning-assisted flexible dual modal sensor for multi-sensing detection and target object recognition in the grasping process. Lab. Chip 2025, 25, 2247–2255. [Google Scholar] [CrossRef] [PubMed]
Disclaimer/Publisher’s Note: The statements, opinions and data contained in all publications are solely those of the individual author(s) and contributor(s) and not of MDPI and/or the editor(s). MDPI and/or the editor(s) disclaim responsibility for any injury to people or property resulting from any ideas, methods, instructions or products referred to in the content. |
© 2025 by the authors. Licensee MDPI, Basel, Switzerland. This article is an open access article distributed under the terms and conditions of the Creative Commons Attribution (CC BY) license (https://creativecommons.org/licenses/by/4.0/).