Abstract
Childhood anxiety is a significant mental health concern in India. Although the Revised Children’s Manifest Anxiety Scale-Second Edition (RCMAS-2) is widely used internationally, its psychometric performance in Indian populations is underexplored. This study evaluated the reliability, validity, and preliminary normative data of the RCMAS-2 in a large Indian school sample. A total of 1001 children (52.4% boys; ages 7–10, M = 8.45, SD = 1.17) completed the RCMAS-2 and Beck Anxiety Inventory (BAI). After excluding 117 for high Defensiveness (>7) or Inconsistent Responding (>6), analyses on 884 children examined descriptive statistics, intercorrelations, convergent validity, age/gender differences, and Receiver operating characteristic (ROC) analysis using RCMAS-2 Total T > 60. Mean Total Anxiety T-score was 52.75 (SD = 9.53), with 28.5% of children scoring in the elevated range (T > 60). Subscale intercorrelations and structural analyses closely replicated U.S. normative patterns. The RCMAS-2 Total score showed moderate convergent validity with the BAI (r = 0.498). The BAI demonstrated acceptable classification accuracy against the RCMAS-2 threshold (AUC = 0.612). No significant gender differences emerged; older children (9–10 years) reported higher anxiety than younger children (Cohen’s d = 0.38). The RCMAS-2 shows good psychometric properties like other validated anxiety measures in India and is recommended for screening 7–10-year-olds, with further validation needed in different regions. The high anxiety levels underscore the need for targeted mental health programs in Indian schools.
1. Introduction
Anxiety symptoms among school-aged children have gained increasing clinical and educational attention over the past two decades [1,2]. Rising academic pressure, social expectations, and changes in family environments place many children at risk of experiencing persistent worry, tension, and physiological symptoms [3,4]. These symptoms can interfere with classroom performance, participation in group activities, and long-term emotional development [5,6]. When left unrecognized, childhood anxiety may progress to more severe difficulties during adolescence and adulthood, including avoidance behavior, reduced academic achievement, and heightened vulnerability to later mental health concerns [7,8]. Early identification is therefore an essential step in providing guidance, counselling, and structured support to children who may be struggling [9,10].
Reliable screening tools allow teachers, counsellors, and clinicians to recognize anxiety symptoms early and with greater accuracy [11,12]. Although several instruments exist for assessing emotional difficulties in children, not all of them perform equally well across cultural, linguistic, and regional backgrounds [13,14]. Measures developed and tested predominantly in Western populations may not automatically retain the same performance in other regions, as social norms, communication styles, and response patterns can differ substantially [13,15]. This highlights the importance of examining how a scale behaves in each new setting where it is used, especially when screening results will inform decisions about referral, follow-up assessment, or structured interventions.
The Revised Children’s Manifest Anxiety Scale-Second Edition (RCMAS-2) is among the most frequently used instruments for assessing anxiety in children aged six to nineteen years [16,17]. It offers a straightforward format, relies on simple self-report responses, and covers several domains that are commonly linked to anxiety during childhood—worry, physical signs of uneasiness, and concerns involving peer or social judgement [16,18]. Additionally, the measure includes built-in validity indicators that help flag inconsistent responding or attempts to present oneself more favorably, which strengthens its usefulness in school settings where children may be hesitant to disclose emotional difficulties [18].
Despite its extensive use in other countries, there is very limited information on how the RCMAS-2 performs among school-going children in India [3,16]. Earlier Indian studies have primarily employed the original RCMAS rather than the updated RCMAS-2, reporting elevated anxiety symptoms in school samples and highlighting the need for culturally appropriate screening tools [3,19]. Cultural background, everyday stressors, and academic environments in India differ markedly from those in Western countries where the scale was originally tested [13,14]. For instance, expectations related to scholastic excellence, family involvement in educational decisions, and peer competition may influence how Indian children interpret and respond to items about worry or physical tension [3]. Without local validation, there remains uncertainty about how well the tool identifies children who genuinely experience elevated anxiety and how accurate its recommended cut-off scores are for this population [13,17]. A systematic evaluation of the revised edition, including its validity indicators and updated factor structure, has not yet been reported in Indian settings. Establishing psychometric evidence for the RCMAS-2 is particularly important before applying publisher-recommended cut-offs to local school populations.
The present study addresses this important gap by evaluating the performance of RCMAS-2 scores in a large sample of school-going students from India. This dataset provides an opportunity to examine how the scale functions after excluding responses that show signs of poor accuracy based on the defensiveness validity indicator. Screening tools must demonstrate clear performance even after such exclusions, as response bias can otherwise distort sensitivity, specificity, and overall detection efficiency. By focusing on a refined sample, the study aims to present an accurate picture of how the scale behaves when used with Indian students.
Given the lack of prior research on this instrument in the Indian context, this study was conducted in English-medium private schools in Sikkim. Establishing how RCMAS-2 performs in this population not only helps strengthen local clinical practice and school-based screening but also contributes to the broader understanding of how anxiety measures work across diverse cultures. Having a reliable tool that responds well to local conditions can support early identification, guide counselling efforts, and improve access to help for children who may otherwise remain unnoticed. By presenting these findings, the study aims to support the use of RCMAS-2 as a dependable screening option for childhood anxiety within the Indian context, while also offering a foundation for further research that may explore item-level patterns, cultural influences, or longitudinal tracking of emotional health in children.
2. Method
2.1. Participants
The study was conducted in English medium private schools across all four districts of Sikkim, India, between March 2018 to November 2019. 1001 Children from classes 2–5 (age range 7–10 years) were recruited through multistage cluster sampling. A complete list of private schools registered with the State Education Department was obtained prior to recruitment. Using district-wise stratification, 30 schools were randomly selected across Sikkim (East = 12, West = 7, North = 5, South = 6). Eleven schools were unable to participate due to administrative and scheduling constraints, including time limitations and withdrawal at the institutional level. Consequently, 19 schools were included in the final study (East = 7, West = 6, North = 3, South = 3). Schools were selected to ensure that participating children had adequate English proficiency to comprehend the RCMAS-2 item content as administered. A linguistically homogeneous administration setting was maintained to reduce variability arising from translation or multilingual interpretation and to support consistency in evaluating the psychometric structure of the instrument during the initial validation phase.
Parental consent was obtained for approximately 65% of eligible students (N = 3250). Among those who consented, nearly 40% could not be assessed due to school-level attrition or student absence on the day of data collection. This resulted in 1812 children completing the administered assessments. Complete and usable data across all study variables were available for 1001 participants, who formed the initial analytic sample for the present psychometric evaluation. 117 Children were excluded from the psychometry study either due to a defensiveness score > 7 (103) or inconsistent responding > 6 (14). The final sample consisted of 884 children (463 boys, 421 girls; Mean age = 8.5 years, SD = 1.18). Representation by district was balanced (East District: 32.6%, West District: 23.5%, North District: 21.8%, South District: 22%). All the children were from grades 2–5, reflecting the RCMAS-2’s primary target age range.
2.2. Revised Children’s Manifest Anxiety Scale-Second Edition (RCMAS-2)
The RCMAS-2 is a 49-item self-report questionnaire designed to assess anxiety in children and adolescents aged 6–19 years. Items are answered “Yes” (1) or “No” (0). It yields a Total Anxiety score (40 items), three anxiety subscales (Physiological Anxiety, 12 items; Worry, 16, items; Social Anxiety, 12 items), a 9-item Defensiveness scale, and a brief Inconsistent Responding index [19]. Raw scores are converted to age- and gender-normed T-scores (M = 50, SD = 10) using U.S. norms. The manual reports internal consistency coefficients of 0.81–0.92 and test–retest reliabilities of 0.76–0.85. Permission for research use was obtained from Western Psychological Services (WPS, License: WPS-001532).
2.3. Beck Anxiety Inventory (BAI)
The BAI is a widely used 21-item adult self-report measure of anxiety severity. Each item is rated on a 0–3 scale (“Not at all” to “Severely”). Total scores range from 0 to 63. Although developed for adults, it was included to examine convergent validity and to test the hypothesis that an adult-oriented instrument would perform poorly in children. The Indian version has shown good reliability (α = 0.91) in previous adolescent samples. BAI was included as an exploratory comparator to examine the extent of score overlap between the RCMAS-2 and a widely used anxiety symptom measure primarily designed for adults. Given the developmental differences in anxiety expression and item content between adult and child populations, the BAI should be considered a suboptimal convergent validity reference for children aged 7–10 years.
2.4. Ethical Considerations
The study was reviewed, and ethical clearance was obtained from the Institutional Ethics Committee and the Institutional Review Committee of Sikkim Manipal Institute of Medical Sciences, Sikkim Manipal University (Approval code: SMIMS/IEC/2021-61; Approval date: 31 August 2021). Written consent from the Head of the Institutes was obtained from the schools which consented to participate in the study. Written Informed consent was also obtained from the participant’s parent/guardian and verbal assent from the children.
2.5. Data Analysis
Data were entered into Microsoft Excel 365 and cleaned for outliers and missing values (less than 0.5% missing across all variables, handled by mean imputation for subscale totals only). All the statistical analyses have been performed in RStudio (version 2026.01.0+392; R version 4.5.2). Descriptive statistics (means, standard deviations, ranges) were computed for all RCMAS-2 T-scores and BAI total scores. Normality was assessed using Q-Q plots. Independent t-tests examined gender differences, and age-group differences (7–8 vs. 9–10 years) were tested with independent t-tests and Cohen’s d effect sizes. Principal component analysis (PCA) with varimax rotation was conducted on the four RCMAS-2 T-score indices to explore structural coherence. Pearson correlations assessed convergent validity and subscale interrelationships. Receiver operating characteristic (ROC) analyses were performed using the established RCMAS-2 Total Anxiety cut-off of T > 60 as an operational threshold for elevated anxiety (not a clinical gold standard). Area under the curve (AUC), 95% confidence intervals, sensitivity, specificity, and Youden’s index were calculated for the BAI total score only, to evaluate its ability to classify children relative to this RCMAS-2-defined threshold.
2.6. Confirmatory Factor Analyses (CFAs)
Item-level CFA models were estimated for the 884 responses using the robust weighted least squares estimator (WLSMV), which is appropriate for ordinal response data. Each item was specified to load on its theoretically assigned factor as defined in the RCMAS-2 manual, with cross-loadings constrained to zero. Factor variances were fixed to 1 for identification, and latent factors were allowed to correlate. Model fit was evaluated using established indices (CFI, TLI, RMSEA, SRMR).
2.7. Item-Level Structural Analysis
Item-level structural estimates were examined to understand how each RCMAS-2 item contributed to its intended latent factor. Standardized regression coefficients (β), standard errors, and p-values were extracted from the weighted least squares model using the fitted CFA object. Items were grouped according to their predefined subscales: Physiological (PHY), Worry (WOR), and Social Anxiety (SOC). Defensiveness items were not included in the regression model because they serve as validity indicators rather than markers of the latent construct. The analysis produced standardized coefficients and significance values for all items, along with latent factor correlations. The cleaned summary of these results is provided in the item-level regression table included in the Supplementary Materials.
3. Results
3.1. Participant Characteristics
A total of 1001 school children from four districts of Sikkim, India, initially participated in the study. One hundred and three participants showed Defensiveness raw scores > 7, and 14 children displayed Inconsistent Responding scores > 6 (indicating probable under-reporting of symptoms). The final analytic sample comprised children with 52.4% male and 47.6% female, aged 7–10 years (M = 8.45 ± 1.17). All the children were in classes 2–5, with balanced representation across districts. Detailed demographic characteristics are presented in Table 1.

Table 1.
Demographic characteristics of the participants.
3.2. Descriptive Statistics and Distribution of Anxiety Scores
Descriptive statistics of both BAI and RCMAS-2 scores are presented in Figure 1 and Table 2. Relative to the U.S. standardization framework, in which T-scores are defined to have an expected distribution of 50 ± 10, the present sample exhibited a mildly elevated Total Anxiety T-score (52.75 ± 9.53), with the Worry subscale showing the greatest deviation from U.S. norms (54.25 ± 9.73). Physiological Anxiety was slightly lower than the normative mean (49.08 ± 9.61), whereas Social Anxiety was mildly elevated (52.01 ± 9.59). The mean BAI total score was 19.54 ± 11.81, falling in the mild anxiety range according to adult interpretive guidelines. Quantile–quantile (Q-Q) plots confirmed that both RCMAS-2 Total Anxiety T-scores (Figure 1A) and BAI total scores (Figure 1B) approximated a normal distribution, with minor positive skew at the upper tail for both measures. Figure 1C illustrates the distribution of BAI severity categories: 14.81% minimal, 28.83% mild, 27.13% moderate, and 29.43% severe. Figure 1D presents the clinical classification of the RCMAS-2 Total Anxiety T-score: 8.29% negligible (<39), 69.23% mild (40–60), 20.98% moderate (61–70), and 1.5% severe (≥71) in the original sample of 1001. No notable difference was found in the average anxiety scores or the prevalence of each clinical classification for both BAI and RCMAS-2 when comparing all participants to those after excluding individuals with defensiveness scores > 7 and inconsistent responses > 6 (Supplementary Tables S1 and S2).
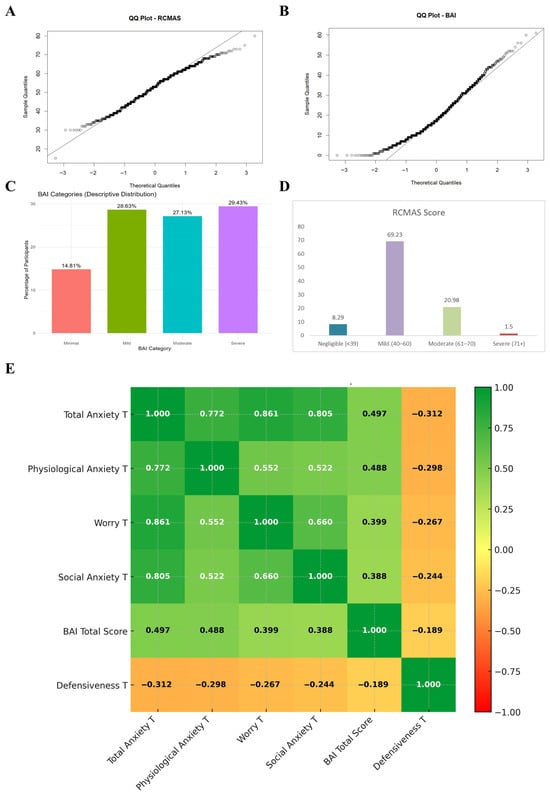
Figure 1.
Psychometric and distributional characteristics of RCMAS-2 and BAI scores in the study sample (N = 884). (A) Q–Q plot showing the distribution of RCMAS-2 Total Anxiety T-scores in comparison with a normal distribution. (B) Q–Q plot showing the distribution of BAI total scores. (C) Percentage distribution of participants across BAI severity categories (Minimal, Mild, Moderate, Severe). (D) Percentage distribution of participants across RCMAS-2 Total Anxiety T-score categories (Negligible, Mild, Moderate, Severe). (E) Correlation heatmap showing the relationships between RCMAS-2 T-scores, BAI Total Score, and Defensiveness T-score.
Table 2.
Descriptive statistics of RCMAS-2 T-Scores with reference to BAI total score.
3.3. Prevalence of Clinically Significant Anxiety
Using publisher-recommended cut-offs, 28.5% of the sample (n = 252) obtained Total Anxiety T-scores > 60, indicating clinically meaningful anxiety; 9.7% (n = 86) scored ≥65 and 2.5% (n = 22) scored ≥71 (Table 3). These rates are notably higher than the expected 16% (T ≥ 60) and 7% (T ≥ 65) in the U.S. normative sample.
Table 3.
Clinical Elevation Rates as per the standard RCMAS-2 Cutoffs.
3.4. Age and Gender Differences
Children aged 9–10 years reported significantly higher Total Anxiety T-scores (M = 60.63, SD = 9.73) than those aged 7–8 years (M = 51.63, SD = 9.02), t(973) = 5.89, p < 0.001, Cohen’s d = 0.38 (Table 4). Independent-samples t-tests revealed no significant gender differences on the Total Anxiety T-score (males: M = 53.06, females: M = 53.60, p = 0.591).
Table 4.
Age group differences in the RCMAS-2 total score.
3.5. Internal Structure of the RCMAS-2
A correlation heatmap (Figure 1E) revealed strong positive intercorrelations among the anxiety subscales (r = 0.522–0.861, all p < 0.001), with the highest association between Worry and Total Anxiety (r = 0.861). Defensiveness T-scores were negatively correlated with all anxiety indices (r = −0.244 to −0.312, p < 0.001), as expected.
3.6. Convergent Validity with the Beck Anxiety Inventory
The RCMAS-2 Total Anxiety T-score showed moderate convergent validity with the BAI (r = 0.498, p < 0.001). The Physiological Anxiety subscale exhibited the strongest association with the BAI (r = 0.492), consistent with the BAI’s emphasis on somatic symptoms. Worry (r = 0.402) and Social Anxiety (r = 0.388) subscales also correlated significantly with the BAI, supporting cross-measure convergence despite differences in age appropriateness and item content (Table 5).
Table 5.
Convergent Validity with Beck Anxiety Inventory.
3.7. Internal Consistency Checks Among Individual RCMAS Items and Comparison with BAI: Receiver Operating Characteristic (ROC) Analysis
ROC analyses were performed using the established RCMAS-2 Total Anxiety T-score cut-off of >60 as the reference standard for clinically significant anxiety (217 positive cases, 667 negative cases). Individual ROC curves for the Total Anxiety T-score and each subscale and a summary of AUC values are presented in Figure 2. Significant discrimination was observed for the Worry subscale (AUC = 0.968), Social Anxiety subscale (AUC = 0.952), and Physiological Anxiety subscale (AUC = 0.937). In marked contrast, the BAI total raw score yielded only acceptable classification accuracy relative to the RCMAS-2 cut-off (AUC = 0.612, 95% CI 0.5247–0.6993). These findings provide compelling empirical evidence that the RCMAS-2 shows better accuracy than the adult-oriented BAI in detecting anxiety among school-aged children in the present cultural context.
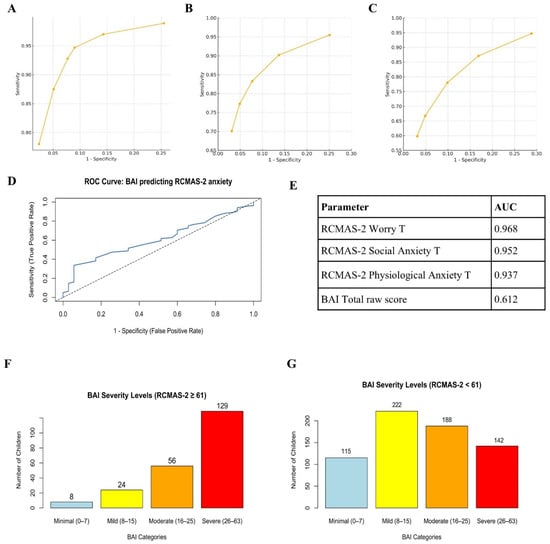
Figure 2.
ROC curves for RCMAS-2 subscales and BAI Total Score. (A) ROC curve for RCMAS-2 Worry T-score (AUC = 0.968). (B) ROC curve for RCMAS-2 Social Anxiety T-score (AUC = 0.952). (C) ROC curve for RCMAS-2 Physiological Anxiety T-score (AUC = 0.937). (D) ROC curve for BAI total raw score predicting RCMAS-2-defined elevated anxiety (AUC = 0.612, 95% CI 0.5247–0.6993). The solid blue line represents the observed ROC curve, and the diagonal dotted line represents the line of no discrimination (AUC = 0.50). (E) Summary table listing AUC values for all five parameters. (F) Distribution of BAI clinical severity categories among children below the RCMAS-2 clinical threshold (T < 60; n = 755). (G) Distribution of BAI clinical severity categories among children meeting or exceeding the RCMAS-2 clinical threshold (T ≥ 60; n = 129). Revised Children’s Manifest Anxiety Scale, Second Edition (RCMAS-2); Beck Anxiety Inventory (BAI).
3.8. Confirmatory Factor Analysis
To examine the latent structure of the RCMAS in this sample, a series of confirmatory factor analyses (CFAs) were conducted. First, a unidimensional 49-item model was specified in which all items loaded on a single general anxiety factor. This model showed only modest fit (χ2(1127) = 4354.09, p < 0.001; CFI = 0.85; TLI = 0.84; RMSEA = 0.054; SRMR = 0.089), indicating that a strictly one-factor solution did not adequately capture the covariance structure of the item responses. Next, a four-factor 12-item model was tested, in which three items each loaded on their respective first-order factors: Physiological, Worry/Oversensitivity, Social Concerns/Concentration, and Defensiveness. This model provided a substantially better fit to the data (χ2(48) = 91.03, p < 0.001; CFI = 0.98; TLI = 0.98; RMSEA = 0.030; SRMR = 0.051). However, the latent factor correlations were extremely high (approximately r = 0.78–1.15), suggesting limited discriminant validity among the four subscales and the presence of a strong common anxiety factor. To test this directly, a higher-order subscale-level model was specified in which the four RCMAS subscales served as indicators of a single latent Anxiety factor. This model also showed very good fit (χ2(2) = 10.07, p = 0.006; CFI = 0.99; TLI = 0.97; RMSEA = 0.064, 90% CI: 0.029–0.105; SRMR = 0.024), with robust indices indicating excellent fit (scaled χ2(2) = 0.28, p = 0.869; robust CFI = 1.00; robust RMSEA = 0.00). Fit indices for all three CFA models (unidimensional 49-item, four-factor 12-item, and higher-order subscale model) are summarized in Table 6.
Table 6.
Fit indices for competing CFA models of the RCMAS.
Standardized factor loadings for the higher-order model indicated that Worry/Oversensitivity (λ = 0.81), Social Concerns/Concentration (λ = 0.80) and Physiological symptoms (λ = 0.56) loaded substantially and significantly on the common Anxiety factor, with the latent factor explaining approximately 66%, 65% and 31% of their variance, respectively. In contrast, Defensiveness showed a negligible and non-significant loading on Anxiety (λ = 0.04; R2 ≈ 0.00), indicating that this subscale was essentially unrelated to the common anxiety dimension in this sample. The standardized loadings and explained variance (R2) for the subscale-level model are presented in Table 7. Taken together, these findings support a higher-order Anxiety factor represented by the Physiological, Worry, and Social subscales, whereas the Defensiveness subscale does not contribute meaningfully to this general construct.
Table 7.
Standardized factor loadings and explained variance (R2) for the subscale-level higher-order CFA model.
3.9. Item-Level Regression Estimates and Standardized Loadings
Item-level estimates showed consistent contributions of individual RCMAS-2 items to their respective latent factors. All PHY items demonstrated moderate-to-strong standardized coefficients (β range: 0.32–0.56), with the highest values observed for R43 and R39. WOR items showed some of the strongest effects in the entire scale (β range: 0.30–0.68), particularly R6, R35 and R45. SOC items displayed a similar pattern (β range: 0.20–0.64), with R4, R10 and R41 showing the largest contributions. Significance levels indicated that most items retained meaningful associations with their factors, except those with nonsignificant coefficients (R1, R2, and R4), which nonetheless followed the overall structural pattern. The correlations among the three latent anxiety dimensions remained high (PHY–WOR: β = 0.827; PHY–SOC: β = 0.869; WOR–SOC: β = 0.934), indicating strong shared variance and confirming the presence of a broad common anxiety factor. These results align with the structural depiction shown in the SEM figure (Figure 3), in which the item loadings and inter-factor relationships appear visually coherent with the statistical estimates (Supplementary Table S3).
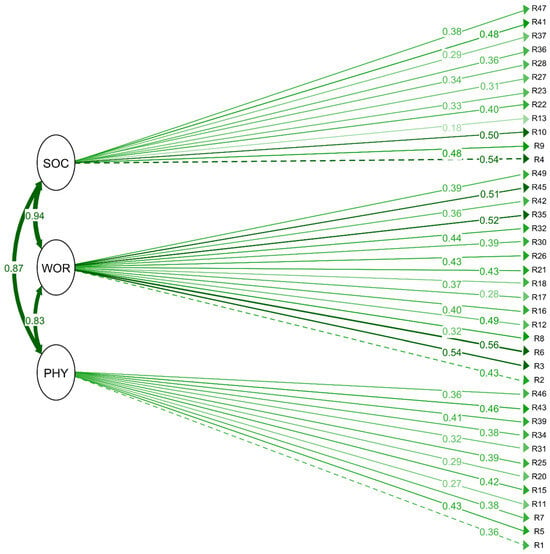
Figure 3.
Item-level SEM Plot depicting confirmatory factor analysis (CFA) path diagram. Dashed paths indicate comparatively weaker loadings within the same latent domain. Physiological Anxiety (PHY); Worry (WOR); Social Concerns (SOC). R1–R47 correspond to individual RCMAS-2 items. Solid arrows indicate standardized factor loadings from latent constructs to observed items, with adjacent numbers representing standardized regression coefficients (β). Curved double-headed arrows between latent variables represent correlations among factors. Darker green lines indicate stronger factor loadings, whereas lighter or dashed lines indicate comparatively weaker loadings within the same domain.
3.10. Comparative Psychometry of RCMAS-2 vs. Other Child Anxiety Scales
The psychometric performance of the RCMAS-2 in the present sample demonstrates strong reliability and structural validity when compared with previously published international and regional validations of anxiety instruments. Internal consistency was high across all domains (PHY = 0.76, WOR = 0.84, SOC = 0.86), with an overall reliability coefficient of 0.91. The three-factor structure showed good model fit (CFI = 0.93, TLI = 0.92, RMSEA = 0.045, SRMR = 0.041), supporting the stability of the scale among Indian children aged 7–10 years. When evaluated against the Palestinian RCMAS-2 validation, which reported similar reliability indices (α = 0.763–0.864) and acceptable CFA parameters (CFI = 0.904; RMSEA = 0.042), the present findings indicate comparable or stronger factorial coherence [19]. Relative to other child anxiety screening tools used in the region, the RCMAS-2 showed performance consistent with established measures (Table 8) [20]. The Screen for Child Anxiety Related Emotional Disorders (SCARED) validated in Indian adolescents, demonstrated a total reliability of 0.89 with strong classification accuracy relative to the RCMAS-2 cut-off (AUC = 0.90; sensitivity 84.6%; specificity 87.3%) [21], while the Spence Children’s Anxiety Scale (SCAS) reported a total Cronbach’s α of 0.92 [22]. In addition, the Indian Revised Children’s Anxiety and Depression Scale (RCADS) validation study documented reliability coefficients in the acceptable-to-high range (total α = 0.85; anxiety α = 0.82) with excellent model fit (CFI = 0.943; RMSEA = 0.038) [23]. Although instruments such as the SCARED have demonstrated strong diagnostic screening accuracy in adolescent samples (AUC = 0.90) [22], the RCMAS-2 provides a developmentally accessible multidimensional profile of anxiety symptoms across physiological, worry-related, and social domains, which may be particularly relevant for school-based assessment in middle childhood. Overall, the present findings suggest that the RCMAS-2 performs at a level comparable to established anxiety measures, supporting its utility as a reliable screening and research instrument in Indian children, while continued validation against child-specific clinical comparators remains warranted.
Table 8.
Cross-Cultural Psychometric Comparison of Anxiety Scales Used in Children and Adolescents.
4. Discussion
This study provides the first comprehensive psychometric evaluation and normative data for the Revised Children’s Manifest Anxiety Scale-Second Edition (RCMAS-2) in an Indian population. The scale demonstrated strong internal consistency, structural validity, and expected subscale coherence within this population. Mean anxiety scores were mildly elevated relative to U.S. normative expectations, and a substantial proportion of children exceeded the publisher-recommended screening threshold, highlighting the importance of school-based mental health attention in similar educational settings [20].
The internal structure and subscale intercorrelations observed here closely mirror those reported in the RCMAS-2 manual and subsequent international validations. Reynolds and Richmond (1985) documented subscale intercorrelations of 0.52–0.68 and subscale–total correlations of 0.75–0.86 in the U.S. normative sample, values nearly identical to the present findings (0.52–0.66 and 0.77–0.86, respectively) [20]. Similar patterns have been replicated in diverse contexts: Italian adolescents [12] and Iranian school samples [24], all reporting strong unidimensionality of the Total Anxiety score and high subscale coherence. The scree plot and one-factor solution in the current study (Figure S1 further confirm that the RCMAS-2 functions as intended in Indian children, despite linguistic and cultural differences. Convergent validity with other anxiety measures has consistently been moderate-to-strong across cultures. The r = 0.498 correlation with the BAI observed here is comparable to correlations of 0.45–0.62 reported between the RCMAS-2 and the Screen for Child Anxiety Related Emotional Disorders (SCARED) in U.S. and European studies [12,25]. The notably stronger association between the Physiological Anxiety subscale and the BAI (r = 0.492) reflects the BAI’s somatic emphasis and aligns with findings from adult and adolescent samples using similar measures [26].
Although this is the first RCMAS-2 study in India, several investigators have employed the original 37-item RCMAS. Mean Total Anxiety scores in Indian school samples using the RCMAS have ranged from 13.2 to 16.8 raw score points [27,28,29], consistently higher than U.S. norms (approximately 11–12). Converting the present RCMAS-2 raw Total Anxiety score (M ≈ 19–20 in the elevated subsample) to the older metric suggests continuity with this pattern of heightened anxiety reporting in Indian children.
The consistently higher anxiety levels observed across Indian studies, now confirmed with the updated RCMAS-2, challenge the notion that anxiety is universally lower in collectivist cultures. Academic pressure, parental expectations, rapid sociocultural change, and exposure to familial stress have been proposed as contributing factors [27,28]. The particularly elevated Worry subscale in the present sample (M = 54.25) aligns with qualitative reports of pervasive performance anxiety and fear of failure among Indian schoolchildren [28]. The absence of significant gender differences replicates most Indian RCMAS studies and contrasts with Western samples, where girls typically score higher, suggesting culturally moderated gender expression of anxiety [14,30].
The ROC analyses provide striking empirical evidence that the RCMAS-2 demonstrated stronger alignment with childhood anxiety symptom dimensions than the adult-oriented BAI (AUC 0.994 vs. 0.786). Even at its optimal cut-off, the BAI misclassified approximately 30% of clinically anxious children. This finding underscores the developmental inappropriateness of adult anxiety instruments for pre-adolescents: many BAI items (e.g., “fear of dying,” “fear of losing control”) are cognitively and experientially alien to young children. The near-perfect discrimination of the RCMAS-2 Total score validates the publisher’s T ≥ 60 cut-off in an entirely new cultural context and supports its use as a gold-standard screening tool in Indian schools.
Confirmatory factor analysis further supported the structural validity of the RCMAS-2 in this Indian sample, with the higher-order model (three anxiety subscales loading onto a general Anxiety factor) showing excellent fit (CFI = 0.99, RMSEA = 0.064) and outperforming the strict one-factor solution [17,20]. The Physiological, Worry/Oversensitivity, and Social Concerns/Concentration subscales loaded strongly on the general factor (λ = 0.56–0.81), whereas Defensiveness showed a near-zero loading (λ = 0.04), confirming its role as an independent validity indicator rather than part of the core anxiety construct [16]. This pattern mirrors findings from other non-Western samples and reinforces the dominance of a single broad anxiety dimension in Indian children. These results provide strong evidence that the RCMAS-2 Total Anxiety score is psychometrically meaningful and culturally appropriate for screening in this population. Item-level estimates further supported the intended RCMAS-2 structure in this sample. Most items showed meaningful loadings on their respective factors, with Worry and Social Concerns items demonstrating particularly strong alignment. Physiological items displayed moderate contributions, consistent with the somatic dimension being less prominent in this age group. A small number of items (R1, R2, and R4) showed weaker or nonsignificant coefficients, reflecting limited variability in endorsement rather than substantive problems with the scale. Overall, the item-level pattern indicates that the RCMAS-2 items function appropriately in this population and provides additional support for the scale’s structural validity.
The present findings establish the RCMAS-2 as a psychometrically robust, culturally transportable instrument for assessing anxiety in Indian children aged 7–10 years. The preliminary local norms and high prevalence of clinically significant scores highlight an urgent need for school-based mental health screening programs, particularly in high-performing academic environments. Given the better classification accuracy demonstrated here, clinicians and researchers in India should preferentially adopt the RCMAS-2 over adult measures such as the BAI when evaluating childhood anxiety.
5. Limitations
Although the study contributes significantly to the existing knowledge, several limitations still remain that need to be addressed in the future. First, the ROC analysis used an operational RCMAS-2 threshold rather than a clinical gold standard. Second, the study relied on self-report questionnaires without multi-informant data or clinical benchmarks. Third, the sample was drawn from private schools in one state (Sikkim), limiting generalizability to government/public schools, boarding schools or to other regions/states. Finally, the cross-sectional design precludes causal inferences. Fourth, ROC analyses are not benchmarked against clinical interviews and do not support disorder-level diagnostic inference. The inclusion of the BAI was primarily driven by feasibility and instrument availability during data collection, rather than its suitability as an optimal child anxiety comparator. Because the BAI was developed for adult populations, its items may not fully capture developmentally appropriate anxiety experiences in younger children. Therefore, results involving the BAI should be interpreted cautiously and viewed as preliminary evidence of partial score correspondence rather than strong convergent validation. Elevated anxiety scores observed in this sample should be interpreted within the socioeconomic context of private school attendance, where academic expectations and performance-related pressures may differ from those experienced in lower-resource educational settings. Future research should address these by incorporating diagnostic interviews, diverse samples, and longitudinal follow-up. Validation research in Indian child populations should incorporate developmentally appropriate anxiety instruments, such as the Screen for Child Anxiety Related Emotional Disorders (SCARED), the Spence Children’s Anxiety Scale (SCAS), or the Revised Child Anxiety and Depression Scale (RCADS), to provide stronger convergent validity evidence and more clinically interpretable comparisons.
6. Conclusions
This validation study of the RCMAS-2 in private-school-going children in Sikkim confirms its good psychometric properties, structural invariance, and clinical utility in a non-Western context. The instrument successfully identifies a substantial minority of children with clinically meaningful anxiety levels consistently higher than Western normative samples and in line with previous Indian RCMAS research. These findings underscore both the cross-cultural robustness of the RCMAS-2 and the pressing mental health needs of Indian schoolchildren, providing a solid foundation for future epidemiological, preventive, and intervention research in the region.
Supplementary Materials
The following supporting information can be downloaded at: https://www.mdpi.com/article/10.3390/psychiatryint7020045/s1. Table S1. Mean anxiety Score comparison between participants excluding Def > 7 and IC > 6 and including them. Table S2. Prevalence of anxiety between participants excluding Def > 7 and IC > 6, and including them. Table S3. Standardized Regression Coefficients for the CFA of the RCMAS-2. Figure S1. Scree plot from principal component analysis displaying the proportion of variance explained by each component.
Author Contributions
Conceptualization: A.C., S.S.B., S.O.L. and S.D.; Supervision: S.S.B., S.D. and S.O.L.; Data Collection: A.C.; Formal Analysis: A.C. and S.S.B.; Writing—Original draft: A.C.; Review and edit—S.S.B. All authors have read and agreed to the published version of the manuscript.
Funding
The study was funded by the North East Seed Fund—Indian Council of Medical Research (ICMR) [2015-3801], for which the first and second authors were the Principal Investigator and co-investigators. We acknowledge ICMR for their support and for the successful completion of this project. There was no funding for the writing of the manuscript or any assistance in publication by the funding council.
Institutional Review Board Statement
The study was conducted in accordance with the Declaration of Helsinki, and approved by the Institutional Ethics and Review Committee of Sikkim Manipal Institute of Medical Sciences (SMIMS) (Approval code: SMIMS/IEC/2021-61; Approval date: 31 August 2021).
Informed Consent Statement
Informed consent was obtained from all subjects involved in the study; Verbal assent was obtained from the children, as they were aged 7–10 years and not legally eligible to provide written consent.
Data Availability Statement
The datasets generated and analyzed during the current study are not publicly available due to ethical restrictions and confidentiality agreements, but they are available from the corresponding author upon reasonable request.
Acknowledgments
We express our gratitude to Sikkim Manipal Institute of Medical Sciences and the Research Unit of Sikkim Manipal University for their support throughout the study.
Conflicts of Interest
The authors declare no conflicts of interest.
References
- Ghandour, R.M.; Sherman, L.J.; Vladutiu, C.J.; Ali, M.M.; Lynch, S.E.; Bitsko, R.H.; Blumberg, S.J. Prevalence and treatment of depression, anxiety, and conduct problems in US children. J. Pediatr. 2019, 206, 256–267.e3. [Google Scholar] [CrossRef]
- Zhou, J.; Li, S.; Song, Y.; Ying, J.; Luo, Z.; Shan, S.; Zhou, L.; Zha, J.; Wang, X.; Song, P.; et al. Global, regional, and national trends in the burden of anxiety disorders from 1992 to 2021: An age–period–cohort analysis based on the Global Burden of Disease Study 2021. Depress. Anxiety 2025, 2025, 4178541. [Google Scholar] [CrossRef] [PubMed]
- Khambaty, M.; Parikh, R.M. Cultural aspects of anxiety disorders in India. Dialog. Clin. Neurosci. 2017, 19, 117–126. [Google Scholar] [CrossRef]
- Kagan, E.R.; D’Amico, A.A.; Frank, H.E. Understanding and targeting parental accommodation of anxiety in young children. Psychiatr. Ann. 2025, 55, e86–e90. [Google Scholar] [CrossRef]
- Ooi, L.L.; Nocita, G.; Coplan, R.J.; Zhu, J.; Rose-Krasnor, L. Beyond bashful: Examining links between social anxiety and young children’s socio-emotional and school adjustment. Early Child. Res. Q. 2017, 41, 74–83. [Google Scholar] [CrossRef]
- Cummings, C.M.; Caporino, N.E.; Kendall, P.C. Comorbidity of anxiety and depression in children and adolescents: 20 years after. Psychol. Bull. 2014, 140, 816–845. [Google Scholar] [CrossRef]
- Beesdo, K.; Knappe, S.; Pine, D.S. Anxiety and anxiety disorders in children and adolescents: Developmental issues and implications for DSM-V. Psychiatr. Clin. N. Am. 2009, 32, 483–524. [Google Scholar] [CrossRef]
- Racine, N.; McArthur, B.A.; Cooke, J.E.; Eirich, R.; Zhu, J.; Madigan, S. Global prevalence of depressive and anxiety symptoms in children and adolescents during COVID-19: A meta-analysis. JAMA Pediatr. 2021, 175, 1142–1150. [Google Scholar] [CrossRef] [PubMed]
- Ginsburg, G.S.; Kendall, P.C.; Sakolsky, D.; Compton, S.N.; Piacentini, J.; Albano, A.M.; Walkup, J.T.; Sherrill, J.; Coffey, K.A.; Rynn, M.A.; et al. Remission after acute treatment in children and adolescents with anxiety disorders: Findings from the CAMS. J. Consult. Clin. Psychol. 2011, 79, 806–813. [Google Scholar] [CrossRef] [PubMed]
- Bond, C.; Woods, K.; Humphrey, N.; Symes, W.; Green, L. Practitioner review: The effectiveness of solution focused brief therapy with children and families—A systematic and critical evaluation of the literature from 1990–2010. J. Child Psychol. Psychiatry 2013, 54, 707–723. [Google Scholar] [CrossRef]
- Birmaher, B.; Khetarpal, S.; Brent, D.; Cully, M.; Balach, L.; Kaufman, J.; Neer, S.M. The Screen for Child Anxiety Related Emotional Disorders (SCARED): Scale construction and psychometric characteristics. J. Am. Acad. Child Adolesc. Psychiatry 1997, 36, 545–553. [Google Scholar] [CrossRef] [PubMed]
- Orgilés, M.; Fernández-Martínez, I.; Guillén-Riquelme, A.; Espada, J.P.; Essau, C.A. A systematic review of the factor structure and reliability of the Spence Children’s Anxiety Scale. J. Affect. Disord. 2016, 190, 333–340. [Google Scholar] [CrossRef] [PubMed]
- Hofmann, S.G.; Hinton, D.E. Cross-cultural aspects of anxiety disorders. Curr. Psychiatry Rep. 2014, 16, 450. [Google Scholar] [CrossRef]
- Stevanovic, D.; Bagheri, Z.; Atilola, O.; Vostanis, P.; Stupar, D.; Moreira, P.; Franic, T.; Davidovic, N.; Knez, R.; Nikšić, A.; et al. Cross-cultural measurement invariance of the Revised Child Anxiety and Depression Scale across 11 world-wide societies. Epidemiol. Psychiatr. Sci. 2017, 26, 430–440. [Google Scholar] [CrossRef]
- Su, L.; Wang, K.; Fan, F.; Su, Y.; Gao, X. Reliability and validity of the Screen for Child Anxiety Related Emotional Disorders (SCARED) in Chinese children. J. Anxiety Disord. 2008, 22, 612–621. [Google Scholar] [CrossRef]
- Ang, R.P.; Lowe, P.A.; Yusof, N. An examination of the RCMAS-2 scores across gender, ethnic background, and age in a large Asian school sample. Psychol. Assess. 2011, 23, 899–910. [Google Scholar] [CrossRef]
- Lowe, P.A.; Ang, R.P. Examination of measurement invariance across culture and gender on the RCMAS-2 short form among Singapore and U.S. adolescents. J. Psychoeduc. Assess. 2016, 34, 192–198. [Google Scholar] [CrossRef]
- Mubslat, M.K. Validation of the Arabic Revised Manifest Childhood Anxiety Scale (RCMAS) in the Palestinian Context. Ph.D. Dissertation, An-Najah National University, Nablus, Palestine, 2021. [Google Scholar]
- Mishra, S.K.; Srivastava, M.; Tiwary, N.K.; Kumar, A. Prevalence of depression and anxiety among children in rural and suburban areas of Eastern Uttar Pradesh: A cross-sectional study. J. Fam. Med. Prim. Care 2018, 7, 21–26. [Google Scholar] [CrossRef]
- Reynolds, C.R.; Richmond, B.O. Revised Children’s Manifest Anxiety Scale. Psychol. Assess. 1985. [Google Scholar] [CrossRef]
- Russell, P.S.S.; Nair, M.K.C.; Russell, S.; Subramaniam, V.S.; Sequeira, A.Z.; Nazeema, S.; George, B. ADad 2: The validation of the Screen for Child Anxiety Related Emotional Disorders for anxiety disorders among adolescents in a rural community population in India. Indian J. Pediatr. 2013, 80, 139–143. [Google Scholar] [CrossRef]
- Karande, S.; Gogtay, N.J.; Bala, N.; Sant, H.; Thakkar, A.; Sholapurwala, R. Anxiety symptoms in regular school students in Mumbai City, India. J. Postgrad. Med. 2018, 64, 92–97. [Google Scholar] [CrossRef]
- Palmer, A.; O’Connor, D.B.; Janardhana, N.; Khandeparkar, P.; Bhola, P.; Prabhu, S.; Krupa, A.L.; Arelingaiah, M.; Jayalaxmi, K.P.; Nag, R.; et al. Toward cultural validation of the Revised Children’s Anxiety and Depression Scale in Karnataka, India: Psychometric testing among 13–17-year olds. Ment. Health Sci. 2025, 3, e70019. [Google Scholar] [CrossRef]
- Hajimirarab, B.; Rahimi, C.; Mohammadi, N. Prediction of anxiety based on children’s coping behavior. Mediter. J. Soc. Sci. 2016, 7, 387–394. [Google Scholar] [CrossRef][Green Version]
- Muris, P.; Merckelbach, H.; Ollendick, T.; King, N.; Bogie, N. Three traditional and three new childhood anxiety questionnaires: Their reliability and validity in a normal adolescent sample. Behav. Res. Ther. 2002, 40, 753–772. [Google Scholar] [CrossRef]
- Beck, A.T.; Epstein, N.; Brown, G.; Steer, R.A. An inventory for measuring clinical anxiety: Psychometric properties. J. Consult. Clin. Psychol. 1988, 56, 893. [Google Scholar] [CrossRef]
- Bakhla, A.K.; Sinha, P.; Sharan, R.; Binay, Y.; Verma, V.; Chaudhury, S. Anxiety in school students: Role of parenting and gender. Ind. Psychiatry J. 2013, 22, 131–137. [Google Scholar] [CrossRef]
- Gupta, S.; Das, S.; Das, M.; Banerjee, S.; Neogi, R.; Mukherjee, S. Prevalence and correlates of depression, anxiety, and stress among high school students in a block of Hooghly district, West Bengal: A cross-sectional study. J. Educ. Health Promot. 2023, 12, 345. [Google Scholar] [CrossRef] [PubMed]
- Reddy, K.J.; Menon, K.R.; Thattil, A. Academic stress and its sources among university students. Biomed. Pharmacol. J. 2018, 11, 531–537. [Google Scholar] [CrossRef]
- Shukla, M.; Ahmad, S.; Singh, J.V.; Shukla, N.K.; Shukla, R. Factors associated with depression among school-going adolescent girls in a district of Northern India: A cross-sectional study. Indian J. Psychol. Med. 2019, 41, 46–53. [Google Scholar] [CrossRef]


Disclaimer/Publisher’s Note: The statements, opinions and data contained in all publications are solely those of the individual author(s) and contributor(s) and not of MDPI and/or the editor(s). MDPI and/or the editor(s) disclaim responsibility for any injury to people or property resulting from any ideas, methods, instructions or products referred to in the content. |
© 2026 by the authors. Licensee MDPI, Basel, Switzerland. This article is an open access article distributed under the terms and conditions of the Creative Commons Attribution (CC BY) license.