Abstract
Production of electric energy from rivers by using mini- as well as micro-hydroelectric power plants is a possible solution, especially in rural and isolated areas. Numerous waterways in Croatia and their hydrological and hydrogeological diversity present an opportunity but also a challenge for the construction of hydroelectric power plants. Due to the complexity of the water course hydrology, as well as hydrogeological characteristics, it is very difficult to determine an appropriate flow pattern (amount), which will be used as an input value for the sizing of hydroelectric power plants. Such analysis will be provided for real case studies in Croatia with special regard to present geological media—media with intergranular porosity (river Bednja), karstmedia (river Gornja Dobra), and flysch media (river Mirna). Taking into account different geological media increases the possibility of using the presented methodology on other locations in Croatia, as well across the world.
1. Introduction
Energy consumption is rapidly growing from year to year and the public and decision makers have realized the importance of switching to clean and renewable energy sources. Renewable power is thriving, as innovations reduce costs, and for the first time the promise of a clean energy future looks achievable. Today, hydropower plants, including small-scale hydropower plants, produce the majority of the energy deemed as renewable. One cannot overlook both mini- (from 100 kW to 500 kW) and micro- (5 kW to 100 kW) hydropower plants, which fit into the group of renewable energy sources. Unlike large-scale hydropower plants, mini- and micro-hydropower plants, if carefully planned and managed, tend to cause no environmental damage and can be considered perfectly safe for the environment. The small hydropower market (up to hydropower plants of maximum power equal to 10 MW) was estimated to be USD 2.6 billion in 2019, and according to projections it will reach 3 billion USD by 2024 [1]. Although the technology used for the production of electric energy in hydropower plants is already well-known and established, nevertheless there is always a need for technological improvements and changes in the sizing methodology, especially in the operational work of mini- and micro-hydropower plants. In accordance with the worldwide notion of “act locally–think globally”, small-scale hydropower plants provide clean and available electric energy, especially in isolated and remote areas, where water streams are available. Moreover, micro- and mini-hydropower plants are nature-friendly, cheaper in comparison to large hydropower plants, and can be installed at almost any water course. Bakis and Demirbas in [2] made an economic and environmental comparison between large- and small-scale hydropower plants in Turkey, and they concluded that there is an environmental impact of large dams, which create huge artificial lakes, flood large lands, displace many people, and destroy natural river flow. Unlike large dams, small-scale hydropower systems produce the energy from flowing water and convert it to usable energy without storing the water in large reservoirs, and they have reemerged as a valuable indigenous energy source due to their renewable, clean energy, cost comparativeness, ease of development, and minimal disturbance to the environment [2].
Small rivers and water courses, with their changeable velocities and torrential characteristics, can pose a challenge when planning for an installation of mini- or micro-hydropower plants. The research conducted in this paper has an important role in providing a better perspective in order to improve the efficiency of micro- and mini-hydropower plants because of the combination of hydrological as well as the hydrogeological analysis. Appropriate understanding of all characteristics of the water courses, as well as a good anticipation of all possible situations and problems that may arise as a result of different climatic conditions in the system, are key prerequisites for the successful design and high efficiency of small hydropower plants. Key input parameters for the sizing of micro- and mini-hydropower plants will be provided through research and analysis of the hydrological and hydrogeological properties of rivers. One of the basic parameters for the hydropower potential of rivers are daily average flows. Considering that, thorough analysis of the time series of average daily flows of water course will be carried out, not just as a mentioned input parameter but also for further elaboration of the project. Other key information for reliable analysis and sizing of the hydropower plant model is the hydrogeological characterization of the medium underlying the riverbed. Rivers flowing over karst terrain often lose part of its water due to seepage through porous beds or through small swallow-holes at the karst stream’s and river’s bottom [3]. This can affect overall flow characteristics and quantities of water in the river especially during the dry season. In contrast, the infiltration into the flysch rock mass is generally slow due to relatively low permeability and a high surface runoff coefficient [4]. When it comes to rivers that flow on a flysch surface, during the rainy season, the waters are prone to turbidity. Fine suspended material can cause problems with installed equipment and reduce the efficiency of the conversion of water energy. Sediment can damage turbines and other mechanical equipment because of erosion of the oxide coating on the blades, causing surface irregularities and significant material damage. This is especially evident when turbidity is caused by sediment containing a higher proportion of harder minerals, such as quartz, tourmaline, and feldspar [5]. When it comes to rivers flowing over coarser-grained sediments, such as sand and gravel, sediment forms, such as dunes, can affect the mean and turbulent flow, sediment dynamics, flow resistance, and energy losses in open channels [6]. The results from [7] demonstrate that flow downstream of coarse-grained bed forms on permeable beds is different to flow over impermeable beds. The leeside flow separation cell is considerably modified by jets of fluid rising from the subsurface, and the reattachment of the separated flow does not occur. Water fluxes at the bed interface are vital for biogeochemical cycling in all rivers.
There are many approaches for defining the hydro-energy potential of the water courses, nevertheless the size and regime of the rivers, as well as insight into the potential and/or kinetic arrangement of the turbines are always considered as key factors. Santos et al. in [8] used numerical modeling, i.e., computation fluid dynamics for the prediction of the flows and velocities in the Amazon river. Moreover, the authors used real measurements for validation. Research presented in [9] was based on the usage of GIS in the model, which takes into the account variables that are decision-making criteria, all in the form of an open source tool. The methodology for determining river energy potential presented in [10] employed the SWAT (Soil and Water Assessment Tool) model, satellite data, and GIS tools.
It is well-known fact that (in general) more complicated and longer time modeling and field measurement gives more reliable insight for the future projects of hydropower plants, regardless of their size. There are even simple methods for such analysis, such as the procedure explained in [11], where analysis of the obtained values was made in the form of a comparison. Such approach gives “first hand” insight into hydropower potential, but there is a need for quite wider projection and analysis. This is a motivation for the presentation of a new method for the analysis of the hydro-energy potential of rivers, which will neither entail complex modeling and/or calculation nor unreliable nor simplified procedures, which will give useless results.
2. Methodology
The presented procedure for defining the hydro-energy potential of the rivers consists of two parts. The first part is the Rescaled Adjusted Partial Sums (RAPS) method, while the second part is a hydrogeological analysis of the analyzed location, in order to obtain a comprehensive view of the topic.
RAPS is a well-known method based on a visual determination of a subseries from an original (given) series of data. By using the average value and standard deviations of the observed time series, RAPS values provide insight into the parts, with the occurrence of the trends, data grouping, fluctuations, and similar appearances during the time:
where Yt is value of the analyzed member (parameter) of the considered time series, Y is average value of the considered time series, Sy is standard deviation of the considered time series; n is number of members of the considered time series, and k = 1, 2, ..., n is the counter during summation.
The RAPS method was mostly used for hydrological analysis of the river flow [12], but it also has a wide range of an application in all research areas. For example, it is used in analysis of precipitation [13], water temperatures [14], meteorological parameters for the purpose of irrigation [15] and clay excavation, as well as for waste water quality analysis [16].
The methodology presented in this paper gives a reliable projection of the hydro-energy potential of the analyzed locations, which could be very useful for investors, as well as for the designers of hydropower plants.
3. Case Study
Three rivers located in different parts of Croatia were selected as the objects of the presented analysis. These are Bednja, Gornja Dobra, and Mirna, shown in Figure 1 [17]. The hydrological (limnigraph) stations where the time series of the average daily flow were taken are Ludbreg (Bednja), Turkovići (Gornja Dobra), and Motovun (Mirna). The Bednja River emerges at the foot of Maceljska Hill and flows 106 km before its confluence with the Drava River near the settlement of Mali Bukovec. The Bednja river basin covers approximately 596 km² and can be divided into two main parts: larger upland (70%) and smaller lowland (30%). The Mirna river is formed by the confluence of rivers Rečina and the Draga some 2.3 km upstream from Buzet and has the longest surface watercourse in Istria with a total length of 53 km. The size of the Mirna river immediate hydrological catchment is about 380 km², and it is situated in the central and western part of the Istrian peninsula which is, structurally speaking, part of the External Dinarides (Felja et al. 2015). The Upper Dobra begins as a surface runoff at the foothills of the Velika Kapela Mountain, near Skrad, during its flow through the dolomites, water losses are minimal. The Upper Dobra flows above ground 51.2 km, but when it reaches limestones, sinkholes start to occur, the biggest being Đula’s abyss in city of Ogulin. The middle part of the river flow is an underground river, which flows through system of caves and conduits with a total length of 16.39 km. Dobra re-emerges as a strong permanent karstic spring near the village of Gojak and flows 52.1 km until it joins the Kupa River.
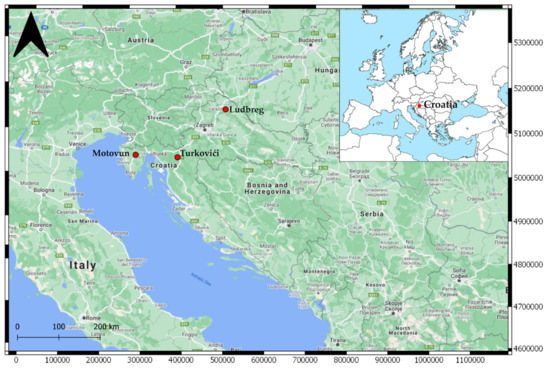
Figure 1.
Locations of the analyzed rivers and hydrological measuring stations [17].
Each of the rivers flows through different geological, i.e., hydrogeological media, which definitely has an impact on the hydrological characteristics of the observed rivers.
Bednja flows through intergranular media, Gornja Dobra through karst, while Mirna flows through the flysch (marl) media. This consequently has an impact on the hydro-energy potential of the rivers (Table 1).

Table 1.
Characteristics of the rivers Bednja, Gornja Dobra, and Mirna [18].
4. Results and Discussion
Figure 2, Figure 3, Figure 4, Figure 5, Figure 6 and Figure 7 show hydrograms and RAPS diagrams for the flows measured at the measuring stations on the rivers Bednja, Gornja Dobra, and Mirna for the analyzed period of 20 years, from 1999 to 2018 [19]. The general conclusion is that all three rivers have torrential characteristics, which can be seen from the hydrograms. Pronounced peaks are one of these indicators. Precipitation causes a very fast rising of the hydrograms after a minimum of one day after the precipitation ends, and very short lag of the alighting. Moreover, during summer periods, i.e., the middle of each observed year, in most cases, it could be concluded that flows are the smallest in comparison to the entire year. Further, 2011 and 2012 were the years with lowest flows for all the analyzed rivers.
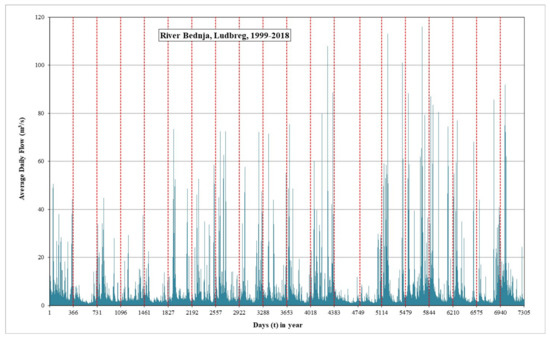
Figure 2.
Average daily flow of the river Bednja, 2020.
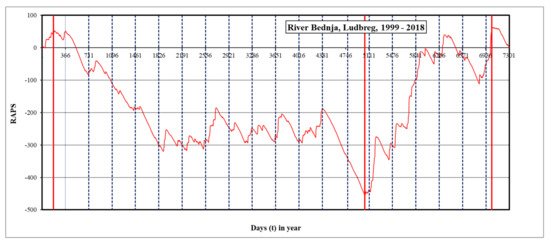
Figure 3.
RAPS diagram for the river Bednja.
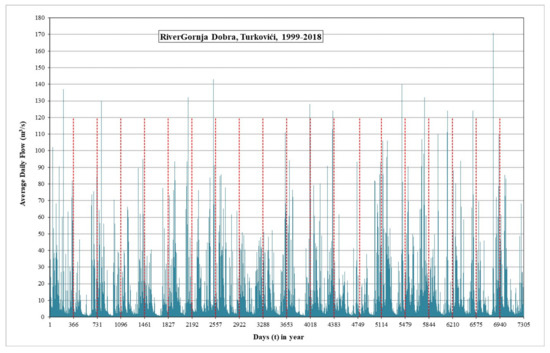
Figure 4.
Average daily flow for the river Gornja Dobra, 2020.
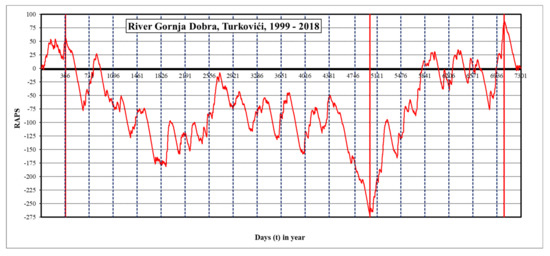
Figure 5.
RAPS diagram for the river Gornja Dobra.
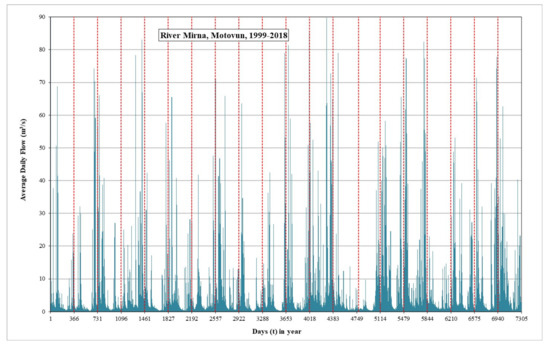
Figure 6.
Average daily flow for the river Mirna, 2020.
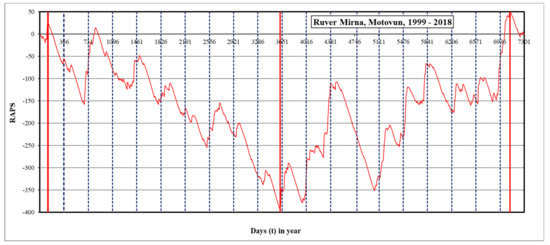
Figure 7.
RAPS diagram for the river Mirna.
Table 2 shows the average values, standard deviations, minimum, and maximum values of the average daily flow of the analyzed rivers during the observed period of 20 years.

Table 2.
Statistical parameters of the average daily flows for the rivers Bednja, Gornja Dobra, and Mirna.
Analysis of the RAPS diagram for the river Bednja establishes four subperiods. The first one is until middle of 1999, the second from the middle of 1999 until the end of 2012, the third from the end of 2012 until the beginning of 2018, and last one from the beginning of 2018 (fourth subseries). The second subperiod is the period of the conditionally speaking “low flow” compared with the third subperiod of “high flow” years.
Figure 5 shows a larger number of the subseries. Analysis of the RAPS diagram for the river Gornja Dobra asserts four subperiods. The first one is until the end of 1999, the second from the end of 1999 until the end of 2012, the third from the end of 2012 until the beginning of 2018, and the last one from the beginning of 2018. RAPS diagrams for Gornja Dobra and Bednja also show four subseries as with Bednja, but there is not complete overlap. The joint parts are the beginning of the subdivision for the years 1999 and 2018. This implies regional climate change. Other subdivisions are not so easy to explain. Such could be a consequence of regulation work on the rivers, or maybe local climate change, particular to the analyzed area(s).
For the river Mirna, analysis of the RAPS also asserts four subperiods. The first one is prior to 1999, the second is from the beginning of 1999 until the end of 2008, the third from the end of 2008 until the beginning of 2018, and the last one from the beginning of 2018.
Regarding the hydro-energy potential, such analysis indicates that in case of occurrence of the subseries within original time series of the flow, attention should be focused on these parts of the analyzed time periods. Specifically, in the analyzed cases, the periods after 2018 are interesting, because there are irregularities, which affect average daily flow series. Calculation of the flow required for sizing of the hydropower plants should be focused on those values in such subseries. This surely depends on the duration of the available time series (10, 20, or longer), because RAPS calculation will not show same division of the given time series. That will be the object of further analysis, which will not be presented in this paper, but definitely will be presented in an extension of the paper.
Figure 8 shows the surroundings of the measuring station at Ludbreg on the river Bednja. Figure 9 shows the measuring station at Turkovići on the river Gornja Dobra, while Figure 10 shows the surroundings of the measuring station at Motovun on the river Mirna [20].
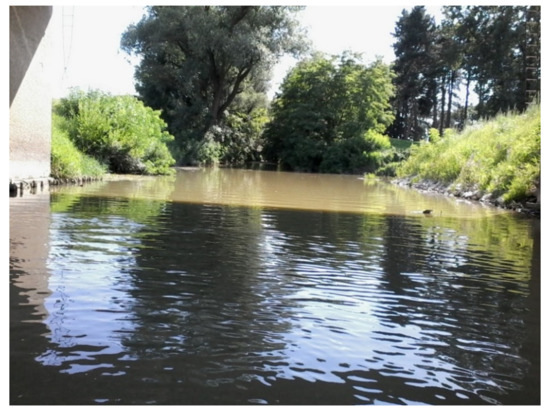
Figure 8.
View at the measuring station of Ludbreg on the river Bednja.
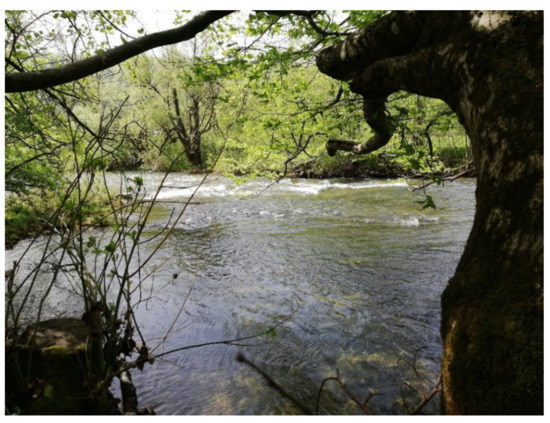
Figure 9.
View of the measuring station Turkovići on the river Gornja Dobra.
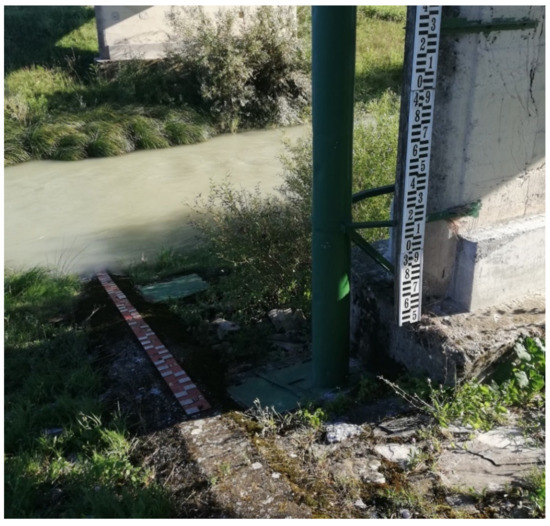
Figure 10.
View at the measuring station of Motovun on the river Mirna.
From Table 1, it can be seen that the river Gornja Dobra has largest deviation of the averaged daily flow, compared with the Bednja and Mirna. This can be explained by the characteristics of the riverbed. Gornja Dobra emerges near Skrad, in the area comprised of Palaeozoic clastites. After that, the river flows over the Jurassic limestones and dolomites of the Ogulin-Oštarije karst platform. During its flow through the dolomites, flow losses are small due to the lack of caverns and sinkholes, which are characteristic feature of limestones [21]. Dolomites are mostly impermeable, and in the karst, they represent a barrier to the passage of water. The river Mirna, on the other hand, flows on the flysch media, which is comprised mainly of marls in alternation with sandstones, bedded limestones and conglomerates. This type of layer has reduced permeability, which causes a formation of a network of surface water courses [22]. The river Bednja has a typical riverbed developed on sediments characterized by intergranular porosity and low permeability.
5. Conclusions
The presented methodology has shown the regime of the water flow by application of the RAPS analysis of the average daily flow series, together with review of the hydrogeological characteristics. Small- and mini-hydropower plants are a valuable energy source due to being renewable, having clean energy, cost comparativeness, ease of development, and minimal disturbance to the surrounding environment. The hydrological and hydrogeological river analysis provided in this paper provides background for better and efficient sizing of a small-scale hydropower plant. The results given by the RAPS method, as well as the use of hydrogeological data, shows that all the analyzed rivers have potential for building small-hydropower plants. Detailed analysis, i.e., extension of the research in the first step will include analysis of other measuring stations on the analyzed rivers and establishing the functional connections between flows measured on several measuring stations. A next step is field measurement and prospection on the potential locations, where installation of the hydropower plants is possible, and where data do not exist, with regard to the hydrogeological properties. Numerical analysis should include RAPS analysis of the precipitation time series, as well as of each particular time series of the average daily flow, in order to obtain a complete picture of the analyzed area.
Author Contributions
B.Đ. and L.P. conceived and designed the experiments; B.Đ. and L.P. performed the experiments; D.D. and B.Đ. analyzed the data; L.P., D.D. and N.K. contributed analysis tools; B.Đ. and D.D. wrote the paper. All authors have read and agreed to the published version of the manuscript.
Funding
This research received no external funding.
Institutional Review Board Statement
Not applicable.
Informed Consent Statement
Not applicable.
Data Availability Statement
All used data sets available on request by contacting the corresponding author.
Conflicts of Interest
The authors declare no conflict of interest.
Abbreviations
The following abbreviations are used in this manuscript:
| RAPS | Rescaled Adjusted Partial Sums |
| SWAT | Soil and Water Assessment Tool |
| GIS | Geographic Information System |
References
- Qaranta, E. HYDROPOWER, Hydropower Development and Sustainability Project. The Next Frontier. 2020. Available online: https://www.researchgate.net/HYDROPOWER (accessed on 7 October 2020).
- Bakis, R.; Demirbaş, A. Sustainable Development of Small Hydropower Plants (SHPs). Energy Sources 2004, 26, 1105–1118. [Google Scholar] [CrossRef]
- Bonacci, O.; Terzić, J.; Roje-Bonacci, T.; Frangen, T. An Intermittent Karst River: The Case of the Čikola River (Dinaric Karst, Croatia). Water 2019, 11, 2415. [Google Scholar] [CrossRef]
- Jovančević, S.D.; Rubinić, J.; Ružić, I.; Radišić, M. Influence of Carbonate-Flysch Contact and Groundwater Dynamics on the Occurrence of Geohazards in Istria, Croatia. Land 2021, 10, 441. [Google Scholar] [CrossRef]
- Dorij, U.; Ghomaschi, R. Hydro Turbine Failure Mechanisms: An Overview. Eng. Fail. Anal. 2014, 44, 136–147. [Google Scholar] [CrossRef]
- Sinha, S.; Hardy, R.J.; Blois, G.; Best, J.; Smith, G.H.S. A numerical investigation into the importance of bed permeability on determining flow structures over river dunes. Water Resour. Res. 2017, 53, 3067–3086. [Google Scholar] [CrossRef]
- Blois, G.; Best, J.L.; Smith, G.H.S.; Hardy, R.J. Effect of bed permeability and hyporheic flow on turbulent flow over bed forms. Geophys. Res. Lett. 2014, 41, 6435–6442. [Google Scholar] [CrossRef]
- Santos, I.F.S.; Camacho, R.G.R.; Fiho, G.L.T.; Botan, A.C.B.; Vinent, B.A. Energy Potential and Economic Analysis of Hydrokinetic Turbines Implementation in Rivers: An Approach Using Numerical Predictions (CFD) and Experimental Data. Renew. Energy 2019, 143, 648–662. [Google Scholar] [CrossRef]
- Garegnani, G.; Sacchelli, S.; Balest, J.; Zambelli, P. GIS-based approach for assessing the energy potential and the financial feasibility of run-off-river hydro-power in Alpine valleys. Appl. Energy 2018, 216, 709–723. [Google Scholar] [CrossRef]
- Pandey, A.; Lalrempuia, D.; Jain, S.K. Assessment of hydropower potential using spatial technology and SWAT modelling in the Mat River, southern Mizoram, India. Hydrol. Sci. J. 2015, 60, 1651–1665. [Google Scholar] [CrossRef]
- Kalnacs, A.; Kalnacs, J.; Mutule, A.; Persis, U. Methods for Estimation of the Riverflow Potential for Hydrokinetic Power Generation. Latv. J. Phys. Tech. Sci. 2014, 51, 3–10. [Google Scholar] [CrossRef]
- Bonacci, O.; Andrić, I. Sinking Karst Rivers Hydrology—Case of the Lika and Gacka (Croatia). Acta Carsol. 2008, 37, 185–196. [Google Scholar] [CrossRef]
- Garbrecht, J.; Fernandez, G.P. Visualization of Trends and Fluctuations in Climatic Records. J. Am. Eater Resour. Assoc. 1994, 30, 297–306. [Google Scholar] [CrossRef]
- Basarin, B.; Lukić, T.; Pavić, D.; Wilby, R.L. Trends and multi-annual variability of water temperatures in the river Danube, Serbia. Hydrol. Process. 2016, 30, 3315–3329. [Google Scholar] [CrossRef]
- Težak, D.; Soldo, B.; Đurin, B.; Kranjčić, N. Impact of Seasonal Changes of Precipitation and Air Temperature on Clay Excavation. Sustainability 2019, 11, 6368. [Google Scholar] [CrossRef]
- Đurin, B.; Ptiček Siročić, A.; Muhar, A. Analiza povezanosti pokazatelja kakvoće otpadne vode s temperaturom i oborinama pomoću RAPS metode. Hrvat. Vode 2017, 25, 247–252. Available online: https://hrcak.srce.hr/file/284095 (accessed on 12 October 2020).
- Google Maps. Available online: https://www.google.com/maps-croatia (accessed on 1 November 2020).
- Croatian Meterological and Hydrological Service (CMHS). Available online: https://hidro.dhz.hr/ (accessed on 13 December 2021).
- Croatian Meteorological and Hydrological Service (CMHS). Data Files: Daily Flows for Ludbreg, Turkovići and Motovun from 1999 till 2018; CMHS: Zagreb, Croatia, 2020. [Google Scholar]
- Đurin, B. Photos taken on case study site in period between 2018–2020: Digital files.
- Bonacci, O.; Andrić, I. Hidrološka analiza krške rijeke Dobre. Hrvat. Vode 2010, 72, 127–138. Available online: https://www.voda.hr/sites/default/files/pdf_clanka/hv_72_2010_127-138_bonacci-andric.pdf (accessed on 1 November 2020).
- Knežević, R. Water flow conditions and Stream flow regime in the catchment area of the Mirna River. Hrvat. Geogr. Glas. 2003, 65, 81–98. [Google Scholar] [CrossRef]
Disclaimer/Publisher’s Note: The statements, opinions and data contained in all publications are solely those of the individual author(s) and contributor(s) and not of MDPI and/or the editor(s). MDPI and/or the editor(s) disclaim responsibility for any injury to people or property resulting from any ideas, methods, instructions or products referred to in the content. |
© 2020 by the authors. Licensee MDPI, Basel, Switzerland. This article is an open access article distributed under the terms and conditions of the Creative Commons Attribution (CC BY) license (https://creativecommons.org/licenses/by/4.0/).