Abstract
The intermediate-sulfidation epithermal Kylo deposit is part of the Drake Goldfield of north-eastern NSW. The mineralization is gold-dominant with minor silver and significant levels of zinc, copper and lead. Kylo has a resource of 2.298 Mt @ 1.23 g/T Au and 1.35 g/T Ag. Mineralization mainly occurs in the form of vein stockworks. Petrographic and SEM analysis shows that there are at least three mineralization events, with Au mineralization strongly associated with at least a deposit-scale alteration event. Quantitative XRD analysis shows a positive correlation between Au-mineralization and argillic-phyllic alteration. Electrum was found as an inclusion in massive sphalerite in the main mineralization stage. Correlation analysis for the assay data indicates that Au has a strong relation with Ag and Pb. Petrographic and geochemical analysis has identified three lithologies: rhyolite, rhyodacite/dacite and andesite, with Au mineralization more associated with the rhyodacites, while at deeper levels some of the andesites also show a relatively strong correlation with Au. Strontium shows a significant strong depletion, due to the intense and pervasive alteration at Kylo. The andesitic volcanics show moderate LREE enrichment with small negative Eu anomalies, and relative depletion in Nb, Ta and Ti, indicating an island arc tectonic setting. The carbon and oxygen isotopes of late-stage vein carbonates suggest that the late-stage fluid was mostly derived from a magmatic source, but with a minor contribution from low-temperature fluids intimately associated with alteration processes. The sulfur isotopes indicate that the sulfide mineralization had a magmatic sulfur source.
1. Introduction
The Drake Goldfield, also known as Mount Carrington, is located in north-eastern New South Wales (NSW) Australia, ~5 km north-east of Drake Village, 44 km east of Tenterfield, and ~800 km north of Sydney (Figure 1). It contains a number of low sulfidation epithermal precious metal deposits (Figure 2), including Kylo, Strauss, Red Rock, Lady Hampden, Silver King, White Rock and White Rock North [1]. These deposits occur exclusively within the Drake Volcanics, which comprise a 60 × 20 km NW-SE trending sequence of Late Permian shallow volcanics and related epiclastics within the southern part of the New England Orogen (NEO). The first significant precious metal deposit discovered in the Drake Volcanics was the White Rock silver deposit in 1886 and its geology was first described by Andrews [2]. Subsequently, many deposits of differing styles were discovered and mined. Although being known and mined for over 100 years, there has been no detailed study on the deposits associated with the Drake Volcanics as a whole, with the only study of any detail being that of Perkins [3] on the deposits of the Red Rock Field which is one of the smallest of the fields within the larger Drake Goldfield. Recent work by White Rock Minerals Ltd. suggests that most of the economic precious metal deposits within the Drake Volcanics are centered upon a geophysical anomaly called “the Drake Quite Zone” (DQZ), interpreted to be a collapsed volcanic caldera structure. Recent estimates suggest that the Drake Goldfield contains an Indicated and Inferred Resource of 23.3 Moz of Ag and 352 Koz of Au [4]. Kylo has a resource of 2.298 Mt @ 1.23 g/T Au and 1.35 g/T Ag. Recent Honors’ projects include studies on the relationships between mineralization, grade and alteration assemblages/intensity for the White Rock deposit; on the Lady Hampden deposit; on the relationship between primary volcanic facies and mineralization and correlation between the White Rock and White Rock North deposits [5,6,7]. Additionally, as part of her PhD, Lay [8] worked on the primary Ag mineralogy for a number of the Ag-rich deposits within the Drake Goldfield.
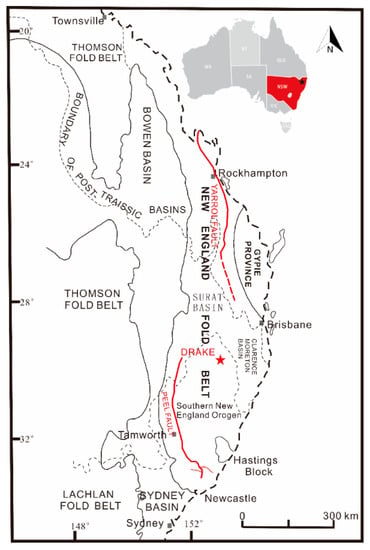
Figure 1.
Simplified map showing the NEO, and the location of Drake (modified after [9]).
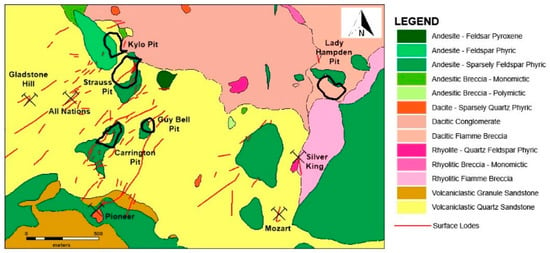
Figure 2.
Simplified local geological map for the Kylo deposit (modified after [10]). Note: Red Rock, White Rock and White Rock North are not shown on this map.
This paper focusses on one of the largest Au-dominated deposits—Kylo. It not only identifies the links between the volcanic units and Au mineralization, but also provides a comprehensive analysis on the genesis and the evolution of the deposit. New insights into the Kylo deposit and knowledge of controls on the Au mineralization can be used strategically for proposed future mining and exploration programs of not only the Drake Goldfield, but also of other epithermal systems in the New England Orogen, and Au-rich epithermal systems in general.
2. Materials and Methods
Samples for this study were collected from selected relatively mineralized and highly mineralized drill cores based on the assay data (provided by White Rock Minerals Ltd.), in order to study gold mineralization in the high-grade and low-grade zones of the deposit. Samples from KYDD003, KYDD007, KYDD008 and KYDD015 were selected for sectioning to examine their mineralogy and associations, textures and chemistry. Pulp samples from the selected drill cores were also sampled for the alteration and geochemical study.
Mineral species were verified using a combination of a Leica microscopy, X-ray diffraction (XRD) and a scanning electron microscopy (SEM). As for the geochemistry, data were collected using laboratory X-ray fluorescence (XRF), inductively coupled plasma mass spectrometer (ICP-MS) and Portable X-ray fluorescence (pXRF). XRD, SEM, XRF and carbon & oxygen isotope were carried-out at the Mark Wainright Analytical Centre, UNSW, Sydney, NSW, the sulfur isotopes were analyzed at the University of Tasmania and the ICP-MS were analyzed at the School of Earth Sciences, University of Melbourne.
XRD was carried-out at UNSW using the PANalytical Empyrean II XRD, while the Olympus Terra 6400 pXRD was used to identify the carbonate species prior to stable isotope analysis. Data were subsequently converted using ConvX and analysed in HighScore (Plus)TM and SiroquantTM (v.4) commercial interpretation software [11]. Machine settings and operational procedures followed those of Burkett et al. [12]. XRF analyses were conducted using either the PW2400 WDXRF Spectrometer or the Axios Advanced WDXRF Spectrometer. For full details on the analytical procedure, see Norrish and Chappell [13]. The trace elements for the same two samples were analysed using the Agilent 7700x ICP-MS following procedures modified from Eggins et al. [14] and Kamber et al. [15]. pXRF analysis was performed using the Innov-X Delta P6000 pXRF. SEM was undertaken using a Hitachi 3400-X(I) SEM. Backscatter and secondary electron detectors were fitted which allowed for compositional and topographic imaging. The SEM was operated at an accelerating voltage of 15–20 kV, with a current setting between 30–50. Carbonate vein minerals from Kylo were collected as ground powders through the use of a tungsten-tipped micro-drill. They were then placed in small sample holders before being ground to <50 μm. After each sample was collected, the micro-drill head was thoroughly cleaned with 85% acetone solution. The procedure followed that of Markowska et al. [16]. For sulfur isotope analysis, the following procedure was undertaken: between 0.4 and 1.0 mg of finely powdered sample was weighed in tin capsules and analyzed for sulfur stable isotopes using a flash combustion isotope ratio mass spectrometry (varioPYRO) cube coupled to Isoprime100 mass spectrometer. The SO2 produced during combustion was collected in a trap, then fed into the mass spectrometer and measured against a reference gas. Stable isotope abundances are reported in delta (δ) values as the deviations from conventional standards in parts per mil (‰). The δ34S values are reported relative to the CDT (Canyon Diablo Troilite). International reference standards with known isotopic compositions were measured for instrument calibration and quality assurance after every six sample. The analytical performance of the instrumentation, drift correction and linearity performance were calculated from the repetitive analysis of these standards. Precision was 0.2‰ for isotopic measurements and 0.25‰ for elemental percentages.
3. Results and Discussion
3.1. Petrography, Alteration and Mineralisation
The host rock lithology at Kylo is dominated by crystal-lithic vitric tuffs varying in composition from andesitic to dacitic, with mineralization occurring primarily in veins (Figure 3a–c). The dacitic tuffs have a porphyritic texture with a fine-grained groundmass, while the andesitic tuffs have a hyalopilitic textured groundmass with illitized feldspars. Phenocrysts consist of abundant altered feldspar quartz, clinopyroxene and hornblende. Most of the feldspar phenocrysts have been replaced by illite and muscovite (Figure 3e), while clinopyroxene and hornblende have been replaced by chlorite and illite (Figure 3d). The lithic clast composition varies from rhyolitic to andesitic. Illitization and pyritization are pervasive throughout the host tuffs at Kylo (Figure 3d–f). Carbonate is the last phase to have formed. Hydrothermal alteration, as revealed by XRD, primarily includes silicification, chloritization, illitization and a small amount of sericitization, pyritization and carbonization (Figure 3), of which illitization and chloritization are related to the mineralization. Argillic and phyllic alteration assemblages are abundant at the top of the drill cores, while propylitic alteration is more common towards the base. Based on petrographic and laboratory XRD analysis, argillic alteration has a positive correlation with the mineralization in Kylo.
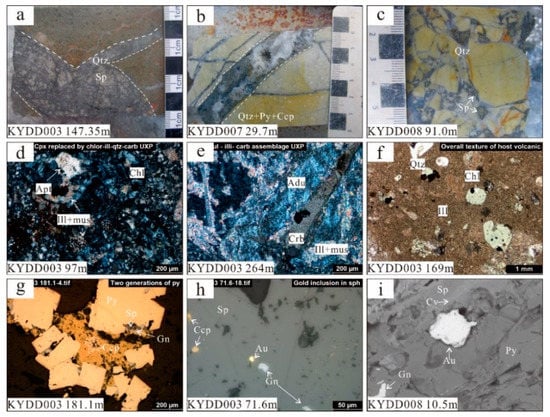
Figure 3.
Images of drill core samples and photomicrographs for the Kylo Au-Ag deposit: (a) 4 cm wide vein of coarse-grained Fe-poor sphalerite; (b) 2 cm wide open-space vuggy quartz with pyrite and chalcopyrite; (c) hydrothermal breccia with infill of low-Fe sphalerite; (d) former clinopyroxene phenocryst replaced by chlorite-illite with accessory apatite in dacitic tuff; (e) former feldspar replaced by adularia-illite-muscovite-carbonate in dacitic tuff; (f) volcanic quartz, chloritized former pyroxene and illitized former feldspar in dacitic crystal lithic tuff; (g) coarse-grained pyrite surrounded by chalcopyrite, sphalerite and galena; (h) electrum (gold dominant) grain in massive sphalerite. (i) SEM image of electrum grain between pyrite and sphalerite, with covellite vein in sphalerite. Abbreviations: qtz—quartz; crb—carbonate; ill—illite; chl—chlorite; mus—muscovite; apt—apatite; adu—adularia; ccp—chalcopyrite; py—pyrite; sp—sphalerite; gn—galena; au—electrum (gold dominated); cv—covellite.
Based on microscopic textural observations, mineralization at Kylo is of a polymetallic type, with at least three hydrothermal mineralization stages. The first stage can be observed as the assemblage of early framboidal pyrite (Py1), then, later, inclusion-rich, subhedral-euhedral disseminated pyrite (Py2) with coarse-grained quartz (Q1) in the host rock. Galena (Gn1), sphalerite (Sp1) and chalcopyrite (Ccp1) all occur as minor inclusions in pyrite. The second stage is defined by the intergrowth of sphalerite (Sp2) and galena (Gn2), with the sphalerite containing exsolution of chalcopyrite blebs (Ccp2). The third stage is shown by the assemblage: chalcopyrite + pyrite + electrum + tennantite. Electrum occurs as inclusions/small blebs associated with Sp2 and Py2 (Figure 3h,i), tennantite (devoid of silver) is mostly associated with chalcopyrite. The last stage is a post-mineralization stage and comprises the assemblage: covellite + chalcocite + calcite, with late-stage covellite and chalcocite rimming/replacing stage III chalcopyrite (Figure 3i).
3.2. Assay Data Statistical Analysis
Due to the assay data not being normally distributed, Spearman’s correlation coefficients (ρ) were used for the statistical analysis, and these results are shown in Figure 4. The following analysis comprises 603 assay data from Kylo. Au has a high correlation with Ag (ρ = 0.71) and Pb (ρ = 0.71), while Ag shows a moderate correlation with Cu (ρ = 0.58). Ag also shows a strong correlation with Pb (ρ = 0.83) and Cu (ρ = 0.75), and a moderate correlation with Zn (ρ = 0.62). Pb also has a moderate correlation with Cu (ρ = 0.60) and Zn (ρ = 0.68). These correlations suggest the possibility of Au occurring as Au-Ag alloys and closely associated with Pb and Cu-bearing sulphides.
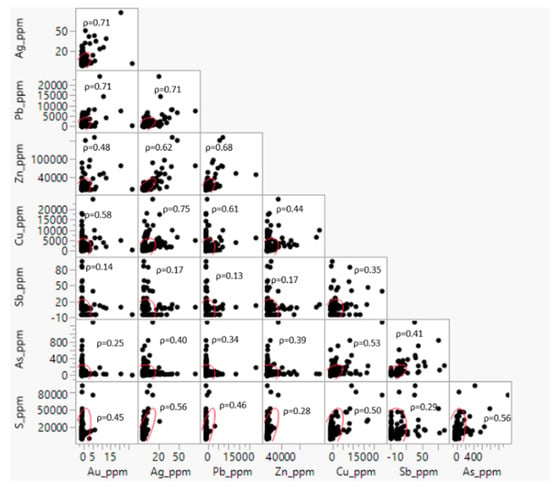
Figure 4.
Scatterplot of the selected elements form Kylo assay data. N = 603.
3.3. Geochemistry
3.3.1. pXRF
Due to the pervasive and intense alteration throughout Kylo, only the immobile elements (e.g., Ti, Zr, Nb and Y) were used to reveal the host rock type. The pXRF results show a classification of rhyolite, rhyodacite/dacite and andesite.
3.3.2. Whole Rock Geochemistry
Some of the whole rock geochemistry for KYDD008 and KYDD015 is plotted in Figure 5. Strontium shows a significant strong depletion, due to the intense and pervasive alteration at Kylo. The andesitic volcanics show moderate LREE enrichment with small negative Eu anomalies, and relative depletion in Nb, Ta and Ti, indicating an island arc tectonic setting [17].
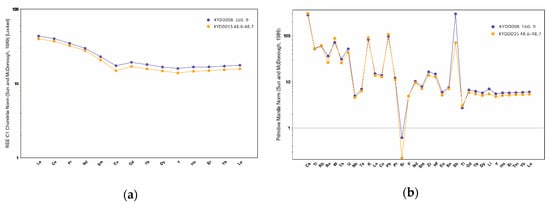
Figure 5.
Chondrite-normalized REE (a) and primitive-mantle-normalized (b) trace element patterns of the andesitic volcanic rocks from the Kylo deposit, the normalisation values are from Sun and McDonough [18].
3.4. Stable Isotopes
Using pXRD, two species of carbonates were identified at Kylo: magnesite and calcite. The results of stable isotopes from Kylo are listed in Table 1.

Table 1.
Carbon, oxygen and sulfur isotope compositions from Kylo.
The range of C and O compositions for the carbonates are δ13CPDB from −7.83 to −6.79‰, and δ18Osmow from 8.75 to 15.88‰. The δ13CPDB value is close to the mantle range, showing a deep source character, while the plot in the δ 18O–δ13C diagram shows the points drifting towards higher δ18O values, most likely due to a significant influence of low-temperature alteration. Carbon dioxide equilibrated with calcite from Kylo (late stage) has δ13C values of −5.69 to −4.97‰ (average −5.36‰), which agree well with δ13C of CO2 in geothermal systems from New Zealand (−9.1 to −3.2‰; [22]), and are also consistent with carbon sourced from global volcanic CO2 (−10 to 2‰; [23]). Due to the relatively narrow range of carbon isotopic composition of atmospheric CO2 (−8 to −6‰; [23]), we suggest a dominantly magmatic origin for the carbon at Kylo. The calculated δ18O values of ore-forming fluids vary from 3.18‰ to 10.31‰, with the average value at 6.63‰ in the late stage, which are in agreement with many previous studies which indicate that the ore-forming fluids were gradually mixed with meteoric water during mineralization (e.g., [24]). The meteoric water is not only low in its δ18O value, but low in its δD value as well (~−120%). If the ore-forming fluids were mixed with meteoric water, a shift towards lower δD values should be observed. Thus, further works on the hydrogen isotope compositions are required for a more complete understanding, and these would have to be done on the associated silicate minerals. In this study, sulfides from Kylo have δ34S values between −6.96 to −2.78‰, with the majority close to 0‰, similar to previous studies on epithermal deposits worldwide (−6~5‰; [23,25]). These sulfides have a relatively narrow range of δ34S compositions, suggesting that they formed under stable physical and chemical conditions and were derived from a relatively homogeneous source [25]. The δ34S values for Kylo suggest that the sulfur has a magmatic origin or has been leached from the host volcanic sequence (~1‰, [26]).
4. Conclusions
Kylo is host to an intermediate sulfidation epithermal deposit with a strong association between Au-mineralization and argillic alteration events. At least three mineralization events, and multiple alteration events, are evident at Kylo, and there is a clear relationship between the mineralization and argillic alteration. Rhyolitic, dacitic and andesitic vitric-lithic crystal tuffs were widely developed in Kylo, with late-stage hydrothermal fluids being largely magmatic in origin, but influenced by low-temperature fluids associated with the alteration processes. In contrast, the sulfur in the sulfides had a magmatic source.
Author Contributions
H.Q. collected the samples, wrote the manuscript and interpreted the results of the analyses. I.G. collected the samples, provided technical input, funding and supervised the project. R.W. provided geological expertise on the Drake Goldfield region. D.F. provided mineralogical expertise while L.A. provided technical input and ran the carbon and oxygen isotope analyses. C.D. carried out and provided technical input on the sulfur isotopes while A.G. provided technical input and ran the ICP-MS for whole rock geochemistry. All authors have read and agreed to the published version of the manuscript.
Funding
This research was partly funded by the PANGEA Research Centre, School of Biological, Earth and Environmental Sciences, UNSW Sydney, White Rock Minerals Ltd. Hongyan Quan was supported in part by the China Scholarship Council (No. 201706170039).
Institutional Review Board Statement
Not applicable.
Informed Consent Statement
Not applicable.
Acknowledgments
The authors acknowledge the facilities and the scientific and technical assistance of Microscopy Australia at the Electron Microscope Unit (EMU), the X-ray Fluorescence Laboratory and the X-ray Diffraction Laboratory within the Mark Wainwright Analytical Centre (MWAC) at UNSW Sydney.
Conflicts of Interest
The authors declare no conflict of interest.
References
- White Rock Minerals. Mt Carrington Project: Overview, Geological Setting, Resources, Development, Exploration Gold and Silver, and Exploration Copper. 2020. Available online: https://www.whiterockminerals.com.au/mt-carrington-overview (accessed on 7 August 2019).
- Andrews, E.C. Report on the Drake Gold and Copper Field by EC Andrews, Geol. Survey; WA Gullick, government printer: Sydney, Australia, 1908. [Google Scholar]
- Perkins, C. The red rock deposit: Late Permian submarine epithermal precious metal system in the Drake Volcanics. In Pacific Rim 87. International Congress on the Geology, Structure, Mineralisation and Economics of Pacific Rim; New England Orogen (NEO) Tectonics and 620Metallogenesis, University of New England: Armidale, Australia, 1988; pp. 275–289. [Google Scholar]
- White Rock Minerals, Exceptional Updated Gold Pre-Feasibility Result, in ASX Announcement 19th August 2020. 2020. Available online: https://www.whiterockminerals.com.au/asx-announcements (accessed on 7 August 2019).
- White, V. Volcanic Facies and Its Relationship to Silver Mineralisation, White Rock and White Rock North Epithermal Deposits, Drake Goldfield, NE NSW; University of New South Wales: Sydney, Australia, 2017. [Google Scholar]
- Zhang, H. Relationship between Alteration Assemblages, Alteration Intensity and Mineralisation and Grade for the Lady Hampden Epithermal Au-Ag Deposit, Drake, North-Eastern NSW; University of New South Wales: Sydney, Australia, 2016. [Google Scholar]
- Chomiszak, G. Relationship between Alteration Assemblages, Their Intensity and Mineralisation and Grade at the White Rock Epithermal Ag Deposit, Drake, Northeastern NSW; University of New South Wales: Sydney, Australia, 2016. [Google Scholar]
- Lay, A. A Comparative Study of the Mineralogy and Geochemistry of ore Minerals from Silver-Rich Polymetallic Deposits of the Lachlan and Southern New England Orogens, New South Wales, Australia; University of New South Wales: Sydney, Australia, 2019; p. 261. [Google Scholar]
- Murray, C. Tectonic Evolution and Metallogenesis of the New England Orogen. New England Orogen-Tectonics and Metallogenesis; Kleeman, J.D., Ed.; University of New England: Armidale, Australia, 1988; pp. 204–210. [Google Scholar]
- Cumming, G. New Geological Constraints for the Drake Volcanics, Drake Area, Northern NSW; Internal Report for White Rock Minerals Ltd.: West Ballarat, Australia, 2011. [Google Scholar]
- Taylor, J.C. Computer Programs for Standardless Quantitative Analysis of Minerals Using the Full Powder Diffraction Profile. Powder Diffr. 1991, 6, 2–9. [Google Scholar] [CrossRef]
- Burkett, D.A.; Graham, I.T.; Ward, C.R. The application of portable x-ray diffraction to quantitative mineralogical analysis of hydrothermal systems. Can. Miner. 2015, 53, 429–454. [Google Scholar] [CrossRef]
- Norrish, K.; Chappell, B.W. X-ray Fluorescence Spectrometry. 1977. Available online: http://hdl.handle.net/102.100.100/302854?index=1 (accessed on 15 March 2020).
- Eggins, S.; Woodhead, J.D.; Kinsley, L.P.J.; Mortimer, G.E.; Sylvester, P.; McCulloch, M.T.; Hergt, J.M.; Handler, M.R. A simple method for the precise determination of≥ 40 trace elements in geological samples by ICPMS using enriched isotope internal standardisation. Chem. Geol. 1997, 134, 311–326. [Google Scholar]
- Kamber, B.; Greig, A.; Schoenberg, R.; Collerson, K. A refined solution to Earth’s hidden niobium: Implications for evolution of continental crust and mode of core formation. Precambrian Res. 2003, 126, 289–308. [Google Scholar] [CrossRef]
- Markowska, M.; Cuthbert, M.O.; Baker, A.; Treble, P.C.; Andersen, M.S.; Adler, L.; Griffiths, A.; Frisia, S. Modern speleothem oxygen isotope hydroclimate records in water-limited SE Australia. Geochim. Cosmochim. Acta 2020, 270, 431–448. [Google Scholar] [CrossRef]
- Blatt, H.; Tracy, R. Petrology: Igneous, Sedimentary, and Metamorphic; W.H.Freeman: New York, NY, USA, 2006; 529p. [Google Scholar]
- Sun, S.-S.; McDonough, W.F. Chemical and isotopic systematics of oceanic basalts: Implications for mantle composition and processes. Geol. Soc. Lond. Spéc. Publ. 1989, 42, 313–345. [Google Scholar] [CrossRef]
- Friedman, I.; O’Neil, J. Compilation of Stable Isotope Fractionation Factors of Geochemical Interest; US Government Printing Office: Washington, DC, USA, 1977; Volume 440. [Google Scholar]
- O’Neil, J.R.; Clayton, R.N.; Mayeda, T.K. Oxygen Isotope Fractionation in Divalent Metal Carbonates. J. Chem. Phys. 1969, 51, 5547–5558. [Google Scholar] [CrossRef]
- Bottinga, Y. Calculated fractionation factors for carbon and hydrogen isotope exchange in the system calcite-carbon dioxide-graphite-methane-hydrogen-water vapor. Geochim. Cosmochim. Acta 1969, 33, 49–64. [Google Scholar] [CrossRef]
- Lyon, G.; Hulston, J. Carbon and hydrogen isotopic compositions of New Zealand geothermal gases. Geochim. Cosmochim. Acta 1984, 48, 1161–1171. [Google Scholar] [CrossRef]
- Field, C.; Fifarek, R. Light-Stable Isotope Systematics in Epithermal Systems: Reviews in Economic Geology, v. 2. 1985, 2, 99–128. [Google Scholar]
- Fan, H.R.; Zhai, M.G.; Xie, Y.H.; Yang, J.H. Ore-forming fluids associated with granite-hosted gold mineralization at the Sanshandao deposit, Jiaodong gold province, China. Miner. Deposita 2003, 38, 739–750. [Google Scholar] [CrossRef]
- Ohmoto, H.; Rye, R. Isotopes of Sulfur and Carbon. In Geochemistry of Hydrothermal ore Deposits; John Wily and Sons: New York, NY, USA, 1979; pp. 509–567. [Google Scholar]
- Herbert, H.; Smith, J. Sulfur isotopes and origin of some sulfide deposits, New England, Australia. Miner. Deposita 1978, 13, 51–63. [Google Scholar] [CrossRef]
Publisher’s Note: MDPI stays neutral with regard to jurisdictional claims in published maps and institutional affiliations. |
© 2021 by the authors. Licensee MDPI, Basel, Switzerland. This article is an open access article distributed under the terms and conditions of the Creative Commons Attribution (CC BY) license (https://creativecommons.org/licenses/by/4.0/).