
Assessing the Trends of Three Main Air Pollutants in Tehran City Using Data from Sentinel-5 †


Abstract
:1. Introduction
2. Methods
3. Results and Discussion
4. Conclusions
Author Contributions
Funding
Institutional Review Board Statement
Informed Consent Statement
Data Availability Statement
Conflicts of Interest
References
- Zhang, B.; Yin, S.; Lu, X.; Wang, S.; Xu, Y. Development of city-scale air pollutants and greenhouse gases emission inventory and mitigation strategies assessment: A case in Zhengzhou, Central China. Urban Clim. 2023, 48, 101419. [Google Scholar] [CrossRef]
- Sharifi, A.; Hossein gholizadeh, M. The effect of rapid population growth on urban expansion and destruction of green space in Tehran from 1972 to 2017. J. Indian Soc. Remote Sens. 2019, 47, 1063–1071. [Google Scholar] [CrossRef]
- Shahbazi, H.; Abolmaali, A.M.; Alizadeh, H.; Salavati, H.; Zokaei, H.; Zandavi, R.; Hosseini, V. An emission inventory update for Tehran: The difference between air pollution and greenhouse gas source contributions. Atmos. Res. 2022, 275, 106240. [Google Scholar] [CrossRef]
- Dehghan, A.; Khanjani, N.; Bahrampour, A.; Goudarzi, G.; Yunesian, M. Short-term effects of ambient (outdoor) air pollution on cardiovascular death in Tehran, Iran—A time series study. Toxin Rev. 2020, 39, 167–179. [Google Scholar] [CrossRef]
- World Health Organization (WHO). Air Quality Guidelines for Europe, 2nd ed.; WHO Regional Publications European Series No. 91; World Health Organization: Geneva, Switzerland, 2000. [Google Scholar]
- Eshet, A.; Raju, U.J.P. Daily and seasonal variation of aerosol optical depth and angstrom exponent over Ethiopia using MODIS data. Pollution 2022, 8, 315–329. [Google Scholar] [CrossRef]
- Nair, A.S.; Singh, P.; Soni, K.; Meena, K.; Sharma, R. Sway of aerosol on Atmospheric Boundary Layer influencing air pollution of Delhi. Urban Clim. 2023, 49, 101478. [Google Scholar] [CrossRef]
- Li, Z.; Guo, J.; Ding, A.; Liao, H.; Liu, J.; Sun, Y.; Wang, T.; Xue, H.; Zhang, H.; Zhu, B. Aerosol and boundary-layer interactions and impact on air quality. Natl. Sci. Rev. 2017, 4, 810–833. [Google Scholar] [CrossRef]
- Steiner, A.L.; Mermelstein, D.; Chengg, S.J.; Twine, T.E.; Oliphant, A. Observed impact of atmospheric aerosols on the surface energy budget. Earth Interact. 2013, 17, 1–22. [Google Scholar] [CrossRef]
- Harrou, F.; Kadri, F.; Khadraoui, S.; Sun, Y. Ozone measurements monitoring using data-based approach. Process Saf. Environ. Prot. 2016, 100, 220–231. [Google Scholar] [CrossRef]
- Wang, X.; Lu, W.; Wang, W.; Leung, A. A study of ozone variation trend within area of affecting human health in Hong Kong. Chemosphere 2003, 52, 1405–1410. [Google Scholar] [CrossRef] [PubMed]
- García, M.A.; Sánchez, M.L.; Pérez, I.A.; De Torre, B. Ground level ozone concentrations at a rural location in northern Spain. Sci. Total Environ. 2005, 348, 135–150. [Google Scholar] [CrossRef] [PubMed]
- Hashim, B.M.; Al-Naseri, S.K.; Al-Maliki, A.; Al-Ansari, N. Impact of COVID-19 lockdown on NO2, O3, PM2.5 and PM10 concentrations and assessing air quality changes in Baghdad, Iraq. Sci. Total Environ. 2021, 754, 141978. [Google Scholar] [CrossRef] [PubMed]
- Amini, H.; Taghavi-Shahri, S.M.; Henderson, S.B.; Hosseini, V.; Hassankhany, H.; Naderi, M.; Ahadi, S.; Schindler, C.; Künzli, N.; Yunesian, M. Annual and seasonal spatial models for nitrogen oxides in Tehran, Iran. Sci. Rep. 2016, 6, 32970. [Google Scholar] [CrossRef] [PubMed]
- Naddafi, K.; Hassanvand, M.S.; Yunesian, M.; Momeniha, F.; Nabizadeh, R.; Faridi, S.; Gholampour, A. Health impact assessment of air pollution in megacity of Tehran, Iran. Iran. J. Environ. Health Sci. Eng. 2012, 9, 28. [Google Scholar] [CrossRef] [PubMed]
- Sotoudeheian, S.; Arhami, M. Estimating ground-level PM 10 using satellite remote sensing and ground-based meteorological measurements over Tehran. J. Environ. Health Sci. Eng. 2014, 12, 122. [Google Scholar] [CrossRef] [PubMed]
- Kamali, N.; Zare Shahne, M.; Arhami, M. Implementing spectral decomposition of time series data in artificial neural networks to predict air pollutant concentrations. Environ. Eng. Sci. 2015, 32, 379–388. [Google Scholar] [CrossRef]

| Summary Statistics for Ozone | Summary Statistics for Carbon Monoxide | Summary Statistics for Aerosol | |
|---|---|---|---|
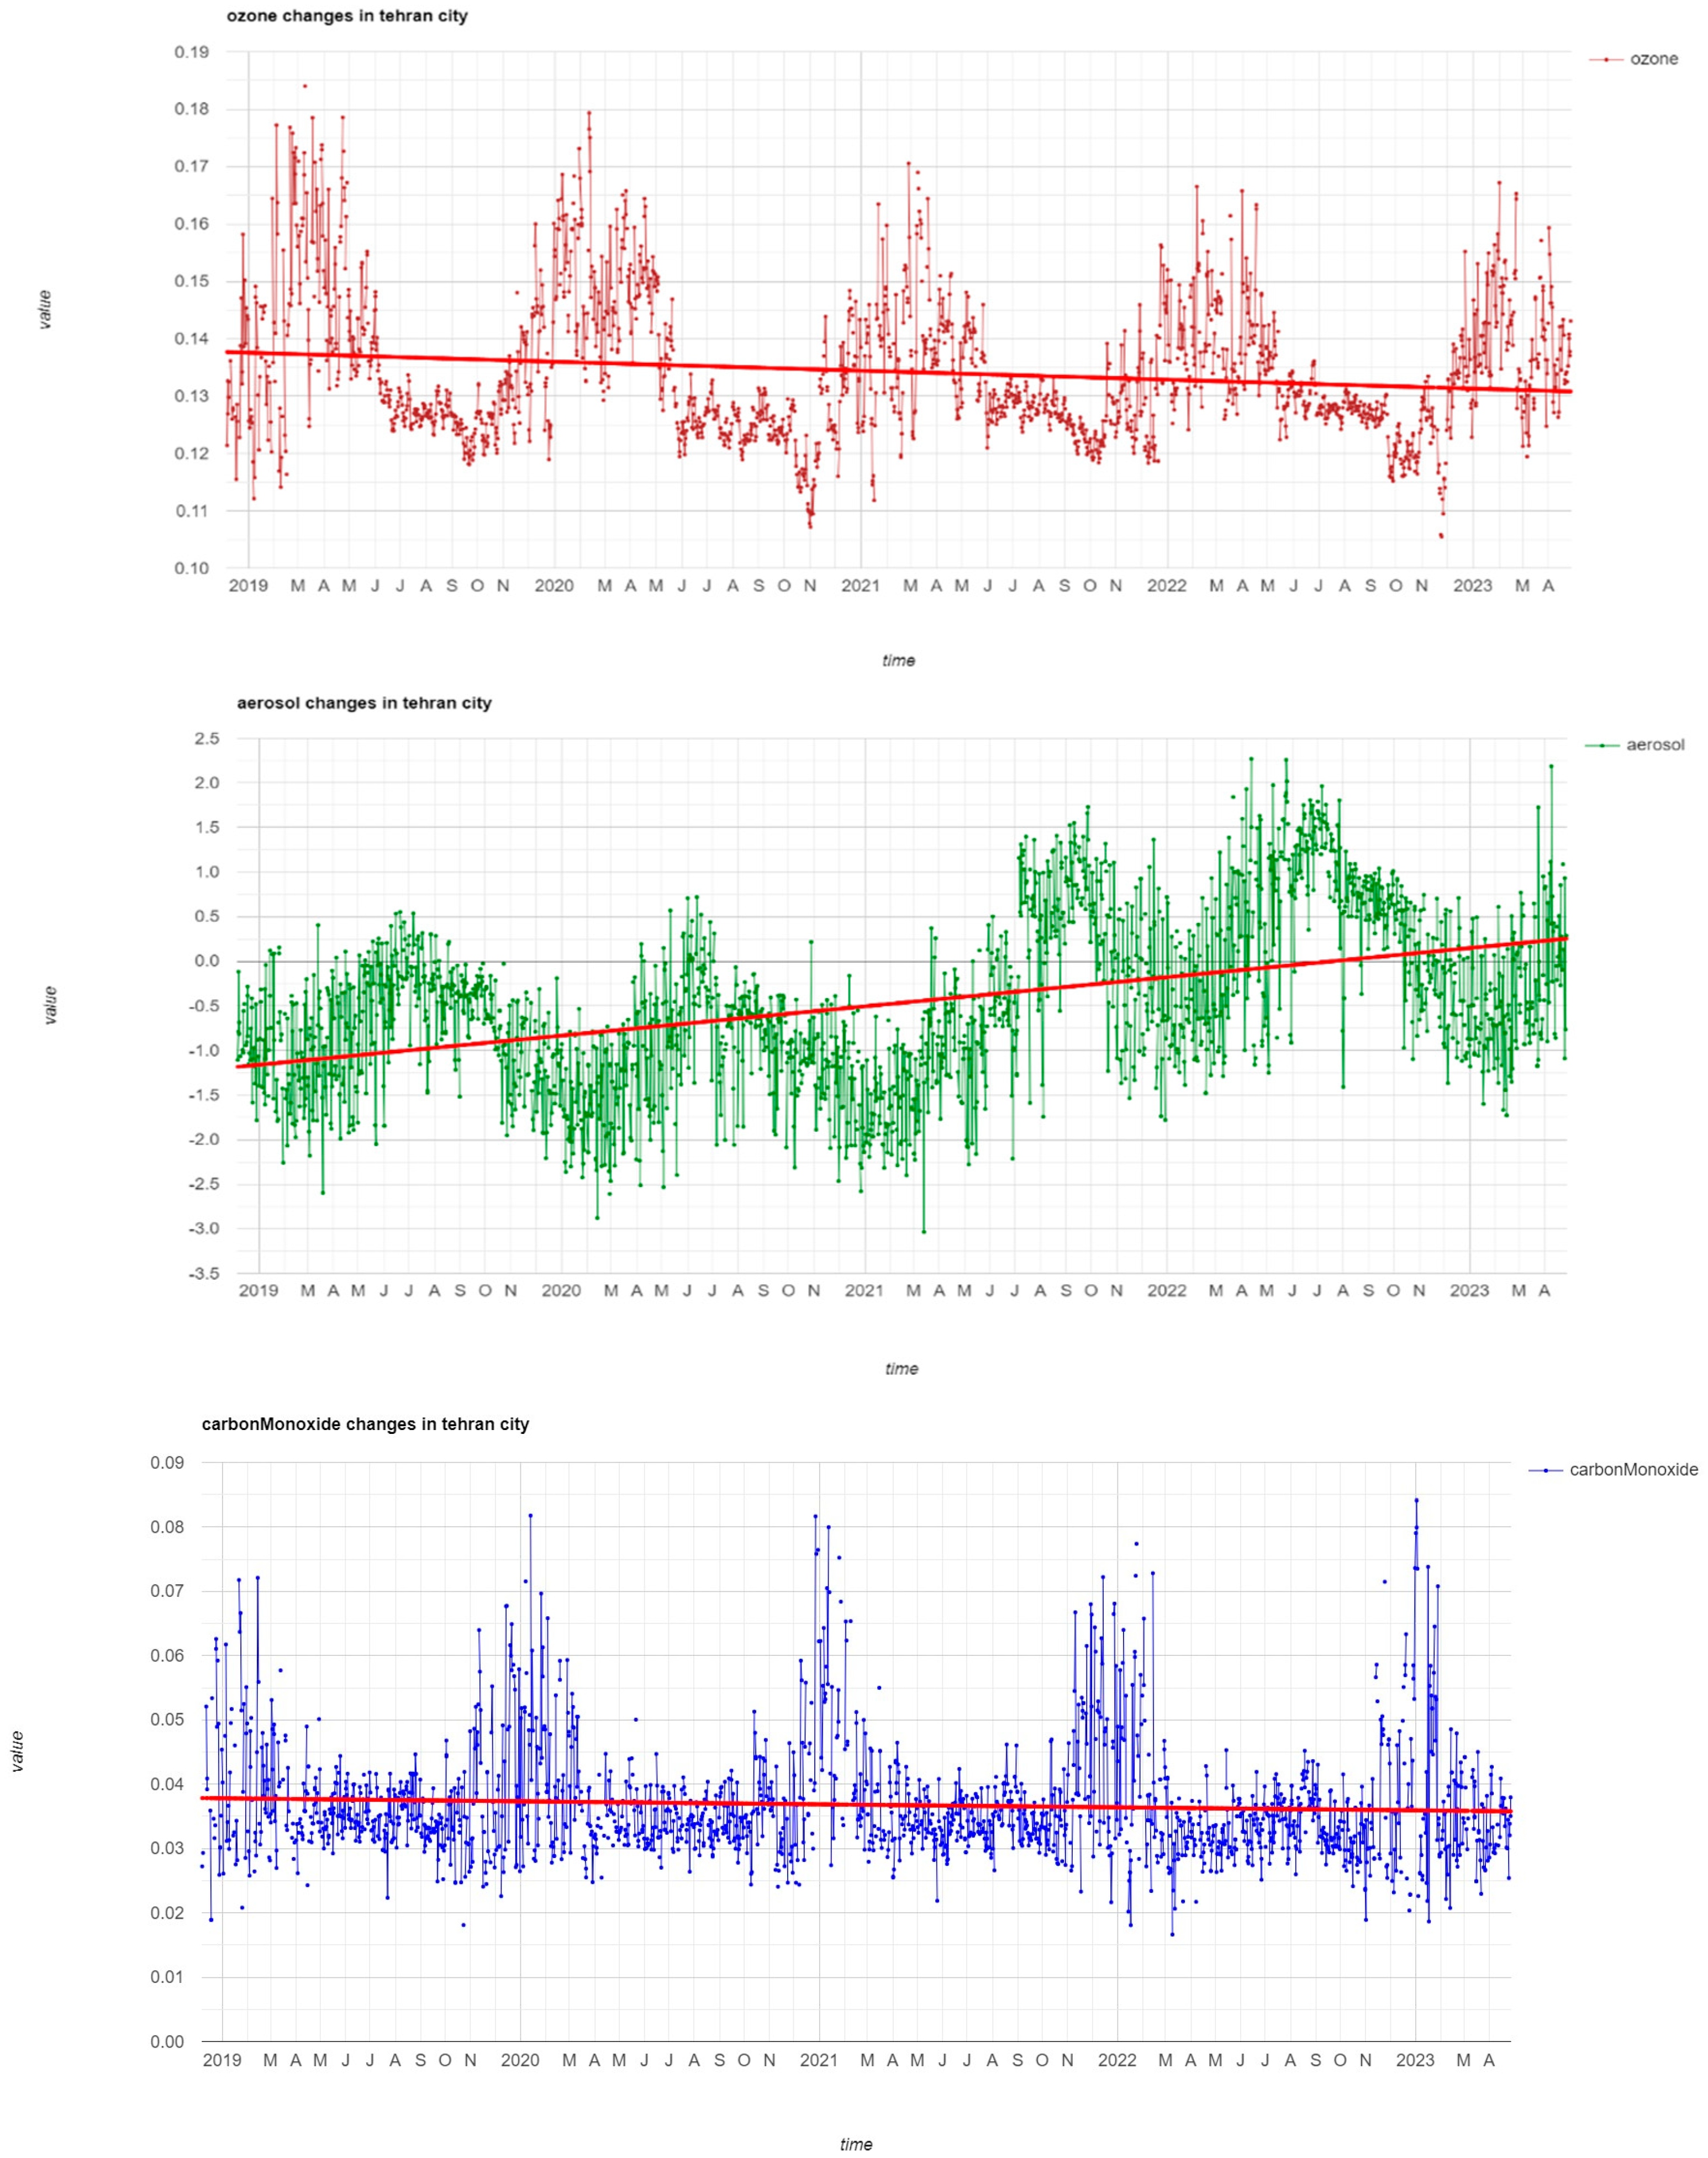
| Average | 0.134 | 0.041 | −0.457 |
| Median | 0.131 | 0.037 | −0.555 |
| Standard deviation | 0.012 | 0.012 | 0.925 |
| Coeff. of variation (%) | 8.963 | 30.177 | −202.323 |
| Minimum | 0.105 | 0.019 | −3.036 |
| Maximum | 0.184 | 0.124 | 2.270 |
| Range | 0.079 | 0.105 | 5.306 |
| Interquartile range | 0.015 | 0.011 | 1.248 |
| Stnd. skewness | 17.681 | 33.020 | 5.161 |
| Stnd. kurtosis | 7.994 | 53.008 | −3.394 |
Disclaimer/Publisher’s Note: The statements, opinions and data contained in all publications are solely those of the individual author(s) and contributor(s) and not of MDPI and/or the editor(s). MDPI and/or the editor(s) disclaim responsibility for any injury to people or property resulting from any ideas, methods, instructions or products referred to in the content. |
© 2023 by the authors. Licensee MDPI, Basel, Switzerland. This article is an open access article distributed under the terms and conditions of the Creative Commons Attribution (CC BY) license (https://creativecommons.org/licenses/by/4.0/).
Share and Cite
Pazoki, F.; García, M.Á.; Pérez, I.A.; Rasekhi, S. Assessing the Trends of Three Main Air Pollutants in Tehran City Using Data from Sentinel-5. Environ. Sci. Proc. 2023, 27, 7. https://doi.org/10.3390/ecas2023-15143
Pazoki F, García MÁ, Pérez IA, Rasekhi S. Assessing the Trends of Three Main Air Pollutants in Tehran City Using Data from Sentinel-5. Environmental Sciences Proceedings. 2023; 27(1):7. https://doi.org/10.3390/ecas2023-15143
Chicago/Turabian StylePazoki, Fatemeh, M. Ángeles García, Isidro A. Pérez, and Saeed Rasekhi. 2023. "Assessing the Trends of Three Main Air Pollutants in Tehran City Using Data from Sentinel-5" Environmental Sciences Proceedings 27, no. 1: 7. https://doi.org/10.3390/ecas2023-15143
APA StylePazoki, F., García, M. Á., Pérez, I. A., & Rasekhi, S. (2023). Assessing the Trends of Three Main Air Pollutants in Tehran City Using Data from Sentinel-5. Environmental Sciences Proceedings, 27(1), 7. https://doi.org/10.3390/ecas2023-15143