Abstract
The Mediterranean is recognized as one of the most sensitive regions regarding climate change. The northern sector winds are a dominant feature of summer low-tropospheric circulation over the Aegean basin in the eastern Mediterranean (EMed). This study is an updated assessment that uses state-of-the-art tools in order to investigate the projected changes in the meridional wind speed and Etesian regime during summer period (June-July-August) over the 21st century. The analysis is based on 17 Global Climate Models simulations (GCMs) available from Coupled Model Intercomparison Project Phase 6 (CMIP6) covering the historical period (from 1971 to 2014) and the future period (from 2015 to 2100) under two Shared Socioeconomic Pathways (SSPs), an intermediate-, and a very high-emission scenario (SSP2-4.5 and SSP5-8.5). Additionally, the results from GCMs analysis are compared to ERA5 reanalysis for the historical period from 1971 to 2000. Our findings suggest that the majority of GCMs reproduce the spatial pattern of Etesians but underestimate the meridional wind speed by about 0.5 to 1.0 m/s, as compared to ERA5. During the future period, the meridional wind speed is projected to be increased over the Aegean basin, mainly during the last period of 21st century. Findings show that the majority of GCM simulations (12 out of 17) show an increase in meridional wind speed of about 0.2 to 1.4 m/s for SSP5-8.5 and 0.2 to 0.6 m/s for SSP2-4.5, as compared to historical period from 1971 to 2000.
1. Introduction
The Sixth Assessment Report (AR6) of IPCC [1] emphasizes the vulnerability of societies to climate change, highlighting the impact of global warming for our civilization. Mediterranean region warming is about 20% faster than the average earth system, affecting many socioeconomic sectors [2,3]. One of the dominant tropospheric circulation features of Mediterranean is the Etesians, a permanent system of northerly winds [4]. Etesians blow during the summer period, showing the maximum sign during July–August months [5,6]. The main cause of this wind system is a pressure gradient over the Aegean Sea as a result of a high- and a low-pressure system located over the Balkan Peninsula and south EMed. Additionally, the topography of continental Greece and the Bosporus canalizes the air masses, which are advected from the Caspian region to the Aegean basin [7,8].
Past studies have already investigated the Etesian regime during past and future period using observations, reanalysis, and model simulations data [4,5,7,8,9,10]. Dafka et al. [9] found that the intense Etesians are related with geopotential anomalies over the northwest Balkan Peninsula and the position of jet streams. Other studies have shown that the variability in Etesians are controlled by the activity of the South Asian Monsoon (SAM) [5,6] via the extension of thermal low from west SAM to south EMed [11]. Misios et al. [7], using model simulations over the last millennium and 20CR data, have shown that the reduction in Etesians are associated with the weak SAM activity after post-eruption summers. For the future period, the Etesians strengthen due to the strengthening of the high-pressure center, and the deepening of a thermal Low over the EMEd [4]. Logothetis et al. [9] and Dafka et al. [12] have shown a strengthening of Etesians during the last period of the 21st century according RCP8.5 scenario due to the enhancement of the dipole that sustains the Etesian regime.
Our study investigates the projected changes in the Etesian regime using state-of-the-art tools. Here, we investigate the Etesians in terms of meridional wind-speed component at 10 m (v10) [6,13] using 17 model simulations available from the CMIP6 project under two SSPs (SSP2-4.5 and SSP5-8.5).
2. Data and Methods
For the analysis, monthly mean v10 was used. The data were obtained from the CMIP6 project [13] in the frame of IPCC-AR6 [1]. In the study, the data of 17 simulations were analyzed, covering the period from 1971 to 2000 (historical) and from 2015 to 2100 for two future emission scenarios (SSP2-4.5 and SSP5-8.5) (Table 1). SSPs were developed in the frame of CMIP6 (AR6) and describe the different pathways of atmospheric greenhouse gas emissions. There are 5 SSPs, which combined with representative concentration pathways (RCPs), describe the possible climate change under social conditions and climate features [14,15,16]. In this study, the projected changes in v10 over EMed are investigated for a “medium challenges to mitigation and adaptation” scenario (SSP2) and a “high challenges to mitigation, low challenges to adaptation” scenario (SSP5) [16]. For the CMIP6 simulations with more than one simulation available, the ensemble mean was computed. The v10 from ERA5 were retrieved during the period from 1971 to 2000 (hereafter hP) in order to compare model results to the reanalysis. The ERA5 data were retrieved at a spatial resolution of 1.0° × 1.0° and the model simulations were regridded (bi-linear interpolation) to the common resolution.

Table 1.
List of CMIP6 model simulations that were used in this study.
The analysis is focused on a spatial window over the EMed (17° E–31° E, 30° N–41° N; following [6]) and also over the central Aegean Sea (cAeS) where the Etesian sign is maximized (24° E–27° E, 36° N–39° N; [6]). In order to investigate the v10 spatial pattern of CMIP6 simulations, composite mean v10 maps during hP both for model simulations and ERA5 were constructed. Τhe bar chart of the averaged v10 over cAeS both for simulations and reanalysis were calculated. Additionally, the agreement of averaged v10 over cAeS between ERA5 and CMIP6 simulations was estimated using the bias ratio () and the variability ratio (), where μ and s are the mean and standard deviation for simulations (sim.) and reanalysis (o), respectively [17].
To study the projected changes in v10 during future period, a bar chart of the difference of averaged v10 was calculated during two future periods (F2; 2071–2100 and F1; 2031–2060) with reference to hP, both for SSP5-8.5 and SSP2-4.5 emission scenarios. Focusing on the future period with the most significant v10 changes, maps of composite difference in v10 between the F2 and F1 periods and hP according to SSPs and hP were constructed. For statistical significance, a two-tailed t-test was used at 95% statistical significance level.
3. Results
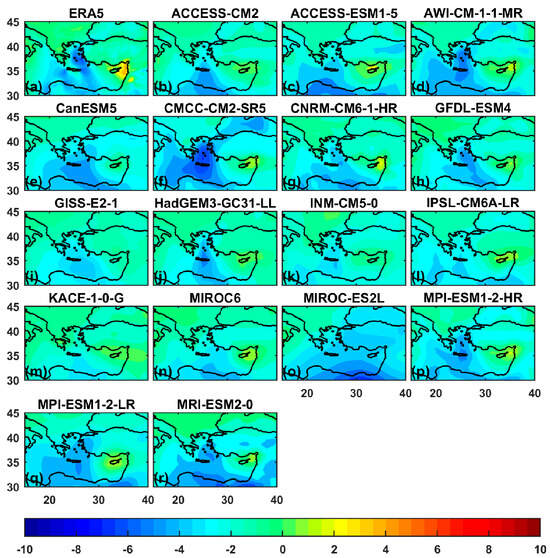
The mean v10 during the historical period from 1971 to 2000 (hP) for ERA5 and each one of the CMIP6 model simulations are shown in Figure 1 (please note that in Figure 1 the spatial resolution for ERA5 is 0.25° × 0.25° in order to show clearer the v10 pattern–Etesian regime over the Aegean Sea). The model simulations were regridded to 1.0° × 1.0°. This analysis shows that the majority of simulations capture the spatial pattern of v10. Furthermore, 11 out of 17 simulations reproduced the spatial pattern of Etesian flow over the cAeS (Figure 1c–h,j,o–r).

Figure 1.
Composite mean of v10 (m/s) during hP for (a) ERA5 and (b–r) model simulations.
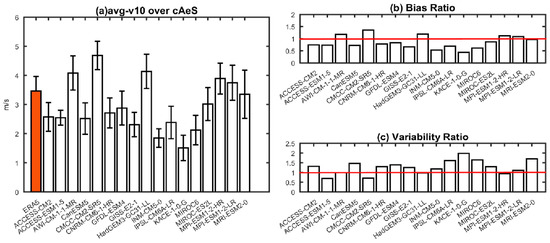
The averaged v10 over the cAeS for ERA5 and simulations are shown in Figure 2. Furthermore, 8 out of 17 simulations, compared to reanalysis, captured the average v10. In particular, the averaged CMIP6 v10 over cAeS came into the limits of the averaged ERA5 v10 over the cAeS plus/minus one standard deviation of ERA5 v10 distribution (namely, the AWI-CM-1-1-MR, CNRM-CM6-1-HR, GFDL-ESM4, HadGEM3-GC31-LL, MIROC-ES2L, MPI-ESM1-2-HR, MPI-ESM1-2-LR and MRI-ESM2-0). In addition, 7 out of 17 simulations underestimated the average ERA5 v10 over cAeS about 0.8 m/s (namely the ACCESS-CM2, ACCESS-ESM1-5, CanESM5, CMCC-CM2-SR5, GISS-E2-1, IPSL-CM6A-LR and MIROC6), and 2 simulations showed an underestimation of about 1.6 to 1.9 m/s (INM-CM5-0 and KACE-1-0-G), respectively (Figure 2). Finally, AWI-CM-1-1-MR and MPI family simulations showed better agreement with ERA5 v10 over cAeS in terms of bias and variability ratio (Figure 2b,c).

Figure 2.
Bar chart of (a) averaged v10 over cAeS during the hP for ERA5 (red bar) and model simulations (white bars), (b) bias ratio, and (c) variability ratio for each simulation with reference to ERA5.
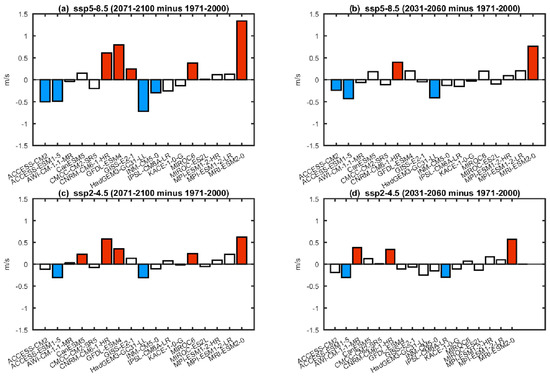
The differences in the averaged v10 over cAeS during F2 and F1 with reference to the hP (both for SSP5-8.5 and SSP2-4.5) are presented in Figure 3. The main changes are presented during the F2 (Figure 3a,c). The SSP5-8.5 scenario shows the most significant changes compared to SSP2-4.5. According to SSP5-8.5, the maximum changes are presented during the F2 (compared to hP; Figure 3a,b). In particular, 5 out of 11 simulations show a statistically significant increase in averaged v10 over cAeS of about 0.2 to 1.4 m/s, and 4 (two simulations come from a common institute) out of 11 simulations show a significant decrease of about 0.3 to 0.6 m/s, respectively (Figure 3a). For the SSP2-4.5 scenario, 5 out of 11 simulations show a significant increase in averaged v10 over cAeS of about 0.2 to 0.6 m/s, and 2 out of 17 show a decrease of about 0.3 m/s, respectively (Figure 3c). For the mid-21st century (F1), the average v10 changes over cAeS are not as significant as those of the last period of the 21st century (Figure 3b,d).

Figure 3.
Bar chart of the difference of averaged v10 (m/s) over cAeS during F2 and F1 with reference to hP (a,b) SSP5-8.5, and (c,d) SSP2-4.5. The red/ blue bars indicate the statistically significant increase/decrease in the averaged v10 (m/s) over cAeS at 95%.
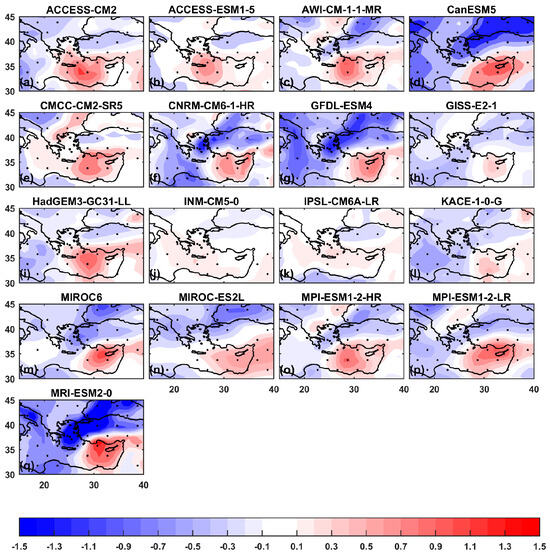
To further investigate the spatial changes in v10 over the EMed, composite difference maps of v10 between F2 (according SSP5-8.5) and hP were constructed (Figure 4). The analysis is focused on the last period of 21st century (F2) because the most significant changes are presented during this period. The majority of the model simulations show an increase in v10 over the Aegean, except for the south EMed where the v10 decreases by about 0.1 to 1.0 m/s. In 11 out of 17 simulations, the v10 increases by about 0.2 to 1.4 m/s over the central Aegean (Figure 4c,d,f–h,l–q). Additionally, in 4 out of 17 simulations, the v10 decreases by about 0.4 to 0.8 m/s over the southeastern Aegean basin (Figure 4a,b,e,i). The other simulations show insignificant changes (Figure 4j,k).

Figure 4.
Mean composite difference of v10 (m/s) between F2 according SSP5-8.5 scenario and hP for each model (a–q). The dotted area indicates the statistically significant change at 95%, as estimated using Student’s t-test.
4. Conclusions
This work aimed to study the projected changes in the Etesian sign over the Aegean Sea using CMIP6 model simulations. Half of simulations studied here captured the mean v10 over cAeS, whereas the majority of the other simulations underestimated the v10. Comparing these findings with previous analysis [6], the results provide evidence that CMIP6 simulations reproduce the Etesian sign over the central Aegean better in comparison to CMIP5 simulations. Regarding future projections, the majority of simulations show stronger v10 (about 0.2 to 1.4 m/s for SSP5-8.5) during the last period of 21st century over the central Aegean. Additionally, all simulations show a decrease in v10 over the south EMed. Finally, further investigation of the EMed atmospheric circulation, using a robust tool as the CMIP6 simulations, could improve our knowledge regarding the climate over the Mediterranean “climate hot-spot”.
Author Contributions
Conceptualization, I.L. and K.T.; methodology, I.L.; software, I.L.; validation, I.L.; formal analysis, I.L.; investigation, I.L.; resources, I.L.; data curation, I.L.; writing—original draft preparation, I.L.; writing—review and editing, I.L., K.T. and D.M.; visualization, I.L.; supervision, K.T. and D.M.; project administration, K.T. and D.M.; funding acquisition, D.M. All authors have read and agreed to the published version of the manuscript.
Funding
This study was funded by the National Network on Climate Change and its Impacts (CLIMPACT), code number 98807, funded by the Public Investment Program of Greece, General Secretary of Research and Technology, Ministry of Development and Investments.
Institutional Review Board Statement
Not applicable.
Informed Consent Statement
Not applicable.
Data Availability Statement
https://esgf-data.dkrz.de/search/cmip6-dkrz/ (accessed on 11 December 2020); https://cds.climate.copernicus.eu/cdsapp#!/dataset/reanalysis-era5-single-levels?tab=form (accessed on 8 January 2023).
Acknowledgments
We would like to acknowledge all institutes and efforts that have a contribution to CMIP6 project. Additionally, we would like to thank the ESGF nodes for the distribution and storage of CMIP6 data. Finally, the authors would like to acknowledge Copernicus Climate Change Service that provided the ERA5 climate reanalysis data that were used in this work.
Conflicts of Interest
The authors declare no conflicts of interest.
References
- IPCC. Climate Change 2022: Climate Change 2022: Impacts, Adaptation, and Vulnerability. Contribution of Working Group II to the Sixth Assessment Report of the Intergovernmental Panel on Climate Change; Pörtner, H.-O., Roberts, D.C., Tignor, M., Poloczanska, E.S., Mintenbeck, K., Alegría, A., Craig, M., Langsdorf, S., Löschke, S., Möller, V., et al., Eds.; Cambridge University Press: Cambridge, UK; New York, NY, USA, 2022; 3056p. [Google Scholar] [CrossRef]
- Cramer, W.; Guiot, J.; Fader, M.; Garrabou, J.; Gattuso, J.P.; Iglesias, A.; Lange, M.A.; Lionello, P.; Llasat, M.C.; Paz, S.; et al. Climate change and interconnected risks to sustainable development in the Mediterranean. Nat. Clim. Chang. 2018, 8, 972–980. [Google Scholar] [CrossRef]
- Zittis, G.; Almazroui, M.; Alpert, P.; Ciais, P.; Cramer, W.; Dahdal, Y.; Fnais, M.; Francis, D.; Hadjinicolaou, P.; Howari, F.; et al. Climate change and weather extremes in the Eastern Mediterranean and Middle East. Rev. Geophys. 2022, 60, e2021RG000762. [Google Scholar] [CrossRef]
- Anagnostopoulou, C.; Zanis, P.; Katragkou, E.; Tegoulias, I.; Tolika, K. Recent past and future patterns of the Etesian winds based on regional scale climate model simulations. Clim. Dyn. 2014, 42, 1819–1836. [Google Scholar] [CrossRef]
- Tyrlis, E.; Lelieveld, J. Climatology and Dynamics of the Summer Etesian Winds over the Eastern Mediterranean. J. Atmos. Sci. 2013, 70, 3374–3396. [Google Scholar] [CrossRef]
- Logothetis, I.; Tourpali, K.; Misios, S.; Zanis, P. Etesians and the summer circulation over East Mediterranean in Coupled Model Intercomparison Project Phase 5 simulations: Connections to the Indian summer monsoon. Int. J. Climatol. 2019, 40, 1118–1131. [Google Scholar] [CrossRef]
- Misios, S.; Logothetis, I.; Knudsen, M.F.; Karoff, C.; Amiridis, V.; Tourpali, K. Decline in Etesian winds after large volcanic eruptions in the last millennium. Weather Clim. Dyn. 2022, 3, 811–823. [Google Scholar] [CrossRef]
- Poupkou, A.; Zanis, P.; Nastos, P.; Papanastasiou, D.; Melas, D.; Tourpali, K.; Zerefos, C. Present climate trend analysis of the Etesian winds in the Aegean Sea. Theor. Appl. Climatol. 2011, 06, 459–472. [Google Scholar] [CrossRef]
- Dafka, S.; Xoplaki, E.; Toreti, A.; Zanis, P.; Tyrlis, E.; Zerefos, C.; Luterbacher, J. The Etesians: From observations to reanalysis. Clim. Dyn. 2016, 47, 1569–1585. [Google Scholar] [CrossRef]
- Logothetis, I.; Tourpali, K.; Misios, S. The Evolution of Etesians: Trends in 20th Century and Future Projections. In Perspectives on Atmospheric Sciences; Karacostas, T., Bais, A., Nastos, P., Eds.; Springer Atmospheric Sciences; Springer: Cham, Switzerland, 2017. [Google Scholar] [CrossRef]
- Bollasina, M.; Nigam, S. The summertime “heat” low over Pakistan/northwestern India: Evolution and origin. Clim. Dyn. 2011, 37, 957–970. [Google Scholar] [CrossRef]
- Dafka, S.; Toreti, A.; Zanis, P.; Xoplaki, E.; Luterbacher, J. Twenty-first-century changes in the EasternMediterranean Etesians and associatedmidlatitude atmospheric circulation. J. Geophys. Res. Atmos. 2019, 124, 12741–12754. [Google Scholar] [CrossRef]
- Ezder, Y. Assessment of the changes in the Etesians in the EURO-CORDEX regional model projections. Int. J. Climatol. 2018, 39, 1213–1229. [Google Scholar] [CrossRef]
- Eyring, V.; Bony, S.; Meehl, G.A.; Senior, C.A.; Stevens, B.; Stouffer, R.J.; Taylor, C.A. Overview of the Coupled Model Intercomparison Project Phase 6 (CMIP6)experimental design and organization. Geosci. Model Dev. 2016, 9, 1937–1958. [Google Scholar] [CrossRef]
- O’Neill, B.C.; Carter, T.R.; Ebi, K.; Harrison, P.A.; Kemp-Benedict, E.; Kok, K.; Kriegler, E.; Preston, B.L.; Riahi, K.; Sillmann, J.; et al. Achievements and needs for the climate change scenario framework. Nat. Clim. Chang. 2020, 10, 1074–1084. [Google Scholar] [CrossRef] [PubMed]
- Riahi, K.; van Vuuren, D.P.; Kriegler, E.; Edmonds, J.; O’Neill, B.C.; Fujimori, S.; Bauer, N.; Calvin, K.; Dellink, R.; Fricko, O.; et al. The Shared Socioeconomic Pathways and their energy, land use, and greenhouse gas emissions implications: An overview. Glob. Environ. Chang. 2017, 42, 153–168. [Google Scholar] [CrossRef]
- Towner, J.; Cloke, H.L.; Zsoter, E.; Flamig, Z.; Hoch, J.M.; Bazo, J.; Coughlan de Perez, E.; Stephens, E.M. Assessing the performance of global hydrological models for capturing peak river flows in the Amazon basin. Hydrol. Earth Syst. Sci. 2019, 23, 3057–3080. [Google Scholar] [CrossRef]
Disclaimer/Publisher’s Note: The statements, opinions and data contained in all publications are solely those of the individual author(s) and contributor(s) and not of MDPI and/or the editor(s). MDPI and/or the editor(s) disclaim responsibility for any injury to people or property resulting from any ideas, methods, instructions or products referred to in the content. |
© 2023 by the authors. Licensee MDPI, Basel, Switzerland. This article is an open access article distributed under the terms and conditions of the Creative Commons Attribution (CC BY) license (https://creativecommons.org/licenses/by/4.0/).