1. Introduction
In the early 1950s, the concept of global change entered the international stage with a clear indication that Earth is a closed system in which natural resources and the environment determine the boundaries of population growth and economic development.
This paper starts with a simple assumption that global change problems require a systems approach. Global change research mostly uses integrated assessment, defined as an interdisciplinary process of bringing together knowledge from different disciplines.
There are a limited number of tools that allow users to assess, analyze, and adapt to global change. Global Change Explorer (GCE,
https://www.globalchange-uwo.ca/, accessed on 26 January 2023) is an attempt to bring global change and its consequences closer to decision makers, scientists, and the general public [
1]. GCE allows for the interactive investigation of global change complexities. It uses ANEMI, a system dynamics simulation model developed at the University of Western Ontario [
2,
3,
4]. ANEMI is named after the Greek Anemoi gods of the four winds: Boreas the north wind (bringing the cold breath of winter), Zephryos the west wind (the god of spring breezes), Notos the south wind (the god of summer rain-storms), and Euros the east wind (associated with the season of autumn).
ANEMI simulates system dynamics to offer information on Earth’s dynamic processes and the behaviours that instigate change. It is an integrated assessment model of global change that emphasizes the role of water resources. The main job of ANEMI is to explicitly integrate various sectors (natural, physical, and socioeconomic) into a single model, providing effective consideration of the high-level feedback relationships between the physical environment and social adaptation. At lower levels, this relationship ends in thousands of feedbacks between various model sectors and variables.
The ANEMI model was developed using the Vensim system dynamics simulation environment [
5]. The entire model code is archived using Zenodo (
https://doi.org/10.5281/zenodo.4025424, accessed on 26 January 2023) and is available to everyone. Details on how to run the model, modify inputs, and view the outputs in graphical or tabular formats are provided in the repository.
GCE is designed to allow the use of ANEMI to simulate various future scenarios related to five main themes: climate change; population dynamics; food production; water quality; and water quantity. The users are presented with the opportunity to ask different questions, select simulation runs, and evaluate model outputs.
The main objective of this paper is to give: (i) a brief description of the ANEMI model and (ii) an illustrative presentation of GCE. The next section of the paper provides a brief description of the ANEMI model. It is followed by the graphical description of GCE’s use. The paper ends with a summary statement.
2. The ANEMI Model
The development of the ANEMI model was carried out using the system dynamics simulation (SD) approach. SD is one of the systems analysis tools specifically designed to analyze the dynamic nature of systems that are composed of feedback loops [
6,
7]. A structure is essential for the interpretation of complex interactions occurring in models of global change. Learning the structure of a system means learning how things are related [
6]. The concept of feedback systems emerged as the basis for structuring the observations of global change. The feedback is defined as a closed path connecting in sequence a decision that controls the action, the state of the system, and information about the state of the system [
7]. The feedback provides a direct link between the system structure and its dynamic behaviour. The language of system dynamics includes a powerful tool of causal diagramming to capture the system structure (express what we know about a system) and mathematical simulation to generate dynamic system behaviour.
2.1. The ANEMI Model Description
The model sectors that comprise the ANEMI model are climate, carbon, nutrient, and hydrologic cycles; population dynamics; land use; food production; sea level rise; energy production; the global economy; persistent pollution; water demand; and water supply development (detailed descriptions of each model sector are available in [
4]). The high-level model structure is shown in
Figure 1. The selection of model sectors was made to capture the dynamics of global change with an emphasis on water resources. The main strength of the ANEMI model is its highly endogenous structure and tight coupling of all twelve sectors. This allows for studying global change from a feedback-based perspective to understand the dynamic behavior of global issues (e.g., climate change, food–water–energy resource limitations, and the development of the water supply to support a growing population).
Figure 1 depicts the main feedback relationships between the sectors.
The arrows represent causal relationships between the sectors and the main connecting variables. Arrows with positive signs denote positive causality (change in connected sectors/variables in the same direction) and those with a negative sign denote negative causality (change in connected sectors/variables in the opposite direction). The causal links closed in a loop form the feedback relationships. The positive reinforcing feedbacks are formed by an even number of negative causal links. The negative balancing feedbacks are formed by an odd number of negative causal links.
The colored arrows in
Figure 1 are used to illustrate thematic feedbacks between major model sectors. For example, the red arrows depict a feedback relationship between the food production, population, energy–economy, carbon, and climate sectors. If food production decreases relative to the global population, this slows population growth and available labour to drive global economies. With less economic productivity, fewer emissions are anticipated, lowering greenhouse gas concentrations and slowing climate change. This has a positive effect on land yield, as global temperatures would not increase as much, having a positive influence on food production. This is an example of a negative or self-regulating feedback loop. The overall behaviour of the global system is governed by how strongly each feedback loop interacts with the system over time.
Feedback loops between sectors, or intersectoral feedback loops, are responsible for a global change in the Earth system. ANEMI focuses on representing global-scale feedbacks that are driving overall change and assessing their importance and influence within the Earth system. The highly endogenous structure of the model creates a very large number of feedbacks that are driving the dynamics of the Earth system.
The ANEMI model was developed using Venism systems dynamics simulation software [
5]. The entire model code is available from the Zenodo archive (
https://doi.org/10.5281/zenodo.4483736, accessed on 26 January 2023), with details on running the model, modifying inputs, and viewing the outputs.
2.2. Use of the ANEMI Model
The ANEMI model is parameterized to simulate the Earth system over the period from 1980 to 2100, with an integration time step of 1/128th of a year. Due to the rigid nature of the system equations, the simple Euler integration method is used. The model has been parameterized to capture the initial conditions in 1980 and reproduce the behaviour of key system variables in each sector.
The generalized, feedback-based structure of the ANEMI model allows the user to test policy scenarios related to global change. By altering one of the model parameters at a given point in time, all model sectors will respond through the driving feedback processes which govern the model structure. The output of the model using the baseline parameter set provides a reference scenario to which alternative policy scenarios may be compared. Different parameter sets have the potential to cause a shift in model behaviour compared to the reference scenario, as the dominance of feedback processes in the reference scenario may change. The large number of variables and sectors in the ANEMI model allows for the development of a wide variety of scenarios, each with a different focus. Up to now, the main investigations conducted by the ANEMI model focused on simulating various future scenarios related to five main themes: (i) climate change; (ii) population dynamics; (iii) food production; (iv) water quality; and (v) water quantity. For a detailed description of the tested scenarios, please refer to [
4].
3. Global Change Explorer (GCE)
The web version of the GCE (Global Change Explorer) program [
1] was designed as a smart interface that allows for the ANEMI model to be simulated through a series of interactive, user-defined scenarios. GCE is available at:
https://globalchange-uwo.ca/ (accessed on 26 January 2023).
The communication with GCE starts by activating the
Scenarios menu, as shown in
Figure 2. The user is presented with five scenarios and questions related to each of them. The selection of a question and scenario begins the ANEMI simulations, and changing some input variables opens up possibilities for experimenting with the model.
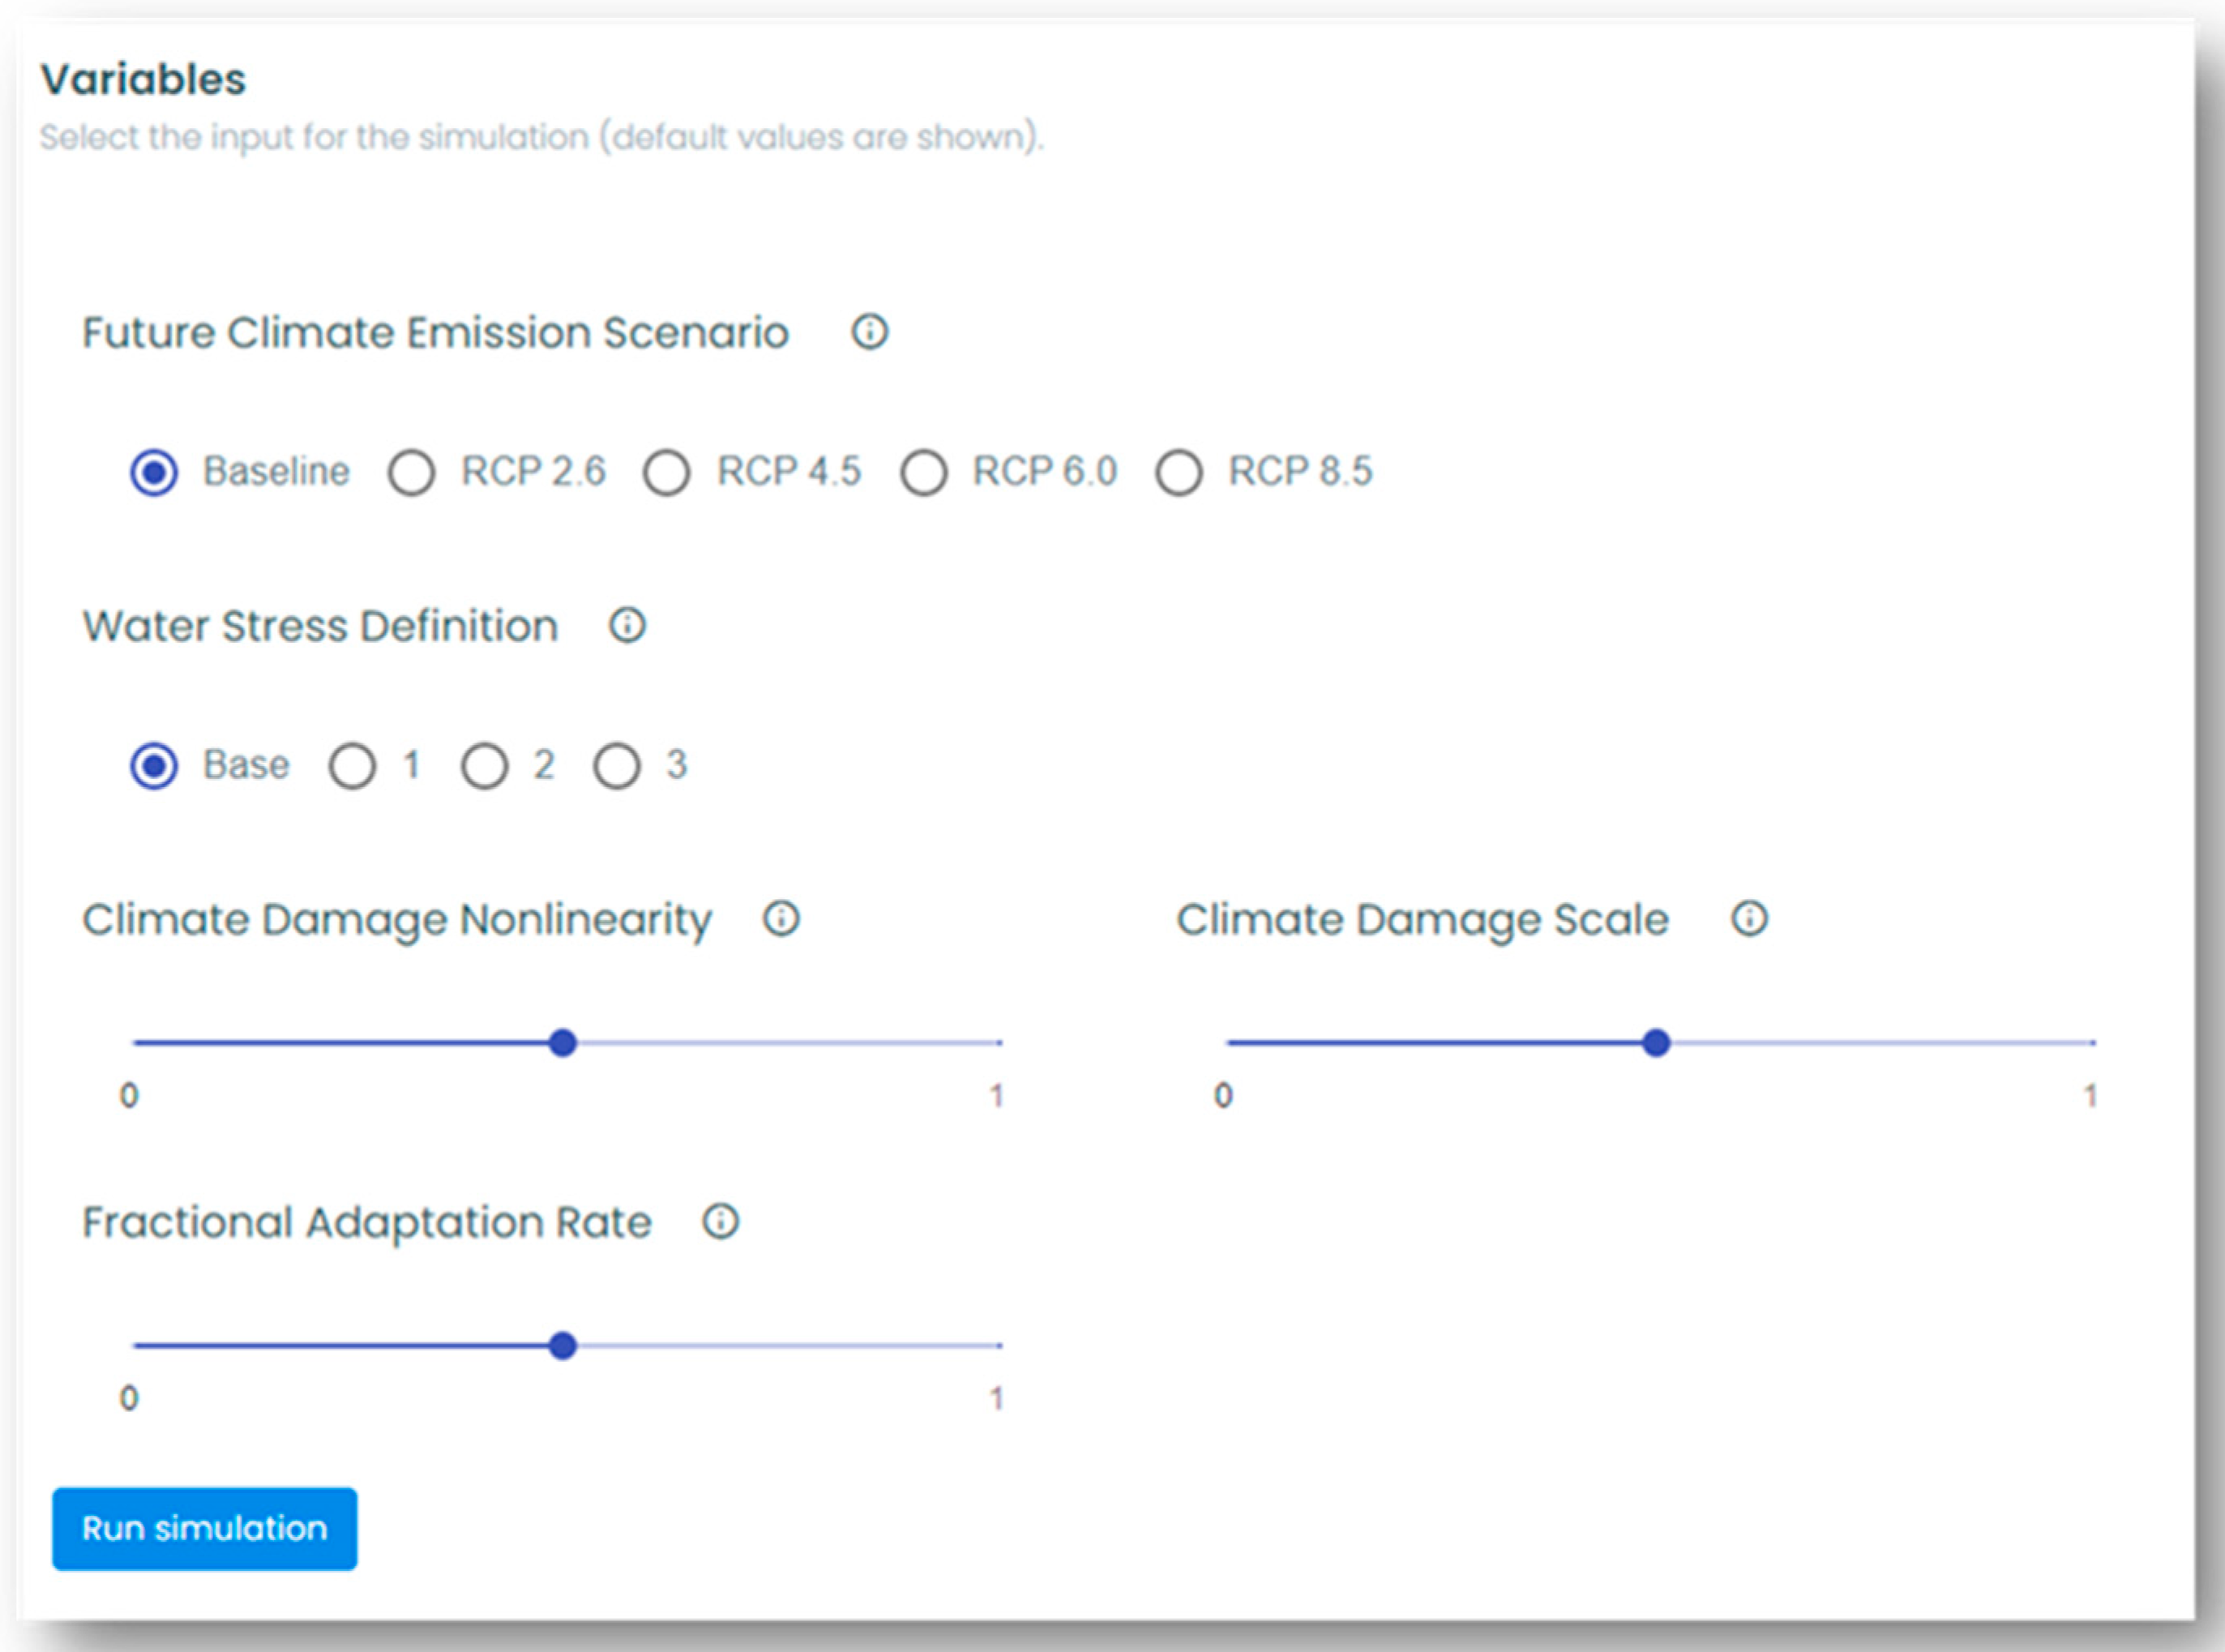
The smart interface automatically provides the
Variables that can be experimented with based on the selected question and scenario. A variable selection screen for one scenario and one question is shown in
Figure 3.
GCE offers assistance by providing a
description of the scenario and variables that the user can experiment with, as shown in
Figure 4.
Upon selection of the variables, the ANEMI model is executed in the background and simulation results are stored for presentation in GCE. The left side of the GCE screen offers a graphical presentation of the results. Multiple options for downloading the results (graphs, tables, various image formats, etc.) can be selected by choosing the desired options under the menu button (≡).
The upper part of the results screen shows the summary of the model performance, and the combined graph shows the dynamics of the key variables associated with the selected scenario. An example output screen is represented in
Figure 5.
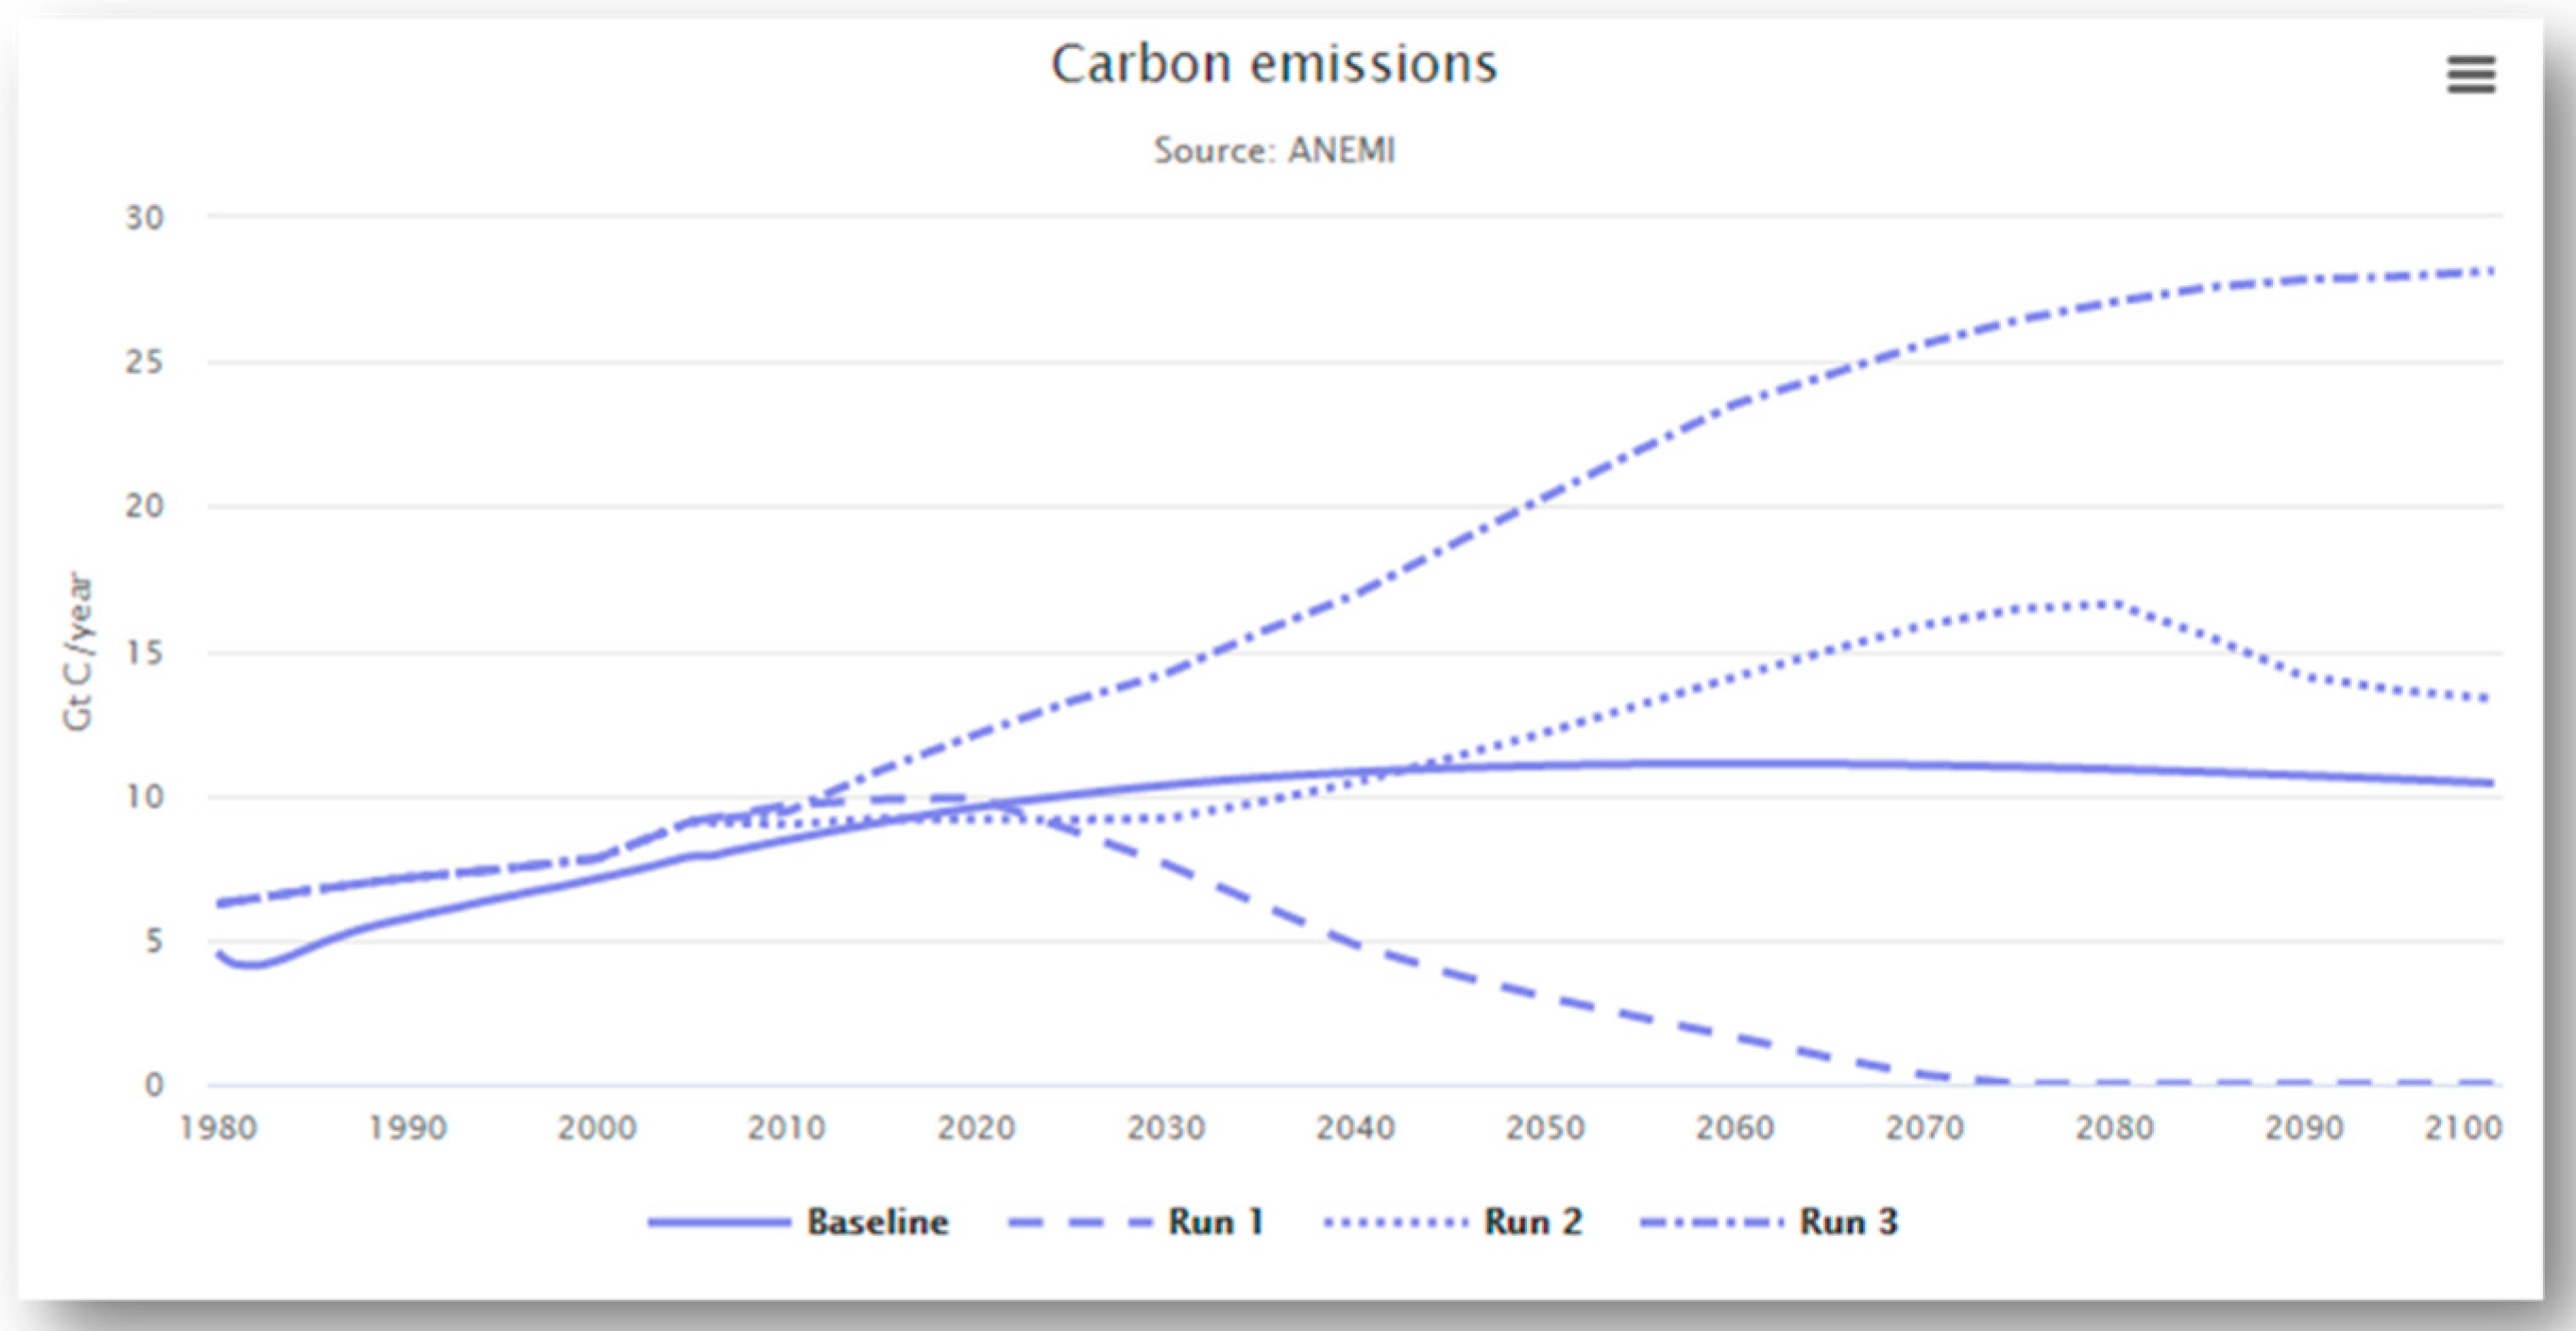
The bottom part of the screen shows the
Individual performance metric, which uses individual graphs to present the dynamic performance of the most significant variables for the selected scenario. As shown in
Figure 6, GCE provides these graphs in a comparative form. Each user selection of input variables is memorized and presented as one line, and graphs show all experiments in the same place, enabling the immediate communication of important answers to the user’s questions.
4. Summary
This paper has briefly documented the ANEMI model as a new tool for global change analysis. The feedback-based structure is designed to promote understanding of the feedbacks that drive Earth system behaviour and the process of global change occurring within it. The aggregated spatial scale of the model allows for examining global scale feedbacks through the development of scenarios that focus on individual or multiple model sectors.
An intelligent interface (GCE) is also presented as a mechanism to allow for the global change experimentation of users with different skill levels necessary for the use of complex models such as NAEMI.
The main limitation of GCE is that there is a limited number of preselected scenarios focusing on: (i) climate change; (ii) population dynamics; (iii) food production; (iv) water quality; and (v) water quantity. It is my hope that the future use of the model will eliminate this limitation. The interest of the community and various questions by potential users will guide future activities in expanding the ability of GCE.


