Abstract
Different regions of the world are expected to experience an increase in the frequency, duration and intensity of drought phenomena as a result of the ongoing climate change. Enhanced evaporation and water deficiency over large time periods under warmer conditions will have devastating consequences on the natural ecosystems, food production as well as the global economy. In order to monitor the evolution of climate conditions that may lead to increasing drought phenomena at local, regional or global level, a series of indicators and statistical methods have been developed. In our work, the values of various drought indices from observational data in Greece were studied over the period 1990–2020. By applying the Sen and Mann–Kendall methods, the trends and statistical significance were examined. The results showed that serious drought events take place during summer especially in the southern regions. However, the number of consecutive dry days tends to decrease.
1. Introduction
Drought constitutes an extreme environmental situation that has been associated lately with the evolving climate change []. With warmer conditions prevailing in the globe, due to the increase of greenhouse gases produced from human activity, evaporation rates tend to accelerate []. Consequently, soil moisture decreases progressively and often leads to significant water deficiency in certain land areas []. On the contrary, more water is available in the atmosphere. The overall disruption of the hydrological cycle may eventually lead different sites to experience opposite conditions. Some parts of the world are more likely to endure an increase in extreme precipitation events and greater risk of flooding, while others may experience longer and more serious droughts as well as water shortage []. The existence of drought conditions are closely related with a series of negative consequences in agriculture, water supply, energy efficiency, public health, environmental control, cultural heritage and the sustainability of the economy at local, regional and global levels []. It is therefore important, to systematically study the temporal as well as geographical evolution of drought-related meteorological conditions through a variety of developed indices. In this work, the yearly and seasonal variability and trends of a set of drought indices for the Greek region were analyzed in order to get an insight of the changes that have occurred over the past few decades.
2. Data and Methodology
Drought-related data over the period 1990−2020 from seven WMO stations in Greece were used in this work. The meteorological stations from which data were obtained are Hellinikon, Thessaloniki, Kerkira, Samos, Larisa, and Souda and Herakleion (Figure 1). The characteristics of the stations can be seen in Table 1.
Figure 1.
Locations of meteorological stations under study.
Table 1.
Characteristics of meteorological stations.
The drought indices that were used can be found in the following list. For each index, yearly and seasonal data were obtained. An SPI-based classification of drought periods [] is also presented in Table 2.
Table 2.
Classification of drought periods [].
- SPI3: 3-Month Standardized Precipitation Index;
- SPI6: 6-Month Standardized Precipitation Index;
- CDD: Maximum number of consecutive dry days (RR ≤ 1 mm).
The SPI index is widely used in the characterization of drought periods since it can be applied in every geographical location and at different time scales evaluating the severity of drought events. Furthermore, the non-parametric Sen’s slope and Mann–Kendall [] method were applied to both the yearly and seasonal data of all the above indices and for all the aforementioned stations in order to calculate the corresponding trends and their statistical significance. This was mainly achieved through the MAKESENS statistical software [].
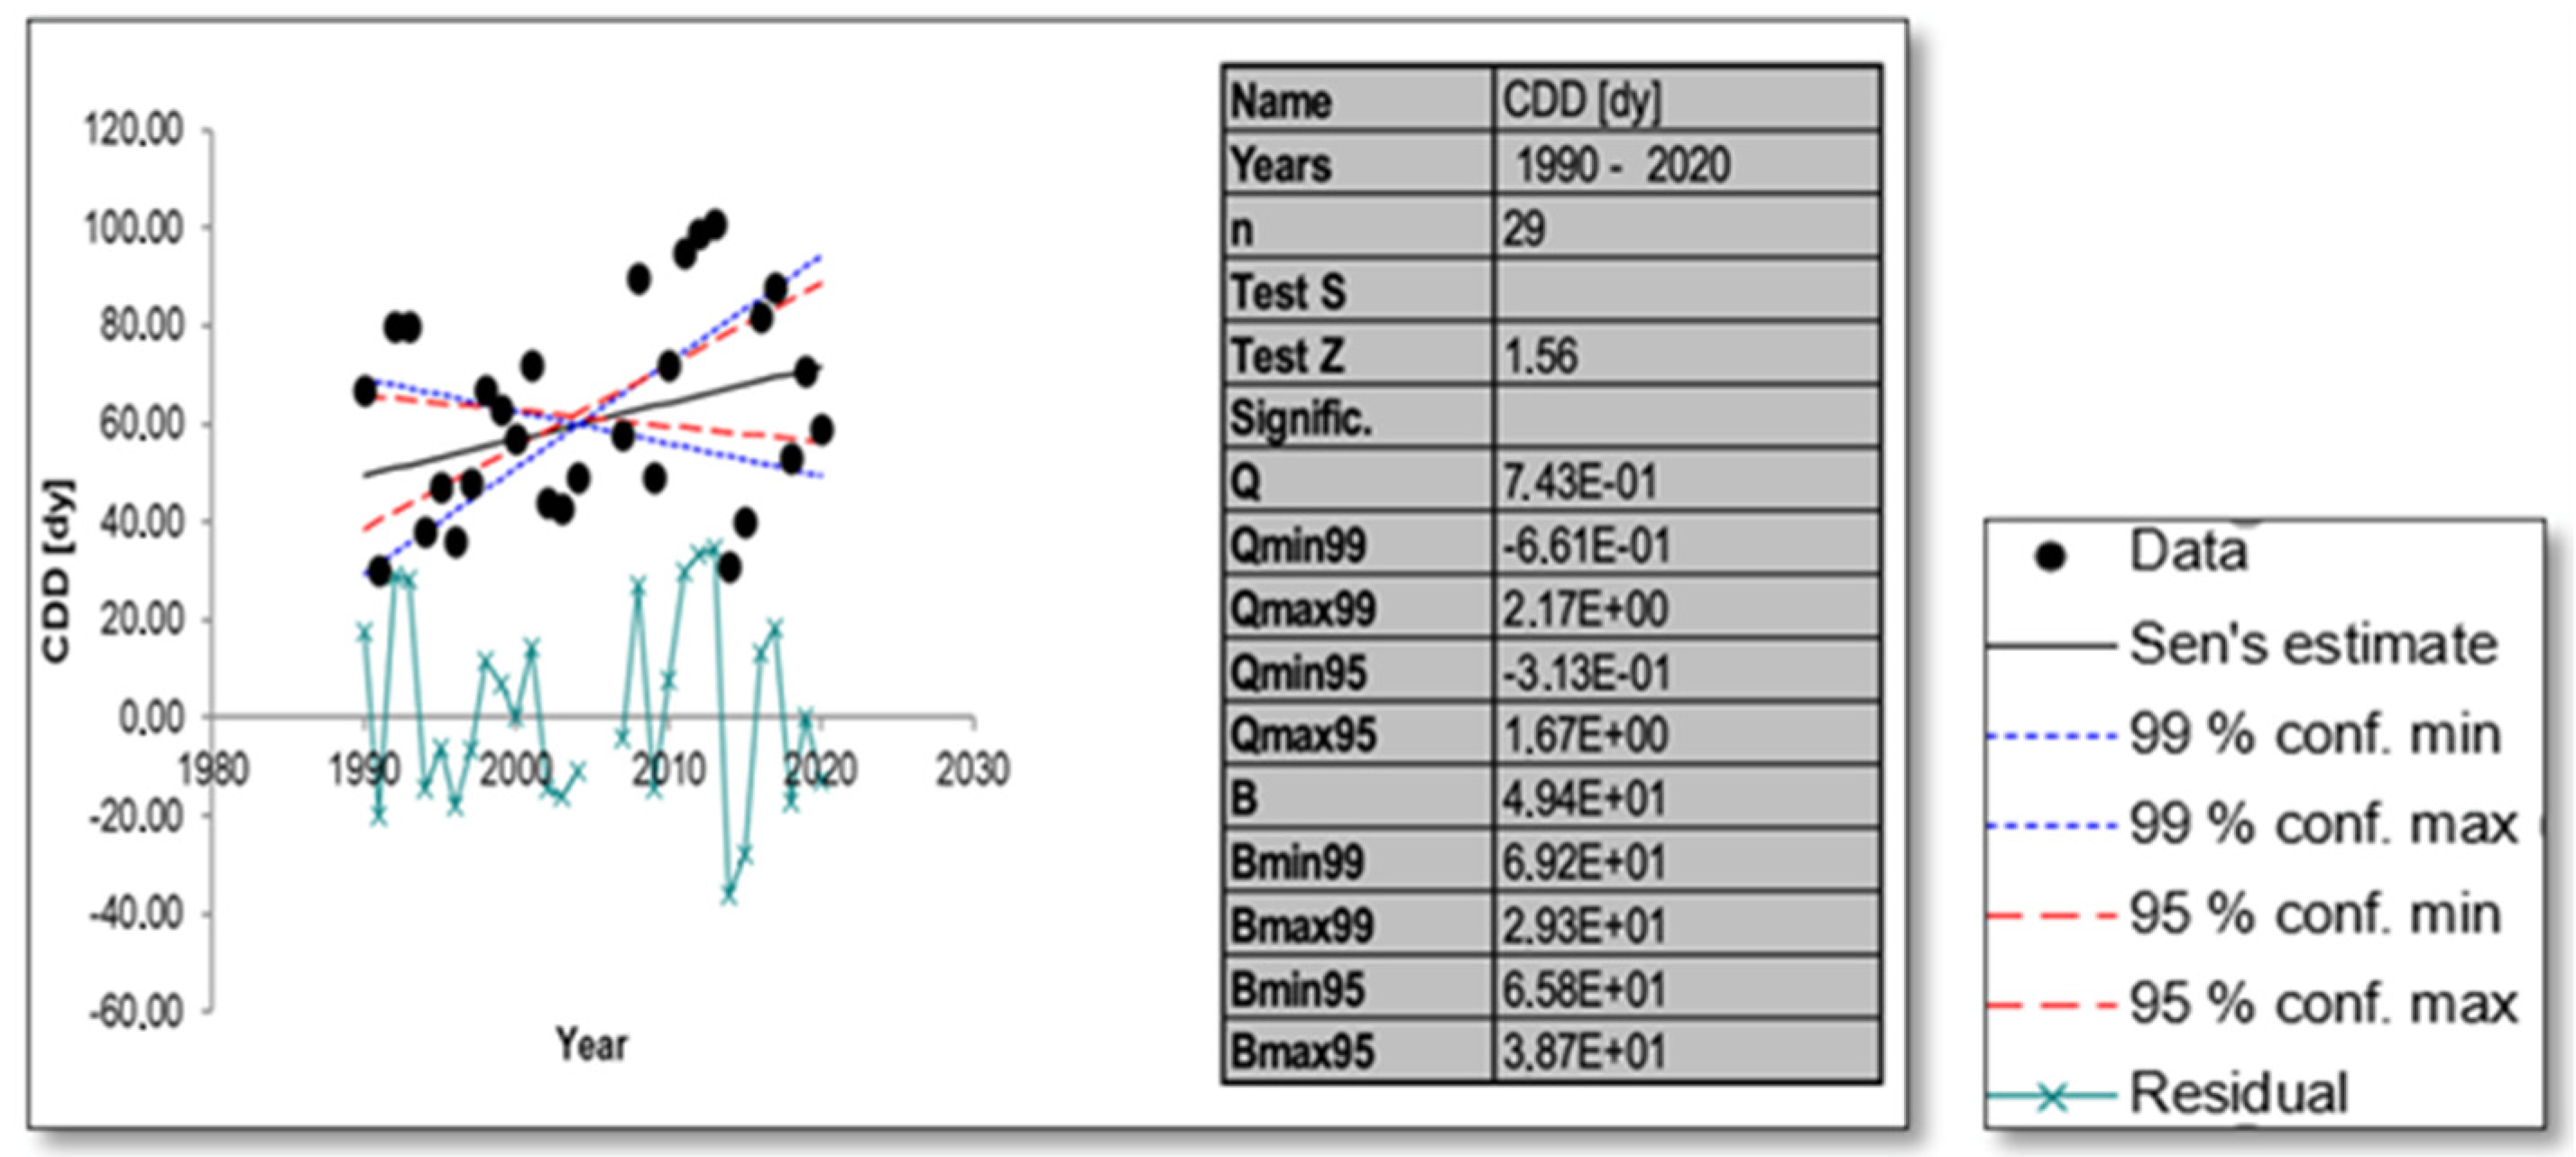
3. Results and Discussion
In Figure 2, the statistical results from the application of Sen’s slope and Mann–Kendall method on the yearly time series of the CCD index for the Kerkira station are shown, indicatively. Similar figures were also produced for all indices and stations and for both the seasonal and yearly data.
Figure 2.
Example of the application of the Sen’s slope (f = Qt + B) and Mann-Kendall method to the yearly time series of the CDD index for the Kerkira meteorological station. A positive (negative) trend is indicated by a positive (negative) Z value. Q and B denote trend’s slope and intercept at 95% and 99% confidence levels.
By examining the yearly trends across all meteorological stations, it was observed that CDD values increased for Thessaloniki and Kerkira. This means that, throughout the year, the number of consecutive dry days, i.e., days with less than 1 mm precipitation, has increased over the study period. However, the trend was not found to be statistically significant. On the other hand, negative trends were found for the rest of the stations, which were statistically significant for Hellinikon, Herakleion, Larisa and Samos. In these regions, therefore, the yearly number of consecutive dry days has decreased. Concerning the SPI3 and SPI6 index, in all stations, with the exception of Samos, positive, not statistically significant, trends were found. Moreover, by estimating the annual averages of the above indices over the whole period of study, it was found that greater average values of CDD were observed at Herakleion, Samos and Souda located in the southern and southeastern parts of Greece. On the opposite, the lower average values were detected at Thessaloniki and Larisa, located in central and northern Greece. Concerning the SPI indices, the greater average values were found at Souda. All stations had average SPI3 index values between 0 and 1, which denotes, according to the classification mentioned earlier, near normal drought conditions. The average SPI6 values similarly range from 0 to 1 for Kerkira, Hellinikon, Herakleion, Thessaloniki and Souda. For Larisa and Samos, the corresponding average values were between −1 and 0, which is characteristic of mild dry conditions.
By examining the seasonal variability of drought indices, statistically significant negative trends were found during autumn at Larisa and Herakleion with respect to CDD, and statistically significant positive trends were observed at Souda and Samos with respect to SPI6. In winter, CDD values decreased in Hellinikon and increased in Thessaloniki, both statistically significant. During spring, an upward trend of SPI3 values was detected. Finally, downward trends of CDD were identified at Hellinikon, Herakleion and Samos during summer.
To conclude, the Greek region is generally characterized by normal to mild dry conditions in the study period. Drought events of great intensity occur during summer in the southern regions. In general, however, the consecutive dry days tend to decrease. The conditions also tend to vary depending on the station’s geographical location.
Author Contributions
Conceptualization, C.G.T., I.M., I.K. and K.P.; methodology, C.G.T., I.M., I.K. and K.P.; software, I.M., I.K. and K.P.; validation, C.G.T., I.M., I.K. and K.P.; formal analysis, C.G.T., I.M., I.K. and K.P.; investigation C.G.T., I.M., I.K. and K.P.; data curation, C.G.T., I.M., I.K. and K.P; writing—original draft preparation, C.G.T., I.M., I.K. and K.P.; writing—review and editing, C.G.T., I.M., I.K. and K.P.; visualization, I.M., I.K. and K.P.; supervision, C.G.T.; project administration, C.G.T. All authors have read and agreed to the published version of the manuscript.
Institutional Review Board Statement
Not applicable.
Informed Consent Statement
Not applicable.
Data Availability Statement
Data were obtained by KNMI Climate Explorer.
Conflicts of Interest
The authors declare no conflict of interest.
References
- Wang, D.; Hejazi, M.; Cai, X.; Valocchi, A.J. Climate change impact on meteorological, agricultural, and hydrological drought in central Illinois. Water Resour. Res. 2011, 47, W09527. [Google Scholar] [CrossRef]
- Helfer, F.; Lemckert, C.; Zhang, H. Impacts of climate change on temperature and evaporation from a large reservoir in Australia. J. Hydrol. 2012, 475, 365–378. [Google Scholar] [CrossRef]
- Zhang, Q.; Fan, K.; Singh, V.P.; Song, C.; Xu, C.-Y.; Sun, P. Is Himalayan-Tibetan Plateau “drying”? Historical estimations and future trends of surface soil moisture. Sci. Total Environ. 2019, 658, 374–384. [Google Scholar] [CrossRef] [PubMed]
- Shiu, C.-J.; Liu, S.C.; Fu, C.; Dai, A.; Sun, Y. How much do precipitation extremes change in a warming climate? Geophys. Res. Lett. 2012, 39, L17707. [Google Scholar] [CrossRef]
- Miyan, M.A. Droughts in Asian Least Developed Countries: Vulnerability and sustainability. Weather Clim. Extrem. 2015, 7, 8–23. [Google Scholar] [CrossRef]
- McKee, T.B.; Doesken, N.J.; Kleist, J. The relationship of drought frequency and duration to time scales. In Proceedings of the 8th conference on applied climatology, Anaheim, CA, USA, 17–22 January 1993; American Meteorological Society: Boston, MA, USA, 1993; pp. 179–183. [Google Scholar]
- Tzanis, C.G.; Koutsogiannis, I.; Philippopoulos, K.; Deligiorgi, D. Recent climate trends over Greece. Atmos. Res. 2019, 230, 104623. [Google Scholar] [CrossRef]
- Salmi, T.; Määttä, A.; Anttila, P.; Ruoho-Airola, T.; Amnell, T. Detecting Trends of Annual Values of Atmospheric Pollutants by the Mann-Kendall Test and Sen’s Slope Estimates-the Excel Template Application MAKESENS; Finnish Meteorological Institute (FMI): Helsinki, Finland, 2002. [Google Scholar]
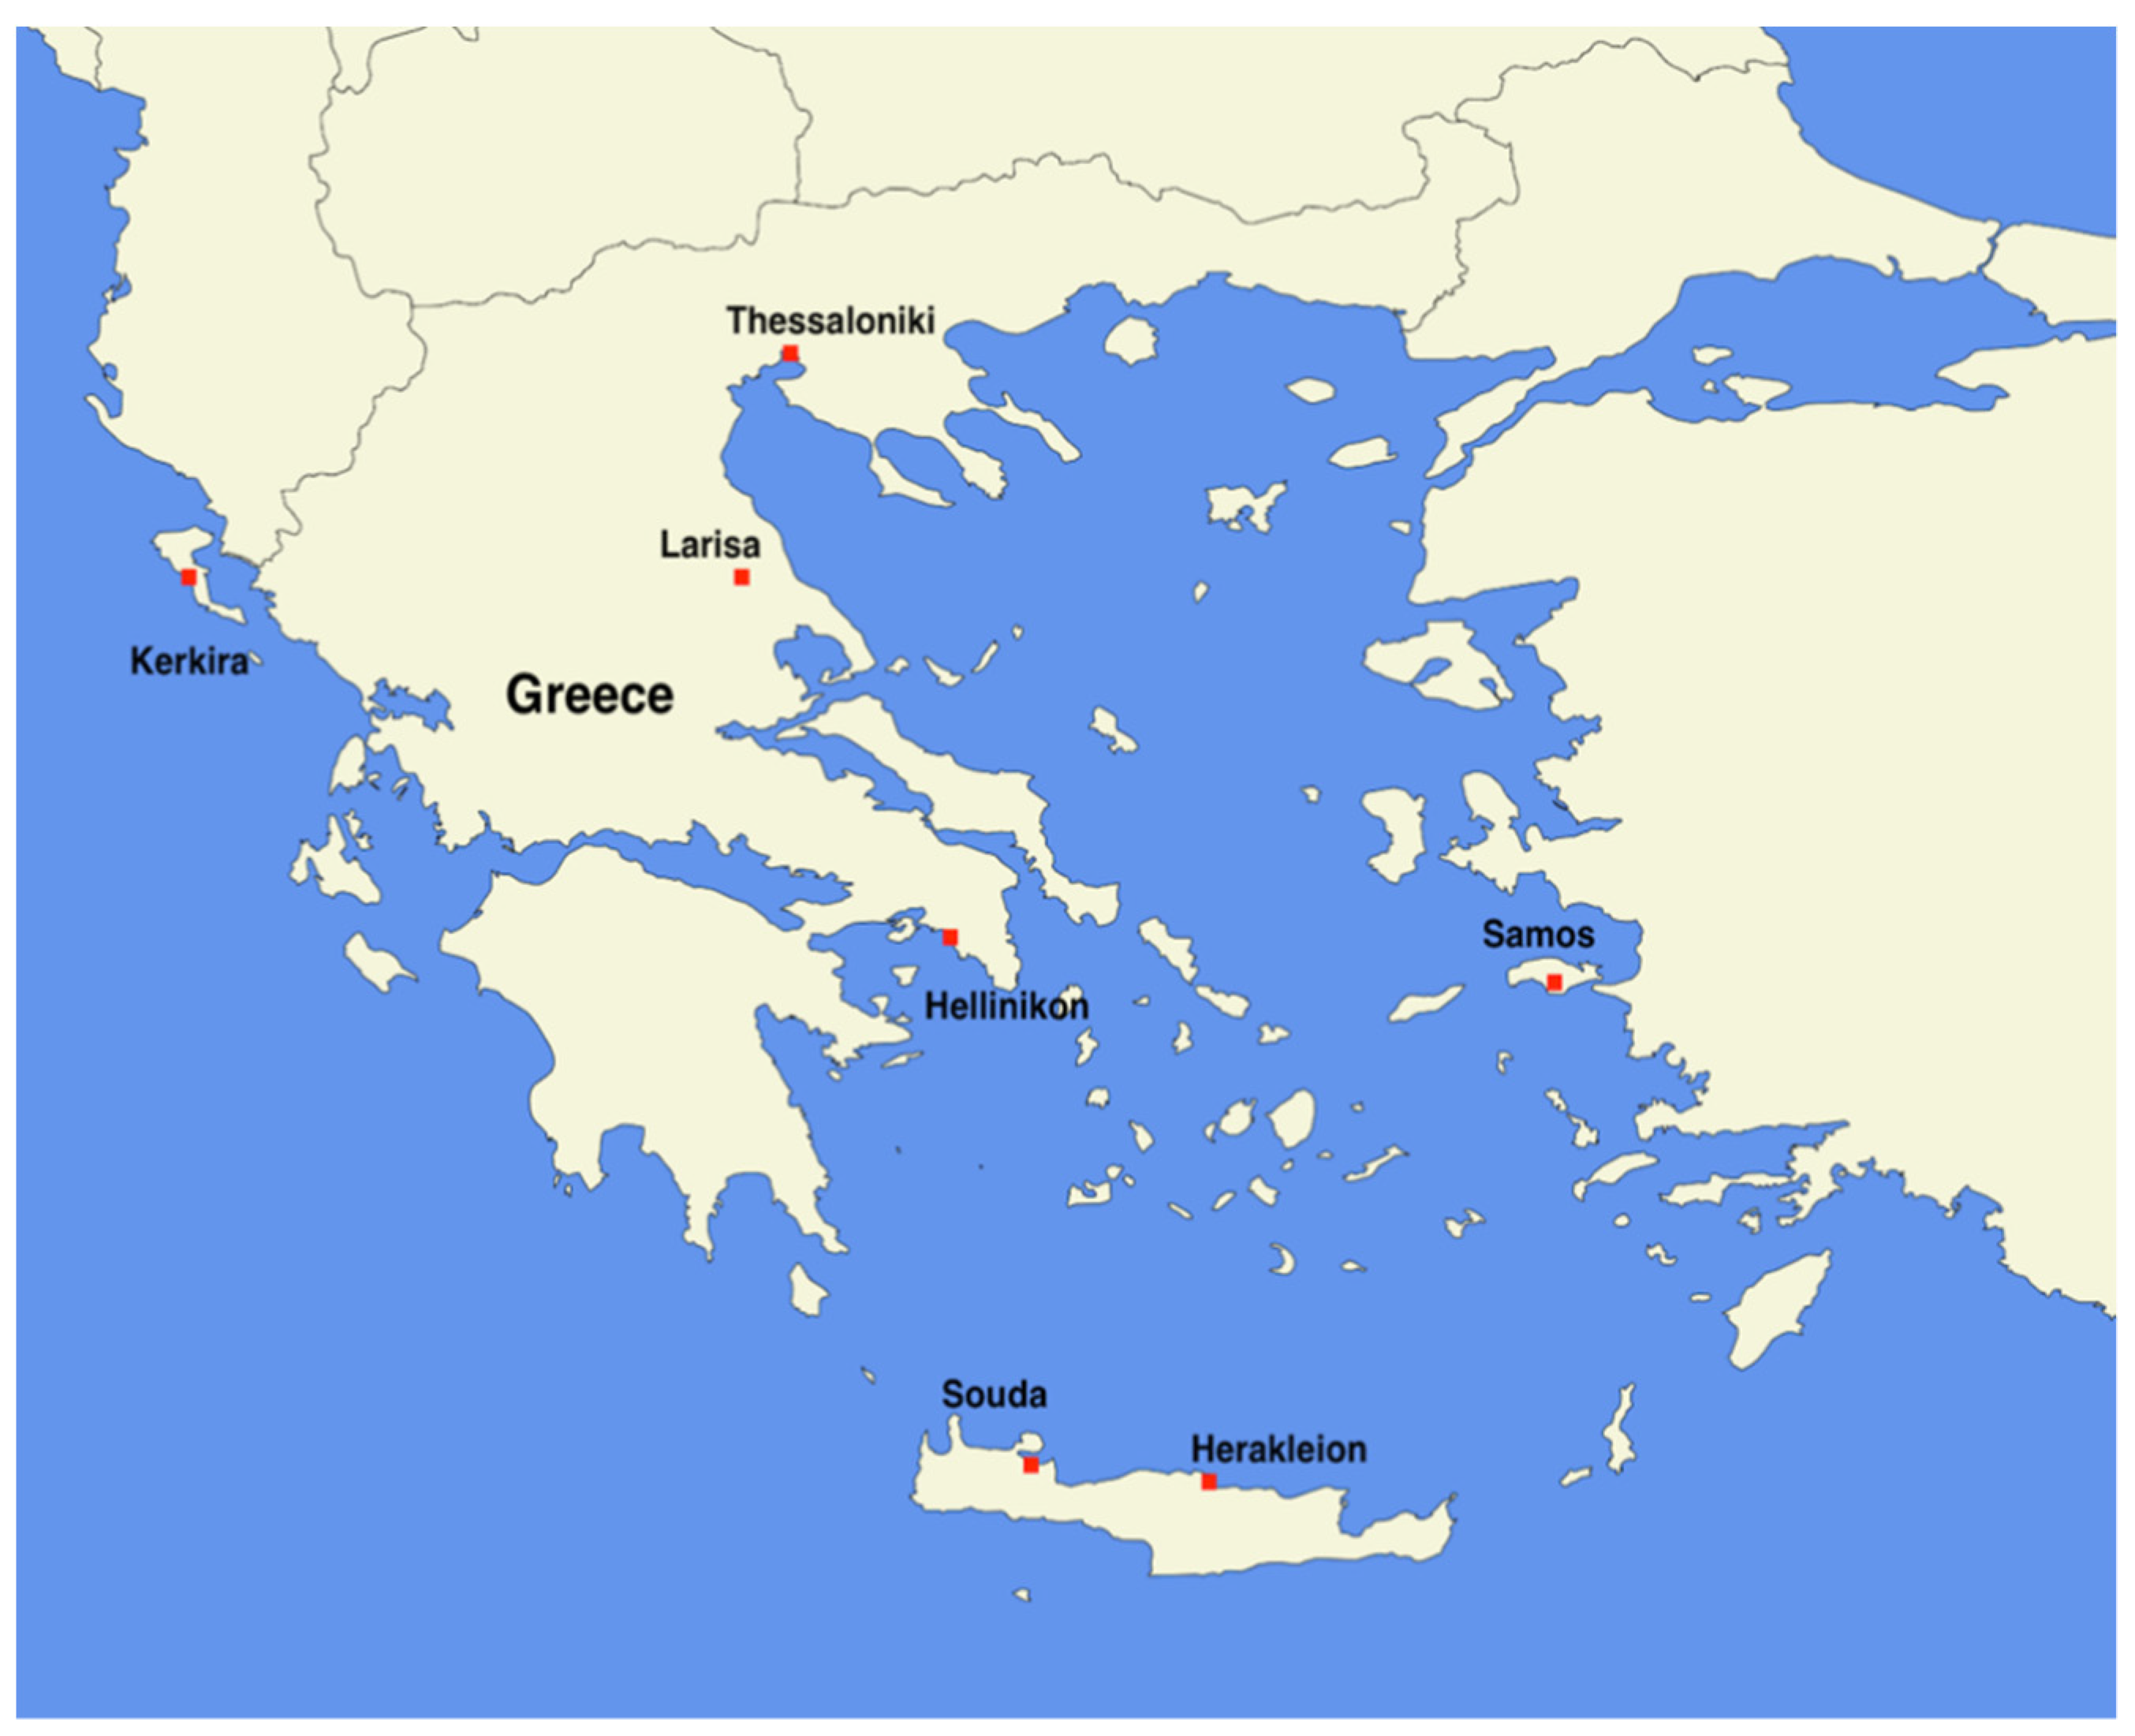
Publisher’s Note: MDPI stays neutral with regard to jurisdictional claims in published maps and institutional affiliations. |
© 2022 by the authors. Licensee MDPI, Basel, Switzerland. This article is an open access article distributed under the terms and conditions of the Creative Commons Attribution (CC BY) license (https://creativecommons.org/licenses/by/4.0/).