Abstract
The climatological characterization of variables allows us to understand the average behavior of atmospheric conditions, detect extremes and fluctuations, and the relationships of variables with geographic physical factors; it is presented as another aide for weather forecasting. The aim of this research is characterizing the behavior of the meteorological variables at the Antonio Maceo International Airport in Santiago de Cuba for the period 2017–2021. Antonio Maceo International Airport has the particularity of being located in a complex relief, exposed to marked breeze influences, and a significant number of wind shear pilot reports. The characterization was based on the concepts and graphs of descriptive statistics. The mean monthly distribution of the variables: temperature, relative humidity, atmospheric pressure, and wind speed and direction was obtained and is represented. The distributions of the maximum monthly and annual accumulations, the cloud cover, and the ranges of the reduction of the horizontal and vertical visibility were analyzed.
1. Introduction
The climate according to the definition of the World Meteorological Organization (WMO), is “the fluctuating set of atmospheric conditions, characterized by the evolution of the state of the weather, during a period and a given place or region, which is controlled by the so-called forcing factors, determining factors and by the interaction between the different components of the climatic system (atmosphere, hydrosphere, lithosphere, cryosphere, biosphere and anthroposphere)” [1]. The climatic aspect allows knowing the weather states that occur successively over long periods, its physical influences, the changes and development of physical phenomena of the atmosphere, and its effects on the earth’s surface. The Climatological Normal or normal value is used to define and compare the climate and generally represents the average value of a continuous series of measurements of a climatological variable for at least 30 years [2]. For climatic studies in aviation, the International Civil Aviation Organization (ICAO), in Annex 3, stated that meteorological data series of at least 5 years should be used [3].
To make landing and take-off operations more effective, aerodrome weather forecasts are prepared. One of the tools on which the aeronautical meteorologist relies to make his forecast more effective is the climatological characterization of meteorological variables. Aeronautical climatologies have been carried out internationally [4,5,6,7,8,9,10,11]. In Conde et al. [5,6,7,8,9,10] the aeronautical climatology was prepared with the data extracted from the aerodrome meteorological observations, in METAR code, for the years 1998 to 2011. The results were offered in the form of tables of relative frequencies or monthly average values of wind, component (cross) of the wind perpendicular to the runway, (longitudinal) component of the wind in the direction of the runway, visibility, runway visual range (RVR), height of the lowest cloud layer with coverage greater than half of the sky, visibility/cloud height combination, RVR/cloud height combination, temperature, pressure (QNH) and significant weather phenomena.
In the case of Cuba, De Armas Echevarria et al. [12] developed the climatological characterization of the direction and speed of the wind at the “Abel Santamaría” International Airport for the period 2011 to 2015. Nationally, there is no climatological characterization for the country’s airports, so a climatological analysis is beginning to be planned for each aerodrome, to thus have a tool that allows the meteorologist to access the peculiar meteorological characteristics of the areas where they are located. In this way, the forecast of each of the meteorological variables is perfected.
2. Materials and Methods
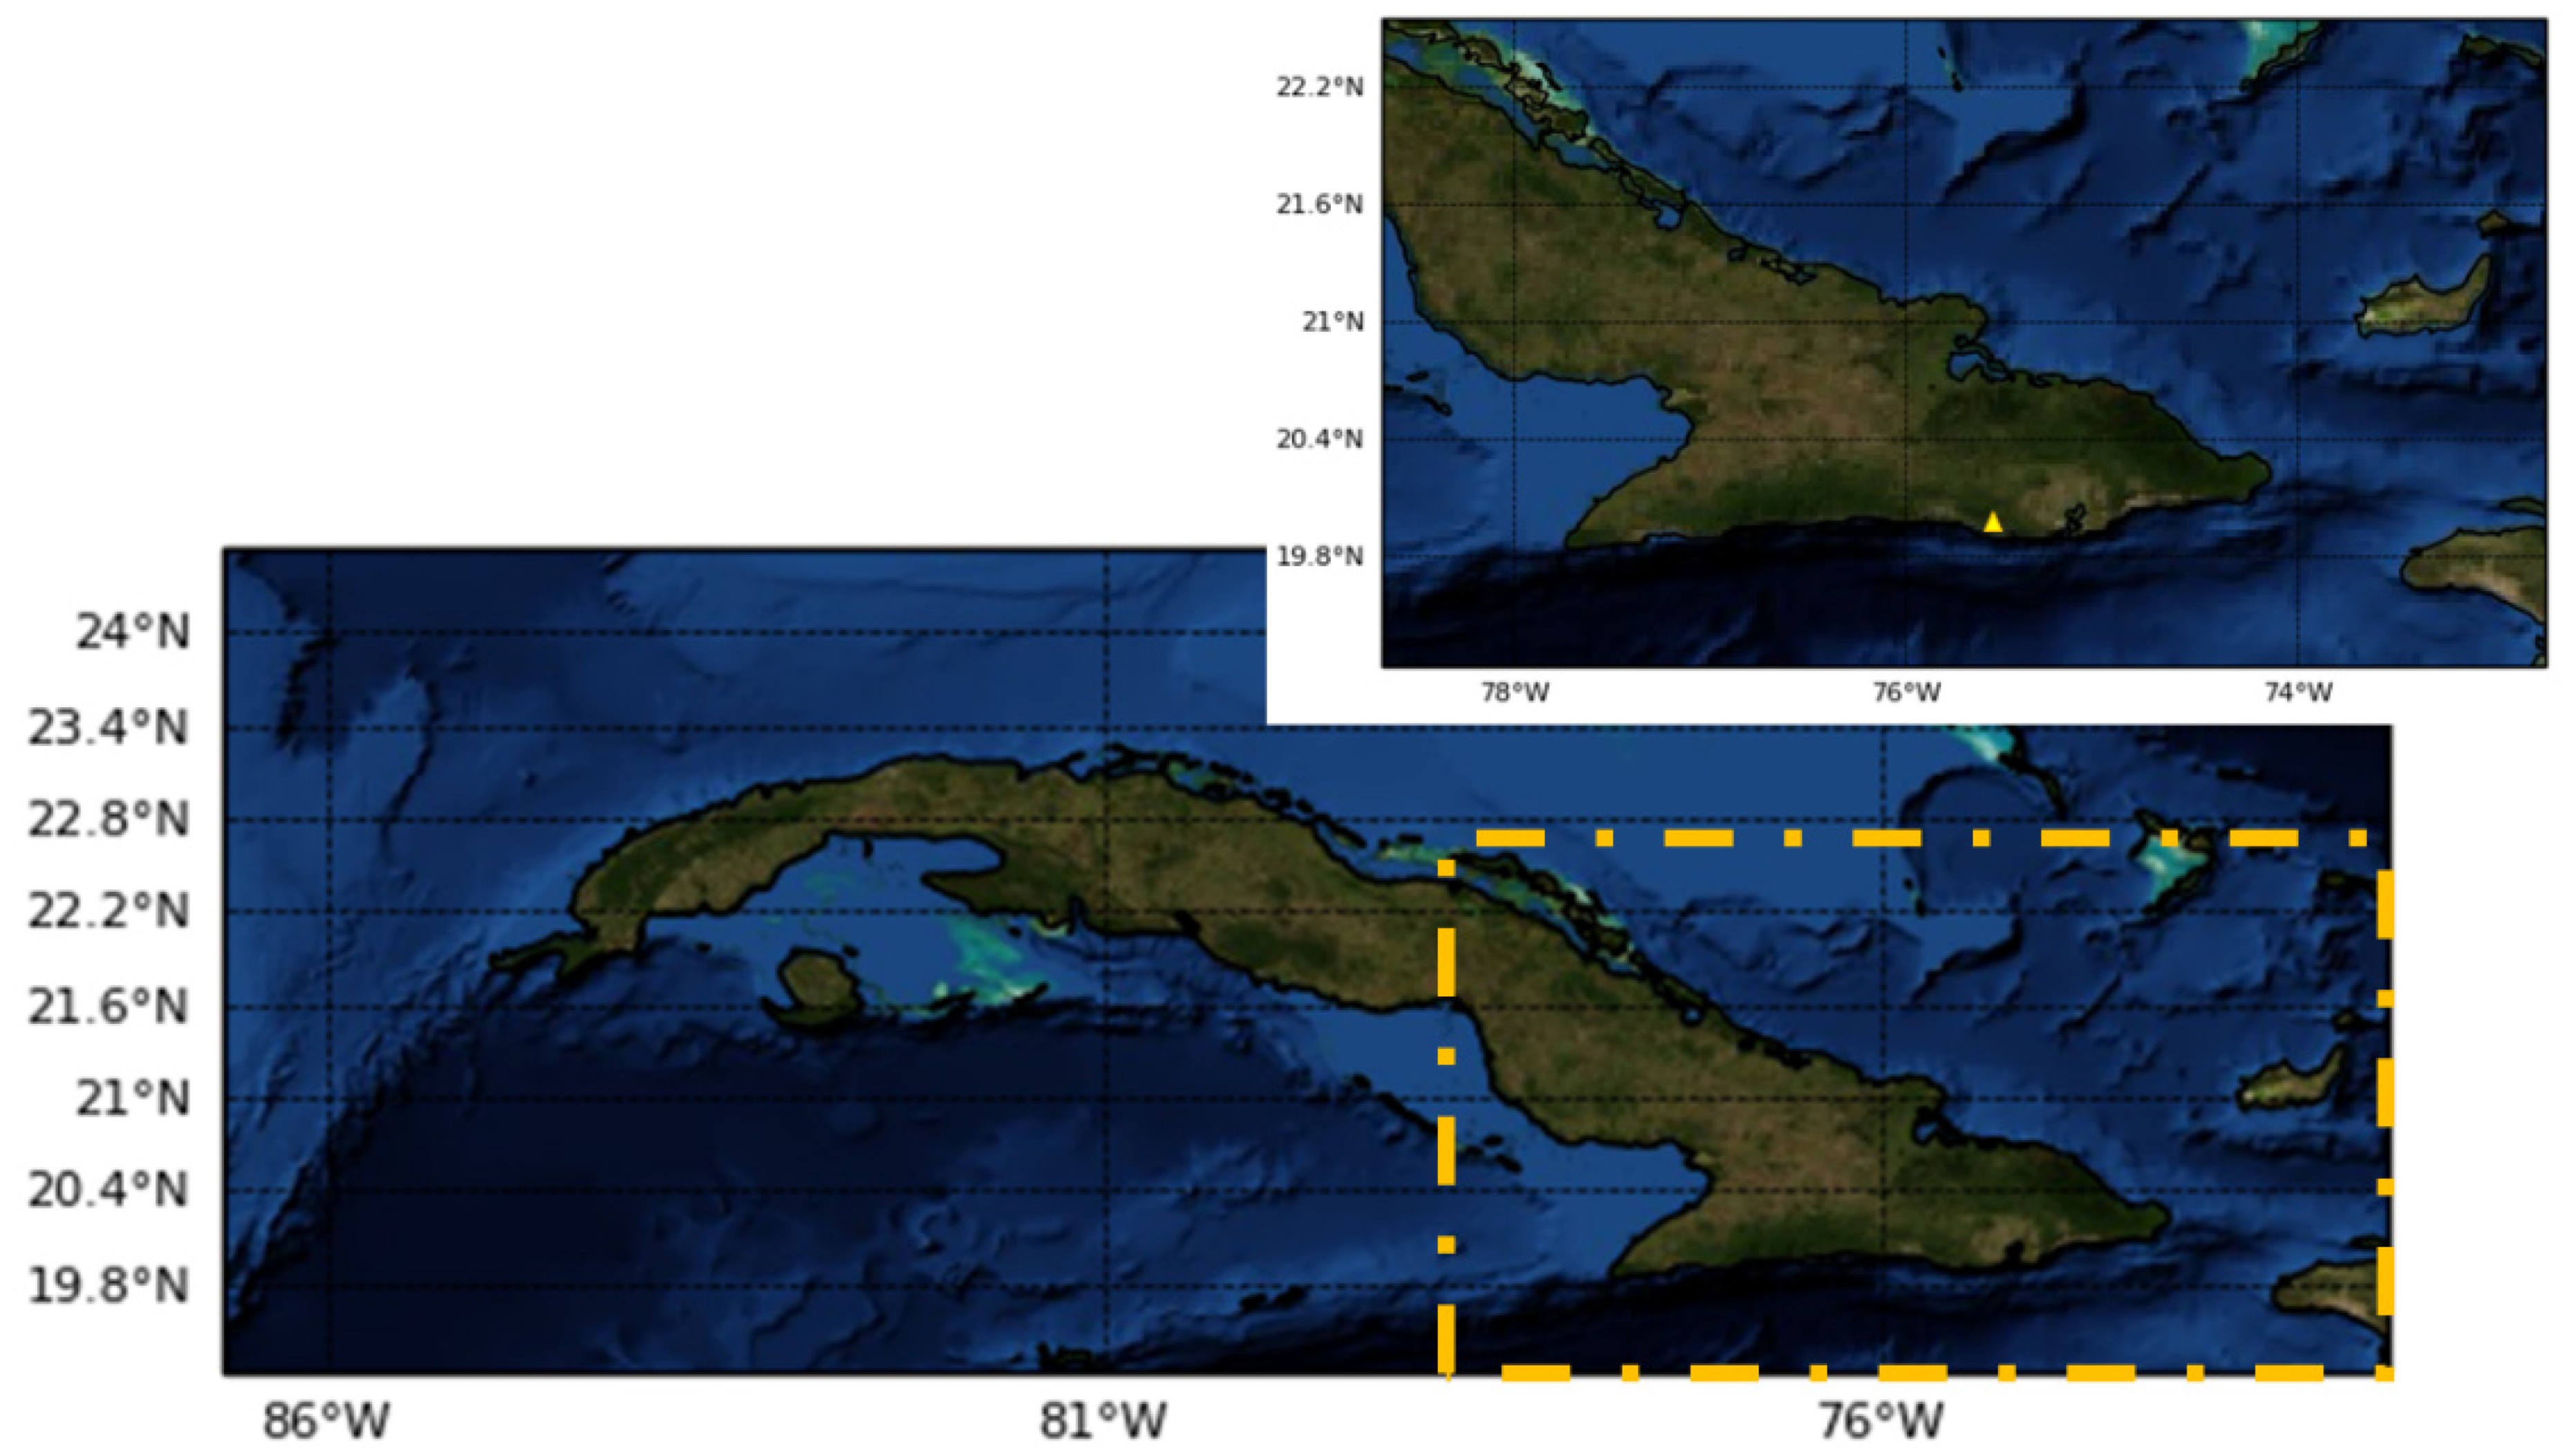
For the present investigation, the “Antonio Maceo” International Airport of Santiago de Cuba (MUCU) was selected as the study region. This aerodrome is located at 1905812N and 7505008W, about 7 km south of Santiago de Cuba, along the coast, as shown in Figure 1. It has an elevation of 76 m above sea level. The aerodrome is located on the last level of the coastal terraces to the south of the Sierra Maestra Mountain chain. The peculiarities of the relief that surrounds the aerodrome constitute a risk factor for landing, takeoff, and approaching air operations. It has two runways, one of which is oriented East–West (identified as 10/28), and the other is oriented North–South (identified as 01/19), which is used only by smaller aircraft.

Figure 1.
Location of the “Antonio Maceo” International Airport in Santiago de Cuba.
2.1. Statistical Analysis Methods Used for the Study of Meteorological Variables
A meteorological data series of at least 5 years should be used to develop climate studies for aviation [3]. In the present investigation, the climatological characterization at the “Antonio Maceo” International Airport in Santiago de Cuba was made for the 2017–2021 period through an analysis of the main descriptive statistics. The data were extracted from climatological records of the Empresa Cubana de Navegación Aérea.
2.2. Meteorological Variables
Methods of descriptive statistics were used to search elements that characterize the behavior of the fundamental meteorological variables. The data on temperature, relative humidity, atmospheric pressure, accumulated precipitation, wind speed, wind direction, present weather, vertical visibility, cloud base height, and cloud cover were used.
Wind Rose
The wind that prevailed in a range of time could be represented by employing a wind rose, which indicated the percentage of time in which the wind blew from different directions. The graph consisted of using bars or extensions that went from the center of a circle to a certain point that illustrated the direction of the wind, the length of each extension indicating the percentage of time in which the wind went in that direction [13]. The data were presented in eight primaries and eight secondary directions that are shown in Table 1.

Table 1.
Primary and secondary directions.
On the other hand, the wind speed was divided into ranges that could be given in various units, which ranged from miles per hour to meters per second. Periods with zero speed were also recorded, which were reported as calm, and periods with light wind conditions (less than 6 km/h) or storms, which were reported as “VRB”.
3. Results
3.1. Behavior of the Meteorological Variables during the Period 2017–2021
Monthly mean, maximum and minimum temperatures, and monthly mean relative humidity were calculated. Table 2 shows the results.
Table 2.
Mean, minimum, maximum temperatures, and monthly relative humidity during the period 2017–2021.
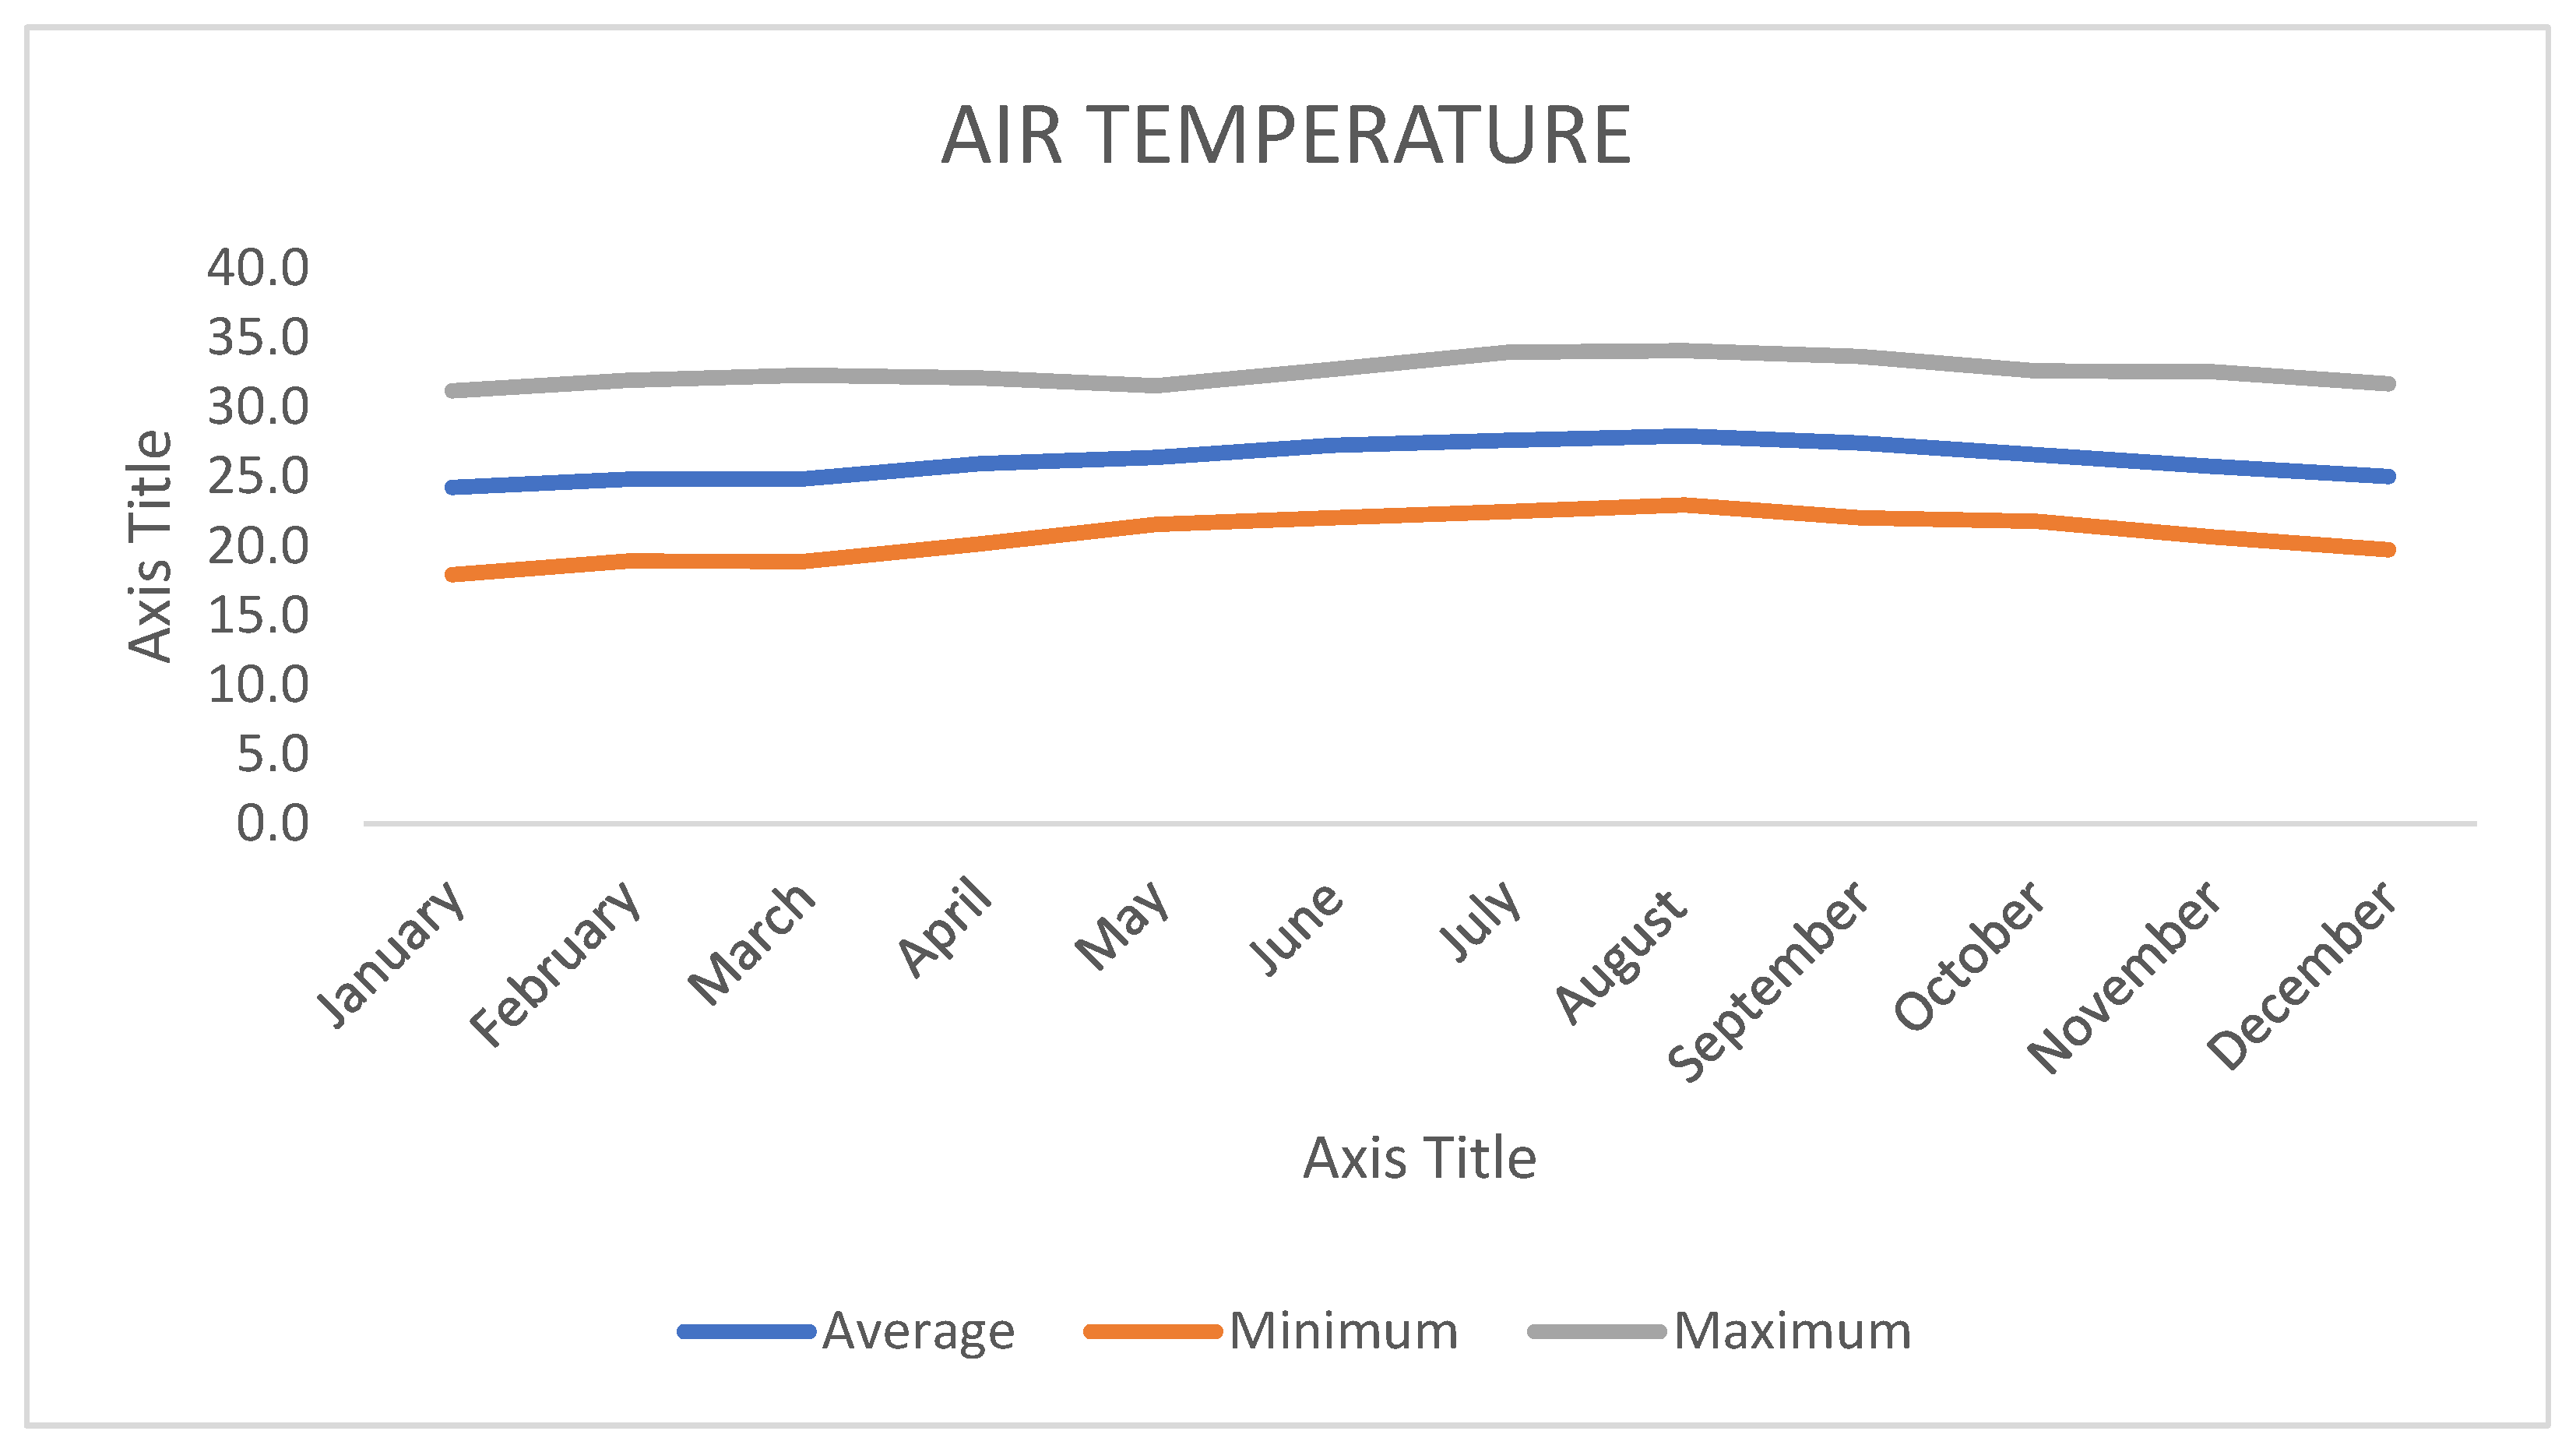
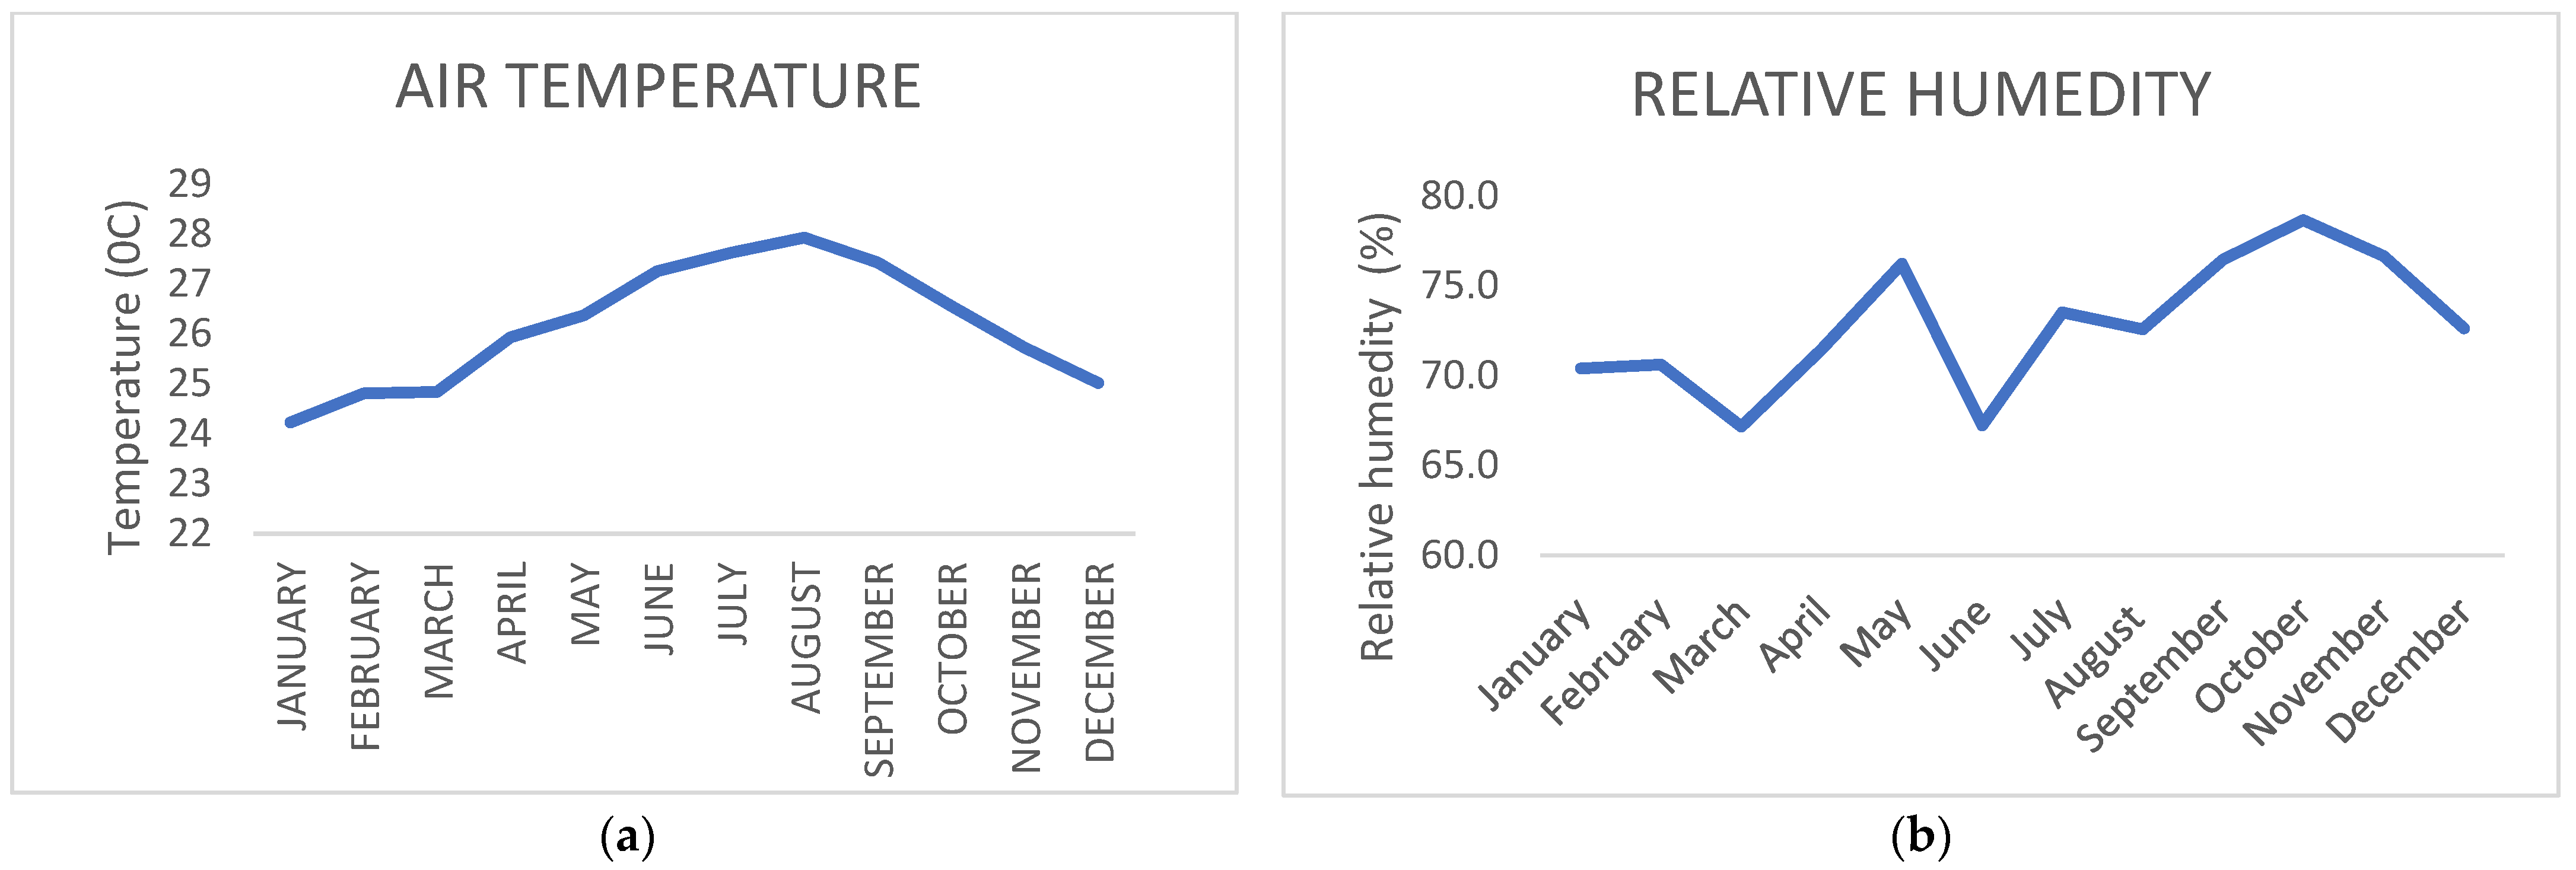
Throughout the year the average temperatures ranged between 24.2 °C and 27.9 °C. The lowest minimum temperatures were obtained in January and February, because in these months the number of cold fronts to the region is increased, and they are influenced by the cold air the continental migratory anticyclones that are established later. The highest temperatures, the maximums, were obtained between July to September. Figure 2 shows the mean distribution of mean, maximum, and minimum air temperatures.

Figure 2.
Mean distribution of mean, maximum, and minimum air temperatures.
The mean relative humidity from January to December ranged between 67.2% and 78.7%. The highest was obtained in the months of the rainy season, starting in May, with a minimum of 67.2% in June. Figure 3b shows the monthly mean distribution of the variable.
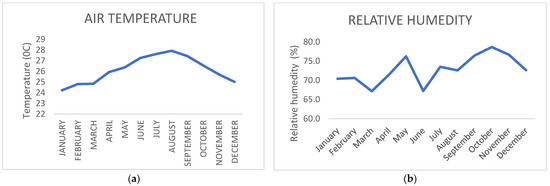
Figure 3.
The behavior of (a) the mean air temperature and (b) relative humidity in MUCU during the period 2017–2021.
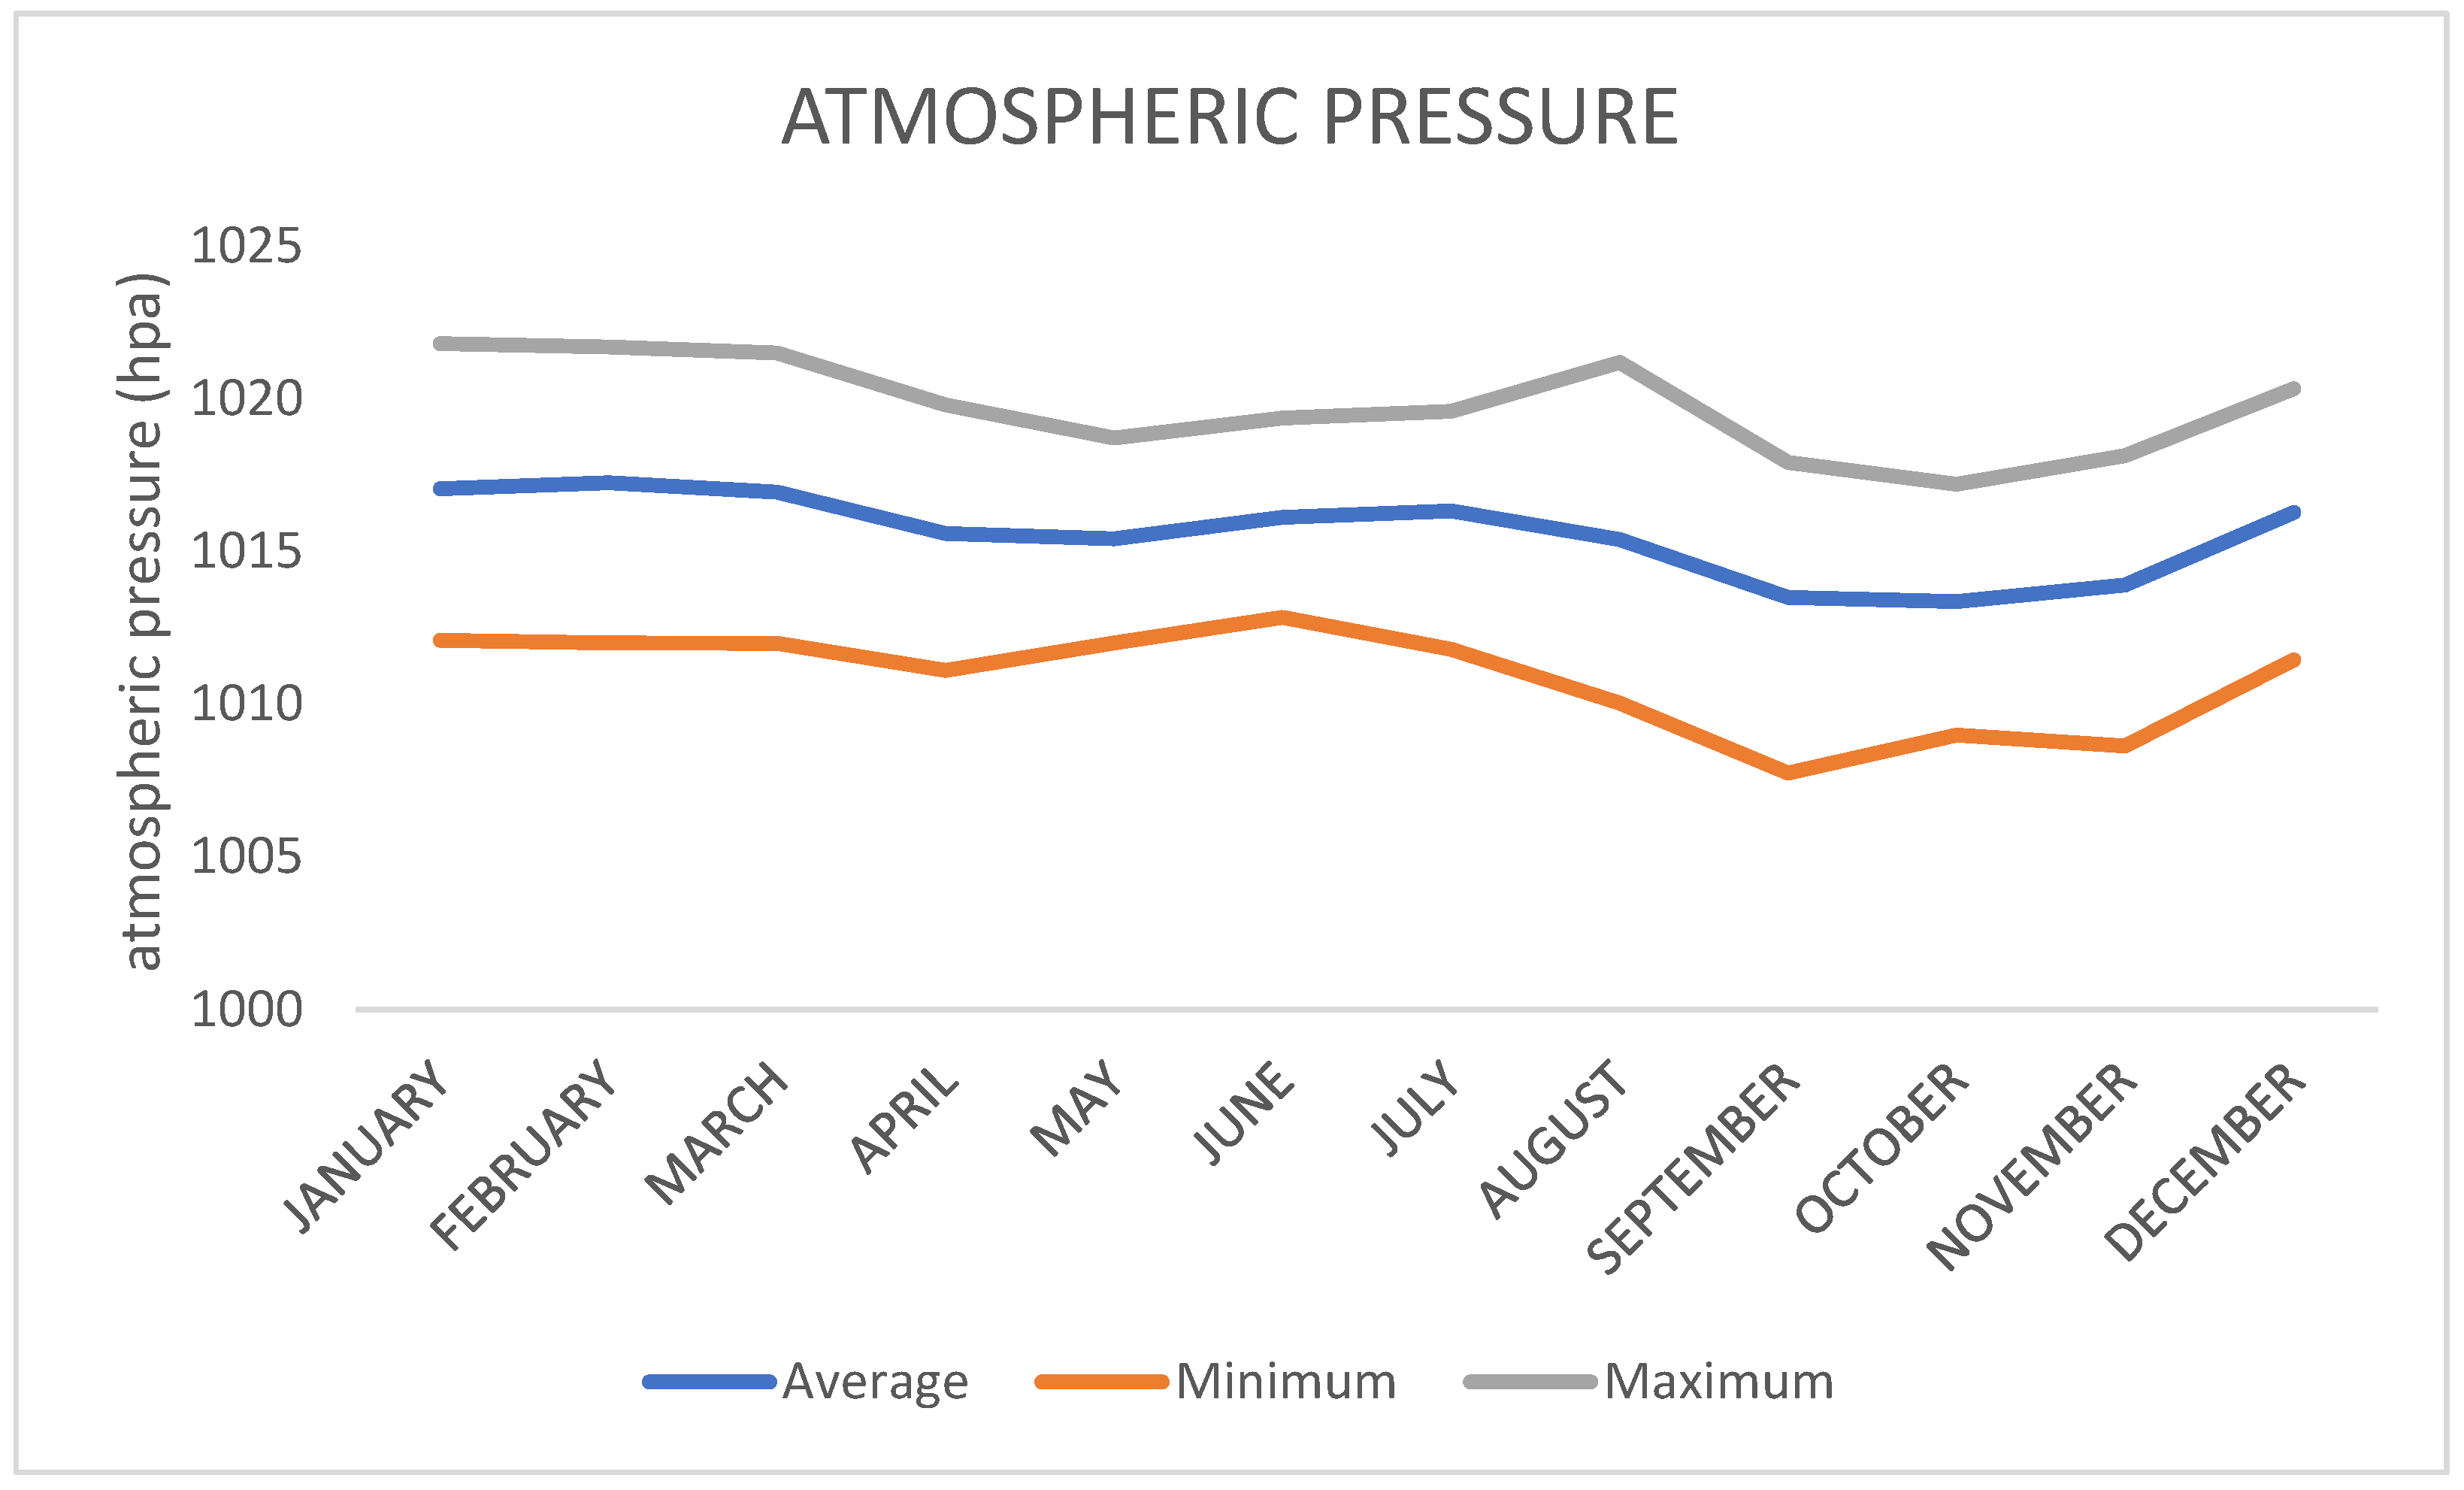
Monthly mean, minimum and maximum atmospheric pressures were calculated (Table 3). The mean atmospheric pressures ranged between 1013 hPa and 1017 hPa. The minimums were obtained in September, October, and November, and the maximums in January and February (Figure 4).
Table 3.
Mean, minimum, and maximum monthly atmospheric pressures during the period 2017–2021.

Figure 4.
Annual behavior of the mean, minimum, and maximum atmospheric pressure in MUCU during the period 2017–2021.
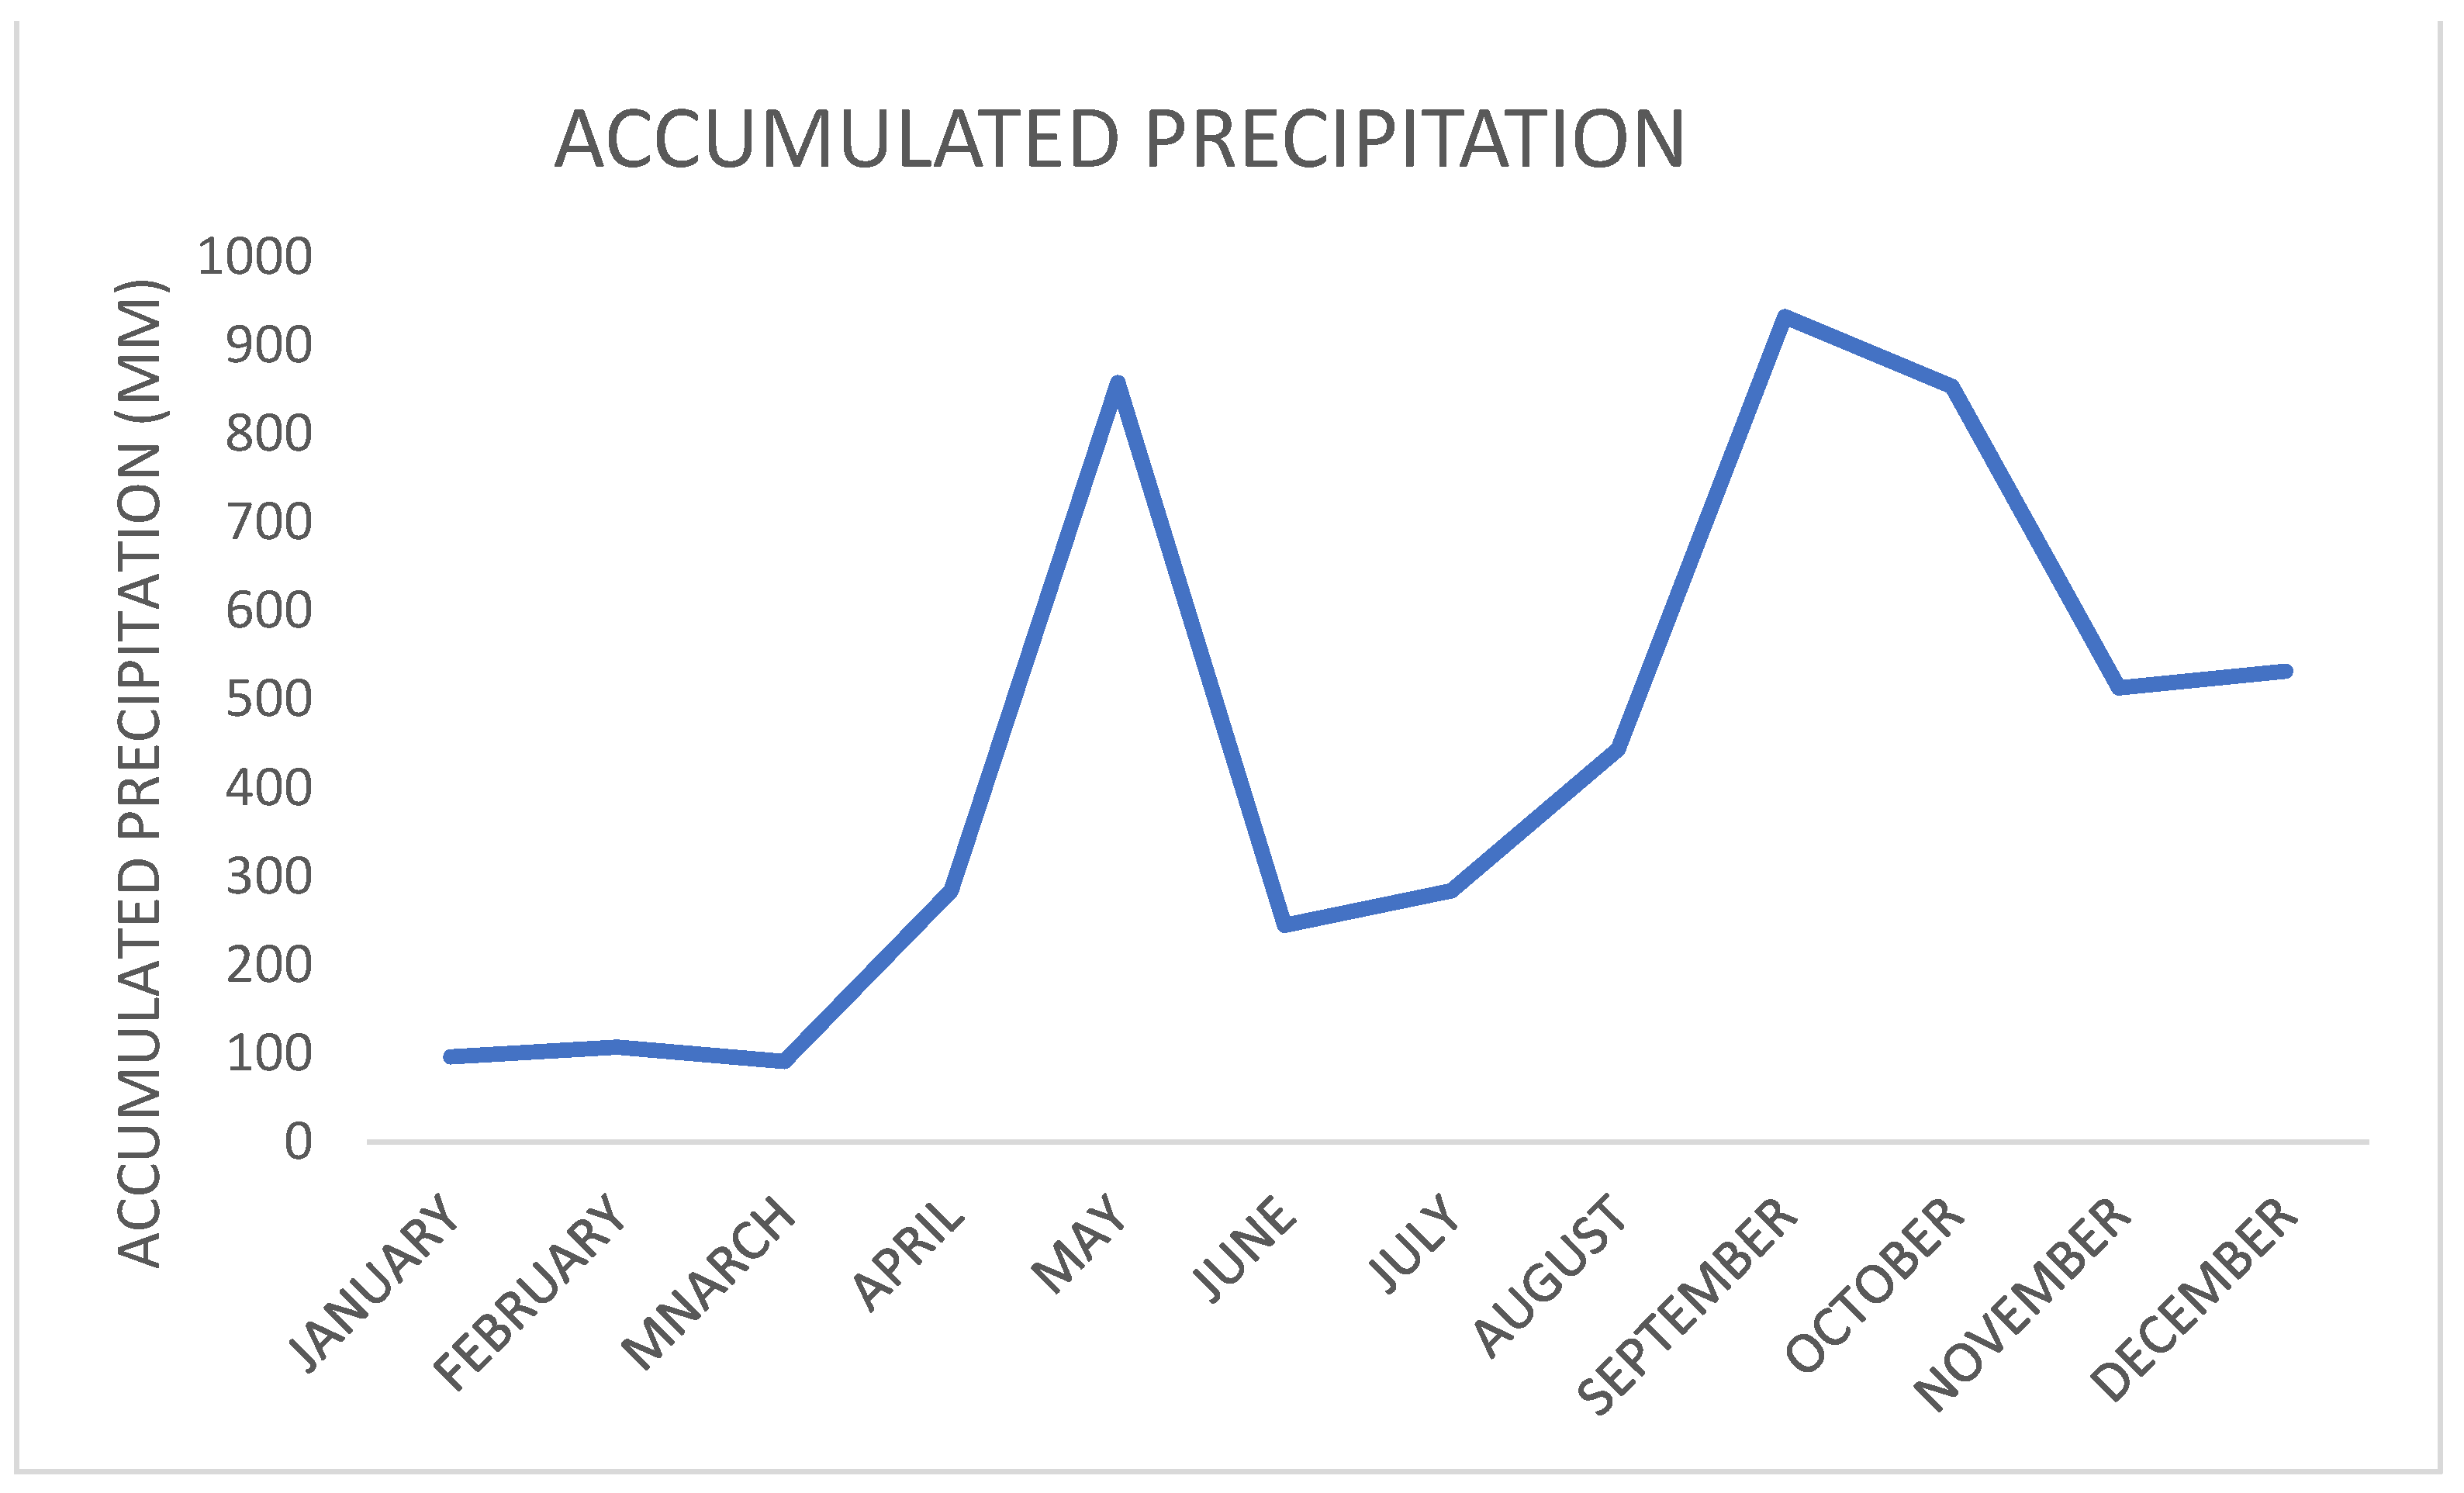
The monthly total accumulated precipitation is represented in Figure 5. Two maxima are observed in September, the months of the rainy season, where local-scale phenomena such as convective storms are formed by the interaction of the sea breeze front with horizontal convective rolls and the passage of synoptic-scale phenomena such as cold lows, tropical waves, and tropical cyclones.
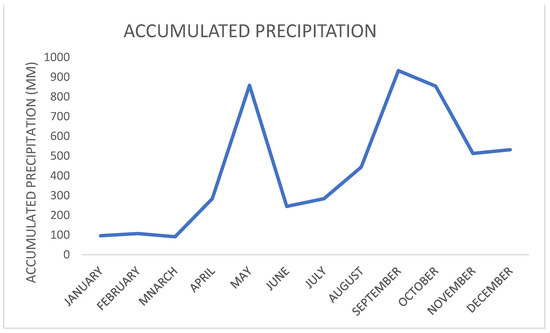
Figure 5.
Behavior (a) monthly and (b) annual of the accumulated precipitation in MUCU during the period 2017–2021.
3.2. Analysis of the Behavior of the Wind during the Period 2017–2021
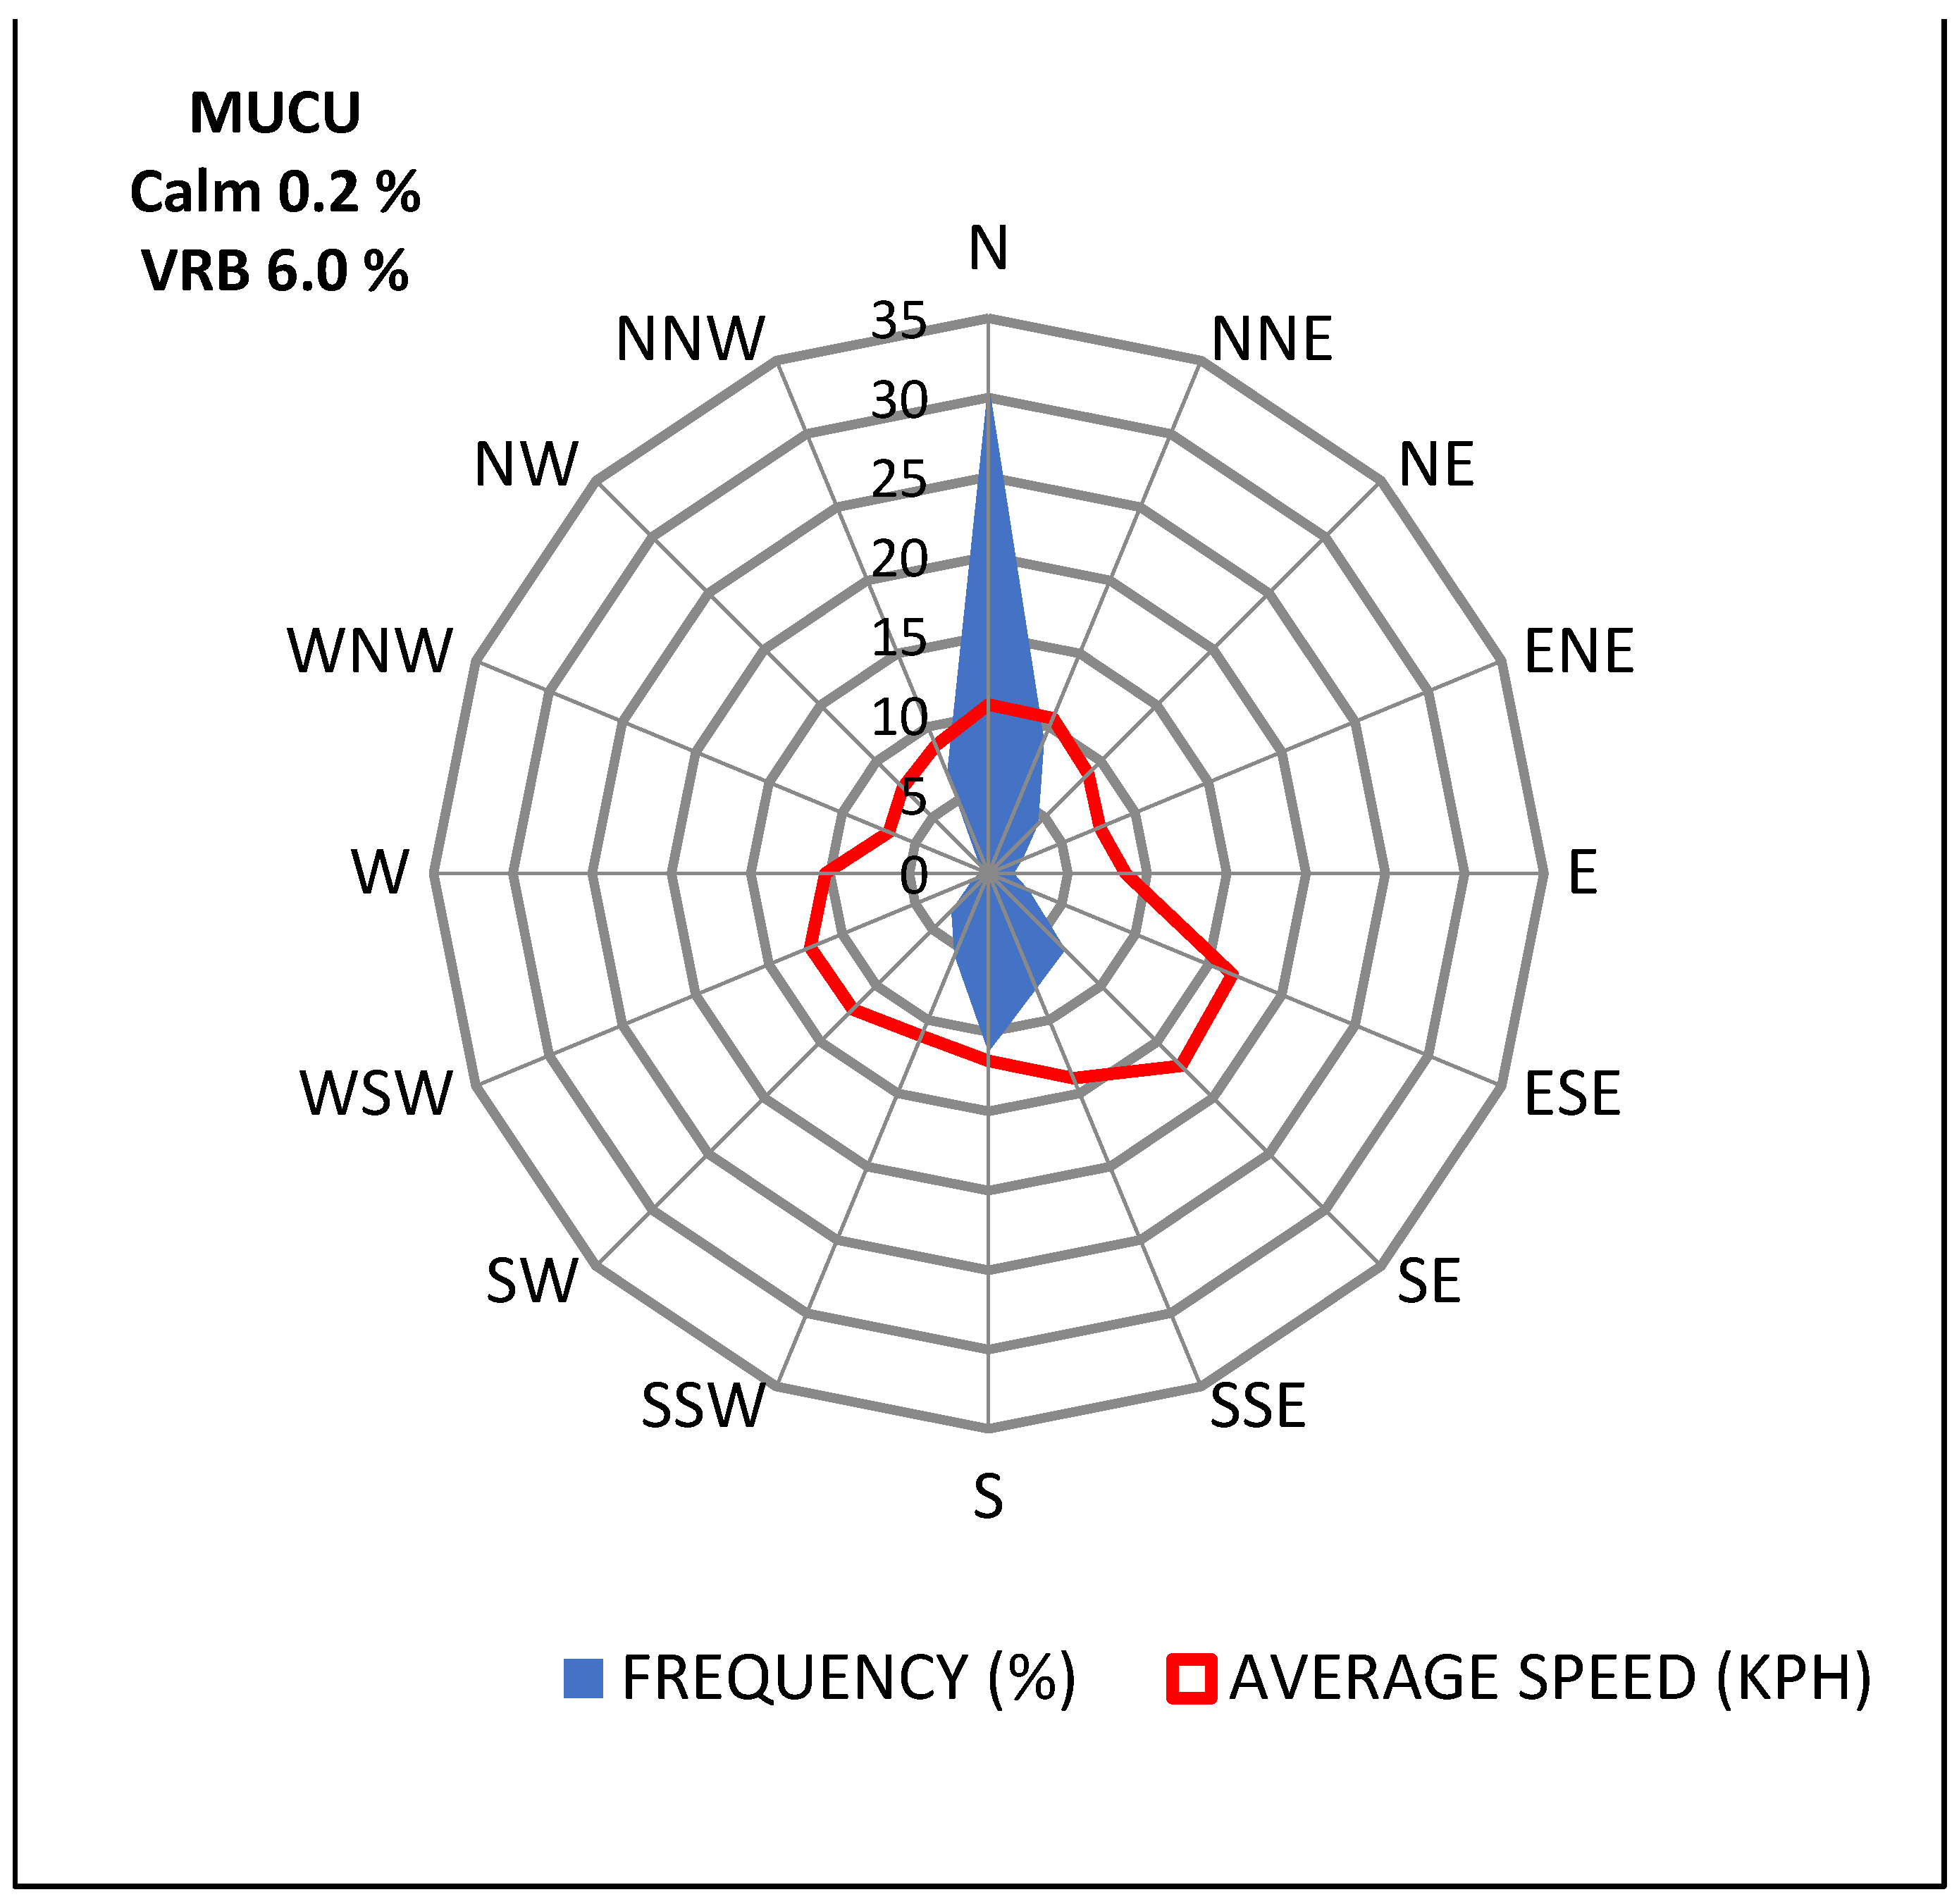
Figure 6 shows the wind rose, with 16 directions, with the most frequent wind direction from the north with an average speed of 11 km/h. The most frequent directions ranged from north-northwest to north-northeast and reached the maximum average speed in the east-southeast and southeast directions of 17 km/h.

Figure 6.
Rose of the wind direction and velocity for the period 2017–2021.
4. Conclusions
For the present investigation, the “Antonio Maceo” International Airport of Santiago de Cuba (MUCU) aeronautical climatology was developed. The lowest minimum temperatures were obtained in January and February and the highest maximum temperatures were obtained between July and September. The mean relative humidity from January to December ranged between 67.2% and 78.7%. The most frequent wind directions ranged from north-northwest to north-northeast and reached the maximum average speed in the east–southeast and southeast directions of 17 km/h.
Author Contributions
Conceptualization, B.V.D., A.M.D.A.E. and P.C.-H.; methodology, B.V.D. and A.M.D.A.E.; formal analysis, B.V.D.; investigation, B.V.D.; writing—original draft preparation, B.V.D.; writing—review and editing, P.C.-H.; visualization, P.C.-H. All authors have read and agreed to the published version of the manuscript.
Funding
This research received no external funding.
Institutional Review Board Statement
Not applicable.
Informed Consent Statement
Not applicable.
Data Availability Statement
Not applicable.
Conflicts of Interest
The authors declare no conflict of interest.
References
- Bernal, G.; Rosero, M.; Cadena, M.; Montealegre, J.; Sanabria, F. Estudio de la Caracterización Climática de Bogotá y Cuenca Alta del Río Tunjuelo; Fondo de Prevención y Atención de Emergencias FOPAE; Instituto de Hidrología, Meteorología y Estudios Ambientales IDEAM: Colombia, Bogotá, 2007. Available online: https://www.google.com/url?sa=t&rct=j&q=&esrc=s&source=web&cd=&ved=2ahUKEwiVv-PE74f4AhXYQzABHRFAA3EQFnoECAsQAQ&url=http%3A%2F%2Fdocumentacion.ideam.gov.co%2Fcgi-bin%2Fkoha%2Fopac-detail.pl%3Fbiblionumber%3D18241&usg=AOvVaw1QXJoDxIVwCkCZoH9TlgBJ (accessed on 30 May 2022).
- Bocanegra, J.E.M. Study of the Climatic Variability of Precipitation in Colombia Associated with Meso- and Large-Scale Oceanic and Atmospheric Processes; Informe final de las actividades desarrolladas en el marco del contrato de prestación de servicios No. IDEAM 022-2009; Instituto de Hidrología, Meteorología y Estudios Ambientales IDEAM: Colombia, Bogotá, 2009. Available online: http://www.ideam.gov.co/documents/21021/21789/Estudio+de+la+variabilidad+clim%C3%A1tica+de+la.pdf/643c4c0e-83d7-414f-b2b4-6953f64078d3 (accessed on 10 May 2022).
- ICAO. Annex 3: Meteorological Service for International Air Navigation, 6th ed., La Habana, Cuba. 2007, pp. 1–8. Available online: https://www.google.com/url?sa=t&rct=j&q=&esrc=s&source=web&cd=&cad=rja&uact=8&ved=2ahUKEwjztZC78Yf4AhUwRTABHYJUD9IQFnoECBAQAQ&url=https%3A%2F%2Fwww.icao.int%2Fairnavigation%2FIMP%2FDocuments%2FAnnex%25203%2520-%252075.pdf&usg=AOvVaw1FhpwoKFeySnrIz4kVMnrk (accessed on 20 January 2022).
- Stolz España, W.; Rojas Ureña, J.; Chinchilla, R.G. Aeronautical Climatology (2000–2010) at Tobías Bolaños Palma International Airport; s.l.; National Meteorological Institute: Sofia, Bulgaria, 2012. Available online: https://www.google.com/url?sa=t&rct=j&q=&esrc=s&source=web&cd=&ved=2ahUKEwjp87aq8of4AhVwQzABHSISCagQFnoECAIQAQ&url=https%3A%2F%2Fes.scribd.com%2Fdocument%2F373427291%2FClimatologia-Del-Aeropuerto-Tobias-Bolanos-Pavas&usg=AOvVaw29b9m9iW_WJHQam7qY8hW9 (accessed on 5 May 2022).
- Conde Torrijos, V.; Ballester Valor, G.; Huarte Ituláin, M.T.; Sterling Carmona, F.; Casado Gómez, J.; Corral Corral, F. Climatología Aeronáutica. Madrid (Barajas). In AEMET—Climatologías Aeronáuticas; Agencia Estatal de Meteorología: Madrid, Spain, 2012; Available online: http://hdl.handle.net/20.500.11765/3638 (accessed on 6 May 2022).
- Conde Torrijos, V.; Ballester Valor, G.; Huarte Ituláin, M.T.; Sterling Carmona, F.; Casado Gómez, J.; Corral Corral, F. Climatología Aeronáutica. Fuerteventura. In AEMET—Climatologías Aeronáuticas; Agencia Estatal de Meteorología: Madrid, Spain, 2012; Available online: http://hdl.handle.net/20.500.11765/3604 (accessed on 6 May 2022).
- Conde Torrijos, V.; Ballester Valor, G.; Huarte Ituláin, M.T.; Sterling Carmona, F.; Casado Gómez, J.; Corral Corral, F. Climatología Aeronáutica. Lanzarote. In AEMET—Climatologías Aeronáuticas; Agencia Estatal de Meteorología: Madrid, Spain, 2012; Available online: http://hdl.handle.net/20.500.11765/3609 (accessed on 6 May 2022).
- Conde Torrijos, V.; Ballester Valor, G.; Huarte Ituláin, M.T.; Sterling Carmona, F.; Casado Gómez, J.; Corral Corral, F. Climatología Aeronáutica. Alicante. In AEMET—Climatologías Aeronáuticas; Agencia Estatal de Meteorología: Madrid, Spain, 2012; Available online: http://hdl.handle.net/20.500.11765/3614 (accessed on 6 May 2022).
- Conde Torrijos, V.; Ballester Valor, G.; Huarte Ituláin, M.T.; Sterling Carmona, F.; Casado Gómez, J.; Corral Corral, F. Climatología Aeronáutica. Almería. In AEMET—Climatologías Aeronáuticas; Agencia Estatal de Meteorología: Madrid, Spain, 2012; Available online: http://hdl.handle.net/20.500.11765/3615 (accessed on 6 May 2022).
- Conde Torrijos, V.; Ballester Valor, G.; Huarte Ituláin, M.T.; Sterling Carmona, F.; Casado Gómez, J.; Corral Corral, F. Climatología Aeronáutica. Asturias. In AEMET—Climatologías Aeronáuticas; Agencia Estatal de Meteorología: Madrid, Spain, 2012; Available online: http://hdl.handle.net/20.500.11765/3617 (accessed on 6 May 2022).
- Conde Torrijos, V.; Ballester Valor, G.; Huarte Ituláin, M.T.; Sterling Carmona, F.; Casado Gómez, J.; Corral Corral, F. Climatología Aeronáutica. Melilla. In AEMET—Climatologías Aeronáuticas; Agencia Estatal de Meteorología: Madrid, Spain, 2012; Available online: http://hdl.handle.net/20.500.11765/3612 (accessed on 6 May 2022).
- De Armas Echevarria, A.M.; Cremata Zaldívar, L.; Pérez Hernández, L. Characterization of the direction and strength of the wind at the “Abel Santamaría” International Airport in the period 2011–2015. Rev. Cub. Meteor. 2019, 25, 139–150. Available online: http://rcm.insmet.cu/index.php/rcm/article/download/461/636?inline=1 (accessed on 30 May 2022).
- Ahrens, C.D. Essentials of Meteorology: An Invitation to the Atmosphere; Segunda ed. s.l.; Wadsworth Publishing Company: Belmont, CA, USA, 1998. [Google Scholar]
Publisher’s Note: MDPI stays neutral with regard to jurisdictional claims in published maps and institutional affiliations. |
© 2022 by the authors. Licensee MDPI, Basel, Switzerland. This article is an open access article distributed under the terms and conditions of the Creative Commons Attribution (CC BY) license (https://creativecommons.org/licenses/by/4.0/).