Abstract
The hypogea of the Punic necropolis of Nora represented a testing ground for the use of photogrammetry as an archaeological survey tool in a highly critical context, both from the point of view of the survey itself and from the point of view of the understanding and dissemination of the underground evidence. The study describes the acquisition techniques and the tools used to share the 3D models, both among the research team and with external users, with a specific focus on web-based tools (Potree).
1. Introduction: Photogrammetry for Documenting Archaeological Contexts and Creating 3D Contents
In order to integrate the drawing documentation of an excavation, photogrammetry has been frequently used as an additional survey method. This technique provides an enhancement of on-field data recording, 3D modelling, laser scanning data, GIS projects, etc. (about photogrammetry applied to Cultural Heritage, see [1,2,3,4] (pp. 7–12, 65–73, 74–87 in [1]; pp. 253–304, 369–381 in [2]; pp. 229–236, 243–246 in [3]); for a general overview on Geomatics and Digital Techniques applied to Cultural Heritage, see [1,2]; about photogrammetry used in some funerary or underground archaeological contexts, see [5,6,7,8,9]). This tendency reveals an intense joint between Cultural Heritage (especially in the archaeological field of research) and Geomatics (especially photogrammetry) that has been constantly consolidated, during the last decade, thanks to the exponential development of Digital Technologies (DT). This work represents an opportunity to describe the workflow and the results of the photogrammetric survey campaigns developed between 2014 and 2017 in the sector occupied by the necropolis of Nora. The workflow described here will focus on the 3D survey of the surface and on the 3D survey of two underground graves (hypogea t1 and t3) acquired during the 2014–2016 3D survey. This work aims to present workflows and outcomes that were produced by analyzing 3D data obtained from the photogrammetric campaign. This context has been a suitable opportunity not only to test and enrich methods of drawing documentation, but also to create different outputs in order to display and share several types of information.
2. The Phoenician and Punic Necropolis of Nora
The archaeological site of Nora is located on a peninsula along the southwestern coast of Sardinia, nearly 30 km south-west from Cagliari. After many years of archaeological excavations, the site is generally acknowledged as one of the most important archaeological parks of the island: the site attracts approximately 70,000 visitors every year. From a scientific point of view, Nora has also become one of the most significant archaeological sites in Sardinia, where several Italian universities have been collaborating since 1990 to reconstruct its history, which is dated from the Nuragic period to the early decades of the 8th century A.D. [10] (p. 12). Within the archaeological site, the Phoenician and Punic cemetery of Nora, which is the case study of this work, occupies the narrowest part of the peninsula (nowadays extended less than 100 m, from east to west). Since 2012, the University of Padova has started its archaeological research within the ex-military area in the northern part of the peninsula. After two geophysical campaigns (2012–2013 [11]), the excavation of the new area has been uncovering interesting archaeological evidence, such as a portion of the ancient cemetery of the city (on the north side) and structures in connection with a paved road (on the south) [12] (pp. 180–186). Focusing on the necropolis, the discovered graves could be divided into two main groups based on their shape (Figure 1). The first group consists of simple quadrangular graves, realized by cutting the surface of the sandstone bank. The second group, instead, includes the hypogea, deep graves excavated in the same bank of rock and composed by rectangular shafts leading to a system of underground burial chambers.
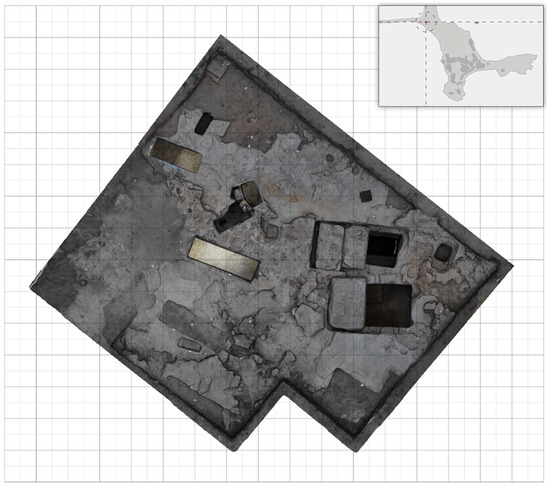
Figure 1.
Top orthographic view of the photogrammetric survey of the necropolis (2016). In black line a metric grid made up of 1 × 1 m squares. In gray line a metric grid made up of 0.5 × 0.5 m squares. On the right corner, on the top, the location of the necropolis (in red) within the peninsula of Nora.
3. The Photogrammetric Survey of the Necropolis of Nora
3.1. Purpose of the Survey
Since 2014, the traditional survey technique (hand drawings, image rectifications, and total station survey) has been integrated with photogrammetry. The total station survey was acquired with a Leica Total Station TS06 plus. The 3D survey project of the necropolis of Nora, which is still in progress, has been planned with two principle aims. The first, the scientific purpose, aims to improve the graphical documentation of the archaeological context with new and suitable data (i.e., orthophotos, views, cross-sections, perspective views, plans, etc.). The second, the enhancement goal, responds to the necessity of sharing the results of the excavation with a larger audience. The first photogrammetric survey of the necropolis was realized in 2014 with an acquisition of a limited area (Figure 2a). Then, from 2015 to 2016, due to the widening of the excavation area and the discovery of different grave typologies (pits and hypogea), the 3D survey was divided into two specific moments, in order to reach the best results during data collection: the 3D terrestrial survey of the surface (i.e., the extensive 3D acquisition of the necropolis) and the 3D survey of the underground graves (i.e., the acquisition of hypogea t1 and t3). As previously reported, this work will be the opportunity to present the results obtained throughout the 2014–2016 photogrammetric campaign.
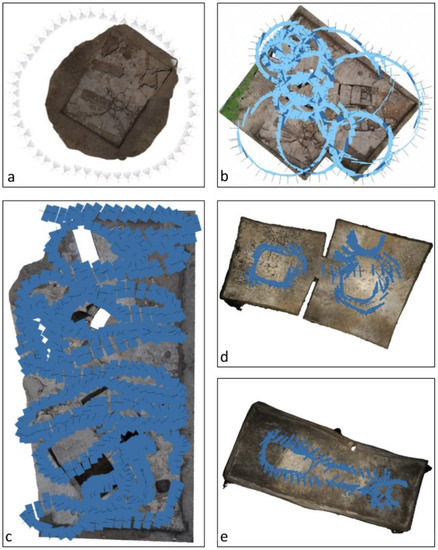
Figure 2.
Terrestrial photogrammetric trajectories followed during the acquisition from 2014 to 2016. (a) The 2014 first dataset; (b) the 2015 10 datasets of the surface; (c) the 2016 swaths made on the north-eastern part of the area; (d,e) the 2016 dataset of the hypogea.
3.2. Fieldwork Acquisition
For the 3D survey of the surface, the camera was positioned at about 2 m above the surface. On the contrary, for the survey of the hypogea, a tripod and a LED flashlight were employed in order to acquire more reliable data and in order to find a practical solution to face the lack of light inside the graves. With the intent of avoiding the lack of any data, a circular trajectory was followed to register each of the graves from the surface (2015, Figure 2b) and the internal part of the hypogea (2016, Figure 2d,e). In 2016, the survey of all the graves excavated on the east side of the necropolis was obtained with an “UAV like trajectory”, without following a path defined by regular and overlapped swaths (Figure 2c). All the photogrammetric datasets, during both the 3D survey campaigns, were collected with a reflex camera (Nikon d300s, Nikon Corporation, Tokyo, Japan), equipped with an Af-S NIKKOR 17–55m 1:2.8 G ED DX. Their processing was carried out with the software PhotoScan Pro [13] installed in a 2012 notebook. From 2014 to 2016, about 1185 images were collected (divided in 12 datasets) and then separately processed in four main groups.
In order to georeference and scale all the datasets, three main groups of control points were used: one for the surface of the excavation area and the other two for the hypogea t1 and t3. These GCPs were acquired with a total station and georeferenced to a grid projected with the Gauss-Boaga coordinate system (EPSG: 3003). Every GCP was identified with a code (the ID of the stratigraphic unit or the ID of the section) written on top of each plastic marker. These labels were settled on the surface of the sandstone bank with a steel nail. The reliable position of these nails defined the choice of using them as GCPs also for future photogrammetric acquisitions. On the other hand, for the hypogea, the markers were drawn on the inner surface of the structure with a colored chalk. As a result, about 60 markers were employed for georeferencing and scaling all the 3D surveys of the necropolis.
At the end of the survey campaigns, the following results were fulfilled:
- The entire surface of the necropolis was recorded with a photogrammetric approach;
- Only two (t1 and t3) of the four hypogea discovered in 2015 were completely 3D recorded. The other two hypogea (t8 and t9) were surveyed only in their “upper” part, since their excavation was still in progress in 2016;
- 3D data have been used to improve the graphical documentation of the necropolis.
3.3. 3D Data Analysis
By considering the scientific purpose of this survey project, in order to implement the archaeological and topographical documentation of the necropolis, both point clouds and meshes were used to obtain geometrical and graphical information. The availability of three-dimensional and textured data of the whole necropolis, as will be described, allowed for the improvement of the knowledge of this context, as well as the extraction of additional information, using software such as PhotoScan and MeshLab [14]. Combining the photogrammetric data of different years allowed us to observe both the fieldwork progress (from 2014 to 2016) of the eastern part of the area and the state of the art of the excavation itself. Cross-sections from each single grave were extracted by the 3D model using MeshLab. This software was also employed to acquire vector data with the aim of updating the existing versions of the hypogea plans, originally realized with a hand drawing survey. In this case, following the same workflow applied with the vertical sections of the graves, an individual horizontal section of both the hypogea t1 and t3 was extracted (Figure 3b). The textured mesh was also employed to obtain other useful data, such as orthographic images, views, and perspective-sections. For instance, the perspective sections of the hypogea t1 (Figure 3a) illustrates the advantage of applying photogrammetry for archaeological context documentation. In this case, the utility of this geometrical representation, oriented with a specific angle and observed with an orthographic point of view, allows the possibility to better display and comprehend the vertical connection between the tomb and the surface. To better understand the underground development of the hypogea and, as a consequence, to highlight the relationship between these structures and the other graves, the dense cloud of the necropolis was first filtered and then a high quality image of the entire point cloud with an orthographic point of view and a metric grid on the background was created (Figure 4). MeshLab was also employed to inspect the surface of the 3D model. Using a tool which allows for changing the light direction of the scene, two couples of linear marks were recognized on the ceiling of t3 (Figure 5). These marks revealed an unknown phase of the tomb, suggesting a different internal development of the structure between the period of its construction and its last use [15].
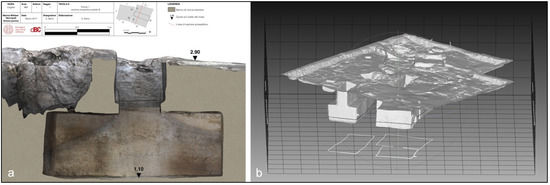
Figure 3.
(a) A perspectival section of the hypogeum t1 that helps in understanding the relationship between the hypogeum, another structure connected with the tomb t1 and the surface. (b) Extraction of two horizontal sections of both the hypogea t1 and t3.
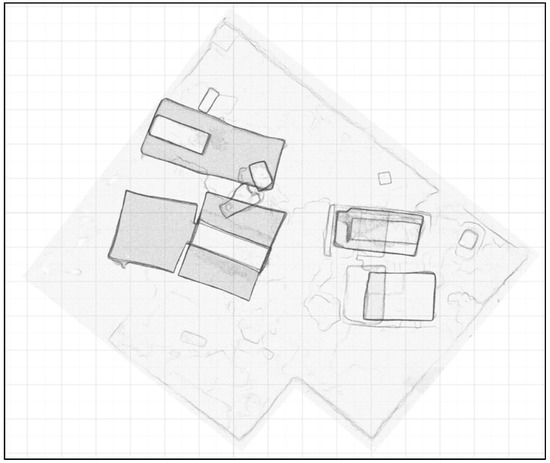
Figure 4.
Orthographic view of the point cloud of the necropolis filtered with the “Poisson disk sample” algorithm of MeshLab. This view suggests the relationship between the hypogea and the tombs on the surface.
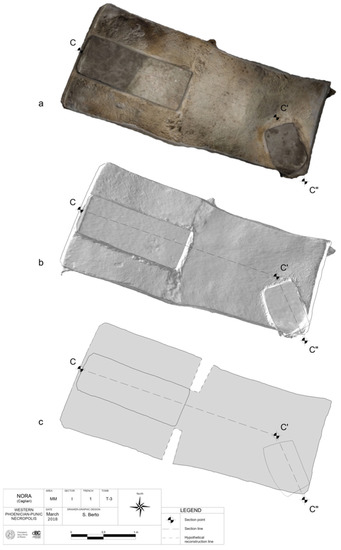
Figure 5.
The observation of the mesh of the hypogeum t1 inside MeshLab (a), by freely changing the orientation of the internal light of the scene (b), helped to identify an unknown phase of the structure (c).
4. Visualizing and Sharing Surveys and Data
4.1. Sharing and Perception Issues
The archaeological context addressed here is a challenging environment, especially from a topographical point of view. The main features of complexity concern the survey phase, described in the previous chapter, as well as the study phase and, finally, the fruition and comprehension stage, especially when they are addressed to amateurs.
The main archaeological evidence is largely hidden, since it is completely embedded in the bedrock. It is arranged in an underground framework that is impossible to grasp from the surface, and equally disorienting even in direct underground exploration. The three-dimensional survey is undoubtedly the best approach to perceive and understand the underground configuration of the necropolis, both in terms of its planimetric distribution and to visualize its vertical underground development. The orientation and depth of pits and chambers can constitute an element of hierarchization and chronological seriation of these structures. Two-dimensional cartography and 2.5D digital models do not make it possible to visualize this vertical complexity, nor to carry out analytical operations on a spatial level. In terms of communication, these findings also represent a challenge for those involved in the dissemination of these archaeological evidence and in making it understood by non-experts. The limited access imposes the use of alternative tools for the fruition of these tombs. In addition, the limited visibility reduces the chance of detecting reference points to imagine the extent and richness of the heritage under the sandstone surface. Moreover, this evidence must be conceived as voids, through a logic of subtraction, making the transposition of the evidence into reality even less immediate. At the research level, the three-dimensional survey represents the main point of reference for consultation and spatial and topographical analyses by the team involved in the study of the necropolis. In particular, the point cloud is considered the most accurate reconstruction phase and the closest to reality. However, a first significant limitation in data sharing within the team is the circulation of different versions, sometimes obsolete, as the excavations progress. A second drawback is induced by the impressive growing size of these models, which weighs on the sharing times (uploads and downloads) and on the viewing fluidity of the local software.
4.2. A Web Solution: The Potree Renderer
In recent years, the trend to migrate services on web browsers has also affected the distribution and display of three-dimensional models. Therefore, the adopted solution for the necropolis, at least for spatial distribution consulting purposes, has been to make the point cloud available through a web renderer, the Potree viewer (Potree’s source code can be downloaded from http://www.potree.org; [16,17]) (Figure 6a,b). One of its main peculiarities is making the navigation of large clouds extremely fluid, and making it accessible through a web browser, specifically on WebGL-enabled web browsers [18]. Moreover, Potree is an open source project, based on Three.js, the WebGL 3D rendering library: this makes it very promising for future and custom developments. The choice has been supported by the 3D Optical Metrology (3DOM) unity of Bruno Kessler Foundation (FBK), whose partnership has been really precious in this phase of the project. Potree’s ability to make large point clouds easily navigable relies on a modifiable nested octree model, which recursively subdivides a unit of space into eight sub-units to store point cloud data and load only those nodes visible from the current point of view. The system is therefore based on the definition of a series of levels of detail, generated for different scales of representation in order to continuously perceive the totality, avoiding the overloading of the entire cloud. This hierarchical structure allows a fast and multi-resolution handling even of large datasets. The point clouds generated by the photogrammetric or scanning survey must therefore be pre-processed on the back end to optimize the rendering performance. The conversion software, PotreeConverter produces the point cloud packages, assembling an HTML template page for the renderer.
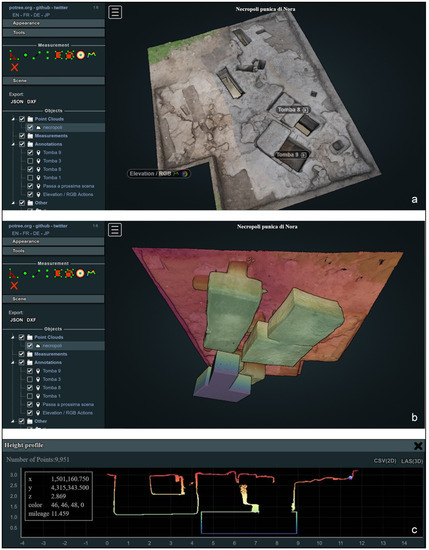
Figure 6.
Two screenshots of Potree’s interface showing the point cloud of the necropolis and the toolbox on the left side: (a) The RGB visualization, including annotations; (b) a different visualization, employing a gradual color ramp to report relative depths. This point of view emphasizes the perception of the underground chambers and of their topology; (c) Potree’s Profile Panel, showing a cross-section captured from the point cloud by means of the web renderer.
First, the web interface provides the navigation of the model and the rapid movement from one piece of evidence to another. The page is supplied with a panel of tools, for quantitative and qualitative purposes. They first operate on rendering options, related to density, point size, and interpolation options. Moreover, they give access to topographic and spatial queries, with the option of obtaining coordinates and heights of each point, and of making linear and volumetric measurements. However, the latter is still a tricky tool to use as it offers little precision, since it is not possible to draw the limits of the desired volume. On the other hand, an essential and extremely useful tool is the one for drawing section lines and obtaining respective cross-sections. These portions of point clouds, as well as being displayed in a special window, can be exported in a dual format, three-dimensional (.las) and two-dimensional (.csv) (Figure 6c). The parcelling of the cloud into smaller units is an interesting opportunity both when working with large surveys and when single portions of the surveys must be displayed without hindrance. The hypogea of the necropolis of Nora constitute individual units whose single visualization allows a better perception of each chamber’s underground spatial development. Thanks to the “clipping” command, the limits of a volume can be defined, in order to cut out the desired portion of the cloud, to limit the visualization. 3D visualizations, combined with the cross-section tool and the volume clipping function are also extremely convenient in stratigraphic interpretation. Overlaps, thicknesses, and stratigraphic relationships can be fairly quickly and accurately checked with this online tool, just as can be done with a desktop software for point cloud management. The clipping tool would require a further step, which is in progress: it consists of the possibility of exporting the defined portion of the cloud. This tool would make Potree an even more valid means of teamwork, acting both as a tool for rapid analysis and as a sort of repository, to be accessed for visualization and export of portions of the cloud, in order to carry out analysis operations locally, with different tools and software.
The project can also make use of an annotation system, achieved through a georeferenced labelling (Figure 6a). The labels offer identification functions, but also access to images and links. Therefore, they are useful both in the study and sharing phase within the research team and in the dissemination phase, marking punctual spots of interest and supporting the semantic enrichment of the model. In the first case, links to the excavation documentation have been attached in order to drive the user to the data contained in the server. The page dedicated to a public use, on the other hand, is equipped with contextual images and video elaborations for dissemination purposes.
The addressed system, proposed for the case study of Nora at the ArcheoFOSS conference in 2019, had already reached a good maturity at that time. In the last two years, it has also become one of the most popular tools in the web distribution of point clouds derived from 3D surveys, both on a commercial and educational level, and it confirms the trend and potentialities presented 2 years ago.
5. Conclusions
The case study of the Phoenician and Punic necropolis of Nora confirms once again the usefulness of managing photogrammetric data for improving the documentation and, also, the interpretation of an archaeological context. In this case:
- Vector data were used to integrate 2D plans of the area or 2D sections of each tomb;
- New perspectival sections were created for hypogea t1 and t3 with two aims: Representing every side of these tombs and better understanding the relationship between these structures and the surface;
- Orthographic views of the point cloud were used to observe the underground development of the hypogea in relation to the other tombs on the surface;
- Orthophotos (for a single tomb or for the whole archaeological context) and heights information (DEM) can be extracted from the 3D model of the necropolis;
- New traces have been identified thanks to the possibility of both excluding the texture information from the model and modifying the orientation of the internal light;
- Sharing tools for a web visualization have been tested (Potree) highlighting the potential of web 3D renderers not only as a browsing tool, but even as an analytical instrument.
Author Contributions
Section 1, S.B. and F.C.; Section 2, S.B., J.B., and F.C.; Section 3.1, S.B. and G.S.; Section 3.2 and Section 3.3, S.B.; Section 4.1, F.C.; Section 4.2, D.M.; Section 5, S.B., J.B., F.C., and G.S. All authors have read and agreed to the published version of the manuscript.
References
- Remondino, F.; Campana, S. 3D Recording and Modelling in Archaeology and Cultural Heritage. Theory and Best Practices; BAR Publishing: Oxford, UK, 2014. [Google Scholar]
- Stylianidis, E.; Remondino, F. 3D Recording, Documentation and Management of Cultural Heritage; Whittles Publishing: Dunbeath, Scotland, 2016. [Google Scholar]
- Guery, J.; Hess, M.; Mathys, A. Digital Techniques for Documenting and Preserving Cultural Heritage; Arc Humanities Press: York, UK, 2017. [Google Scholar]
- Bedford, J. Photogrammetric Application for Cultural Heritage. Guidance for Good Practice; Historic England: Swindon, UK, 2017. [Google Scholar]
- Benavides López, J.A.; Aranda Jiménez, G.; Sánchez Romero, M.; Alarcón García, E.; Fernández Martín, S.; Lozano Medina, A.; Esquivel Guerrero, J.A. 3D modelling in archaeology: The application of Structure from Motion methods to the study of the megalithic necropolis of Panoria (Granada, Spain). J. Archaeol. Sci. Rep. 2016, 10, 495–506. [Google Scholar] [CrossRef]
- Rodríguez Miranda, Á.; Pérez Vidiella, P.; Fernández-Eraso, J.; Mujika-Alustiza, J.A.; Valle Melón, J.M. 3D modelling in the registration and restoration of a megalithic tomb. ISPRS-Int. Arch. Photogramm. Remote Sens. Spat. Inf. Sci. 2017, XLII-5/W1, 297–304. [Google Scholar] [CrossRef] [Green Version]
- Ebolese, D.; Brutto, M.L.; Dardanelli, G. The integrated 3D survey for underground archaeological environment. ISPRS-Int. Arch. Photogramm. Remote Sens. Spat. Inf. Sci. 2019, XLII-2/W9, 311–317. [Google Scholar] [CrossRef] [Green Version]
- Echeverría, E.; Celis, F.; Morales, A.; da Casa, F. The tomb of Ipi: 3D documentation in a middle kingdom theban necropolis (Egypt, 2000 BCE). ISPRS-Int. Arch. Photogramm. Remote Sens. Spat. Inf. Sci. 2019, XLII-2/W9, 319–324. [Google Scholar] [CrossRef] [Green Version]
- Nicastro, G.; Puma, P. Virtual heritage for the dissemination of the Baratti in 3D project. ISPRS-Int. Arch. Photogramm. Remote Sens. Spat. Inf. Sci. 2019, XLII-2/W9, 529–534. [Google Scholar] [CrossRef] [Green Version]
- Bonetto, J.; Bejor, G.; Bondì, S.F.; Giannattasio, B.M.; Giuman, M.; Tronchetti, C. Nora. In Sardegna Archeologica, Guide e Itinerari; IBS: Sassari, Italy, 2018; ISBN 9788893611169. (In Italian) [Google Scholar]
- Deiana, R.; Bonetto, J.; Mazzariol, A. Integrated Electrical Resistivity Tomography and Ground Penetrating Radar Measurements Applied to Tomb Detection. Surv. Geophys. 2018, 39, 1081–1105. [Google Scholar] [CrossRef]
- Bonetto, J.; Andreatta, C.; Berto, S.; Bison, L.; Bridi, E.; Covolan, M.; Dilaria, S.; Mazzariol, A.; Ranzato, M. La necropoli fenicio-punica e le infrastrutture romane nell’area della ex Base della Marina Militare. Quaderni Norensi 2017, 6, 169–188. [Google Scholar] [CrossRef]
- Agisoft PhotoScan Professional Edition (Now Agisoft Metashape Professional Edition). 2021. Available online: https://www.agisoft.com (accessed on 29 November 2021).
- Cignoni, P.; Callieri, M.; Corsini, M.; Dellepiane, M.; Ganovelli, F.; Ranzuglia, G. MeshLab: An Open-Source Mesh Processing Tool. In Proceedings of the Sixth Eurographics Italian Chapter Conference, Salerno, Italy, 2–4 July 2008; Scarano, V., De Chiara, R., Erra, U., Eds.; Eurographics Association: Geneve, Switzerland, 2008; pp. 129–136. [Google Scholar]
- Berto, S.; Dilaria, S. La tomba 3. Approccio multidisciplinare per lo studio dell’ipogeo. Quaderni Norensi 2018, 7, 141–148. [Google Scholar] [CrossRef]
- Potree. 2021. Available online: http://www.potree.org/ (accessed on 29 November 2021).
- Schuetz, M. Potree: Rendering Large Point Clouds in Web Browsers. Diploma Thesis, Technische Universität Wien, Vienna, Austria, 2016. Available online: https://publik.tuwien.ac.at/files/publik_252607.pdf (accessed on 29 November 2021).
- WebGL. 2021. Available online: https://www.khronos.org/webgl/ (accessed on 29 November 2021).
Publisher’s Note: MDPI stays neutral with regard to jurisdictional claims in published maps and institutional affiliations. |
© 2021 by the authors. Licensee MDPI, Basel, Switzerland. This article is an open access article distributed under the terms and conditions of the Creative Commons Attribution (CC BY) license (https://creativecommons.org/licenses/by/4.0/).