Abstract
Field capacity (FC) and permanent wilting point (PWP) thresholds are critical parameters in climate-smart agriculture because they directly relate to soil water availability, which is essential for optimizing water use, improving crop yields, and ensuring resilience against climate variability. Using the continuous mosaic of SoilGrids data, pedotransfer functions based on bulk density, clay content, and sand content were applied to estimate the threshold values of FC and PWP across Mexico utilizing random forest (RF) algorithms. The selection of these parameters was based on their positive contribution to the model’s prediction: bulk density (0.51), clay content (0.21), and sand content (0.16). Soil organic carbon (SOC) contributed negatively; this negative importance score warrants careful interpretation. The 30–60 cm depth was chosen based on the assumption that it is reasonably uniform across other depths and lies below the highly variable surface horizon, which is strongly influenced by management practices and organic matter dynamics. Here we address key technical and scientific critiques regarding the use of SoilGrids for generating FC and PWP data. Additionally, the relevant role of FC and PWP thresholds in the context of climate-smart agriculture is highlighted, from the calculation of available soil water to their role in achieving sustainable development goals.
1. Introduction
Water is a fundamental resource for all life forms and is essential for the functioning of terrestrial ecosystems and agricultural productivity that depend on the complex cycle of continuous movement of water between the Earth and the atmosphere [1]. The ability of soil to retain and supply water to plants is determined by key physical and chemical properties, particularly soil texture, bulk density, and organic matter content. These properties influence the soil water retention capacity, a critical factor in determining how much water is available to plants, especially during periods of limited precipitation.
Two key hydraulic thresholds govern the concept of plant-available water (PAW): field capacity (FC) and permanent wilting point (PWP). PWP defines the lower limit of available water—the point at which water is held so tightly by soil particles that plants can no longer extract it, leading to irreversible wilting—while FC refers to the maximum amount of water that soil can retain after excess water has drained under gravity, representing the upper limit of water availability for plant uptake [2]. The difference between FC and PWP represents the volume of water in the soil that is accessible to plants and is crucial for understanding ecosystem functioning and improving water use efficiency in agriculture [3].
Despite their importance, the accurate measurement of FC and PWP in the field is labor-intensive, time-consuming, and often cost-prohibitive, particularly at large spatial scales [4]. To overcome these limitations, researchers have developed pedotransfer functions (PTFs)—empirical models that estimate difficult-to-measure soil hydraulic properties based on more readily available data, such as soil texture (percentages of sand, silt, and clay), bulk density, and organic matter or organic carbon content. These functions serve as essential tools in large-scale hydrological modeling and agricultural decision-making.
Pedotransfer functions (PTFs) are equations that use basic soil attributes, such as soil texture and soil bulk density, which are easier to measure, to predict those that are harder to determine, such as soil hydraulic parameters, for modeling relevant earth system processes [5]. Traditionally, PTFs have relied on linear or semi-empirical models. However, the growing availability of large soil datasets and advances in artificial intelligence (AI) have opened the door to more sophisticated modeling techniques. In particular, machine-learning algorithms such as random forests (RFs) have demonstrated significant potential in capturing the complex, nonlinear interactions between soil variables that govern hydraulic behavior. These models are capable of handling high-dimensional data and can improve the accuracy and generalizability of PTFs.
In parallel, the emergence of global soil databases such as SoilGrids (https://soilgrids.org/ (accessed on 23 June 2023)) has provided standardized, high-resolution soil property data across multiple depths and regions. These datasets did not replace direct measurement, such as in situ soil sampling [6]. Various efforts have been made to improve the performance of PTFs, such as the inclusion of novel soil hydrology-related predictors [7], topographic and land use features [8], and localized predictors [9]. Different statistical approaches, including regression techniques [10], machine learning methods [11], and neural networks [12], have been used to enhance the performance of soil moisture modeling [13]. Through the combination of soil parameters with machine learning models, spatially explicit predictions of soil hydraulic predictions can be generated. This integration is especially valuable in countries like Mexico, which exhibit high environmental heterogeneity due to diverse geological formations, climatic zones, and land use patterns. Topographical features such as curvature, slope, and upslope area influence the hydrological conditions of a location and generate different soil moisture conditions and flow patterns [14]. From the volcanic soils of the south to the arid and semi-arid regions of the north, Mexican soils vary significantly in their ability to retain and supply water to plants. As such, there is a pressing need for accurate, scalable tools to assess soil water retention properties across this diverse landscape.
This study evaluates the performance of a random forest-based pedotransfer function for predicting FC and PWP from soil texture (sand and clay content) and bulk density, using input data derived from the SoilGrids database. It further assesses the model’s generalizability across Mexico’s edaphoclimatic heterogeneity, considering the spatial variability introduced by diverse soil types, climatic regimes, and land use patterns. Additionally, the research examines the model’s capacity to produce high-resolution, spatially explicit estimates of soil hydraulic properties that can support large-scale hydrological modeling, precision agriculture, and water resource management.
2. Materials and Methods
2.1. Soil Data Origin
This study uses soil data from SoilGrids 2.0, a global digital soil mapping system developed by ISRIC—World Soil Information. SoilGrids provides global soil property maps at medium spatial resolution (250 m cell size), generated using state-of-the-art machine learning models based on approximately 240,000 soil observations and more than 400 environmental covariates describing vegetation, terrain morphology, land cover, remote sensing products [15,16], climate, geology, and hydrology. Extended information is available at https://soilgrids.org/ (accessed on 23 June 2023).
The outputs of SoilGrids consist of gridded maps of key soil properties—including bulk density, clay content, and sand content—at six standardized depth intervals (0–5, 5–15, 15–30, 30–60, 60–100, and 100–200 cm), with a spatial resolution of 250 m. All maps are provided in raster format and are publicly accessible under the Creative Commons CC-BY 4.0 license [15].
2.2. Data Preparation
For this analysis, three soil predictors were extracted from SoilGrids at the 30–60 cm depth interval:
- Soil bulk density (g/cm3);
- Clay content (%). Fraction of particles < 0.002 mm;
- Sand content (%). Fraction of particles > 0.05 mm.
Raster mosaics were created using the merge function in QGIS to generate seamless national coverage of Mexico for each variable. These variables served as inputs to the PTFs used to estimate FC and PWP. The target hydraulic properties were calculated using empirical PTFs derived from the established literature, relating soil texture and bulk density to FC and PWP values. PTFs are empirical or semi-empirical models used to estimate FC and PWP based on easily measurable soil properties. Traditional empirical models are often based on regression techniques that utilize soil texture and other relevant properties. In contrast, RF and other machine learning (ML) algorithms can serve as highly accurate pedotransfer functions (PTFs), particularly when trained on sufficiently large and high-quality datasets. The capacity to integrate both traditional and ML approaches enhances their effectiveness—employing RF as robust PTFs or as components within ensemble modeling frameworks.
RFs are particularly well-suited for this purpose because they can effectively model nonlinear relationships, handle high-dimensional data, exhibit robustness against overfitting when appropriately tuned, and provide measures of variable importance.
Furthermore, partitioning the dataset into training and testing subsets (e.g., 80% and 20%, respectively) and utilizing soil parameter datasets to predict FC and PWP thresholds—while evaluating model performance through metrics such as determination coefficient (R2), Mean Absolute Error (MAE), and Root Mean Squared Error (RMSE)—strengthens the application of trained RF models. Such models can then be employed to predict FC and PWP across extensive spatial domains where field soil samples are unavailable.
2.3. Gather Input Data
Through the merge module, raster image mosaics were obtained for each of the obligate pedogenic functions. These were soil bulk density, measured in g/cm3, clay content (%)—fraction of soil particles <0.002 mm diameter—and sand content (%)—fraction of soil particles >0.05 mm diameter. The calculation precepts were obtained from pedotransfer equations that calculate soil hydraulic properties from soil texture, bulk density, and soil organic carbon—SOC (Figure 1).
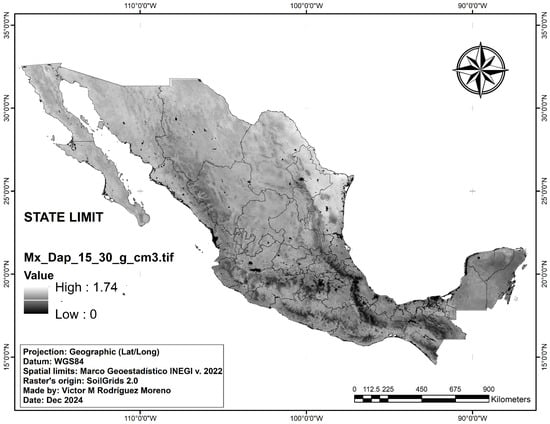
Figure 1.
Sample mosaic of raster images. The coverage of the Mexico domain is the same for all available depths. Figure 1 shows a single variable at a depth—bulk density (g/cm3) at a depth of 15–30 cm. All mosaics for each variable at each depth were obtained separately using the pedotransfer function (bulk density, sand content, and clay content). PTFs relate the physical and textural properties of the soil to estimate FC and PWP. These equations are empirically derived and vary depending on the dataset and region.
2.4. Machine Learning Model—Random Forest Algorithm
The RF algorithm, a popular machine learning technique, constructs multiple decision trees during training and outputs the mode of the classes or the mean prediction of the individual trees [17]. This ensemble learning method is robust and effective in handling large datasets, making it suitable for yield estimation tasks [18]. It demonstrates increased efficiency when dealing with large-scale datasets and complex models. (1) Traditional empirical models are often based on regression models using soil texture and other properties. (2) RF and other ML models can serve as highly accurate PTFs, especially when trained on sufficient, high-quality datasets. (3) Combining traditional and machine learning approaches can also be effective, using RF as a robust PTF or as part of an ensemble.
RFs are well-suited as PTFs because they can handle nonlinear relationships, manage high-dimensional data, are robust to overfitting with proper tuning, and provide variable importance metrics.
There is not a strict universal minimum sample size for RF, but generally, more data leads to better model performance. RF can handle small to large datasets, but very small datasets (e.g., fewer than 50 samples) may not provide enough information for reliable modeling. In our understanding of soil property predictions, a commonly suggested minimum is at least one hundred samples, especially when considering multiple predictors and complex relationships. In practice, if the dataset has fewer than 50 samples, model stability and importance metrics may be unreliable. With 100–200 samples, one can often obtain meaningful results, but this depends on data variability and complexity.
Soil water retention at FC and PWP was predicted using RF models with soil texture fractions (sand, silt, clay), soil organic carbon (SOC), pH(H2O), and cation exchange capacity (CEC) as predictors. To ensure robust model evaluation and avoid dependence on a single random data partition, model performance was assessed using repeated random train–test splits. In each repetition, the dataset was randomly divided into training (e.g., 80%) and testing (20%) subsets, the RF model was trained on the training data, and predictions were generated for the independent test set. Model accuracy was quantified using RMSE and MAE. Final model performance was summarized as the mean and standard deviation of these metrics across repetitions, and the reported results represent the average behavior of the model rather than performance from a single split. This procedure reduces sensitivity to random data partitioning and provides a more reliable assessment of model generalization.
The algorithm follows the gradient-boosting approach by iteratively training a series of weak learners (typically decision trees) to correct the residuals from the previous iteration.
The modeling pipeline was implemented using Python 3.12.4 with key libraries including scikit-learn, pandas, and numpy. The process included the following steps (see Figure 2 for flowchart):
- Loading the dataset.
- Defining input and target variables:
- ○
- Inputs (X). Bulk density, clay, and sand;
- ○
- Targets (y). FC and PWP, separately.
- Splitting the data into training (80%) and testing (20%) sets.
- Training the model with 100 trees (n_estimators = 100) and a fixed seed (random_state = 42).
- Generating predictions on the test set.
- Evaluating model performance using regression metrics.

Figure 2.
Workflow of the RF modeling approach used to predict soil water retention at FC and PWP. Input variables (sand, silt, clay, soil organic carbon, pH(H2O), and cation exchange capacity) were used to train RF models. Model performance was evaluated using repeated random train–test splits, in which the dataset was randomly partitioned into training and testing subsets, models were trained on the training data, and predictions were assessed on the independent test data using RMSE and MAE. Final performance metrics represent averages across repetitions, providing a robust assessment of model generalization independent of any single data split.
RF uses bagging (bootstrap aggregating), which means that each tree is trained on a bootstrap sample (random sample with replacement). Trees are grown independently and their predictions are aggregated (majority vote or mean). There is no sequential learning, and trees do not correct each other’s errors. In our operational scenario and with limited computing resources, this study assumes two essential premises: First, with very large datasets, high-dimensional predictors, or limited resources, exhaustive tuning may be impractical. Second, using default parameters and minimal tuning (e.g., just n_estimators) might be acceptable. When default hyperparameters already perform close to optimal, they provide stability and have relatively low sensitivity to some hyperparameters.
For many tabular datasets, defaults (particularly in scikit-learn) produce performance near the tuned optimum. Thus, intensive tuning adds little value.
2.5. Model Evaluation Metrics
To evaluate the performance on the model, the RMSE, the MAE, and determination coefficient were interpreted. RMSE should ideally be smaller than 10% of the mean target value for high accuracy. MAE is typically smaller than RMSE and should fall within 5–10% of the target variable’s mean Equation (1).
RMSE values below 10% are commonly interpreted in environmental and soil modeling studies as indicating good to very good predictive performance. This threshold is used as a practical benchmark rather than a strict criterion, and model performance should be interpreted in the context of data uncertainty and study objectives. In environmental and soil modeling applications, relative RMSE values below approximately 10% are commonly interpreted as indicative of very good predictive performance, particularly for soil hydraulic properties that are characterized by high spatial variability and measurement uncertainty. Given the ensemble nature of RF models and the inherent heterogeneity of soil systems, achieving RMSE values within this range suggests that the dominant controls on FC and PWP are effectively captured while maintaining robust and stable predictions. The trained models also provide feature importance scores, offering insight into the relative contribution of each predictor to the estimation of FC and PWP. Equations (2) and (3) show the inter-varietal relationship of soil variables for calculating the FC index value.
3. Results
Based on the feature importance scores of seven soil parameters, bulk density (0.51), clay content (0.21), and sand content (0.16) have positive importance. These values indicate that these features are the most influential in predicting soil FC and PWP thresholds. The highest importance is of bulk density, suggesting that it has the strongest influence among the features. Clay content and sand content also significantly contribute. Other soil parameters such as pH, CEC—Cation Exchange Capacity—coarse fragments, and SOC result in negative importance. The negative importance scores for pH, CEC, coarse fragments, and SOC suggest that these features have an inverse or less straightforward relationship with the predictions, or that their influence reduces the predicted values in some contexts.
3.1. FC Equation
SoilGrids provides soil properties for six standard depth intervals. In this study, we selected the 30–60 cm layer as a representative subsurface depth for model development. This layer lies below the highly variable surface horizon, which is strongly influenced by management practices and organic matter dynamics while remaining within the effective rooting zone of many agricultural and natural vegetation systems. Hydraulic properties at this depth tend to be more stable and less affected by short-term disturbances, making it suitable for large-scale modeling.
We acknowledge that soil properties and their relationships with predictors vary with depth, and that a single depth cannot fully represent vertical heterogeneity. However, incorporating all depth layers would substantially increase model complexity and data dimensionality without corresponding improvements in predictive reliability given current data uncertainty. The 30–60 cm layer therefore represents a pragmatic compromise that balances physical relevance, data stability, and computational efficiency for national-scale estimation of FC and PWP.
From Equation (2), its components can be broken down as follows: R2 = 0.78; MAE = 0.063; RMSE = 0.009. Ref. [15] desegregate the elements of the equation as: intercept (0.7919) represents the reference FC when the other variables (clay, sand, and bulk density) are at zero. This is a calibration constant obtained from a regression model. The clay content (0.001691) indicates the contribution of clay particles to the water-holding capacity of the soil. Clay has very fine particles that create small pores that hold water against gravity. The bulk density (0.29619) reflects the inverse relationship between bulk density and FC. Higher bulk density implies more compaction and less pore space for water storage. The sand content squared (−0.000001491) captures the nonlinear effect of sand on FC. Sandy soils, with large particles and macropores, drain quickly. The squared term adjusts for the decreasing effects of sand at very high proportions.
3.2. PWP Equation
The PWP was estimated using a regression equation, providing a predictive, data-driven approximation of soil moisture conditions under which plants can no longer extract water.
An explanation of Equation (3) was described by [15], its components can be broken down as follows: R2 = 0.63; MAE = 0.051: RMSE = 0.05. Intercept (0.15) represents the reference PWP when the other variables (clay and sand) are at zero. Like FC, it is a constant derived from the regression. Clay content (0.0038) represents the contribution of clay particles to water retention at the PWP. Clay strongly retains water, making it unavailable to plants. Sand content (0.0029) indicates the negative impact of sand on soil water retention at the PWP. Sandy soils retain very little water at low moisture levels. Sand content squared (0.0000034) adjusts for the nonlinear effect of sand. At very high sand proportions, this term accounts for the marginal increase in water retention due to finer sand particles. Clay content squared (−0.0000035) reflects the decreasing effect of clay on water retention at very high clay content. Excess clay can reduce water availability due to compaction and water binding.
From Equations (2) and (3), clay has a smaller coefficient in FC (0.001691) than in PWP (0.0038), reflecting its greater role in retaining water tightly at lower moisture levels. The bulk density was included only in FC, as it primarily affects the soil’s ability to hold water against gravity. Both equations include quadratic terms, but the signs and magnitudes differ, indicating different impacts of sand and clay at higher proportions.
On Figure 3, the relationship between observed FC (left) and PWP (right) values derived from PTFs is represented.
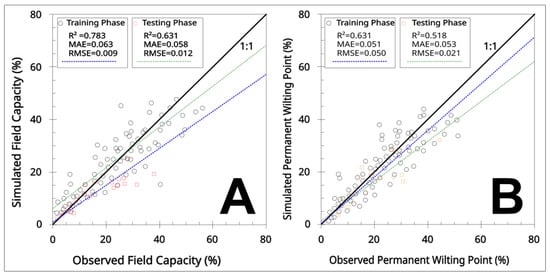
Figure 3.
The black line represents the 1:1 identity line—the ideal scenario where the predicted values perfectly match the observed values. (A) is for FC whilst (B) stands for PWP. On both scatterplots, every point lying exactly on this line indicates a perfect prediction for that data point and it suggests the accuracy of the model’s predictions.
From Figure 3, sample points are from depths of 30 to 60 cm. A light underprediction on both runs is observed. However, the closeness of the points to the identity line is evident of a good model’s performance.
3.3. Output Raster Images
The presented raster datasets of Figure 4 and Figure 5 delineate the spatial distribution of soil water retention properties—specifically, field capacity (FC) and permanent wilting point (PWP)—at a spatial resolution of 250 m. These maps were generated through the application of pedotransfer functions (PTFs) derived from soil texture parameters obtained from SoilGrids.org.
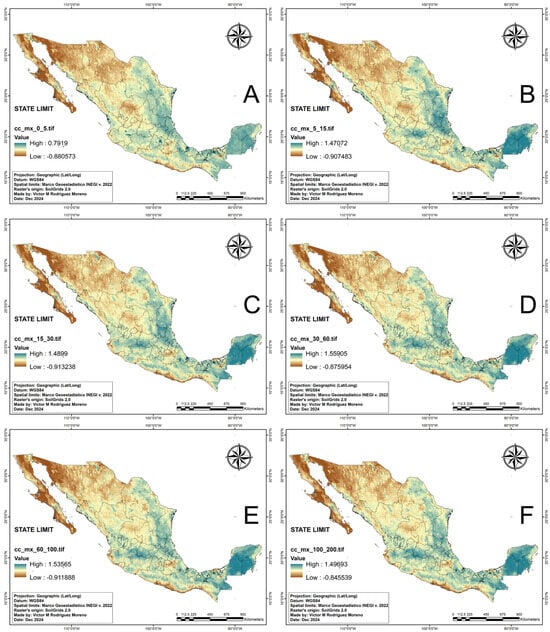
Figure 4.
FC output images. Images from upper left to bottom right (A–F) each correspond with one depth: 0–5, 5–15, 15–30, 30–60, 60–100, and 100–200 cm, respectively. Color gradient indicates increasing values of the mapped variable from low to high.
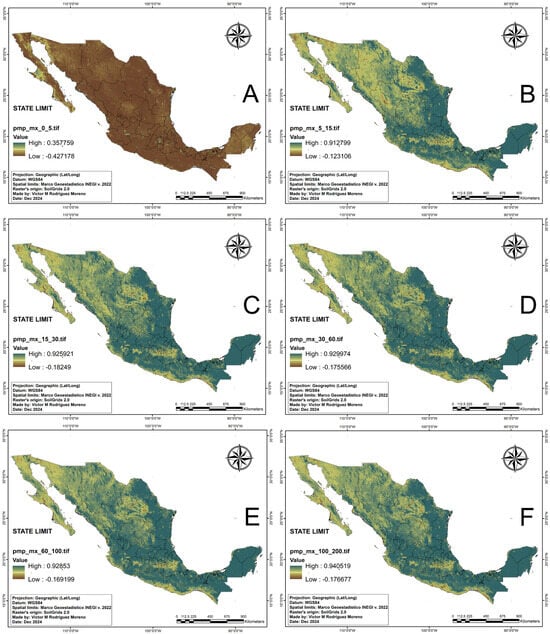
Figure 5.
PWP output images. Images from upper left to bottom right (A–F) each correspond with one depth: 0–5, 5–15, 15–30, 30–60, 60–100, and 100–200 cm.
The underlying soil texture data, consisting of six raster layers representing different depth intervals, were processed using random forest algorithms to establish predictive relationships between soil texture attributes and soil water retention characteristics. The resulting raster maps provide continuous, gridded estimates of field capacity and permanent wilting point across the study area, facilitating spatial analysis of soil moisture availability.
The datasets are formatted as georeferenced raster layers, with each cell representing an estimated volumetric water content (cm3/cm3) at the respective soil moisture threshold, suitable for hydrological and agronomic modeling applications. The high-resolution spatial data enable detailed spatial variability assessment of soil water retention properties essential for precision agriculture and environmental management.
The files have a spatial resolution of 250 m and weigh 503 Mbyte each. The volume represents individual files of 321,193,808 registers. The dataset weighs ~5.89 Gbyte (3854.325 M of data).
4. Discussion
The development of spatially explicit maps of FC and PWP provides valuable insights into soil water retention characteristics across diverse landscapes. These maps, derived from soil texture data through machine learning-based pedotransfer functions, demonstrate the potential of integrating advanced predictive models with soil data to enhance our understanding of soil moisture dynamics.
Compared with commonly used pedotransfer functions for FC and PWP, including analytical formulations [19] and other machine-learning-based approaches [4,20], the RF framework adds value by simplifying model structure and reducing reliance on predefined functional forms and explicit parameter calibration, while flexibly capturing nonlinear interactions among soil properties.
The results underscore the importance of accurate soil property estimation for various environmental and agricultural applications. Improved mapping of these parameters can lead to better hydrological modeling, more efficient irrigation strategies, and more informed land management decisions. Additionally, the high-resolution spatial information generated through this approach offers opportunities to refine climate and water cycle models, particularly in regions where traditional soil data may be sparse or outdated.
Methodologically, leveraging machine learning techniques such as RF algorithms highlights the capacity of data-driven approaches to address complex soil property predictions. This opens avenues for further research into scaling these techniques and integrating additional soil and environmental variables to improve predictive accuracy. Overall, the study advances the potential for remote sensing and machine learning to contribute meaningfully to soil science and environmental management. The advent of global geospatial data has become integral to modern environmental research. Remote sensing has evolved from basic aerial photography to high-resolution multispectral and hyperspectral data captured by satellites, UAVs, and ground sensors [21]. These technologies support applications such as deforestation monitoring, urban planning, agriculture, and disaster prediction, but their accuracy heavily depends on the quality of in situ ground data.
Advancements in data modeling and computational architectures—exemplified by tools like SoilGrids—facilitate large-scale soil property mapping. However, their effectiveness at local levels can be limited by regional variability and data scarcity, particularly in developing countries like Mexico. These techniques face limitations, such as the assumption of spatial stationarity and a sensitivity to data quality and distribution [22]. SoilGrids has been developed using global datasets; while useful for broad-scale studies, its application in local conditions may not always yield accurate results [23]. Ensuring reliable outputs requires careful input data selection, covariate management, and appropriate training protocols.
Estimations of key hydrological properties like FC and PWP are crucial for water resource management, hydrological modeling, and sustainable land use, especially given the challenges of direct measurement. These model-based approaches offer valuable insights for improving agricultural productivity, climate resilience, and environmental sustainability, despite some inherent limitations. Given the uncertainty associated with pedotransfer-derived FC and PWP estimates, the reported R2 values should be interpreted as indicators of pattern consistency rather than absolute predictive accuracy. Future research should aim to expand the use of machine learning models and improve prediction accuracy to better support soil and agricultural system management.
It is essential, however, to account for factors such as input data quality, covariate selection, and appropriate model training to ensure dependable outputs. FC and PWP are fundamental hydrological properties that assess water availability within soils, rather than direct measures of soil health [24]. They have broad implications for hydrological modeling, irrigation planning, and sustainable land management [ibidem]. Given the logistical and technical challenges of direct measurement, model-based estimations represent a necessary alternative, relying on underlying assumptions that have played a pivotal role in data modeling. The utilization of the PTFs based on the basic soil propertied is an alternative, fast, cost-effective, and applicable approach for the prediction of FC and PWP [25].
The approach of this study, where the upper and lower threshold values of soil moisture retention capacity are generated using soil texture data (sand and clay content) and bulk density, is—in essence—a robust option where pedogenic transfer functions are applied. Multiple linear regression (MLR) models for θFC, θPWP, and AWC were fit to the training dataset using sand, clay, and SOM, which are the most widely used to develop MLR pedotransfer functions for θFC and θPWP [26,27]. For θFC and AWC, MLR models included coefficients for sand, clay, SOM, sand x clay, sand x SOM, and clay x SOM [4]. An unexpected finding emerged when some soil parameters were excluded from the PTFs model, notably the negative importance attributed to SOC. Typically, SOC enhances water retention by increasing porosity and water-holding capacity, suggesting a positive contribution to soil moisture dynamics. A negative importance score warrants careful interpretation. It may indicate issues such as multicollinearity, where SOC values correlates highly with other variables, causing the model to diminish its significance. Alternatively, limited variation or estimation errors within the SOC dataset could result in unreliable importance estimates. If the ground soil data were relatively uniform or sparse across the study area, SOC’s influence may not have been adequately captured. This counterintuitive result underscores the importance of thorough data quality assessment and consideration of potential confounding factors when interpreting model outputs.
Unfortunately, there are no samples of SOC to address its negative contribution. This is actually a fairly common outcome in data-driven pedotransfer work—especially with SoilGrids + RF. It does not automatically mean the model is wrong or that physics has been violated. A “negative contribution result” is different to “SOC reduces water holding”. In RF, a negative SHAP—SHapley Additive exPlanations)—value/variable importance contribution means that, given the other predictors already in the model, higher SOC is associated with lower predicted FC or PWP in that part of the feature space.
That is very different from saying SOC physically reduces water retention. We embraced that SOC’s effect is conditional, not universal. On the other hand, a strong collinearity in SoilGrids is the main culprit; SOC is not independent of clay content, CEC, pH, depth, and climate/biome (implicitly baked into SOC). High SOC occurs in coarse-textured, organic-rich soils (e.g., forest topsoils, Andisols, Podzols); clay and CEC already explain most of the microporosity. Therefore, the RF learns something like, “If clay and CEC are already known, extra SOC often signals lighter texture or structured macroporosity, not more plant-available water.” This leads to negative conditional importance. Further investigation into regional variability and soil parameter relationships could provide deeper insights into SOC’s role and improve future model robustness.
4.1. Advantages of SoilGrids Data
- SoilGrids provides globally consistent soil property estimates at a spatial resolution of 250 m resolution, making it suitable for regional and national-scale analyses, especially in data-scarce regions. Its open-access nature enables widespread use by researchers, practitioners, and policymakers, particularly where resources for conducting conventional soil surveys are limited.
- By eliminating the need for extensive field sampling and laboratory analysis, SoilGrids significantly reduces costs and time associated with large-scale soil data acquisition. This advantage is particularly relevant for climate vulnerability assessments, agricultural planning, and water resource management.
- Standardized modeling across regions ensures data comparability, supporting robust global and regional studies of soil properties and land use impacts. The dataset’s further promotes transparency, knowledge sharing, and democratization of scientific research. Estimates of FC and PWP derived from SoilGrids serve as critical inputs for hydrological, agricultural, and ecological models, aiding in climate change evaluations and adaptation strategies.
4.2. Disadvantages of SoilGrids Data
- Despite its advantages, SoilGrids has inherent limitations. Predictions are based on ML algorithms trained on existing soil profile databases, which may introduce biases in regions with sparse, outdated, or unrepresentative data. This can reduce accuracy in FC and PWP estimations locally.
- SoilGrids is limited to a set of essential variables (e.g., bulk density and texture fractions) and does not include key properties such as organic matter (OM), soil structure, or salinity. Consequently, PTFs relying solely on these inputs may oversimplify complex soil–water relationships, reducing predictive reliability.
- The 250 m spatial resolution may be insufficient for capturing fine-scale heterogeneity relevant to local-scale studies or precision agriculture. Additionally, the dataset provides static representation that do not reflect temporal dynamics driven by land use change, climatic variability, or management practices. This limits its applicability for long-term monitoring or dynamic modeling efforts.
- SoilGrids primarily uses variables like soil texture, pH, and organic carbon, but often lacks detailed information on OM, mineralogy, or biological activity—factors that influence water retention. For example, in organic-rich soils, the absence of OM data can lead to underestimation of water retention capacity [27]. Without accounting for these dynamic factors, estimates may be less reliable in soils where OM significantly influences water retention. Uncertainty quantification in SoilGrids is often limited or insufficiently transparent, complicating the assessment of prediction reliability. Many PTFs used to derive hydraulic properties rely on simplified relationships that may fail to capture nonlinear interactions leading to systematic errors. Additionally, most soil systems are not represented in PTFs, which often ignore the effects of parent material, vegetation, land use, and climate. The divergence between the scales of derivation and application further campers accuracy. A previous study found that the accuracy of PTFs for estimating soil water content at FC is highly dependent on soil tension [28].
4.3. Scientific Critique
The limited availability of ground-truth measurements for FC and PWP poses a significant challenge for validating SoilGrids-derived estimates. While providing a valuable resource at the global-scale, its effectiveness diminishes where site-specific precision is required—particularly in heterogeneous regions or complex soils. Integrating SoilGrids predictions with locally acquired data through systematic sampling and harmonized databases could improve calibration and validation efforts.
Although SoilGrids excels in macro-scale assessments, it is less suited for high-resolution applications such as precision farming or localized hydrological modeling where reliance solely on global predictions may cause misleading inferences. Downscaling techniques that incorporate high-resolution terrain, vegetation, and climate data could enhance spatial fidelity.
Current PTFs used to estimate FC and PWP often rely on simple empirical relationships that lack the capacity to capture complex, nonlinear soil–water interactions. They also lack mechanistic understanding, limiting their interpretability and generalizability of across diverse landscapes. Advances in ML—such as artificial neural networks (ANNs), gradient boosting support vector machines (SVMs), and deep learning—offer promising alternatives [20]. These models can handle complex nonlinear relationships and often outperform traditional regression-based approaches [29]. Hyperparameter tuning can further optimize model performance, although the current models already show satisfactory results.
Despite their predictive strength, data-driven models often act as black boxes, lacking physical predictability interpretability. Hybrid models that combine ML with process-based or physics-informed frameworks could address this limitation, ensuring prediction remains consistent with the soil hydrological process. Developing region-specific or site-specific PTFs, trained on local data, can also improve relevance and accuracy—particularly in areas with strong environmental gradients.
In perspective, while SoilGrids is a valuable tool for broad-scale soil analysis, its limitations warrant cautious application—especially for high-resolution or site-specific purposes. Future efforts should focus on integrating global datasets with local measurements, employing advanced ML and hybrid models, and developing regionally tailored approaches. These strategies will enhance model accuracy, robustness, and scientific understanding of soil–water processes across scales.
4.4. FC and PWP in Climate-Smart Agriculture
FC and PWP are fundamental thresholds that define plant-available water capacity (PAWC), a key factor in climate-smart agriculture (CSA). These parameters are vital for optimizing water use, supporting climate adaptation, and enhancing resilience in agricultural systems. As climate variability increases—with more frequent droughts and irregular rainfall—precise soil water management becomes ever more critical.
FC and PWP inform irrigation scheduling by delineating the upper and lower bounds of accessible water for crops. Accurate estimates guide critical decisions such as irrigation timing, quantity, sowing dates, and crop water requirements at various phenological stages. Efficient irrigation—guided by reliable FC and PWP data—can boost productivity, reduce water waste, and mitigate groundwater overexploitation, especially in water-scarce regions.
In areas affected by climate change, integrating precision irrigation tools, soil moisture sensors, remote sensing, and machine learning-based decision systems allows for dynamic water management. Maintaining soil moisture above PWP helps sustain crop viability during droughts. These strategies support adaptive land use planning, including agroforestry and drought-tolerant cropping, based on soil water capacity.
Moreover, strategies to enhance FC and reduce PWP—such as organic amendments, mulching, cover cropping, and conservation tillage—can improve soil structure, infiltration, and water retention. Conservation tillage practices, including no-till, strip-till, and mulch-till, have gained prominence as sustainable agriculture methods to mitigate soil degradation and improve water infiltration [30]. Restoring soil hydrological function through reforestation or soil rehabilitation is also essential in degraded soils. Understanding soil water thresholds aids plant breeding efforts, enabling the development of drought-tolerant varieties suited to soils with limited PAWC.
Hydrological models incorporating FC and PWP can project future water availability under climate scenarios, informing long-term planning [31]. Remote sensing products, including satellite-based soil moisture datasets, support broader-scale validation through correlation with ground observations. Hydrological models such as HYDRUS or SWAT can simulate local soil moisture dynamics, enabling comparison of modeled outputs with predicted thresholds. Soil organic matter (SOM) plays a vital role in increasing FC through aggregation and porosity; thus, building SOM via sustainable practices supports both water retention and carbon sequestration, aligning with climate mitigation goals.
Integrating FC and PWP data into digital platforms, early warning systems, and geospatial mapping enhances drought prediction, risk management, and regional planning. These soil water parameters serve as foundational indicators that bridge soil science, agronomy, and climate resilience, informing policy and practice.
In summary, the systematic collection and application of FC and PWP are crucial for advancing climate-smart agriculture. Future research should aim to improve data resolution, develop integrated models, and validate estimates through field measurements, ultimately fostering sustainable and resilient agricultural systems in Mexico and beyond. Conducting in situ field measurements across various soil types and land uses using tools like tensiometers—TDR—or capacitance sensors allows for direct comparison of observed soil moisture levels with the predicted thresholds. Complementing this, gravimetric soil sampling in the laboratory provides empirical moisture content data that can be correlated with the SoilGrids estimates. Installing lysimeters enables monitoring of water movement and retention in natural conditions, offering further validation by relating lysimeters data to the calculated thresholds. Laboratory experiments with intact soil cores can establish detailed water retention curves, providing a benchmark to compare against the SoilGrids-based values. Remote sensing techniques, such as satellite-derived soil moisture products, can be used to validate the thresholds over larger areas by correlating satellite data with ground measurements. Hydrological modeling tools like HYDRUS or SWAT can simulate soil moisture dynamics based on local soil properties, offering another avenue for validation through comparison of model outputs with predicted thresholds. Long-term monitoring programs, with continuous data collection at selected sites, help assess seasonal and annual variability, ensuring the robustness of the thresholds over time. Statistical and uncertainty analyses quantify the discrepancies between observed and predicted values, enhancing confidence in the results. Additionally, cross-validation with existing regional or local soil data and collaborative field campaigns with local agencies or research institutions can broaden the scope and reliability of validation efforts. These combined activities will provide comprehensive validation, ensuring that the soil moisture thresholds derived from SoilGrids are accurate and applicable in practical soil and water management contexts.
This study provides national-scale estimates of FC and PWP across Mexico using a RF pedotransfer framework. Several limitations should be noted. First, there are no nationally consistent measured FC and PWP datasets for independent validation, and uncertainty in input covariates, such as SoilGrids-derived SOC, may affect model predictions. Second, the model relies on intrinsic soil properties (bulk density, clay, and sand) and does not account for management or climatic variables, which influence soil water dynamics but do not directly determine hydraulic thresholds. Third, spatially explicit uncertainty mapping was not performed, although overall predictive performance is indicated by RMSE, MAE, and R2 values. Despite these limitations, the RF framework is robust, captures the dominant soil physical controls, and provides stable national-scale predictions. Moreover, the approach is transferable to other regions where similar soil covariates are available, offering a valuable baseline for climate-smart agriculture planning, irrigation scheduling, hydrological modeling, and broader applications in sustainable soil and water management.
5. Conclusions
Despite the inherent limitations imposed by sample size and data availability, RF-based pedotransfer functions proved effective for estimating FC and PWP from SoilGrids covariates. While the achievable precision of such models is bounded by the quality and representativeness of available soil data, the resulting FC and PWP estimates provide consistent upper and lower thresholds of soil moisture storage that are sufficiently robust for practical applications.
In data-scarce contexts such as Mexico, where financial, infrastructural, and human-resource constraints limit large-scale soil sampling and laboratory analyses, optimizing model performance within existing operational constraints represents a pragmatic and feasible strategy. Improving model accuracy enhances user confidence and supports the generation of soil property maps that are suitable for decision-making, even when comprehensive validation datasets are not yet available.
The derived FC and PWP datasets are particularly relevant for interdisciplinary applications, including climate-smart agriculture, land use planning, ecological studies, and water-resource management. These soil moisture thresholds provide critical indicators of plant water availability and stress, supporting irrigation scheduling for large agricultural areas, drought preparedness, and climate-resilient agricultural strategies across irrigated and rainfed systems.
Although the presented results are valuable for current applications, targeted validation through in situ measurements and laboratory analyses remains essential to further strengthen confidence in the estimates. Continued improvements in soil data collection and model calibration will enable progressive refinement of these products, ensuring their long-term relevance for soil and water resource management under changing climatic conditions.
Author Contributions
Conceptualization, V.M.R.-M.; methodology, V.M.R.-M. and J.D.-B.; software, V.M.R.-M.; validation, V.M.R.-M., J.D.-B., T.A.R., C.V.-S. and N.A.L.-H.; formal analysis, V.M.R.-M., J.D.-B. and C.V.-S.; investigation, V.M.R.-M.; resources, V.M.R.-M.; data curation, V.M.R.-M.; writing—original draft preparation, V.M.R.-M., J.D.-B., T.A.R., C.V.-S. and N.A.L.-H.; writing—review and editing, V.M.R.-M.; visualization, V.M.R.-M.; supervision, V.M.R.-M.; project administration, V.M.R.-M.; funding acquisition, V.M.R.-M. All authors have read and agreed to the published version of the manuscript.
Funding
This research was funded by the INSTITUTO NACIONAL DE INVESTIGACIONES FORESTALES, AGRÍCOLAS Y PECUARIAS (INIFAP), grant number SIGI: 10102736648.
Data Availability Statement
Dataset is available upon request.
Acknowledgments
The authors have reviewed and edited the output and take full responsibility for the content of this publication.
Conflicts of Interest
The authors declare no conflicts of interest.
References
- Ringler, C.; Agbonlahor, M.; Barron, J.; Kaleab Baye, K.; Meenakshi, J.V.; Mekonnen, D.K.; Uhlenbrook, S. The role of water in transforming food systems. Glob. Food Secur. 2022, 33, 100639. [Google Scholar] [CrossRef]
- López, F.B.; Barclay, G.F. Chapter 4-Plant anatomy and physiology. In Pharmacognosy: Fundamentals, Applications and Strategies; Academic Press: Cambridge, UK, 2017. [Google Scholar] [CrossRef]
- Phillips, R.P.; Ibáñez, I.; D’Orangeville, L.; Hanson, P.J.; Ryan, M.G.; McDowell, N.G. A belowground perspective on the drought sensitivity of forests: Towards improved understanding and simulation. For. Ecol. Manag. 2016, 380, 309–320. [Google Scholar] [CrossRef]
- Amsili, J.; van Es, H.M.; Schindelbeck, R. Pedotransfer Functions for Field Capacity, Permanent Wilting Point, and Available Water Capacity Based on Random Forest Models for Routine Soil Health Analysis. Commun. Soil Sci. Plant Anal. 2025, 55, 1967–1984. [Google Scholar] [CrossRef]
- Schaap, M.G.; Zhang, Y.; Nemes, A. Pedotransfer functions and their application to soil water dynamics. Encycl. Soils Environ. (Second Ed.) 2023, 4, 642–654. [Google Scholar] [CrossRef]
- Wills, S.; Loecke, T.; Sequeira, C.; Teachman, G.; Grunwald, S.; West, L.T. Overview of the U.S. Rapid Carbon Assessment Project: Sampling Design, Initial Summary and Uncertainty Estimates. In Soil Carbon; Springer International Publishing: Cham, Switzerland, 2014; pp. 95–104. [Google Scholar]
- Fatichi, S.; Or, D.; Walko, R.; Vereecken, H.; Young, M.H.; Ghezzehei, T.A.; Hengl, T.; Kollet, S.; Agam, N.; Avissar, R. Soil structure is an important omission in Earth System Models. Nat. Commun. 2020, 11, 522. [Google Scholar] [CrossRef]
- Van Looy, K.; Bouma, J.; Herbst, M.; Koestel, J.; Minasny, B.; Mishra, U.; Montzka, C.; Nemes, A.; Pachepsky, Y.A.; Padarian, J.; et al. Pedotransfer functions in Earth system science: Challenges and perspectives. Rev. Geophys. 2017, 55, 1199–1256. [Google Scholar] [CrossRef]
- Al Majou, H.; Bruand, A.; Duval, O. The use of in situ volumetric water content at field capacity to improve the prediction of soil water retention properties. Can. J. Soil Sci. 2008, 88, 533–541. [Google Scholar] [CrossRef]
- Cosby, B.J.; Hornberger, G.M.; Clapp, R.B.; Ginn, T.R. A statistical exploration of the relationships of soil moisture characteristics to the physical properties of soils. Water Resour. Res. 1984, 20, 682–690. [Google Scholar] [CrossRef]
- Rawls, W.J.; Pachepsky, Y.A. Soil consistence and structure as predictors of water retention. Soil Sci. Soc. Am. J. 2002, 66, 1115–1126. [Google Scholar] [CrossRef]
- Schaap, M.G.; Leij, F.J.; Van Genuchten, M.T. Rosetta: A computer program for estimating soil hydraulic parameters with hierarchical pedotransfer functions. J. Hydrol. 2001, 251, 163–176. [Google Scholar] [CrossRef]
- Xu, C.; Torres-Rojas, L.; Vergopolan, N.; Chaney, N.W. The benefits of using state-of-the-art digital soil properties maps to improve the modeling of soil moisture in land surface models. Water Resour. Res. 2023, 59, e2022WR032336. [Google Scholar] [CrossRef]
- Siebert, J.; Stendahl, J.; Sørensen, R. Topographical influences on soil properties in boreal forests. Geoderma 2017, 141, 139–148. [Google Scholar] [CrossRef]
- Rodríguez-Moreno, V.M.; López-Hernández, N.A.; Delgado-Balbuena, J.; Casas-Flores, A. Funciones de pedotransferencia para estimar la capacidad de campo y el punto de marchitamiento del suelo. In Proceedings of the 4° Congreso Interamericano de Agua, Suelo, y Agrobiodiversidad, Ciudad de México, México, 11–13 August 2025. [Google Scholar]
- Poggio, L.; De Sousa, L.M.; Batjes, N.H.; Heuvelink, G.B.M.; Kempen, B.; Ribeiro, E.; Rossiter, D. SoilGrids 2.0: Producing soil information for the globe with quantified spatial uncertainty. Soil 2021, 7, 217–240. [Google Scholar] [CrossRef]
- Nguyen, J.M.; Jézéquel, P.; Gillois, P.; Silva, L.; Ben Azzouz, F.; Lambert-Lacroix, S.; Juin, P.; Campone, M.; Gaultier, A.; Moreau-Gaudry, A. Random Forest of Perfect Trees: Concept, Performance, Applications and Perspectives. Bioinformatics 2021, 37, 2165–2174. [Google Scholar] [CrossRef] [PubMed]
- Bernard, S.; Heutte, L.; Adam, S. On the Selection of Decision Trees in Random Forests. In Proceedings of the 2009 International Joint Conference on Neural Networks, Atlanta, GA, USA, 14–19 June 2009. [Google Scholar]
- Saxton, K.E.; Rawls, W.J. Soil water characteristic estimates by texture and organic matter for hydrologic solutions. Soil Sci. Soc. Am. J. 2006, 70, 1569–1578. [Google Scholar] [CrossRef]
- Andabili, S.J.; Rasoulzadeh, A.; Moghadam, J.R.; Pollacco, J.A.P.; Fernández-Gálvez, J. Improved understanding of soil water content at field capacity and estimates from pedotransfer functions. Irrig. Drain. 2025, 74, 516–528. [Google Scholar] [CrossRef]
- Dritsas, E.; Trigka, M. Remote Sensing and Geospatial Analysis in the Big Data Era: A Survey. Remote Sens. 2025, 17, 550. [Google Scholar] [CrossRef]
- Borzì, I. Modeling Groundwater Resources in Data-Scarce Regions for Sustainable Management: Methodologies and Limits. Hydrology 2025, 12, 11. [Google Scholar] [CrossRef]
- Wimalasiri, E.M.; Jahanshiri, E.; Suhairi, T.A.S.T.M.; Udayangani, H.; Mapa, R.B.; Karunaratne, A.S.; Vidhanarachchi, L.P.; Azam-Ali, S.N. Basic Soil Data Requirements for Process-Based Crop Models as a Basis for Crop Diversification. Sustainability 2020, 12, 7781. [Google Scholar] [CrossRef]
- Liu, L.; Ma, X. Prediction of Soil Field Capacity and Permanent Wilting Point Using Accessible Parameters by Machine Learning. AgriEngineering 2024, 6, 2592–2611. [Google Scholar] [CrossRef]
- Zhu, X.; Gu, P.; Wu, G. Pedotransfer functions development for modeling FC and PWP using Vis-NIR spectra combined with PLSR and regression models. Vibratonial Spectrosc. 2024, 135, 103731. [Google Scholar] [CrossRef]
- Bagnall, D.K.; Morgan, C.L.S.; Cope, M.; Bean, G.M.; Cappellazzi, S.; Greub, K.; Honeycutt, C.W.; Norris, C.L.; Rieke, E.; Tracy, P. Carbon-sensitive pedotransfer functions for plant available water. Soil Sci. Soc. Am. J. 2022, 86, 612–629. [Google Scholar] [CrossRef]
- Taylor, S.A.; Ashcroft, G.L. Physical Edaphology: The Physics of Irrigated and Nonirrigated Soils; W.H. Freeman and Company: New York, NY, USA, 1972; p. 301, Used with permission. [Google Scholar]
- Hudson, B.D. Soil organic matter and available water capacity. J. Soil Wat. Con. 1994, 49, 189–194. [Google Scholar] [CrossRef]
- Børgesen, C.D.; Schaap, M.G. Point and parameter pedotransfer functions for water retention predictions for Danish soils. Geoderma 2005, 127, 154–167. [Google Scholar] [CrossRef]
- Sing, N.K.; Sing, S.; Dutta, P.; Sulochna; Harishankar; Yadav, R.S.; Ghosh, S.; Panotra, N.; Thakre, T.B. Role of Conservation Tillage Strategies in Reducing Soil Degradation and Enhancing Water Infiltration. Asian J. Soil Sci. Plant Nutr. 2025, 11, 374–387. [Google Scholar] [CrossRef]
- Banda, V.D.; Dzwairo, R.B.; Singh, S.K.; Kanyerere, T. Hydrological Modelling and Climate Adaptation under Changing Climate: A Review with a Focus in Sub-Saharan Africa. Water 2022, 14, 4031. [Google Scholar] [CrossRef]
Disclaimer/Publisher’s Note: The statements, opinions and data contained in all publications are solely those of the individual author(s) and contributor(s) and not of MDPI and/or the editor(s). MDPI and/or the editor(s) disclaim responsibility for any injury to people or property resulting from any ideas, methods, instructions or products referred to in the content. |
© 2026 by the authors. Licensee MDPI, Basel, Switzerland. This article is an open access article distributed under the terms and conditions of the Creative Commons Attribution (CC BY) license.