Abstract
Snowmelt recharge critically affects water table fluctuations in cold-region unconfined aquifers, where it serves as a primary source of groundwater. This study investigates the temporal and spatial variations in water table responses to snowmelt events in the Oakes Aquifer, North Dakota. Climatic data, including winter snowfall and temperature, were collected from the North Dakota Agricultural Weather Network (NDAWN), as well as the National Weather Service (NWS) and National Oceanic and Atmospheric Administration (NOAA) stations. Observation well data (1991–2023) were analyzed, and Inverse Distance Weighting (IDW) interpolation in ArcGIS Pro 3.6 was used to generate continuous spatial maps of groundwater level rises during spring. Results indicate that snowmelt significantly drives water table fluctuations, with higher snowfall associated with larger rises. Spatial variability in responses reflects differences in soil permeability, and land cover, with high-permeability soils showing more pronounced increases. Temperature strongly influenced the magnitude of snowmelt-induced groundwater rise, with warmer winters generally associated with greater recharge, while colder periods limited infiltration, likely due to frozen soil effects. These findings underscore the role of snowmelt as a key recharge source in cold-region unconfined aquifers, with variations controlled by local hydrogeological and climatic conditions. Understanding these dynamics is critical for groundwater management, particularly under changing climate scenarios. Future studies should focus on long-term monitoring, climate modeling, and cross-regional comparisons to improve predictions of snowmelt-driven recharge.
1. Introduction
The Northern Great Plains (NGP) is a large geographic region in north-central North America characterized by flat to gently rolling landscapes underlain primarily by sandstone and shale, with a semi-arid to subhumid climate [1,2,3]. As the northern portion of the larger Great Plains, the region spans both the United States and Canada. Since the early 1990s, the NGP has undergone extended wet conditions interspersed with occasional droughts, which have increased the likelihood of flooding and water management challenges [1,4,5,6,7,8,9,10]. This prolonged wet period, observed since 2005, is projected to continue in the coming decades [11,12,13]. Concurrently, recent shifts in precipitation patterns have altered water demand across agricultural, industrial, and domestic sectors [14,15,16]. Rising groundwater use, aquifer depletion from over-extraction, and competing water rights present additional stressors [17,18,19], compounded by the uncertainty of climate change impacts on regional hydrology [16,20,21,22,23,24]. Shallow unconfined aquifers in this region, with water tables often within a meter of the surface, are highly sensitive to subtle changes in precipitation and temperature [17,20,25,26]. Despite their importance, the hydrologic response of these aquifers to recent wetting trends remains poorly understood [27,28].
Small aquifers distributed across the NGP provide critical water resources for agricultural and domestic use [29]. In North Dakota, notable examples include the Oakes, Enderlin, Bismarck, West Fargo, Minot, and Elk aquifers [30]. The Oakes Aquifer, the focus of this study, spans approximately 163 square miles near Oakes, North Dakota [31,32]. It supplies irrigation water for more than 13,000 acres and provides municipal water for the City of Oakes, in addition to being influenced by withdrawals from nearby Spiritwood and Middle James aquifers [17]. These systems support sustainable farming in the NGP [14,15,16], but their long-term sustainability remains insufficiently studied [17]. Recent work [33] has advanced understanding of recharge dynamics in the region, yet additional research is needed to guide effective water resource management under changing climatic conditions [34].
In the NGP, snowmelt is the dominant source of aquifer recharge. Melting snow infiltrates into soils and raises water tables, while also contributing to spring and summer streamflow [35,36,37,38,39]. However, interannual variability in snowfall exerts strong hydrologic consequences; years of heavy snowfall often cause spring flooding, delaying planting and damaging infrastructure [5,40,41], whereas years of reduced snowfall limit groundwater recharge, exacerbate drought conditions, and reduce crop yields [5,41,42,43,44,45]. Rainfall can also recharge aquifers, particularly in early spring and fall when evapotranspiration is low and canopy interception is minimal [5,29,46,47,48]. Thus, recharge dynamics in the NGP are strongly governed by seasonal snow and precipitation variability [33].
The interplay between soil, landcover, topography, and climate further influences recharge patterns in the region [26,38,49,50,51,52,53]. Rising temperatures are expected to accelerate permafrost thaw and alter subsurface flow pathways [54], while long-term warming trends in the prairie regions south of North Dakota have led to shorter winters and earlier snowmelt [55,56]. Recharge potential is also soil-dependent, with sandy soils allowing infiltration of up to 58% of precipitation, while clay-rich soils restrict recharge to less than 16% [57,58]. Land use changes, such as agricultural expansion, have altered infiltration, runoff, and recharge across the NGP [36,37,59]. The spatial variability of these controls underscores the need for site-specific studies.
Recharge processes in the NGP are commonly studied using groundwater-level fluctuations [60]. North Dakota contains thousands of monitoring wells, particularly in the Prairie Pothole Region and glaciated plains [61]. Long-term observations maintained by agencies such as the U.S. Geological Survey (USGS), the North Dakota State Water Commission (NDSWC), local districts, and farmers provide decades of water-level records [16,25,29,62]. These data can be used to estimate recharge, assess climate change impacts, and improve hydrologic models and water management plans [63]. Yet, water-level records remain underutilized for studying snowmelt recharge and aquifer response, particularly in the Oakes Aquifer where a dense monitoring network exists.
Despite the recognized importance of snowmelt to recharge in cold-region aquifers, its magnitude and timing remain poorly constrained [28]. A key knowledge gap is how snowmelt-driven recharge influences temporal and spatial groundwater-level fluctuations under changing climatic conditions. This study addresses this gap by examining long-term groundwater records in the Oakes Aquifer, North Dakota. Specifically, the objectives are to (1) analyze 32 years (1991–2023) of spring groundwater-level records to identify controls on fluctuations, (2) investigate spatial patterns of groundwater rise linked to snowmelt, and (3) assess the influence of winter snowfall and temperature on groundwater levels. By addressing these objectives, this work provides new insights into snowmelt recharge processes and their implications for groundwater sustainability in cold-region unconfined aquifers.
2. Methods and Data
2.1. Study Area
A total of 421.9 square kilometers in eastern Dickey and western Sargent counties, North Dakota, as well as a section of far northern South Dakota, are covered by the Oakes Aquifer (Figure 1A–C) [31,32]. The climate of the Oakes Aquifer area is classified as a humid continental climate. Temperatures during the winter season often range from −20 °C to −4 °C, and snowfall is common, with annual totals typically reaching 76 to 102 cm, as reported by Armstrong [48,62]. Temperatures in the spring range from around −1 °C to 18 °C, creating favorable conditions for planting and early crop growth [16,48]. Above the aquifer stands the town of Oakes. The Oakes aquifer is bordered to the south by predominantly lacustrine sediments and to the west by the James River, to which it supplies streamflow when the water table rises over the river’s water level [17]. To the east, it is bounded by Oakes Hills, a glacially overridden feature identified by [32].
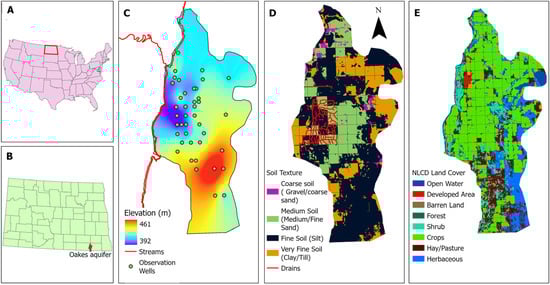
Figure 1.
(A) Key map showing the location of North Dakota state within the U.S. (B) Key map showing the location of the Oakes aquifer within ND counties. (C) The locations of observation wells within the Oakes aquifer showing the topography and the James River. (D) Soil texture atop Oakes aquifer derived from the borehole lithology and the network of drains. (E) The NLCD land cover.
The Oakes Aquifer receives water from ten subbasins, which range in size from 1.6 to 86.7 sq. km. According to the North Dakota Department of Water Resources (NDDWR). In the Oakes region, the Cretaceous Niobrara Formation is the most prominent bedrock [31]. According to [29], the Pierre Formation lies on top of the Niobrara Formation about 13 to 16 km north of Oakes. Shale that is calcareous is found in the Niobrara Formation, while non-calcareous shale is found in the Pierre Formation. There are deposits of gypsum and anhydrite in the Pierre Formation’s base member. Groundwater within the Oakes aquifer flows predominantly from east to west [17]. Water depths vary from 14.8 m below the earth’s surface to accessible just below ground level in a tiny location to the north of the aquifer [17].
According to [16], the Oakes aquifer’s thickness ranges from 0.6 to 56 m. Dickey County’s average thickness is 9 m, while Sargent County’s is 24 m. In the north-central section of the aquifer, a moderately thick sector separates the thin and thick sections. The aquifer in the northern part is hydraulically linked to the Spiritwood Aquifer underneath it, with a leaky confining layer separating the two. Evapotranspiration, pumping, leakage into the Spiritwood aquifer, and groundwater flow to the James River (Figure 1C) are the ways that the Oakes aquifer releases water [29]. The aquifer’s topography is characterized by hilly terrain in the north, flat terrain in the west, and steep slopes along its eastern boundary, where the highest elevations are located. Generally, elevation increases from south to north and from west to east. The elevation varies from 393.1 m near the James River to 461.3 m at the aquifer’s eastern edge (Figure 1C). Except for the hills on the aquifer’s eastern boundary, the region is mostly level with mild slopes. Although the Spiritwood Aquifer frequently receives water from the Oakes Aquifer, the opposite rarely happens unless there is an unusually high-water table [29,64]. The aquifer’s transmittivity is greatest in the deep channel along its eastern flank and in the north, where it overlaps with the Spiritwood Aquifer. According to [62], Dickey County had a maximum transmissivity of 13,800 1280 m2/day with TDS concentrations ranging from 293 to 798 mg/L. Ref. [29] calculated that the greatest transmissivity values in Sargent County was 1900 m2/day. There, he ascribed the rise in transmissivity to a thicker aquifer. The river deposits that make up the deep channel contain finer sediments than most of the aquifer [17]. Figure 1D presents the interpolated soil texture above the Oakes aquifer, based on borehole data. The results indicate that most of the area is dominated by fine soil, with medium sand occurring in the central portion and only limited occurrences of very fine or coarse soils elsewhere. Table 1 shows the study area characteristics. The land cover map of the study area is shown in Figure 1E. Crops make up most of the land cover, while pasture, wetlands, and herbs and grasses make up a large portion of the remaining land use. Sands make up most of the aquifer’s sediments in the northern third, while clays make up the southern two-thirds [17].

Table 1.
Summary of physical and hydrological characteristics of the Oakes Aquifer study area. Includes aquifer type, saturated thickness, depth to water, average annual temperature, and dominant land use types.
2.2. Data Collection and Sources
To assess the impacts of snowmelt recharge on water table fluctuations in a cold-region unconfined aquifer, a structured data collection approach was employed. The dataset integrates both field-based groundwater observations and secondary climate data to analyze the relationship between snowmelt dynamics and groundwater levels. This study focuses on the spring groundwater level rise driven by snowmelt recharge; therefore, seasonal groundwater declines (e.g., due to summer pumping or evapotranspiration) were not considered.
Groundwater data was obtained from the North Dakota Department of Water Resources (NDDWR), which maintains long-term monitoring records for wells across the region. The dataset included site identifiers, collection dates and times, topographic elevations, depth to groundwater, and groundwater elevations. A total of 46 observation wells within the study area were selected for analysis, covering the period (1991–2023). Some years, including 1998, 1999, 2012, and 2023, contained fewer than 20 well records, while the remaining years had more complete datasets. Since this study focuses on groundwater level rise resulting from spring snowmelt, groundwater levels observed in April and May were compared with those observed in November or December to estimate the snowmelt-induced rise.
Climate data were collected from two primary sources: the National Oceanic and Atmospheric Administration (NOAA) and the North Dakota Agricultural Weather Network [63]. NOAA datasets provided long-term standardized weather station records and quality-controlled climate variables, supporting comparative analysis and trend evaluation. NDAWN supplied high-resolution meteorological data, including air temperature, relative humidity, wind speed and direction, solar radiation, and precipitation. climate data were obtained from a single weather station (Oakes station) located within the study area, as no additional spatially distributed precipitation data were available for the analysis. Since the study focuses on snowmelt-induced groundwater rise, snowfall and average winter temperature for each year were analyzed to examine their relationship with the estimated groundwater rise.
Snowfall data (1991–2023) were obtained from the nearest NOAA and NDAWN weather stations to represent annual snow accumulation in the study area. Direct snow water equivalent (SWE) measurements were not available; therefore, snowfall was used as a proxy for estimating the potential magnitude of snowmelt contributing to groundwater recharge. Annual snowfall totals were plotted against the average spring groundwater level rise (April–May) to quantify the relationship between snow accumulation and recharge response.
Winter and spring records were used to construct scatter plots and identify correlations between climate variables and water table fluctuations. The combined dataset provided a continuous record of groundwater levels and meteorological conditions for over three decades, enabling both long-term trend analysis and seasonal assessments of snowmelt-driven recharge. Spatial mapping and scatter plot analyses were applied to characterize groundwater responses across the 46 wells and to evaluate the influence of climate variability on recharge dynamics.
2.3. Data Analysis and Visualization
To examine the relationship between snowmelt recharge and water table fluctuations, two complementary approaches were applied: scatter plots for statistical trend analysis and spatial mapping for geographic pattern identification.
Scatter plots were employed to identify correlations, trends, and anomalies between snowmelt-related variables and groundwater responses. This analysis made it possible to evaluate how the volume of snowmelt influenced the magnitude of fluctuations in the water table. Outliers, representing cases where snowmelt produced unexpected groundwater responses, were also detected through this approach. The scatter plots were based on key variables, including snowfall as a measure of the volume of potential recharge, temperature as an indicator of snowmelt onset and rate, and water table rise as a record of aquifer response over time during the snowmelt season.
Several scatter plots were produced to illustrate different aspects of the relationship between climate drivers and groundwater response. These included plots of the spring rise in groundwater level against average winter temperature, the spring rise in groundwater level against winter precipitation, and the mean spring groundwater level rise plotted across the time series (1991–2023). Together, these visualizations provided insights into both the temporal variability of recharge and the primary climatic drivers that control snowmelt-related aquifer response.
In parallel, spatial analysis was conducted using ArcGIS Pro 3.6 to evaluate how water table fluctuations vary geographically across the study area. Field and secondary datasets were cleaned, organized, and stored in a geodatabase to facilitate geospatial analysis. Groundwater well data were linked to their corresponding geographic coordinates, enabling the visualization of water table changes at 46 monitoring wells. Continuous surface maps of groundwater fluctuations were generated using the Inverse Distance Weighting (IDW) interpolation method. The interpolation was performed with a power parameter of 2, using the 12 nearest neighboring wells within a maximum search radius of 15 km. These parameters were selected after testing several configurations to minimize spatial bias and ensure smooth representation across the aquifer. Model accuracy was evaluated through Root Mean Square Error (RMSE) analysis. The resulting spatial maps revealed clear geographic patterns. Regions of the aquifer where snowmelt recharge was most pronounced were identified, along with areas where aquifer recharge appeared less efficient or where infiltration was hindered by soil or hydrogeological conditions.
Taken together, the scatter plot analysis and the spatial mapping approach offered complementary perspectives, combining statistical evidence with geographic context. This integration provided a more comprehensive interpretation of how snowmelt dynamics influence groundwater levels in cold-region unconfined aquifers. To further understand the factors controlling groundwater rise, the relationship between soil texture and groundwater response was examined. The analysis was based on spatially consistent datasets of average groundwater rise and soil texture classification. Corresponding values from both datasets were compared on a cell-by-cell basis to quantify how variations in soil properties influence the magnitude of groundwater rise. Soil types were classified into four main categories—coarse, medium, fine, and very fine—representing a gradient in permeability and water retention characteristics. The statistical distribution of groundwater rise within each soil category was evaluated to identify potential trends or contrasts among different textures. This analysis provided a quantitative basis for assessing how soil heterogeneity governs infiltration efficiency and storage capacity during snowmelt-driven recharge events.
3. Results
The study area was monitored to evaluate the response of groundwater to snowmelt during the spring thaw. Field and spatial datasets were collected from observation wells and snow monitoring stations to assess water table fluctuations throughout the period (1991–2023). Since this study focuses on groundwater level rise resulting from spring snowmelt, groundwater levels observed in April and May were compared with those observed in November or December to estimate the snowmelt-induced rise. Results show substantial interannual and spatial variations in spring groundwater level rise associated with snowmelt recharge. The magnitude of groundwater rise during the spring period varied across years and observation wells, reflecting local hydrogeologic conditions and climatic variability. The calculated spring groundwater level rise for all observation wells is presented in the Supplementary Figures (Figures S1–S9). This analysis emphasizes the magnitude and interannual variability of groundwater rise rather than the timing of the response to snowmelt infiltration.
Spatial maps of yearly average water notable fluctuations (Figure 2, Figure 3, Figure 4 and Figure 5) reveal pronounced spatial variability in snowmelt recharge across the aquifer. The color gradients on these maps indicate differences in the magnitude of recharge, reflecting the influence of snowpack depth, melt rate, soil permeability, and land cover conditions. The eastern portion of the aquifer, which coincides with a deep subsurface channel and higher hydraulic conductivity, exhibited the highest groundwater level rises, while the central and western portions—characterized by a denser surface drainage network—showed relatively lower rises. Among the analyzed years, 2022 recorded the highest average groundwater level rise, whereas 1998 and 2005 showed the lowest values.
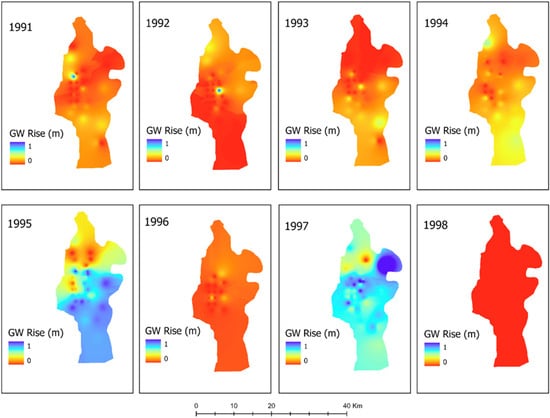
Figure 2.
Spatial maps of groundwater level rise (m) between fall and spring (1991–1998)across the Oakes Aquifer. Color gradient represents the magnitude of seasonal rise [63,65].
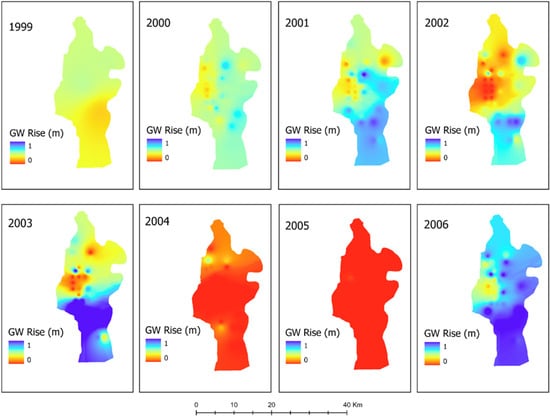
Figure 3.
Spatial maps of groundwater level rise (m) between fall and spring (using inverse distance weighting), (1999–2006) across the Oakes Aquifer. Color gradient represents the magnitude of seasonal rise [63,65].
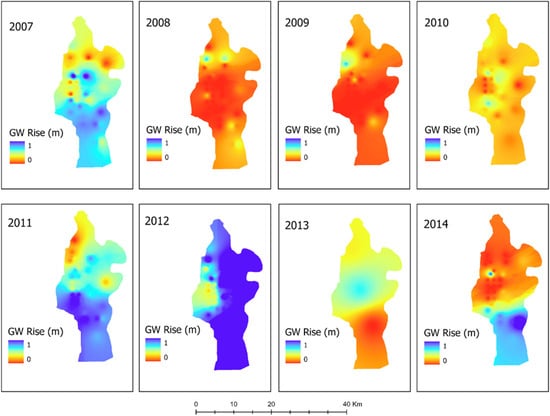
Figure 4.
Spatial maps of groundwater level rise (m) between fall and spring (using inverse distance weighting), (2007–2014) across the Oakes Aquifer. Color gradient represents the magnitude of seasonal rise [63,65].
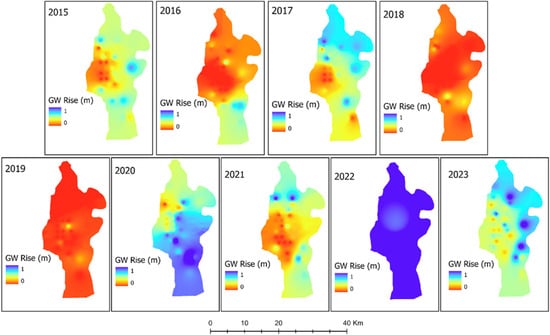
Figure 5.
Spatial maps of groundwater level rise (m) between fall and spring (using inverse distance weighting), (2015–2023) across the Oakes Aquifer. Color gradients represent the magnitude of seasonal rise [63,65].
Observation wells located in low-elevation areas responded quickly to snowmelt events, showing rapid water table rises due to increased infiltration. In contrast, wells in higher-elevation zones exhibited less pronounced increases, suggesting delayed runoff and reduced infiltration efficiency. Areas underlain by low-permeability displayed minimal fluctuations in groundwater levels, indicating restricted snowmelt infiltration. Conversely, regions with coarse-textured soils showed significant water table rises, highlighting the role of subsurface permeability in snowmelt-driven recharge.
Statistical analyses demonstrated a moderate to strong positive correlation between snowfall and groundwater level rise. Years with higher snowfall totals were generally associated with greater water table responses, confirming that snowmelt represents a primary source of recharge to the aquifer system. However, several colder years (e.g., 1997 and 2023) deviated from this trend, likely due to reduced infiltration under frozen soil conditions. These results highlight that while snowfall is a key control on recharge magnitude, frozen ground dynamics can substantially limit snowmelt percolation to the water table.
Temperature records further revealed that the timing and magnitude of water table fluctuations were strongly influenced by spring air temperature patterns. Years with warming experienced high snowmelt onset and corresponding high groundwater responses. Conversely, colder years delayed snowmelt and the subsequent rise in groundwater levels. Warmer conditions accelerated snowmelt rates, resulting in high groundwater level increases, whereas cooler periods slowed both processes.
A scatter plot of mean groundwater level rises across the study period (Figure 6) illustrates these interannual variations, with 2022 showing the highest values and 1998 the lowest. Table S1 summarizes the mean groundwater level rise for each year. A box plot (Figure 6) depicts the distribution of yearly groundwater level rises, where 2022 exhibited the highest median rise, likely due to more intense snowmelt events. Years such as 1997, 2003, and 2022 displayed greater spread, indicating larger spatial variability in recharge across the wells, while years like 1996 and 1999 showed more uniform responses. Figure 7 presents the raster map of the yearly average groundwater level rise in spring (1991–2023) (Produced by the average values in Table S2), highlighting zones of elevated recharge in the eastern deep channel and lower rises across the middle and western regions influenced by the surface drainage network. Table S3 presents the Root Mean Square Error (RMSE) values for the annual IDW (Inverse Distance Weighting) interpolation maps generated in ArcGIS Pro 3.6, representing groundwater level estimations from snowmelt recharge in the Oakes Aquifer unconfined system.
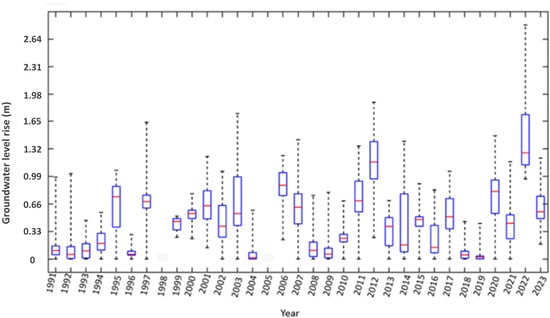
Figure 6.
Box plot showing the spatial variation in groundwater level rise in the Oakes Aquifer (1991–2023). Each box represents the distribution of groundwater level changes at individual monitoring locations across the aquifer. The plot highlights differ.
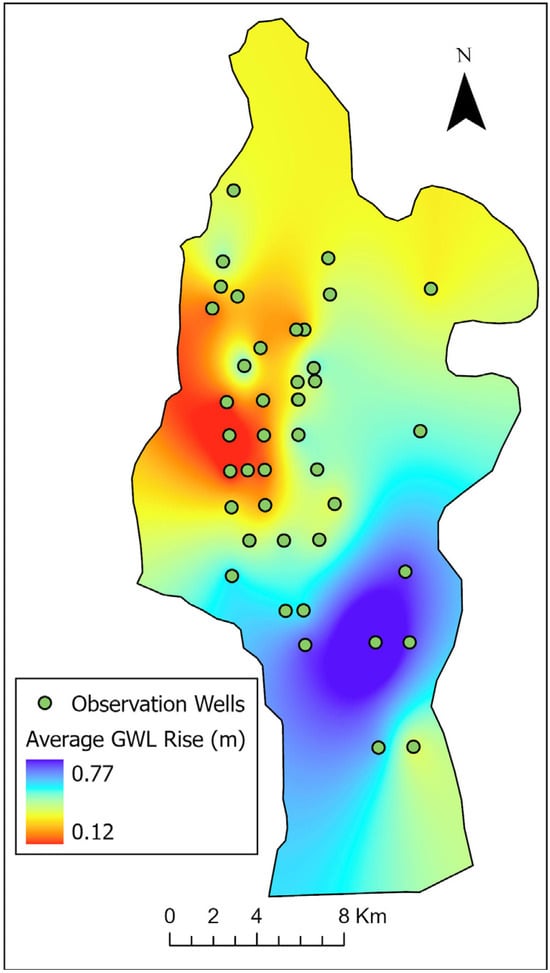
Figure 7.
Raster map showing the average spring groundwater level rise across the study area for the period (1991–2023), derived from observation well data. The yearly averages were computed by averaging spring groundwater rise values at each well and interpolated to create a continuous surface. The map shows that higher rises occur along the deep channel in the eastern part, where high soil conductivity enhances infiltration, while lower rises appear in the central–western area, coinciding with a dense drainage network.
Relationships between groundwater rise and climate variables were further examined using scatter plots. Figure 8 presents the correlation between spring groundwater level rise and winter precipitation (snowfall), revealing a generally positive trend with a few outliers corresponding to colder years, when frozen soils likely limited infiltration. Figure 9 illustrates the relationship between spring groundwater level rise and average winter temperature, indicating that warmer winters typically led to greater recharge efficiency. Together, these plots quantitatively demonstrate that both snowfall and winter temperature jointly control the extent of snowmelt-induced groundwater rise in the Oakes Aquifer.
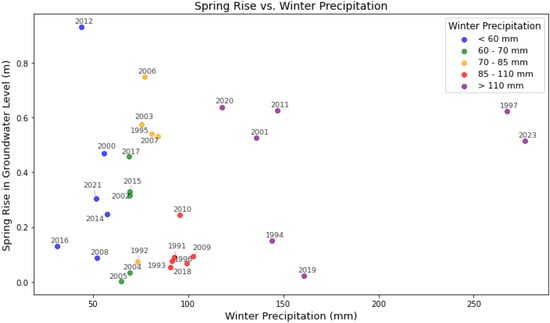
Figure 8.
Spring groundwater level rise (m) versus winter precipitation (mm) in Oakes Aquifer, North Dakota (1991–2023). The plot illustrates a positive correlation, suggesting that higher snowfall generally leads to higher groundwater recharge in the following spring.
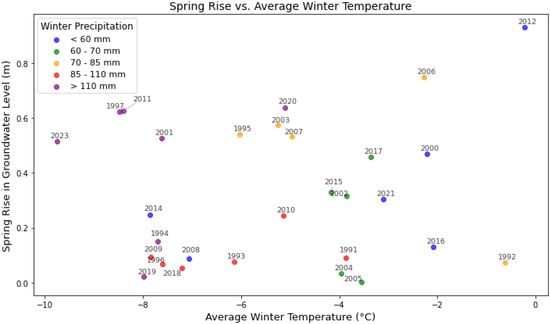
Figure 9.
Spring groundwater level rise (m) versus average winter temperature (°C) of Oakes Aquifer (1991–2023). The plot explores the relationship between winter temperature and subsequent spring recharge, with warmer winters generally associated with higher recharge in groundwater levels.
4. Discussion
4.1. Temporal Variation in Groundwater Level Rise
The temporal variation in groundwater level rise in the Oakes Aquifer during the spring season is primarily influenced by the combined effects of snowmelt and early spring rainfall [29,35,36,37]. Data collected during the study period revealed a consistent and measurable rise in groundwater levels, beginning in late March and continuing into early April, which corresponded with the onset of snowmelt in the region. This seasonal pattern underscores the significance of snowpack accumulation and melting dynamics as a critical driver of groundwater recharge in this northern glacial aquifer system [35,36,37]. Rainfall in early to mid-spring also contributes significantly to groundwater recharge, particularly when it occurs simultaneously or shortly after snowmelt [29]. The combination of rain-on-snow events or saturated ground conditions following snowmelt enhances infiltration efficiency [38,39]. In several observed instances, a sharp increase in groundwater levels followed periods of moderate rainfall in April and May, especially when the ground was already moist from snowmelt [29]. These combined recharge events result in a rapid and short-term spike in groundwater levels that is often the highest annual peak recorded in the aquifer. This highlights the cumulative effect of snowmelt and rainfall on aquifer recharge during the spring.
However, the timing and magnitude of the groundwater level rise varied between years and across different observation wells, suggesting spatial heterogeneity in recharge responses [5,40,41]. Factors such as land cover, soil type, and local topography influenced how quickly and effectively snowmelt and rainfall were able to infiltrate. Areas with well-drained soil and minimal land disturbance exhibited quicker and more significant groundwater responses compared to zones with compacted or clay-rich soils, where infiltration was slower and recharge was delayed [49,66]. This spatial variation highlights the need for site-specific management strategies, particularly in agricultural zones where tillage and land use practices can impact infiltration rates. Groundwater abstraction during spring was relatively low compared to summer months, allowing for a more natural expression of recharge in the aquifer. This made the spring period particularly useful for observing the natural recharge dynamics of the Oakes Aquifer. The relatively unaltered rise in groundwater levels during this time provides a reliable indicator of climatic recharge potential, unmasked by large-scale pumping impacts.
Overall, the study confirms that the spring season is the most critical recharge period for the Oakes Aquifer, largely due to the combined effects of snowmelt and early spring rainfall. During this time, groundwater levels fluctuate significantly in response to these inputs, highlighting the aquifer’s sensitivity to seasonal hydrological changes [16,17]. Understanding the timing, magnitude, and variability of these fluctuations is essential for sustainable groundwater management in the region. As climate change increases the unpredictability of snowpack and precipitation patterns, ongoing monitoring and modeling of spring recharge dynamics will be vital to ensure the long-term stability and resilience of the aquifer system [17,20,25,26].
4.2. Spatial Variation Recharge
One of the primary conclusions from this study is that snowmelt plays a critical role in groundwater recharge in cold regions. The data clearly demonstrates that water table fluctuations are closely linked to the timing and volume of snowmelt. As expected, the water table responded significantly to the snowmelt event, with sharp rises in water table depth observed shortly after the snowmelt reached its peak. This finding aligns with previous research that has highlighted the importance of snowmelt as a primary source of recharge in cold-region aquifers [42,67]. The study also revealed that water table fluctuations exhibited significant spatial variability, with lower-elevation areas experiencing more rapid and pronounced increases in water table depth compared to higher-elevation areas. This finding is consistent with the concept of preferential flow in topographically lower regions, where snowmelt runoff is more likely to accumulate and infiltrate due to gravitational pull and deeper soil profiles [17,68,69,70,71,72,73]. On the other hand, higher elevation areas exhibited more gradual water table rises, which could be attributed to slower snowmelt runoff and potentially deeper or more frozen ground layers, acting as barriers to infiltration. This spatial heterogeneity is an important consideration for groundwater management in cold regions, as different areas within the same aquifer system may exhibit distinctly different recharge behaviors.
A spatial map of the average groundwater rises in all the wells shown in Figure 7 indicates areas that exhibited consistently higher average groundwater rises, while others display lower or more modest increases. These spatial differences can be attributed to a range of hydrological, geological, and land use factors that influence how water moves through the landscape and recharges underground aquifers. Regions with higher average groundwater rise are often associated with favorable recharge conditions, such as permeable soils, minimal surface compaction, and lower slopes that promote water infiltration. areas with lower groundwater rise tend to be influenced by less favorable recharge conditions. This could include clay-rich or compacted soils that inhibit infiltration, or steeper topography that promotes runoff rather than groundwater recharge. From the spatial map of the groundwater rises in all the wells, shown in Figure 7, the highest groundwater rise was 0.78 m, which indicates a higher recharge, and the lowest groundwater rise was 0.11 m, which indicates a lower recharge. From [17] report on the right side, the western part of the aquifer has fine-grained soil (mostly clay), and the central part of the aquifer has coarse-grained soil (sand). Due to the different permeabilities of the soil (sand and clay), the groundwater rise in the central part of the aquifer is higher than in the western part of the aquifer.
The results emphasize the influence of soil permeability and frozen ground depth on the extent of snowmelt infiltration. Areas with high-permeability soils exhibited more efficient recharge, as snowmelt could easily infiltrate and recharge the aquifer. In contrast, regions with low-permeability soil or deep-frozen ground experienced significantly slower infiltration rates, resulting in more limited water table fluctuations. This observation supports the findings of previous studies that have noted the importance of soil texture and frozen ground conditions in governing snowmelt infiltration and groundwater recharge [74,75]. The frozen ground layer is a critical factor in cold regions, where its depth and duration can delay or even completely block infiltration.
Further analysis was conducted to explore the relationship between soil texture and the magnitude of groundwater rise across the aquifer (Figure 10). The results show that all soil types exhibited comparable average groundwater rise values, though with varying degrees of spatial variability. Fine-textured soils displayed a slightly higher mean rise, while coarse and very fine soils exhibited somewhat lower values. This can be attributed to the fact that fine soils facilitate recharge by retaining water longer due to their moderate transmissivity, whereas coarse soils enhance infiltration but do not retain water for long periods, leading to smaller observed rises. Conversely, clay-rich or very fine soils tend to restrict infiltration, resulting in limited groundwater rise. These results reinforce the role of soil texture as a key control on recharge magnitude and confirm that heterogeneity in soil characteristics contributes to the observed spatial variability in snowmelt-driven groundwater response.
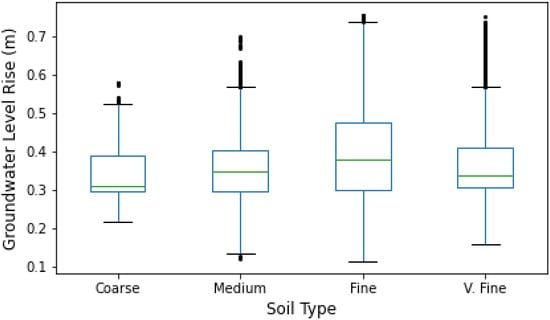
Figure 10.
Boxplot showing the distribution of spring groundwater level rise (meters) across different soil texture classes in the study area. The x-axis represents soil types categorized as Coarse, Medium, Fine, and Very Fine, while the y-axis indicates the magnitude of groundwater rise. Each box displays the interquartile range (IQR) between the 25th and 75th percentiles, with the horizontal line representing the median value. Whiskers extend to 1.5 times the IQR, and outliers beyond this range are shown as individual points. This plot illustrates the variability and central tendency of groundwater response associated with soil permeability, highlighting that fine soils tend to exhibit slightly higher median groundwater rises compared to coarse and very fine soils.
These results suggest that climate change, which is expected to modify snowmelt timing and frozen ground conditions, could have substantial implications for groundwater recharge dynamics in the future. The study also found a strong relationship between temperature and snowmelt timing. Warmer temperatures accelerated snowmelt and caused quicker rises in the water table, while cooler temperatures delayed both the onset of snowmelt and the corresponding groundwater recharge. This relationship highlights the climatic sensitivity of groundwater recharge processes in cold regions and underscores the potential impacts of temperature variability on future water availability. Given that many cold regions are experiencing warmer winters due to climate change, the timing and intensity of snowmelt could shift significantly. As a result, water table fluctuations may become more pronounced or more erratic, with possible consequences for groundwater management, especially in areas that depend on spring snowmelt for aquifer recharge.
The findings from this study contribute to the growing body of knowledge on the hydrological processes in cold regions, particularly in unconfined aquifers. Previous studies have generally focused on confined aquifers or have not addressed the combined effects of snowmelt, soil permeability, and frozen ground depth on water table fluctuations [76]. The results also support the findings of [77,78], who suggested that the timing of snowmelt and the rate of infiltration play crucial roles in determining the magnitude and timing of water table fluctuations. However, this study highlights that spatial heterogeneity, driven by factors such as elevation and soil type, can cause significant differences in how water tables respond to snowmelt in different parts of the aquifer system.
The findings of this study have significant implications for water resource management in cold regions. As snowmelt is a primary source of recharge in these areas, any alterations in snowmelt timing, intensity, or distribution could affect water availability. Delayed snowmelt, caused by colder winters or deeper frozen ground layers, could reduce the amount of water available for recharge in the spring, potentially leading to lower water tables and reduced groundwater storage [79]. Conversely, earlier snowmelt due to warmer temperatures could lead to rapid water table rises and potentially flooding, especially in areas with poor soil drainage or low permeability [80]. Understanding these dynamics will be crucial for designing sustainable water management strategies in cold regions, particularly in agricultural areas and rural communities that rely on groundwater resources.
4.3. Climatic Effects on Groundwater Level Rise
The climatic effects on groundwater level rise in the Oakes Aquifer are evident through the direct influence of temperature and precipitation on recharge processes. Groundwater levels in the aquifer fluctuate seasonally and interannually in response to variations in these two key climatic factors [21,22]. This study observed that both temperature and precipitation play crucial but distinct roles in driving groundwater dynamics, particularly in a cold-temperate climate like that of the Oakes region at North Dakota [54,55]. Precipitation is one of the factors affecting groundwater recharge in the Oakes Aquifer area [29]. Figure 8 shows the spring groundwater level rise (m) versus winter precipitation (mm) in the Oakes Aquifer. Increases in rainfall, particularly during the spring and summer months, contribute to a rise in groundwater levels as surface water infiltrates the soil and percolates downward into the aquifer. The correlation between rainfall events and subsequent groundwater level rise was most noticeable in periods of sustained or heavy precipitation, which provided enough water to exceed soil moisture deficits and reach the water table. The effect was even more pronounced when rainfall followed snowmelt or occurred on already saturated ground, accelerating infiltration and recharge. Long-term records have shown that years with above-average precipitation consistently result in higher seasonal groundwater peaks, reinforcing the critical role of precipitation in aquifer recharge [17].
Temperature also significantly influences groundwater levels, primarily through its impact on snowmelt timing, evapotranspiration rates, and soil moisture retention [56]. Figure 9 shows the spring groundwater level rise (m) versus the average winter temperature (°C) of the Oakes Aquifer. Statistical analyses revealed a significant positive correlation between average winter temperature and the magnitude of spring groundwater rise. Warmer winters were generally associated with greater groundwater recharge, while colder winters appeared to limit recharge efficiency, likely due to frozen soil conditions restricting infiltration. While warmer spring temperatures can increase snowmelt volume and thus groundwater recharge, this study did not directly measure the precise timing of snowmelt events.
However, if temperatures rise too quickly, rapid runoffs can occur before full infiltration, reducing the efficiency of recharge [36,37,59]. Additionally, high summer temperatures increase evapotranspiration, which can reduce the amount of water available to infiltrate into the ground. In dry or warmer-than-average years, increased evaporation from the soil and transpiration by plants result in less effective recharge, even if moderate precipitation occurs. This demonstrates how temperature acts as a moderating factor, sometimes enhancing and at other times limiting the aquifer’s ability to retain water. The interaction between temperature and precipitation also shapes the seasonal and interannual variability of groundwater levels in the Oakes Aquifer. For example, a year with moderate precipitation but unusually high temperatures may experience lower groundwater recharge than a cooler, wetter year. Conversely, cool, wet conditions enhance recharge potential by minimizing evaporative losses and allowing for more efficient infiltration. These complex relationships highlight the need for integrated climate-groundwater models that account for both variables when predicting future water availability in the region. Future studies with higher temporal resolution data are necessary to better quantify snowmelt timing and its direct impact on groundwater dynamics.
Furthermore, the study indicates that climate variability and change are increasingly important in influencing groundwater behavior in the Oakes Aquifer [55]. Trends such as shifting precipitation patterns, reduced snowpack, and rising average temperatures are likely to alter both the timing and quantity of groundwater recharge in the coming decades [35]. A reduced snowpack may limit the early spring recharge period, while more intense but less frequent rainfall could lead to more surface runoff and less infiltration. Understanding these evolving dynamics is essential for managing the aquifer sustainably, particularly for agricultural use and long-term water supply planning.
In summary, both precipitation and temperature are key climatic drivers that shape the timing, magnitude, and variability of groundwater level rise in the Oakes Aquifer. Precipitation serves as one of the primary sources of recharge [29], while temperature influences the amount of water that is effectively stored in the aquifer. The observed fluctuations in groundwater levels reflect the combined effect of these climatic inputs, and their growing variability due to climate change underscores the importance of continuous monitoring and adaptive groundwater management strategies.
5. Conclusions
This study investigated the impacts of snowmelt recharge on water table fluctuations in a cold-region unconfined aquifer, with a focus on the Oakes Aquifer. The results highlight snowmelt as a primary driver of groundwater recharge, producing sharp rises in the water table with significant spatial and temporal variability. The amount and timing of snowmelt were found to directly influence groundwater levels, particularly in unconfined aquifers, where surface inputs have immediate effects.
Water table responses varied across the study area. Low-elevation regions exhibited rapid and pronounced rises due to faster snowmelt runoff and more favorable infiltration, whereas high-elevation areas experienced slower and more gradual increases, likely due to reduced runoff and deeper frozen ground layers. Soil permeability and frozen ground depth were key controls on recharge; high-permeability soils and shallow frozen ground facilitated substantial water table rises, while low-permeability soils and deep-frozen layers limited snowmelt infiltration.
Temperature strongly influenced the timing and rate of snowmelt, affecting water table fluctuations. Warmer conditions led to earlier and faster rises, whereas colder conditions delayed snowmelt and moderated groundwater responses. These findings indicate that climate change could alter the timing and intensity of snowmelt, potentially impacting water availability, recharge efficiency, and flood risk in cold-region aquifers.
The study underscores the importance of incorporating snowmelt dynamics into groundwater management strategies. Considering spatial heterogeneity and potential climate-driven changes in snowmelt timing is essential for sustainable water resource planning. Continued monitoring and integration of climate projections will improve predictions of groundwater recharge and support informed management decisions in snow-dominated regions. Future work should include targeted field investigations, such as soil moisture monitoring and snowpack measurements, to complement long-term observational data and improve understanding of localized recharge processes and their variability under changing climatic conditions.
Supplementary Materials
The following supporting information can be downloaded at: https://www.mdpi.com/article/10.3390/earth6040154/s1.
Author Contributions
H.H.M.: Conceptualization, Methodology, formal analysis, original draft preparation. F.A.A.: Methodology, formal analysis, original draft preparation. T.H.M.: Conceptualization, Methodology, review and editing and supervision. All authors have read and agreed to the published version of the manuscript.
Funding
This research received no external funding.
Data Availability Statement
Data is available upon request.
Acknowledgments
We express our sincere gratitude to the North Dakota Department of Water Resources NDDWR for their generous funding and unwavering support, which has enabled us to undertake and advance our research.
Conflicts of Interest
The authors declare no conflict of interest.
References
- Ballard, T.; Seager, R.; Smerdon, J.E.; Cook, B.I.; Ray, A.J.; Rajagopalan, B.; Kushnir, Y.; Nakamura, J.; Henderson, N. Hydroclimate Variability and Change in the Prairie Pothole Region, the “Duck Factory” of North America. Earth Interact. 2013, 18, 1–28. [Google Scholar] [CrossRef]
- Dinwiddie, G. Plan of Study for the Northern Great Plains Regional Aquifer-System Analysis in Parts of Montana, North Dakota, South Dakota, and Wyoming; Water-Resources Investigations Report; U.S. Geological Survey: Reston, VA, USA, 1979. [Google Scholar]
- Downey, J.S.; Dinwiddie, G.A. The Regional Aquifer System Underlying the Northern Great Plains in Parts of Montana, North Dakota, South Dakota, and Wyoming; Summary; US Government Printing Office: Washington, DC, USA, 1984; p. 26. [Google Scholar]
- Hayashi, M.; van der Kamp, G.; Rosenberry, D.O. Hydrology of Prairie Wetlands: Understanding the Integrated Surface-Water and Groundwater Processes. Wetlands 2016, 36, 237–254. [Google Scholar] [CrossRef]
- Mahmood, T.H.; Pomeroy, J.W.; Wheater, H.S.; Baulch, H.M. Hydrological Responses to Climatic Variability in a Cold Agricultural Region. Hydrol. Process. 2017, 31, 854–870. [Google Scholar] [CrossRef]
- Quiring, S.M.; Kluver, D.B. Relationship between Winter/Spring Snowfall and Summer Precipitation in the Northern Great Plains of North America. J. Hydrometeorol. 2009, 10, 1203–1217. [Google Scholar] [CrossRef]
- Rasouli, K.; Pomeroy, J.W.; Janowicz, J.R.; Carey, S.K.; Williams, T.J. Hydrological Sensitivity of a Northern Mountain Basin to Climate Change. Hydrol. Process. 2014, 28, 4191–4208. [Google Scholar] [CrossRef]
- Todhunter, P.E. A Volumetric Water Budget of Devils Lake (USA): Non-Stationary Precipitation–Runoff Relationships in an Amplifier Terminal Lake. Hydrol. Sci. J. 2018, 63, 1275–1291. [Google Scholar] [CrossRef]
- Walsh, J.; Wuebbles, D.; Hayhoe, K.; Kossin, J.; Kunkel, K.; Stephens, G.; Thorne, P.; Vose, R.; Wehner, M.; Willis, J.; et al. Ch. 2: Our Changing Climate. In Climate Change Impacts in the United States: The Third National Climate Assessment; Melillo, J.M., Richmond, T., Yohe, G.W., Eds.; U.S. Global Change Research Program: Washington, DC, USA, 2014; pp. 19–67. [Google Scholar]
- Rosenberry, D.O.; Winter, T.C. Dynamics of Water-Table Fluctuations in an Upland between Two Prairie-Pothole Wetlands in North Dakota. J. Hydrol. 1997, 191, 266–289. [Google Scholar] [CrossRef]
- Van Hoy, D.F.; Mahmood, T.H.; Todhunter, P.E.; Jeannotte, T.L. Mechanisms of Cold Region Hydrologic Change to Recent Wetting in a Northern Glaciated Landscape. Water Resour. Res. 2020, 56, e2019WR026932. [Google Scholar] [CrossRef]
- Shook, K. The 2005 Flood Events in the Saskatchewan River Basin: Causes, Assessment and Damages. Can. Water Resour. J. Rev. Can. Des Ressour. Hydr. 2016, 41, 94–104. [Google Scholar] [CrossRef]
- Vecchia, A.V. Climate Simulation and Flood Risk Analysis for 2008-40 for Devils Lake, North Dakota; US Geological Survey: Reston, VA, USA, 2008. [Google Scholar]
- Allen, R.G.; Pereira, L.S.; Raes, D.; Smith, M. Crop Evapotranspiration: Guidelines for Computing Crop Water Requirements: FAO Irrigation and Drainage Paper 56; Food and Agriculture Organization of the United Nations: Rome, Italy, 1998. [Google Scholar]
- Walter, I.A.; Allen, R.G.; Elliot, R.; Itenfisu, D.; Brown, P.; Jensen, M.E.; Mecham, B.; Howell, T.A.; Synder, R.; Eching, S.; et al. The ASCE Standardized Reference Evapotranspiration Equation; Environmental and Water Resources Institute of the American Society of Civil Engineers; Standardization of Reference Evapotranspiration Task Committee: Washington, DC, USA, 2002. [Google Scholar]
- Armstrong, C.A. Ground-Water Resources of Ransom and Sargent Counties, North Dakota; North Dakota Geological Survey Bulletin 69, Part III.; North Dakota State Water Commission County Ground Water Studies 31, Part III; North Dakota Geological Survey: Bismarck, ND, USA, 1982. [Google Scholar]
- Cline, R.L. Analysis and Simulation of the Oakes Aquifer: An Assessment of Groundwater Availability; Water Resource Investigation; North Dakota State Water Commission: Bismarck, ND, USA, 2011; p. 174. [Google Scholar]
- Scanlon, B.R.; Faunt, C.C.; Longuevergne, L.; Reedy, R.C.; Alley, W.M.; McGuire, V.L.; McMahon, P.B. Groundwater Depletion and Sustainability of Irrigation in the US High Plains and Central Valley. Proc. Natl. Acad. Sci. USA 2012, 109, 9320–9325. [Google Scholar] [CrossRef]
- Wada, Y.; van Beek, L.P.H.; van Kempen, C.M.; Reckman, J.W.T.M.; Vasak, S.; Bierkens, M.F.P. Global Depletion of Groundwater Resources. Geophys. Res. Lett. 2010, 37, L20402. [Google Scholar] [CrossRef]
- Crosbie, R.S.; Dawes, W.R.; Charles, S.P.; Mpelasoka, F.S.; Aryal, S.; Barron, O.; Summerell, G.K. Differences in Future Recharge Estimates Due to GCMs, Downscaling Methods and Hydrological Models. Geophys. Res. Lett. 2011, 38, 5. [Google Scholar] [CrossRef]
- Holman, I.P.; Tascone, D.; Hess, T.M. A Comparison of Stochastic and Deterministic Downscaling Methods for Modelling Potential Groundwater Recharge under Climate Change in East Anglia, UK: Implications for Groundwater Resource Management. Hydrogeol. J. 2009, 17, 1629–1641. [Google Scholar] [CrossRef]
- Mileham, L.; Taylor, R.; Todd, M.; Tindimugaya, C.; THOMPSON, J. The Impact of Climate Change on Groundwater Recharge and Runoff in a Humid, Equatorial Catchment: Sensitivity of Projections to Rainfall Intensity. Hydrol. Sci. J. 2009, 54, 727–738. [Google Scholar] [CrossRef]
- Gorelick, S.M.; Zheng, C. Global Change and the Groundwater Management Challenge. Water Resour. Res. 2015, 51, 3031–3051. [Google Scholar] [CrossRef]
- Stigter, T.Y.; Miller, J.; Chen, J.; Re, V. Groundwater and Climate Change: Threats and Opportunities. Hydrogeol. J. 2023, 31, 7–10. [Google Scholar] [CrossRef]
- Armstrong, C.A. Ground-Water Resources of Ransom and Sargent Counties, North Dakota; North Dakota Geological Survey Bulletin 69, Part II.; North Dakota State Water Commission County Ground Water Studies 31, Part II; North Dakota Geological Survey: Bismarck, ND, USA, 1979; p. 55. [Google Scholar]
- Crosbie, R.S.; Scanlon, B.R.; Mpelasoka, F.S.; Reedy, R.C.; Gates, J.B.; Zhang, L. Potential Climate Change Effects on Groundwater Recharge in the High Plains Aquifer, USA. Water Resour. Res. 2013, 49, 3936–3951. [Google Scholar] [CrossRef]
- Solomon, S.; Qin, D.; Manning, M.; Marquis, M.; Averyt, K.; Tignor, M.M.B.; Miller, H.L.; Chen, Z. Intergovernmental Panel on Climate Change (IPCC) Climate Change 2007: The Physical Science Basis: Contribution of Working Group I to the Fourth Assessment Report of the Intergovernmental Panel on Climate Change; Cambridge University Press: Cambridge, UK, 2007; p. 185. [Google Scholar]
- Jasechko, S.; Birks, S.J.; Gleeson, T.; Wada, Y.; Fawcett, P.J.; Sharp, Z.D.; McDonnell, J.J.; Welker, J.M. The Pronounced Seasonality of Global Groundwater Recharge. Water Resour. Res. 2014, 50, 8845–8867. [Google Scholar] [CrossRef]
- Armstrong, C.A. Ground-Water Resources of Dickey And La Moure Conties, North Dakota; North Dakota State Water Commission: Bismarck, ND, USA, 1980; p. 67. [Google Scholar]
- North Dakota Department of Water Resources (ND DWR). North Dakota’s Glacial Drift Aquifers 2024; ND Department of Water Resources: Bismarck, ND, USA, 2024; p. 2.
- Bluemle, J.P. Geology of Dickey and LaMoure Counties, North Dakota; North Dakota Geological Survey Bulletin 70, Part I.; North Dakota State Water Commission County Ground Water Studies 28, Part I; North Dakota Geological Survey: Bismarck, ND, USA, 1979; p. 81. [Google Scholar]
- Bluemle, J.P. Geology of Ransom and Sargent Counties, North Dakota; North Dakota Geological Survey Bulletin 69, Part I.; North Dakota State Water Commission County Ground Water Studies 31, Part I; North Dakota Geological Survey: Bismarck, ND, USA, 1979; p. 91. [Google Scholar]
- Mahmoud, H.H.; Mahmood, T.H.; Korom, S.F. Groundwater Recharge Dynamics to Recent Wetting in a Cold Region Aquifer. J. Hydrol. Reg. Stud. 2025, 62, 102902. [Google Scholar] [CrossRef]
- Liess, S.; Twine, T.E.; Snyder, P.K.; Hutchison, W.D.; Konar-Steenberg, G.; Keeler, B.L.; Brauman, K.A. High-Resolution Climate Projections Over Minnesota for the 21st Century. Earth Space Sci. 2022, 9, e2021EA001893. [Google Scholar] [CrossRef]
- Hyman-Rabeler, K.A.; Loheide, S.P., II. Drivers of Variation in Winter and Spring Groundwater Recharge: Impacts of Midwinter Melt Events and Subsequent Freezeback. Water Resour. Res. 2023, 59, e2022WR032733. [Google Scholar] [CrossRef]
- Sharratt, B. Groundwater Recharge during Spring Thaw in the Prairie Pothole Region of North America. IJW 2009, 5, 100. [Google Scholar] [CrossRef]
- Zhang, Z.; Li, Y.; Barlage, M.; Chen, F.; Miguez-Macho, G.; Ireson, A.; Li, Z. Modeling Groundwater Responses to Climate Change in the Prairie Pothole Region. Hydrol. Earth Syst. Sci. 2020, 24, 655–672. [Google Scholar] [CrossRef]
- Dubois, E.; Larocque, M.; Gagné, S.; Braun, M. Climate Change Impacts on Groundwater Recharge in Cold and Humid Climates: Controlling Processes and Thresholds. Climate 2022, 10, 6. [Google Scholar] [CrossRef]
- Evans, S.G.; Ge, S.; Voss, C.I.; Molotch, N.P. The Role of Frozen Soil in Groundwater Discharge Predictions for Warming Alpine Watersheds. Water Resour. Res. 2018, 54, 1599–1615. [Google Scholar] [CrossRef]
- Government of Manitoba. Manitoba 2009 Spring Flood Report; Manitoba Water Stewardship: Winnipeg, MB, Canada, 2009; p. 34.
- Brimelow, J.; Stewart, R.; Hanesiak, J.; Kochtubajda, B.; Szeto, K.; Bonsal, B. Characterization and Assessment of the Devastating Natural Hazards across the Canadian Prairie Provinces from 2009 to 2011. Nat. Hazards 2014, 73, 761–785. [Google Scholar] [CrossRef]
- Armstrong, R.N.; Pomeroy, J.W.; Martz, L.W. Estimating Evaporation in a Prairie Landscape Under Drought Conditions. Can. Water Resour. J. 2010, 35, 173–186. [Google Scholar] [CrossRef]
- Armstrong, R.N.; Pomeroy, J.W.; Martz, L.W. Variability in Evaporation Across the Canadian Prairie Region During Drought and Non-Drought Periods. J. Hydrol. 2015, 521, 183–195. [Google Scholar] [CrossRef]
- Brimelow, J.C.; Hanesiak, J.M.; Raddatz, R.L.; Hayashi, M. Validation of ET Estimates from the Canadian Prairie Agrometeorological Model for Contrasting Vegetation Types and Growing Seasons. Can. Water Resour. J. 2010, 35, 209–230. [Google Scholar] [CrossRef]
- Brimelow, J.C.; Hanesiak, J.M.; Raddatz, R. Validation of Soil Moisture Simulations from the PAMII Model, and an Assessment of Their Sensitivity to Uncertainties in Soil Hydraulic Parameters. Agric. For. Meteorol. 2010, 150, 100–114. [Google Scholar] [CrossRef]
- Jyrkama, M.I.; Sykes, J.F. The Impact of Climate Change on Spatially Varying Groundwater Recharge in the Grand River Watershed (Ontario). J. Hydrol. 2007, 338, 237–250. [Google Scholar] [CrossRef]
- Sutinen, R.; Hänninen, P.; Venäläinen, A. Effect of Mild Winter Events on Soil Water Content beneath Snowpack. Cold Reg. Sci. Technol. 2008, 51, 56–67. [Google Scholar] [CrossRef]
- Shafer, M.; Ojima, D.; Antle, J.M.; Kluck, D.; McPherson, R.A.; Petersen, S.; Scanlon, B.; Sherman, K. Ch. 19: Great Plains. In Climate Change Impacts in the United States: The Third National Climate Assessment; Melillo, J.M., Richmond, T., Yohe, G.W., Eds.; U.S. Global Change Research Program: Washington, DC, USA, 2014; pp. 441–461. [Google Scholar]
- Portmann, F.T.; Döll, P.; Eisner, S.; Flörke, M. Impact of Climate Change on Renewable Groundwater Resources: Assessing the Benefits of Avoided Greenhouse Gas Emissions Using Selected CMIP5 Climate Projections. Environ. Res. Lett. 2013, 8, 024023. [Google Scholar] [CrossRef]
- Döll, P.; Fiedler, K. Global-Scale Modeling of Groundwater Recharge. Hydrol. Earth Syst. Sci. 2008, 12, 863–885. [Google Scholar] [CrossRef]
- Owor, M.; Taylor, R.G.; Tindimugaya, C.; Mwesigwa, D. Rainfall Intensity and Groundwater Recharge: Empirical Evidence from the Upper Nile Basin. Environ. Res. Lett. 2009, 4, 035009. [Google Scholar] [CrossRef]
- Taylor, R.G.; Todd, M.C.; Kongola, L.; Maurice, L.; Nahozya, E.; Sanga, H.; MacDonald, A.M. Evidence of the Dependence of Groundwater Resources on Extreme Rainfall in East Africa. Nat. Clim. Change 2013, 3, 374–378. [Google Scholar] [CrossRef]
- Peng, S.; Xu, X.; Liao, R.; He, B.; Mihara, K.; Kuramochi, K.; Toma, Y.; Hatano, R. Hydro-Climatic Extremes Shift the Hydrologic Sensitivity Regime in a Cold Basin. Sci. Total Environ. 2024, 949, 174744. [Google Scholar] [CrossRef] [PubMed]
- Lemieux, J.-M.; Frampton, A.; Fortier, P. Recent Advances (2018–2023) and Research Opportunities in the Study of Groundwater in Cold Regions. Permafr. Periglac. Process. 2025, 36, 93–109. [Google Scholar] [CrossRef]
- Millett, B.; Johnson, W.C.; Guntenspergen, G. Climate Trends of the North American Prairie Pothole Region 1906–2000. Clim. Change 2009, 93, 243–267. [Google Scholar] [CrossRef]
- Earman, S.; Dettinger, M. Potential Impacts of Climate Change on Groundwater Resources—A Global Review. J. Water Clim. Change 2011, 2, 213–229. [Google Scholar] [CrossRef]
- Hokanson, K.J.; Thompson, C.; Devito, K.; Mendoza, C.A. Hummock-Scale Controls on Groundwater Recharge Rates and the Potential for Developing Local Groundwater Flow Systems in Water-Limited Environments. J. Hydrol. 2021, 603, 126894. [Google Scholar] [CrossRef]
- Naylor, S.; Letsinger, S.L.; Ficklin, D.L.; Ellett, K.M.; Olyphant, G.A. A Hydropedological Approach to Quantifying Groundwater Recharge in Various Glacial Settings of the Mid-Continental USA. Hydrol. Process. 2016, 30, 1594–1608. [Google Scholar] [CrossRef]
- Schilling, K.E.; Jha, M.K.; Zhang, Y.-K.; Gassman, P.W.; Wolter, C.F. Impact of Land Use and Land Cover Change on the Water Balance of a Large Agricultural Watershed: Historical Effects and Future Directions. Water Resour. Res. 2008, 44, 12. [Google Scholar] [CrossRef]
- Veatch, A.C. Fluctuations of the Water Level in Wells, with Special Reference to Long Island, New York; U.S. Geological Survey: Reston, VA, USA, 1906; p. 96. [Google Scholar]
- Paulson, Q.F. Guide to North Dakota’s Ground-Water Resources; U.S. Geological Survey: Reston, VA, USA, 1983; p. 32. [Google Scholar]
- Armstrong, C.A. Ground-Water Resources of Dickey and LaMoure Counties, North Dakota; North Dakota Geological Survey Bulletin 70, Part II.; North Dakota State Water Commission County Ground Water Studies 28, Part II; North Dakota Geological Survey: Bismarck, ND, USA, 1978; p. 67. [Google Scholar]
- North Dakota Agricultural Weather Network (NDAWN). Weather Data 2024; North Dakota State University: Fargo, ND, USA, 2024. [Google Scholar]
- Proce, C.J.; Ritzi, R.W.; Dominic, D.F.; Dai, Z. Modeling Multiscale Heterogeneity and Aquifer Interconnectivity. Groundwater 2004, 42, 658–670. [Google Scholar] [CrossRef] [PubMed]
- National Oceanic and Atmospheric Administration NOAA. National Weather Services 2024; United States Federal Government: Washington, DC, USA, 2024.
- Moeck, C.; Collenteur, R.A.; Berghuijs, W.R.; Luijendijk, E.; Gurdak, J.J. A Global Assessment of Groundwater Recharge Response to Infiltration Variability at Monthly to Decadal Timescales. Water Resour. Res. 2024, 60, e2023WR035828. [Google Scholar] [CrossRef]
- Hayashi, M.; Van Der Kamp, G.; Schmidt, R. Focused Infiltration of Snowmelt Water in Partially Frozen Soil under Small Depressions. J. Hydrol. 2003, 270, 214–229. [Google Scholar] [CrossRef]
- Anderman, E.R.; Hill, M.C. MODFLOW-2000, the U.S. Geological Survey Modular Ground-Water Model—Documentation of the Hydrogeologic-Unit Flow (HUF) Package; U.S. Geological Survey: Reston, VA, USA, 2000; p. 89. [Google Scholar]
- Anderman, E.R.; Kipp, K.L.; Hill, M.C.; Valstar, J.; Neupauer, R.M. MODFLOW-2000, the U.S. Geological Survey Modular Ground-Water Model—Documentation of the Model-Layer Variable-Direction Horizontal Anisotropy (LVDA) Capability of the Hydrogeologic-Unit Flow (HUF) Package; U.S. Geological Survey: Reston, VA, USA, 2002; p. 60. [Google Scholar]
- Anderman, E.R.; Hill, M.C. MODFLOW-2000, the U.S. Geological Survey Modular Ground-Water Model—Three Additions to the Hydrogeologic-Unit Flow (HUF) Package: Alternative Storage for the Uppermost Active Cells, Flows in Hydrogeologic Units, and the Hydraulic-Conductivity Depth-Dependence (KDEP) Capability; U.S. Geological Survey: Reston, VA, USA, 2003; p. 36. [Google Scholar]
- Baier, W.; Boisvert, J.B.; Dyer, J.A. The Versatile Soil Moisture Budget (VB) Reference Manual; Eastern Cereal and Oilseed Research Centre, Agriculture and Agri-Food Canada: Ottawa, ON, Canada, 2000; p. 87. [Google Scholar]
- Dyer, J.A.; Mack, A.R. The Versatile Soil Moisture Budget Version Three; Agriculture Research Branch: Ottawa, ON, Canada, 1984; p. 49. [Google Scholar]
- Prudic, D.E.; Konikow, L.F.; Banta, E.R. A New Streamflow Routing (SFR1) Package to Simulate Stream-Aquifer Interaction with MODFLOW-2000; U.S. Geological Survey: Reston, VA, USA, 2004; p. 95. [Google Scholar]
- Brooks, R.H.; Corey, A.T. Properties of Porous Media Affecting Fluid Flow. J. Irrig. Drain. Div. 1966, 92, 61–88. [Google Scholar] [CrossRef]
- Chaker, A. Numerical Analysis of Simultaneous Heat and Mass Transfer During Infiltration Into Frozen Ground. J. Hydrol. 1997, 200, 345–363. [Google Scholar] [CrossRef]
- Niu, G.-Y.; Yang, Z.-L. Effects of Frozen Soil on Snowmelt Runoff and Soil Water Storage at a Continental Scale. J. Hydrometeorol. 2006, 7, 937–952. [Google Scholar] [CrossRef]
- Huang, W.; Lyu, H.; Zhang, P.; Li, H. Determination of Snowmelt Infiltration Coefficients for Seasonally Frozen Regions Requires Considering the Response of the Groundwater Table to the Freeze–Thaw Process. J. Hydrol. 2024, 631, 130699. [Google Scholar] [CrossRef]
- French, H.; Binley, A. Snowmelt Infiltration: Monitoring Temporal and Spatial Variability Using Time-Lapse Electrical Resistivity. J. Hydrol. 2004, 297, 174–186. [Google Scholar] [CrossRef]
- Zaremehrjardy, M.; Victor, J.; Park, S.; Smerdon, B.; Alessi, D.S.; Faramarzi, M. Assessment of Snowmelt and Groundwater-Surface Water Dynamics in Mountains, Foothills, and Plains Regions in Northern Latitudes. J. Hydrol. 2022, 606, 127449. [Google Scholar] [CrossRef]
- Zaqout, T.; Andradóttir, H.Ó.; Arnalds, Ó. Infiltration Capacity in Urban Areas Undergoing Frequent Snow and Freeze–Thaw Cycles: Implications on Sustainable Urban Drainage Systems. J. Hydrol. 2022, 607, 127495. [Google Scholar] [CrossRef]
Disclaimer/Publisher’s Note: The statements, opinions and data contained in all publications are solely those of the individual author(s) and contributor(s) and not of MDPI and/or the editor(s). MDPI and/or the editor(s) disclaim responsibility for any injury to people or property resulting from any ideas, methods, instructions or products referred to in the content. |
© 2025 by the authors. Licensee MDPI, Basel, Switzerland. This article is an open access article distributed under the terms and conditions of the Creative Commons Attribution (CC BY) license (https://creativecommons.org/licenses/by/4.0/).